1
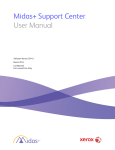
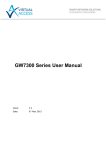
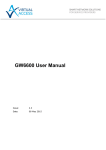
Washington State Hospital Association
User’s Manual
Comments? Questions? Contact Ken Rudberg at
[email protected] or (206) 577-1851
1
The Quality Benchmarking System (QBS) is
a secure web-based application that allows
hospitals to input data and then track,
compare, and analyze the data for use in
quality improvement. QBS is brought to
you at no charge by the Washington State
Hospital Association’s Patient Safety
Program, and its core features include:
Á The ability to upload data and see the data displayed immediately;
Á Data displayed in trend, bar, and control charts, including drill-downs, roll-ups,
and data comparisons with benchmarks;
Á A dashboard of measures providing quick information on which measures are
reaching their targets and if they are improving;
Á The ability to link to resources that can help improve care;
Á The ability to notate comments and action plans directly on the charts; and
Á Exported data printed in reports, displayed in presentations, or analyzed in
statistical software packages.
Hospitals have the ability to share
their data with other hospitals to aid
their quality improvement efforts.
As improvement projects are
implemented, users can focus on
whether these interventions are
truly making a difference. QBS
helps with data display, analysis,
and timely dissemination, and is a
powerful tool for those who work with quality data.
For more information, contact Ken Rudberg at [email protected]
2
Table of Contents
Quick Start Guide - - - - - - - - - - - - - - - - - - - - - - - - - - - - - - - - - - - - - - - - - - 4
The Menu
•
Statit piMD - - - - - - - - - - - - - - - - - - - - - - - - - - - - - - - - - - - - - - - - - - 9
•
Dashboard - - - - - - - - - - - - - - - - - - - - - - - - - - - - - - - - - - - - - - - - - - 9
•
Score Card - - - - - - - - - - - - - - - - - - - - - - - - - - - - - - - - - - - - - - - - - -9
•
Find Indicators- - - - - - - - - - - - - - - - - - - - - - - - - - - - - - - - - - - - - - - 10
•
Indicator Performance by Class- - - - - - - - - - - - - - - - - - - - - - - - - - - 10
•
Indicator Trend Matrix - - - - - - - - - - - - - - - - - - - - - - - - - - - - - - - - - 11
•
My Indicators - - - - - - - - - - - - - - - - - - - - - - - - - - - - - - - - - - - - - - - -11
Publishing - - - - - - - - - - - - - - - - - - - - - - - - - - - - - - - - - - - - - - - - - - - - - - - 12
Administration - - - - - - - - - - - - - - - - - - - - - - - - - - - - - - - - - - - - - - - - - - - - 13
Logging Off - - - - - - - - - - - - - - - - - - - - - - - - - - - - - - - - - - - - - - - - - - - - - - 13
Uploading Data - - - - - - - - - - - - - - - - - - - - - - - - - - - - - - - - - - - - - - - - - - - 14
Viewing Your Data - - - - - - - - - - - - - - - - - - - - - - - - - - - - - - - - - - - - - - - - - 16
Upload Errors - - - - - - - - - - - - - - - - - - - - - - - - - - - - - - - - - - - - - - - - - - - - 18
Technical Requirements - - - - - - - - - - - - - - - - - -- - - - - - - - - - - - - - - - - - - - 20
FAQs- - - - - - - - - - - - - - - - - - - - - - - -- - - - - - - - - - - - - - - - - - - - - - - - - - - - 20
Appendix A: Interpreting Control Charts- - - - - - - - - - - - - - - - - - - - - - - - - - - 23
Vendor Thanks - - - - - - - - - - - - - - - - - - - - - - - - - - - - - - - - - - - - - - - - - - - - 26
3
Quick Start Guide
Welcome to the Quality Benchmarking System (QBS). QBS gives you the ability
to upload your own data and view it right away. This Quick Start Guide will give
you an overview of the application menus and what you need to do to get started.
Getting Started
Before getting started, make sure that your computer meets the requirements
described in Appendix A, and that you have your usename and password
available. These should have been given to you by your hospital’s
OneHealthPort administrator. If you don’t have your login information and don’t
know who your hospital’s administrator is, contact OneHealthPort at 1-800-9734797.
To log on, go to http://www.onehealthport.com/services/WSHA.php. Once there,
click on the “Log In” button.
Once you click the link, you will be prompted to log in using your OneHealthPort
username and password.
After you log on, you will be taken to the Quality Benchmarking System. For
security purposes, please make sure to close all browser windows when done.
4
n Use the Dash Board to get a quick high-level view of your indicator groups and
how many are meeting targets.
o The Score Card displays a list of your
indicators and their current value, status
and when they were last updated.
p
Find Indicators by name, status and
type.
q View Indicator Performance by
n
o
p
Class, such as at the hospital unit level.
r The Indicator Trend Matrix displays
thumbnail versions of all of the overall
indicators on one screen.
s My Indicators can be selectively
t
u
s
q
r
viewed in this customizable display.
t Publishing is used to design and
export charts for printing.
u Upload data using an Excel project file.
When you click on these menu items,
you will be prompted to enter more
information in the blue box below the
menu tree. Choose your options from
the pull-down menus and check boxes,
and then click “Display” to see the
output on the main screen.
The Score Card lists the high-level
indicators that your hospital is
tracking. It is the most direct way
to access the indicator trends and
see an overview of their
performance. The next page takes
a closer look at the Score Card
and some of its features.
5
n
t
q
o
p
r
s
u
n The Indicator Name describes what is being measured and which hospital it is
being measured for.
o The Status Column shows whether or not the measure is reaching its target and
whether it has improved or deteriorated since the last period.
p The Drill-down magnifying glass allows you to see the indicator at the unit level.
q The Current Value displays data for the most recently uploaded time period.
r The Target is a value that can be set for each indicator.
s The SPC Alert, or Statistical Process Control Alert, tells you if the most recent
data point is statistically different from the trend as a whole.
t The Updated Column gives you information on when data was last uploaded to
the system for that indicator.
u The Informational Link can connect you to best practice, research articles and
other documents relating to that particular indicator.
6
To get started using the
application, you must first
upload your data by doing
the following:
n Click on “Upload Data”
and then “Upload Project
Data”.
n
o Select your project
s
p
from the pull-down menu
and click “Display”.
p If you haven’t
r
o
uploaded data to the
system before, you first need to download an Excel project file in which to enter your data.
Make sure to save this Excel file in an easy-to-remember location on your local drive. When
opening this file make sure to “Enable Macros” when the Security Warning is displayed. The
filename should be in the format: Name of Indicator_(Hospital Name).xls and must be
saved as a Microsoft Excel 97-2003 Worksheet. If you have Microsoft Excel 2007, please
see the frequently asked questions section for instructions on how to convert your file.
q Enter your data into the spreadsheet and save the Excel file.
r Enter the name and location of your file, or use the “Browse” button to find it.
s Click on “Upload Excel File Now” to upload your data to QBS.
Once your data has been uploaded, you can view your trend by clicking on the name of the
Indicator (see page 6, #1) or by searching for the Indicator by name in the menu (see page 5,
#3).
Most trends will be displayed as control charts, as above. For more information about control
charts and how to use them, see Appendix A. Clicking on individual data points on the trend
opens the Action Menu.
7
The Action Menu allows you to:
n Drill down to the unit level for that data
point.
o Attach a comment or action plan to
that data point.
p
p Indicate a shift in the data with a new
n
o
process phase.
n
q
To print out your trends, click on the
“Printable Version” link on the top of
your trend window. For more
detailed reports, click on Publishing
(see page 5, #5) and make your
selections on the menu to the left:
o
p
c Choose the view you’d like to
choose indicators from.
d Choose which group of indicators
you would like to report from.
e Pick which indicators you would
like reported.
r
f Choose the style of chart you
would like on the report.
g Pick the number of periods you
would like the report to show along the
x-axis.
After clicking “Display” the selected charts will appear in the window to the right. If you’d like
to export these charts (or the charts from the “Printable Version”) to a Word document, click
on the
symbol at the top of the display.
This Quick Start Guide should help you to navigate and perform basic tasks within the
application. For more detailed information, refer to the information on the following pages.
8
The Menu
The Menu provides access to the different tasks that you can perform in the QBS.
Use the Menu to access the following features:
Statit piMD: This will take the output screen to the default display that is seen when
first logging on to QBS.
Dash Board: The Dashboard displays a summary of all of the indicators available for
display. To view the Dashboard, select a view in the lower left corner and click
“Display”. The view “All Public” will display all indicators marked as public for all
users.
The Dash Board can be used to get a high-level overview of the indicator groups that
an organization is looking at. The indicators are grouped by type, and the Dashboard
shows the status of each indicator group. The red section of the bar shows indicators
that are not meeting targets, yellow shows
indicators that are below the alarm level, and
green shows indicators that are meeting targets. If
there are further breakdowns by group, they can
be accessed using the drilldown arrow on the right
side of the dashboard. To view the Scorecard for
each indicator in the pane below the Dashboard,
click on the square to the right of the indicator
status. Further instructions are listed in the pane
directly below the Dashboard.
The Scorecard: This displays a table of indicators by type. An indicator view is a
collection of indicators that are organized for viewing together. Select this in the lower
left corner, along with the Group (the type of indicator, e.g. hand hygiene) that you
would like displayed. You can also choose whether the indicators are displayed
alphabetically or in order of best to worst performance. For further instructions on how
to display data on the Scorecard, look in the output screen before making your
selection.
The status shows column shows both the current state of each indicator, whether the
indicator has reached the target for the most recent period, with a colored circle. A
green circle means that the indicator has met its target, a yellow circle means that the
9
indicator is between the target and the alarm value and a red circle warns that the
indicator is below the alarm level. Target and alarm settings are optional, and some
indicators may not require them. The colored triangle shows whether or not the
indicator has improved or deteriorated since the last period. A green, upward pointing
triangle indicates an improvement, while a red triangle pointing down represents
deterioration. The desired direction of the indicator
may be set by the indicator administrator. A gray triangle indicates no preferred
direction and simply shows whether the indicator is higher or lower than the previous
period. The Current Value column displays the most recent data that has been
uploaded with the units dependent on the particular indicator. The Target is a
constant value, and may or may not be used for each indicator as mentioned
previously. The SPC alert will show a colored square if that indicator’s most recent
point is statistically different than the other points in the chart. The Updated column
shows how recently the data has been uploaded for that particular indicator. The
small L symbols to the right of the table are links to best practices and additional
quality improvement information.
Find Indicators: Use this tool to view a summary of indicators that meet specific
criteria. This is helpful for finding a particular indicator within a large group of
indicators. The criteria can be selected in the control frame, and can be based on the
indicator Title, Owner, Expert, Target Status, or Validation Status. You can also
choose to view only the indicators with a current SPC Alert. A search using the
keyword “Testing” resulted in the following:
Indicator Performance by Class: Viewing indicators by class gives you a matrix of
the current value of all of your indicators by unit.
This allows you to get a
comparison of all of your units
and measures at once. It is also
color-coded so that you can see
which units are meeting
performance targets and which
are not. Indicator Performance
by Class may not be available to
all users, depending on your
privileges
10
Indicator Trend Matrix: The Indicator Trend Matrix is a series of thumbnail
charts from a particular view and group of indicators.
After making this
selection on the
menu, you select
your view and group
from the pulldown
menus in the lower
left corner of the
screen. After clicking
“Display” your charts
will be shown in the
main window. The
bars above the
thumbnails indicate
their status compared
to their targets.
Larger trend displays
may be viewed by
clicking on the
individual thumbnails.
My Indicators: This option allows you to cofigure the way that data is displayed.
Here you can set what is displayed when you click on the “My Indicators” link in the
menu, as well as what is on your home page when first logging on to QBS. Click
on the “My Indicators” tab to change the indicators you want to track. Click on “My
Home” to change what is displayed on your home page.
To receive email notifications about these indicators, such as when they fall below
their target, click on the “My Subscriptions” tab.
Here you can click on the
indicator, uncheck the “Use
System Default Settings” box,
and then click on the email
notification options you would
like for that indicator.
Note: You must be set up as
an email user within the system
before using thie subscription
feature. This option may or
may not be available to you
depending on your user
account type.
11
Publishing
The Publishing option on the menu allows you to create a report in MS Word for
printing.
n The View allows you select which set of
indicators you want to use for the report.
o Use Group to specify which category of
indicators you want to select from.
p The Indicators are selected from this list.
If
you want to select more than one indicator to
report on, hold down the CTRL key while making
your selection.
o
p
q
q Select the Style of chart you would like to
publish. You can preview the chart style before
exporting the images to Word.
n
r
r The # of Periods selected will be displayed
along the x-axis. If you select more periods than
is available data for, the chart will display all of
the data for that indicator.
After clicking “Display”, the output will be displayed on the main screen to the right.
Once you have decided on the charts you wish to publish to MS Word, click on the
symbol in the upper left corner of the main screen. You will be prompted to
save or open the Word file. Once the charts have been exported to Word, they
can be printed and pasted into PowerPoint presentations or other applications.
You can also export your data by email using the E-Mail button in the upper right
corner of the screen. This allows you to create an email and attach your chart
using either Excel or as a Statit workspace file. A Statit workspace file allows QBS
users to view the charts using their QBS application. Users must have a login and
password to use this feature. Note: E-Mail must be enabled for your user account
in order to use this feature.
Data can also be exported for use in other statistical software packages. The files
may be exported for use with Minitab, SAS, SPSS, and Microsoft Excel. The files
may also be exported as Statit files that can be viewed using the QBS application.
To Export data, click on the Export button in the upper right corner of the screen
and select a file type from the menu that is displayed.
12
Administration
By selecting “Administration” and then “Edit my Information” from the menu, you can
change your name and email address in the system. You can also change your
password using this option.
Logging Off
To log out of the system, either choose the Logoff option at the bottom of the menu, or
click on the Exit button in the upper right corner of the screen. This is the most secure
way to exit the Quality Benchmarking System.
p
13
Uploading Data
The following instructions will explain how to upload data to the Quality
Benchmarking System so that it can be viewed.
1) Log on to the QBS website using your username and password. If you feel you
should have access to the Quality Benchmarking System and you don’t have a
username and password, please contact your hospital’s OneHealthPort quality
administrator. If you are not sure who your OneHealthPort quality administrator is,
go to:
www.wsha.org/page.cfm?ID=0249 for more information.
2) Locate the blue folders along the left side of the screen, and click on the one
labeled “Upload Data”. The folder will expand, and continue by clicking on “Upload
[Your Hospital] Project Data”.
3) In the blue area in the lower left corner, select the project that you wish to
upload data for and click on the “Display” button”.
4) If you do not already have a blank project Excel file saved to your computer,
click on the “Download [Your Project] Project File” button. When asked whether
you want to open or save this file, click on the “save” button and save the file to an
easy-to-remember location.
5) Locate the downloaded Excel file on your computer and open it. It should be
saved in the format: Name of Indicator_(Hospital Name).xls
6) When the following screen pops up:
Select “Enable Macros” to continue.
You are now ready to enter data into the spreadsheet. After data entry is complete,
save the file in an easy-to-remember location.
After preparing the spreadsheet, return to the data upload project data screen. This
time click on “browse” and locate the saved data upload Excel file with the newly
entered hand washing and patient days information. Click on “open” and then click
14
on the “Upload Excel File Now” button. After doing so, the application will either
show you a list of the uploaded information, as well as a list of any previously
entered data that has been overwritten. If you receive an error code, there may be
something wrong with the formatting of the data in the upload spreadsheet. Please
refer to the list of upload errors for help in fixing any errors encountered when
uploading data.
15
Viewing Your Data
Now that you have uploaded your data, you can view
your trends by clicking on the individual indicator
names in the Scorecard. Clicking on one of these
names brings up a new window that shows the
selected trend. The trend chart is at the top of the
new window, and the data table is below the trend
chart. This display is configurable and allows for
flexibility in the way the data is displayed. For more
information on control charts and how to interpret
them, see Appendix B.
n
p
n
The Trend Chart displays your uploaded data.
o The Data Table provides raw numbers that are
displayed in the trend chart above.
o
p
The Scroll Bar allows you to view more
information below.
Use the scroll bar on the right side of the window to
view a bar chart of the units that contribute to the
overall measure, as well as any comments specific to
the indicator. These comments can include things
like the indicator description, the process expert, and
other relevant notes.
s
q
q
The Bar Chart displays unit level drill-down
information that is displayed in the trend chart above.
r
The Comment Section shows additional
information that is relevant to the particular indicator.
These fields are configurable and can use custom
labels.
s View the Trend Chart by Unit to see all of the
r
unit’s information displayed on a single chart. (Note:
This display can be difficult to read when there are
more than five units represented.)
16
Clicking on individual data points in the trend chart brings up more choices:
n
o
n
By selecting Compare Unit Performance, we
are able to see a table that shows the values
for each unit for that particular time period.
o
Selecting Edit Comment / Action Plan allows
the user to enter information about a particular
chart point in a text field. This comment is then
saved to the chart and is accessible to anyone
viewing the trend. The presence of a comment
or action plan is designated by a green “x”
symbol on the chart. The comment itself is
displayed below the trend chart at the bottom
of the screen.
17
Upload Errors
These are errors you might encounter when attempting to upload your
data.
Data file must be called: Hand_Hygiene_(Facility).xls
Please rename the file to meet these requirements and then upload it again.
This error is a result of the file being named incorrectly, or no file being selected before
the upload button is clicked. Make sure to select an upload file with the name in the
format:
Hand_Hygiene_(Facility).xls
with the word Facility replaced with the name of your hospital. This will usually be a
shortened version of your facilities’ name and will be correct when the upload file is first
downloaded for data entry.
Excel file contents does not match Hospital:Facility
This error is caused when a file is uploaded that does not match the expected facility
name. Please make sure that the facility in the filename matches the facility that you
logged in under.
The following rows have at least one empty value:
Month
Unit
Product Type
Mar-07
1 South
Apr-07
1 South
Container Size (ml)
Containers / Product Used
Soft n Sure
1000
0.0
Soft n Sure
1000
0.0
Please Correct and re-upload the file
You cannot enter a zero value for the number of containers or amount of product used.
If a unit does not use a particular product for a particular month, just ignore that product
and leave out that row.
18
If you received this error when entering data, it means that you were trying to type in
data for a type that does not exist in the QBS database. If you are sure that this type is
not listed on the pull down menu, please contact your administrator.
This error occurs when you have only entered part of the data for an individual data
point. For example, if you enter the date, but no other data on that row, this error will
let you know that you need to have data in every column.
19
Technical Requirements
To most effectively use the Quality Benchmarking System on your computer, please
make sure to:
• Use Internet Explorer version 5 or higher
• Enable cookies
• Enable Java
• Enable JavaScript
• Disable any pop-up blockers that may be in use
If you have any questions about these instructions, please contact your IT department.
FAQs
Control Charts
Why are the sigma limits sometimes set at 2 or 2.5 instead of 3?
The Quality Benchmarking System automatically calculates the number of sigmas to
display on control charts. It is decided based on the number of data points plotted on
the chart. From Statit Software:
The T-sigma table, designed by Drs. Bob and Marilyn Hart*, designates the number of sigmas used in control
limit calculations based on the number of points on the chart. This method helps to balance the False Negative
and False Positive errors for different number of points plotted.
Number of periods
2
3-4
5-9
>9
Number of sigmas
1.5
2
2.5
3
* Hart, M.K., & Hart, R.F. (2002). Statistical process control for health care. University of Wisconsin, Oshkosh:
Duxbury.
Is it possible for a data point to fall outside the control limits and still represent
common-cause variation?
Yes. Data points that are the result of a stable process will very infrequently fall
outside the upper and lower control limits. The likelihood that this will happen is
related to the number of sigmas the chart uses. On a typical 3-sigma control chart,
such a data point will fall outside of the control limits 0.3% of the time. This means
that 99.7% of the time, a point outside these limits is the result of special-cause
variation.
20
Technical Issues
Why does it say “Java is not enabled in browser, data tips cannot work for this
graph” when I attempt to click on a data point?
This occurs because Java and JavaScript are required to use some features of QBS.
In order to click on individual data points and see the drilldown, Java needs to be
enabled. To do enable Java in Internet Explorer, see the instructions below. If, for
some reason, you cannot or do not wish to enable Java, you can view the drilldown for
the most recent period by clicking on the “magnifying glass” on the scorecard. Other
features, such as labeling action plans on data points, will not be available.
To enable or disable Java in Internet Explorer 7:
1) From the Tools menu, or the Tools drop-down in the upper right, select Internet
Options.
2) Click the Programs tab.
3) Click Manage Add-ons.
4) Highlight Java Plug-in.
5) Under "Settings", click Disable.
6) Click OK, and then OK again.
To enable or disable JavaScript in Internet Explorer 7:
1) From the Tools menu, or the Tools drop-down in the upper right, choose Internet
Options.
2) Click the Security tab.
3) Click Custom Level.
4) Scroll to the "Scripting" section of the list. Click Disable or Enable.
5) Close and restart your browser.
To enable or disable Java and JavaScript in Internet Explorer 6 or earlier:
1) From the Tools menu, choose Internet Options.
2) Click the Security tab.
21
3) In versions 5 and 6, click Custom Level. In version 4, click Custom and then
Settings.
4) Java: Scroll to the "Java" section. (In version 6, you will find this section under
"Java VM", under "Java permissions".) To disable Java, click Disable Java. To reenable Java, click a different setting, such as High Safety or Medium Safety.
5) JavaScript: Scroll to the "Active scripting" section of the list. (In version 6, this is
under "Scripting".) Click Disable or Enable.
6) Close and restart your browser.
Why does a window pop-up saying “This page contains both secure and
nonsecure items” when clicking on the chart?
The QBS website is secure and the locked padlock icon in the lower right corner of
your browser confirms this. When clicking on a chart, the data is pulled from a
different location which cannot be confirmed as secure by your browser. If you wish to
prevent the pop-up message from displaying, you can change your browser settings:
•
•
•
•
•
•
When you receive the error message, click Yes.
In Internet Explorer, go to Tools, Internet Options
Select the Security tab, make sure that in "Select a zone..." window that “Internet” is
selected
Select “Custom Level” and scroll down to "Display mixed content" in the
“Miscellaneous” section.
Change it from “Prompt” to” Enable”.
Click “OK”, then “Yes”, then “OK” to make the change.
I have Excel 2007. Do I need to do anything differently?
Yes. The application can only read data from files that have been saved in the Excel
97-2003 format. If your files save in an Excel 2007 format (such as .xlsx) you must
first convert them to the 97-2003 format. You can do this by right-clicking the file,
select “Save As” and select “Save as type” to be “Microsoft Office Excel 97-2003
worksheet *.xls”. The file will now be in the correct format and can be uploaded.
Some of our unit names have changed. Some new units have been added. How
do I change this on our data entry sheet?
If you need a change to the data entry sheet, contact Ken Rudberg ([email protected])
and he will make the required changes.
22
Appendix A: Interpreting Control Charts
Control charts, also know as Statistical Process Control charts, are a tool used to study how
a process changes over time. They consist of:
n Data Points representing
measurements taken over time
o A center line calculated from
p
the average of the data points
p An upper control limit
representing the upper threshold
for the stable process
n
o
q
q A lower control limit
representing the lower threshold
for the stable process
In QBS, the control limits are automatically calculated from the variation in the data and the
number of data points used on the chart. Typically, the more data points you have, the
closer together the control limits will be. Typically these are set at 3-sigma, and they
represent the threshold which data points are unlikely to reach if the process is stable. In
the chart above, both of the red points (Aug-08 and Dec-08) fall outside of the control limits.
This means that these points do not reflect the same process as the rest of the data points
displayed on the chart. If the change in the process is negative, we want to find and
eliminate the cause. If the change in the process is desirable, we want to discover the
cause and possibly implement changes to our process that will shift us in that direction.
There are two kinds of variation seen when measuring a process. There is random, or
common cause, variation and nonrandom, or special cause variation.
Common cause variation is the noise within the system, or the normal up-and-down of the
process. If you were to measure the number of patient falls on a unit, they would vary from
month to month. This variation is based on the normal processes within that unit – the
usual number of nurses, how often patients are rounded on, and the type of patients on that
unit. The number of falls on that unit can be reliably predicted, as long as the process
stays stable (e.g. between 0 and 6 falls a month). If the type of patients on that unit
changed, it would mean that the normal number of falls on that unit would likely change
(e.g. more elderly patients might mean the range would change from 0-6 falls a month to 29 falls a month). The control chart identifies which data points are more likely due to
common cause variation (those within the control limits) and those points that are more
likely due to special cause variation (those outside of the control limits).
23
Special-cause variation is due to an unusual occurrence or a change in the process. Note
that special-cause does not mean bad variation, there could be a special-cause that results
in a greatly decreased rate of falls on the unit. It is important to understand that data points
that fall within the control limits (the blue points) are all the result of the same process. This
means that as long as the points are blue they should be treated as if there has been no
change from the baseline. In the previous chart, there is no statistical or practical
difference between the June 2008 and September 2008 data points.
Common Cause Variation: Also known as random variation, it is the change in data attributable to the system or
process being measured (i.e. expected up-and-down in the data).
Special Cause Variation: Also know as nonrandom variation, it is a change in data due to an outside event or
change in the process (i.e. something unexpected or different happened).
When you identify data points that fall outside of the control limits, it is important to try and
determine what has changed with the process. Were staffing levels different that month?
Did nurses receive extra training? Once you discover the cause of the process change,
you can decide how you might want to change that process to improve results.
There are other ways that special-cause variation can be identified. If several data points
in a row are either increasing or decreasing, this can identify nonrandom variation in the
process. If several data points in a row are above or below the center line, this can also
indicate special-cause variation. If either of these criteria are met, the QBS application will
make those data points red. This is another indication that something is unusual or has
changed in the process. If there are many points outside of the control limits, it is likely that
the process being measured is not in statistical control. This could occur if there is no
single process or way of doing things. If there were no normal process for rounding on
patients, for example, it would
be difficult to tell whether
other changes to the process
are helping or hurting. The
more in-control the process is,
the tighter the control limits
will be, and the easier it will
be to identify special-cause
variation. Once the process is
stable (most or all of the data
points are inside the control
limits) it is an ideal time to test
new processes or implement
new quality improvement
initiatives. The start of those
new processes can be
marked on the control charts
so that it is easier to
determine if your intervention
24
made a difference. Once you have made improvements to the process, your data points
may shift in the desired direction.
In the example to the
right, both March and
October show red data
points. This is because
there have been 8 data
points in a row above or
below the center line. In
April, the Pressure Ulcer
Prevalence rate drops
below the center line and
stays there. This may be
due to a pressure ulcer
prevention program that
was put in place that
month. In any case, the
process appears to have
shifted in a downward
direction.
We can indicate this shift
by labeling a process
phase change within the application. By doing so, we are telling the application that we no
longer want to compare the data points that occur after the intervention with the data points
before the intervention. Essentially, we are comparing the process to the new standard so
that we can see if further changes are making a difference. If the chart indicates that a shift
has occurred due to a process change, resulting in one or more red data points, then it
might be a good time to indicate a process phase shift on the chart. You can do this by
clicking on the data point and clicking on “Identify Process Change”.
We can also get some information on
the statistical significance of the change
by clicking on the green dividing line. It
shows us that the process is statistically
improved when compared to the
baseline and that the intervention did
make a difference. We can now
implement a new intervention and track
changes compared to the new baseline
to see if those changes improve the
process.
25
The Washington State Hospital Association Patient Safety Program would like to
thank the following vendors for their support on this project:
All dashboards are not created equal!
Statit is changing the future of
continuous quality improvement (CQI)
measurement and monitoring for
healthcare.
Statit piMD helps nurture a "culture of quality." The value of inherent process improvement
techniques and benefits help create structures and processes to monitor performance,
identify deficiencies and to devise, test and implement solutions. Whether you are a single
hospital, ambulatory care center or a large, integrated delivery system, Statit piMD provides
a simple yet powerful way to access, track, analyze, compare and contrast raw data in ways
that provide insights from which to make objective, sustainable and defensible decisions.
Improving clinical quality, patient experiences and satisfaction while reducing costs
can only come with understanding. Statit doesn't make your quality decisions…we make
your quality decisions better!
Visit us at: www.statit.com
OneHealthPort uses secure portal
technology to support and accelerate the
exchange of business and clinical
information within its trusted community.
OneHealthPort offers healthcare professionals an easy and secure way to access the
provider sites of major local health plans, hospitals and other valuable online service. Rather
than placing time-consuming phone calls or logging into several different web sites,
OneHealthPort users can gain access to information from all participating organizations
using one common security solution. Subscribers register only once and are issued a single
digital ID that provides single sign on across all participating sites. In addition, all parties
within the trusted community enter into a common contractual framework that addresses
HIPAA requirements and other information sharing issues. Finally, OneHealthPort serves as
a single source of training and promotion to get online services adopted and drive usage.
Visit us at: www.OneHealthPort.com
Innovation through Collaboration.
That’s what Inland Northwest Health Services is
all about. We represent an approach to health
care that is unlike any other in the world;
overseeing several collaborative services that
work on behalf of the region’s major competing
hospitals. We develop new solutions through unprecedented partnerships and innovative
technologies – bringing safer, more cost-effective and higher quality care to Spokane, the
Inland Northwest, and potentially the nation.
Visit us at: www.inhs.org
26