1
"Use of Supercomputer for Interactive Travel Demand Modeling Through GIS"
Project Overview
by
Reginald R. Souleyrette, Ph.D., P.E.
Associate Director for Research, Iowa Transportation Center
Assistant Professor of Civil Engineering, Iowa State University
Principal Investigator
ABSTRACT
The first large-scale transportation studies were performed in the 1950s. This
occurrence coincided with the development of the digital computer, which by that time
had progressed such that large amounts of data could be manipulated and analyzed.
Computing has progressed rapidly since, so that today more detailed and
computationally demanding models of large metropolitan areas can be executed on
desktop computers in a few hours.
Transportation problems are spatial and temporal in nature. They are also dataintensive. Geographic information systems (GIS), with their database and geocoding
capabilities, are powerful tools for transportation data manipulation and analysis.
Presently, transportation planning regional modeling efforts are costly and labor
intensive - many projects requiring multi-year programs. Often, the final product is one
or several "snapshots" of future travel patterns in an area. Alternatives analyses
(spatial) are limited due to labor and computing constraints. For similar reasons,
temporal variations in travel demand patterns are rarely accounted for.
This project builds upon previous experiences with supercomputing and GIS. It
investigated procedures for integrating supercomputer and GIS capabilities in
transportation modeling. The researchers working on this project had previously
successfully linked TRANPLAN and a GIS program (ARC/INFO) on computer
workstations. This batch mode linkage was limited, however, to exploiting the data
management and output capabilities of GIS. Further, the time required for a single run
of the travel demand model for a medium to large region (about one hour on a fast
workstation) prohibited the interactive viewing of outputs resulting from changes in
assumptions and data.
Supercomputing presented several opportunities for transportation planning opportunities which went well beyond being able to run models at high rates of speed.
The goal of this project was to demonstrate the usefulness of high speed computing to
transportation planning. The goal was met by developing an interactive system
whereby GIS can be used to change demand model inputs, call for a run of the travel
demand model on a mainframe computer, and display the results. The user interface is
a multi-layer thematic map graphic which improves the user's ability not only to modify
Overview - 1
data and assumptions, but to recognize the implications of changes through overlay of
input and output networks.
This project included compiling source FORTRAN code for selected transportation
planning model modules. The code was provided by one of the Nation's largest
developers of transportation planning software, the Urban Analysis Group of Danville,
California. The program, TRANPLAN, is a regional travel demand model capable of
generating, distributing, and assigning traffic to a highway or transit network.
TRANPLAN is the model chosen by the Nevada and Iowa DOTs (among others) and
their respective Metropolitan Planning Organizations. Using the high-speed processing
capabilities of a mainframe front-end to a Cray YMP-2 supercomputer produced an
executable code with speed capable of supporting interactive analysis.
During a one to two hour interactive session, an analyst may perform several
alternatives analyses, investigating the outcomes (congestion, delay) resulting from
various transportation planning decisions (adding new infrastructure, deploying travel
demand management strategies, modifying land-use assumptions).
PRINCIPAL INVESTIGATOR
Reginald Souleyrette, Assistant Professor of Civil Engineering at Iowa State University,
conducts research on the application of Geographic Information Systems to
Transportation (GIS-T) and transportation planning and modeling. He currently serves
as guest editor for a special issue of the Journal for Advanced Transportation on GIS in
Transportation Planning. Graduate level Civil Engineering courses taught by Dr.
Souleyrette have included Urban Transportation Planning and Network Analysis,
Computer Applications in Transportation Engineering, Applications of Transportation
Planning Models, GIS Applications in Civil Engineering and GIS Applications in
Transportation. Articles by Dr. Souleyrette have appeared in Transportation Research
Record, Transportation Research B, MicroComputers in Civil Engineering, and
Transportation Quarterly, and published Proceedings of the American Society for Civil
Engineers and Institute of Transportation Engineers. He is experienced in the
development of transportation models and impact analyses in a GIS environment and
the establishment of GIS-T lab consisting of: multi-vendor hardware and software, large
volumes of hardcopy and digital data, personnel ranging from undergraduate
engineering students to GIS analysts, and procedures for conducting GIS analyses in
transportation research. Dr. Souleyrette has experience with data conversion between
DEC VAX and UNIX, Sun UNIX, Cray UNIX, IBM DOS, and several magnetic storage
media across various GIS software platforms. A member of several travel demand
modeling users/advisory groups, Formerly Assistant Director of the UNLV
Transportation Research Center, he now serves as the Associate Director for Research
of the Iowa Transportation Center.
Overview - 2
PROJECT DESCRIPTION
Project Missions
To assess the need and viability of high-speed computing with GIS for transportation
planning, research, and other functions.
Establish procedures for integrating high-speed computer and GIS capabilities in
transportation modeling.
To identify, plan, design and implement GIS-based tools to facilitate alternative
selections and policy analysis.
Project Scope
The scope of this project included development of a prototype system of linkages
between a travel demand model (Tranplan) and a geographic information system
(ESRI's ARCINFO and Intergraph's MGE/MGA series) first in a PC environment and
ultimately running on high-speed computers. The data chosen for development of the
system were first a network of manageable size (the sample network provided by the
UAG) and later extended to include larger metropolitan areas such as Las Vegas,
Nevada and Des Moines, Iowa.
Project Objective and Outcome
The objective of this project was to demonstrate the capabilities of travel demand
models in a high-speed, GIS-based environment. Using tools developed in this project,
during a one to two hour interactive session, an analyst may perform several
alternatives analyses, investigating the outcomes (congestion, delay) resulting from
various transportation planning decisions (adding new infrastructure, deploying travel
demand management strategies, modifying land-use assumptions).
The primary product from this project is a prototype system which can be used to
identify and assess transportation impacts in medium to large urban and suburban
regions/areas. Analytical capabilities include spatial overlay of origin-destination
information on socioeconomic and demographic data. The tools developed in this
project enhance the ability to provide for equitable and efficient allocation of resources
(GIS can effectively compute and display derived data on cost per lane mile or
jurisdiction, spatial distribution of benefits, etc.)
Approach and Methodology
The approach taken in this project included two parallel efforts, one involving
compilation and testing of Tranplan on high-speed computers and the other involving
development of GIS to Tranplan linkages. The tasks which facilitated this approach are
outlined below:
Overview - 3
Task 1: Develop/test mainframe-GIS to PC-Tranplan linkages.
Task 2: Partial Compilation of Tranplan on the Cray. Due to difficulties and time
limitations, Tranplan could not be fully compiled on the Cray.
Task 3: Develop/test mainframe-GIS to mainframe-Tranplan linkages.
Task 4: Demonstrate the system.
Task 5: Prepare final report.
Results
The primary deliverable resulting from this project is a working system linking a travel
demand model (Tranplan) and a geographic information system (ARCINFO) in a high
speed computing environment. Although the project investigators did not succeed in
compiling the software on the Cray, the system as developed demonstrates the
usefulness of using high speed computers and GIS for transportation planning. Given
more time and more importantly, computer programming and systems support, a Cray
could be utilized to improve the performance of the system. Moreover, as additional
transportation and air quality models are integrated with GIS, there will be an increased
need for supercomputing application. These and other issues and outcomes are
discussed more fully in three reports resulting from this project. Three products,
described below, are included in this report:
P "Prototype Design of a GIS Tool for Analysis of Transportation Systems Alternatives
using High-Speed Computing" a Senior Design Report written by Dan Croce, UNLV
Civil Engineering Student under my direction. This report include an introduction to a
possible area for application of the system developed in this project, transportation
asset management systems. Following a section on selection of transportation
planning model and geographic information system software, a system design flowchart
is presented. A tool to test supply and demand scenarios is presented which uses
ARC/INFO to prepare files for TRANPLAN. Following a section on data transfer issues,
an example application is described for congestion management. The concluding
section includes a review of economic and environmental considerations. Appendices
are provided for GUI Menu Design and sample computer code (AML and FORTRAN
Programs). This report represents the main product of the grant from Cray Research.
Computer code developed for this project can be obtained from Dr. Shashi Sathisan of
the UNLV Transportation Research Center, although no code was written for the Cray,
specifically.
P"
P Three Applications of GIS for Transportation Planning and Network Modeling", by
Zachary N. Hans, Research Assistant, Iowa Transportation Center GIS-T Lab, and
myself. This paper, which describes three applications of the system on an
Overview - 4
5
Intergraph/PC platform has been submitted for publication in the Journal for Advanced
Transportation. This paper represents work chiefly funded by the Midwest
Transportation Center, with early work supported by Cray.
P "Reflecting Underlying Trends and Traffic Accommodation Strategies in Analyses of
the Regional Impacts of Traffic Growth" by Zachary N. Hans, Research Assistant, Iowa
Transportation Center GIS-T Lab, Iowa State University, William L. Garrison, Professor
Emeritus of Civil Engineering, University of California, Berkeley, Lorne Wazny,
Transportation Planner, Office of Advance Planning, Iowa Department of
Transportation, and myself. This paper, which motivates the need for high-speed
transportation planning/GIS systems, was submitted to the Transportation Research
Board for possible publication in Transportation Research Record and presentation at
the 1995 Annual Meeting of the TRB. This paper represents work chiefly funded by the
Midwest Transportation Center, with early work supported by Cray.
Overview - 5
Prepared for:
CEG 497 Senior Design
University of Nevada, Las Vegas
Prototype Design of a GIS Tool for Analysis of Transportation Systems
Alternatives using High-Speed Computing
May 1994
A Design Project
Submitted by
Daniel R. Croce
And
Directed by
Reginald R. Souleyrette, Ph.D.
Iowa Transportation Center
Iowa State University
Prototype Design - 1
Table of Contents
Project Overview
1. Introduction
1.1 ISTEA management systems
1.2 Supercomputing
2.Methodology
2.1 Selection of the UTMS model
2.2 Selection of the geographic information system
2.3 System design flow chart
3. Test supply and demand scenarios
3.1 Use of ARC/INFO to prepare files for TRANPLAN
3.2 Data transfer
3.3 Example - congestion management
4.Conclusions
4.1 Economic considerations
4.2Environmental considerations
4.3Closure
Appendix A - Menu Design
Appendix B - Sample AML and FORTRAN Programs
References
Prototype Design - 2
Project Overview
The primary goal of this study was to assess the needs and viability of high-speed
computing with GIS for transportation planning, research, and other functions. To
accomplish this task, it was necessary to identify, plan, design and implement a GISbased tool to facilitate alternative selections and policy analysis. In addition,
procedures for integrating high-speed computer and GIS capabilities in transportation
modeling were to be established.
To assist in achieving the primary goal, objectives were established for the design of
the prototype GIS-based tool:
ƒThe prototype would be designed as a skeleton for any one of the six information
management systems (pavements, bridges, safety, congestion, transit, and intermodal)
mandated under the Intermodal Surface Transportation Efficiency Act (ISTEA) of 1991.
ƒThe prototype would utilize currently available software.
ƒThe prototype would have a comprehensive range of capabilities that integrate
transportation network analysis and display.
ƒThe prototype would have flexibility for customization.
ƒThe user interface would be graphical and menu driven.
ƒThe user interface would include online documentation and help.
To meet the objectives of this project, an effective working system of GIS for
transportation was created. The prototype provides researchers and practitioners the
necessary tools to determine the practicality and benefits of such a system as well as
encourage further development of GIS at state DOTs and other transportation planning
organizations.
1. Introduction
During the past three decades, transportation planning agencies have become
reliant on computer modeling to analyze, control and predict traffic patterns in urban
areas. While some of these models provide graphic capabilities, they are mainly
analytical tools to perform tasks such as level of service analyses and volume/capacity
predictions. An increasingly popular method of displaying transportation networks and
storing network data is geographic information systems (GIS). By integrating GIS with a
transportation planning model, this project created an effective working GIS-T system
that will give transportation planners the ability to utilize the powerful graphic capabilities
of a GIS system with a transportation planning model. This interaction between the two
software systems was accomplished by writing a FORTRAN-based linkage which can
Prototype Design - 3
be run within the GIS environment. One problem with creating such an interactive
system was that the speed required to perform several alternative analyses in one
session for a medium to large size urban area was beyond the ability of currently
available planning software platforms. Therefore, it was necessary to test the
feasibility of utilizing the computational power of a high-speed computer for the GIS-T
system. By creating the interactive linkage and utilizing a system sufficiently fast
enough to perform alternatives analyses, it is believed that the GIS-T system developed
in this project could be a skeleton model for the information management systems
required under ISTEA.
1.1 ISTEA management systems
The Intermodal Surface Transportation Efficiency Act of 1991 mandates that each
state DOT implement information management systems for six areas: pavements,
bridges, safety, congestion, transit, and intermodal. In addition, a traffic monitoring
information system is also required. In general, each of these systems should have the
common components of scope definition, development of performance measures,
creation of database, identification and evaluation of strategies, development of
implementation strategies, and feedback/evaluation. Due to the spatial-based nature of
each of these data-intensive systems, GIS is widely recognized as a solution for
satisfying the requirements for each of the management system areas.
Each state's Governor, or designee, will certify each management system annually
beginning January, 1995. Required will be phase-in criteria, status of implementation,
planning and target dates, and finally a report from the USDOT to Congress.
Implementation dates vary by system, but range from January 1993 for part of the
pavement management systems to four years after October 1994 for implementation of
the bridge systems.
Although the model created in this project was based on congestion management, it
can potentially be modified to supplement any one of the six management systems.
For instance, with the storage and speed provided by a high-speed computer,
photographs from bridge inspections could be stored and retrieved by the GIS system
while the maintenance and repair scheduling could be handled by the appropriate
planning model. Using the skeleton created in this project, all six of the information
systems required under ISTEA could have a common user interface. This would
reduce costs by reducing training time of system operators as well as provide uniformity
to all management systems within the department.
Coordinating management system development within any state DOT should reduce
redundancy, foster communication, promote data sharing and cooperation among
divisions, and exploit technology with high potential (such as GIS).
Prototype Design - 4
1.2 Supercomputing
The first large-scale transportation studies were performed in the 1950s. This
occurrence coincided with the development of the digital computer, which by that time
had progressed such that large amounts of data could be manipulated and analyzed.
Computing has progressed rapidly since, so that today more detailed and
computationally demanding models of large metropolitan areas can be executed on
desktop computers in a few hours.
Transportation problems are spatial and temporal in nature. They are also dataintensive. Geographic information systems, with their database and geocoding
capabilities, are powerful tools for transportation data manipulation and analysis.
Presently, transportation planning regional modeling efforts are costly and labor
intensive - many projects requiring multi-year programs. Often, the final product is one
or several "snapshots" of future travel patterns in an area. Alternatives analyses
(spatial) are limited due to labor and computing constraints required for a single run of a
transportation planning model for a medium to large region (about one hour on a fast
personal computer) and prohibit the interactive viewing of outputs resulting from
changes in assumptions and data. For similar reasons, temporal variations in travel
demand patterns are rarely accounted for. Although, the price/performance (processing
speed) ratio of computing is expected to continue to decrease in computers available to
public and private agencies (departments of transportation and public works, planning
and engineering consulting firms). Also, it is understood that the computers used in this
project are currently beyond the computing budget of most transportation planning
agencies. But, as price/performance ratios continue to decrease, the same capabilities
should be available within a few years. Soon, perhaps the next five years, the time
required to run planning models may be eliminated as a constraint to multiple analyses.
However, that is currently not the situation. Time is a constraint to multiple analyses.
Therefore, it was necessary to test the feasibility of utilizing a high speed mainframe
system for a GIS-T system.
2. Methodology
The methodology used in this project included the application of a GIS-based linkage to
a transportation planning model. The Clark County Regional Transportation
Commission provided data for Las Vegas, Nevada to be used as the model
transportation network for the study. This data included socioeconomic and
demographic data from the census bureau for zonal analysis as well as network
attributes and vehicle miles traveled (VMT) for volume/capacity predictions. To provide
the ability for sensitivity analysis, the data was integrated into a GIS system for
graphical display and data storage. As the planner selects various supply (the network)
and demand (regional population growth) scenarios, the data is transferred to the
planning model using a FORTRAN-based linkage and analyzed. The results are
transferred back to the GIS system for graphical display and storage.
Prototype Design - 5
2.1 Selection of the UTMS model
The selection of an urban transportation modeling system (UTMS) was based on two
factors. The technical criteria which had to be met included that the software package
had to support the import and export of ASCII formatted data. However, it was also
important to select the software package based on its popularity among local public
entities. For this reason TRANPLAN was chosen. TRANPLAN is a comprehensive
planning package with forecasting capabilities for highway and transit systems that
operates on several different hardware platforms. It is used by the Nevada Department
of Transportation and other state, county and local transportation planning agencies.
Three different formats of the 7.1 version of TRANPLAN were used: DOS, UNIX,
and UNICOS. Although a format did not exist for UNICOS (the operating system of the
CRAY supercomputer), the Urban Analysis Group supplied the source FORTRAN code
for the PC and UNIX formats of TRANPLAN and allowed modifications to be made for
the development of a UNICOS format.
2.2 Selection of the geographic information system
Since it was decided that the data would be transferred in ASCII format, the
geographic information system was selected based on its ability to easily import and
export data in ASCII format. Of the two predominant GIS systems currently in use
within the industry, ARC/INFO was chosen for the project. The reasons were due
primarily to its flexibility and compatibility with other data formats. In addition, it
provides the ability to produce menu driven applications and can communicate
externally with other programs.
2.3 System design flow chart
Figure 1 displays the approach used in the system design.
3. Test Supply And Demand Scenarios
The purpose of this study was to test the suitability of GIS for transportation planning
by creating a working GIS-T system. Since the transportation planning process
involves many variables, the ability to perform alternatives analysis is essential to
having an effective system for transportation planning. To accomplish this, a
FORTRAN program was written to integrate a geographic information system with a
transportation planning model. Once the linkage was established, the GIS system was
customized with task-based menus (APPENDIX A) to display, store, and analyze
network data, as well as prepare data for transfer to the planning model.
3.1 Use of Arc/Info to prepare files for TRANPLAN
Prototype Design - 6
A link between the GIS and planning model would give a planner the ability to test
various supply and demand scenarios. To accomplish a link and transfer of data from
the GIS to the UTMS, the GIS system must have a means of storing and manipulating
attribute data. However, some planning models, such as TRANPLAN, have specific
attributes which must be defined for each network. For each coverage created in the
Arc/Info GIS, a standard attribute table is generated which contains information to
spatially define each link in the network. This attribute table can then be modified to
incorporate user defined attributes. Because the GIS environment combines both
graphical and data storage capabilities, it can be used to easily define required
TRANPLAN network attributes by pointing to a specific link and assigning a specific
attribute value. For instance the following attributes must be added to the network for
TRANPLAN:
TRANPLAN Recognized Network Attributes
ANODE ... identifies the "from" node of the link
BNODE ... identifies the "to" node of the link
Assignment Group ... flag for links with common capacity restraint
Link Distance ... length of link from ANODE to BNODE
Field Option ... specifies if Field 1 and Field 2 are speed or time values
Field 1 ... numeric value which is either speed or time
Field 2 ... numeric value which is either speed or time
Direction Code ... flag to identify the direction of the link
Link Group 1 ... flag used to group links with common characteristics
Link Group 2 ... flag used to group links with common characteristics
Link Group 3 ... flag used to group links with common characteristics
Capacity ... capacity of the highway link from ANODE to BNODE
Volume ... observed volume of link from ANODE to BNODE
B-A Field Option ... flag for B-A link attributes
It is not necessary to define all of the recognized attributes to transfer network data
to TRANPLAN. For this reason, the menu system designed in this project allows
flexibility for the experienced user to choose only the desired items from the list of
recognized attributes. This can be done using the customized pull-down menu system
created within the ARC/INFO environment. Using this system, a specialized shell,
called ArcTran, was created. It functions as an application within the ARC/INFO
environment. Using ArcTran, an analyst can define and assign network attributes for
TRANPLAN using a simple "point and click" process.
3.2 Data transfer
The transfer of data from the GIS to the UTMS was accomplished by utilizing
ARC/INFO's powerful Arc Macro Language (AML) to extract network data. AML is a
programming language which can be used within the ARC/INFO environment to
automate actions, create commands, provide startup utilities, and create menu-driven
Prototype Design - 7
user interfaces. In addition to the AML, the FORTRAN programming language was
utilized to manipulate the network data extracted by the AML into a format which could
be imported into TRANPLAN. Examples of programs created in both languages for this
project are located in APPENDIX B.
3.3 Example - congestion management
The ability to accurately predict growth within an urban area is essential for planning
future transportation needs. However, urban growth is a function of many variables
such as social, political, and economic opinions. The result is that planners must make
assumptions about future growth in a area or test various scenarios. The prototype
developed in this project was designed for testing scenarios (alternatives testing).
For instance, to test various alternatives of urban growth in the congestion
management system, five different scenarios of VMT growth could be developed:
uniform growth, random growth, growth inversely proportional to delay, and growth
proportional to delay. If the planner assumes a uniform growth in a particular area, the
GIS environment would be used to select and assign a numeric flag to those links within
that region of growth. The data would then be transferred to TRANPLAN for analysis.
In TRANPLAN, the links assigned for uniform growth would be scaled by the
appropriate factor within the origin-destination matrix. In a similar manner, any one of
the growth scenarios could be selected for an urban area within the GIS environment
and analyzed in the planning model. Also, by utilizing a GIS, many different
configurations of growth within an urban area can be tested by combining more than
one type of growth scenario for the area.
The ability to test various alternatives gives analysts and researchers a means of
identifying and assessing transportation impacts in an urban area. Also, alternatives
analyses support development and investment policy decisions as well as enhance the
ability to provide for equitable and efficient allocation of resources
4. Conclusions
Although the prototype was designed as a congestion management system, it could
be easily modified to satisfy any one of the six management systems mandated by
ISTEA. With this interactive system, an analyst can use GIS to change planning model
inputs, call for a run of the model on a high-speed computer, and display the results in
GIS. If the price/performance ratio of computer systems continues to decrease, the use
of high-speed computing for this prototype provides a window through which the future
of desktop transportation planning modeling can be viewed.
4.1 Economic considerations
Prototype Design - 8
The issue of predicting regional/urban area VMT growth is one which has enormous
economic implications for any urban area in the country. The ability to accurately
predict the growth of an urban area as well as the location and type of growth within the
area is minimal at best. The amount of social, political , and economic factors involved
makes predictions a matter of scenarios. The product developed in this project was
designed for scenario testing. The ability to perform alternatives analysis based on
various scenarios was the driving force to the design of the final product.
For regional and urban transportation analysis, this product could be used to
perform alternatives analyses on factors such as congestion, delay, and air quality
based on the various scenarios of VMT growth that may occur within the area. Based
on the results of this testing, policy decisions could be influenced - particularly in the
area of fund allocation for new transportation facilities.
4.2 Environmental considerations
There is a direct relationship between highway congestion and air quality. For
instance, as congestion increases on a highway link, the percentages of CO in the air
above that link increase. Although this prototype was not designed to monitor air
quality, it can be modified to also run with an air quality model. Similar to the
TRANPLAN data exchange, the air quality data could be transferred to the air quality
model and the GIS in ASCII format. Emission data could be analyzed with the air
quality model and displayed graphically with the GIS. This process would give analysts
and researchers the ability to communicate, in one graphical image, the results of their
data collection to policy makers and the public.
4.3 Closure
The primary deliverable of this project is a prototype and working application of a GIS-T
tool. It is expected that during a one to two hour interactive session, an analyst might
perform several alternatives analyses, investigating the outcomes (congestion, delay)
resulting from various transportation planning decisions (adding new infrastructure,
deploying travel demand management strategies, modifying land-use assumptions).
Tools developed as products of this research can be used to identify and assess
transportation impacts in medium to large urban and suburban regions/areas. New
types of analyses include spatial overlay of origin-destination information on
socioeconomic and demographic data. Alternatives analyses support development and
investment policy decisions relating to and benefiting elderly and disabled populations
or predominantly minority or economically disadvantaged areas. Tools developed
enhance the ability to provide for equitable and efficient allocation of resources (GIS
can effectively compute and display derived data on cost per lane mile or jurisdiction,
spatial distribution of benefits, etc.)
Based the results of this project, the use of a supercomputer such as the CRAY is
currently not a practical alternative for transportation planning. First, the price of a
Prototype Design - 9
supercomputer is beyond the computing budget of most transportation planning
agencies. And second, there is currently no version of ARC/INFO (or any other GIS)
available for the CRAY operating system. Therefore, the time saved by the systems
computational speed is diminished by the time required to transfer the data from
another system to the CRAY. But there is evidence (APPENDIX C) that a high-speed
computer, such as a SUN SPARC, would significantly increase the speed of network
analyses for alternatives testing in comparison to a standard desktop computer. In
addition, the PC version of ARC/INFO is slower and less powerful than the UNIX
version and therefore not practical for use as a GIS-T system. However, both
ARC/INFO and TRANPLAN are available in UNIX formats. Based on a
price/performance ratio and the results of this project, a high speed UNIX based system
would provide the required speed, at a moderate cost, to operate a GIS-T system such
as the prototype developed in this project.
Prototype Design - 10
Appendix A
Menu Design
The ArcTran menu bar has six main pull-down menus. Items on the main menu
were chosen to reflect the function of item options. The six main pull-down menus are:
Manager, EDIT Tools, INFO Tools, EXPORT Tools, DISPLAY Tools, and the [HELP]
button. The options accessed under each of the pull-down menus can be used
collectively or independently to create and edit coverage features and descriptive data,
perform feature-oriented editing, display coverages, establish environments to control
editing and snapping, manipulate and analyze coverages, as well as perform the actual
import and export operations. The following is a summary of the main pull-down menu
options:
Summary of ArcTran Menu Options
Manager...
Change Workspace...
move to a new workspace
Manage Coverages...
data manager for querying, copying, renaming and deleting coverages
Manage INFO Tables...
data manager for querying, copying, renaming and deleting INFO files
Quit...
exit Arc/Tran and return to the system prompt
EDIT Tools...
Coverage: New...
create a new coverage and features
Coverage: Open...
open an existing coverage for editing and specify the feature class to be edited
Coverage: Remove...
remove coverages from current edit session without saving
Table: New...
create a new INFO table
Table: Open...
open an existing INFO file for editing
Table: Remove...
remove INFO tables from the current editing session without saving
Save...
save all edits for the current edit object
Save As...
save all edits for the current edit coverage (or INFO file) to a new coverage (or file)
Change Edit Feature...
Prototype Design - 11
select the feature class to edit or create a new feature class
Feature Edit Menu...
redisplay the appropriate edit menu if previously closed
Command Tools...
redisplay the command tools menu if previously closed
Graphic Selection...
graphically select features using the current coordinate input device
Attribute Selection...
select features or INFO records based on criteria specified in a logical expression
INFO Tools...
Add TRANPLAN Items...
a menu driven routine to select items to add to the AAT file
Build Node File...
select the coverage to build; the NAT file is created and X Y coordinates added
Drop Items...
a menu driven routine to drop items from an INFO table
DISPLAY Tools...
Draw...
display features specified in the current draw environment
Clear...
erase the graphic display from the canvas
Draw Environment...
specify which feature classes will be drawn for the edit coverage
Back Environment...
specify a coverage or image that will be displayed in the background
Pan Zoom...
display the tool palette containing pan/zoom tools
Change Symbolset...
select a symbol set for displaying features and text
Current Status...
display the current status of the editing session
EXPORT Tools...
Create Export File...
select the coverage to export; the required INFO files will automatically be
read and the required TRANPLAN items will be placed in the export
file 'network.in'
Display Export File...
view the export file 'network.in'
Connect to Cray...
this option will initiate a login to the CRAY supercomputer and an ftp
Prototype Design - 12
back to the UNIX; the file 'network.in' will have to be retrieved manually
before TRANPLAN can be run
HELP
Prototype Design - 13
APPENDIX B
Sample AML and FORTRAN programs
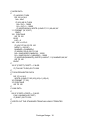
tpt.aml
/* this program transfers the output from TRANPLAN
/* to an ARC/INFO coverage
&s infile [response 'Please input the datafile name']
&if [exists hwy.dat] &then &sys rm hwy.dat
&sys cp %infile% hwy.dat
&sys tplink2
&sys tparc
&s covnam [response 'Please enter the coverage name' ]
&if [exists %covnam% -coverage] &then kill %covnam%
generate %covnam%
input tparc.dat
lines
quit
ap
disp 9999
mape %covnam%
linecolor 2
arcs %covnam%
&pause
quit
clear
build %covnam% lines
renode %covnam%
&return
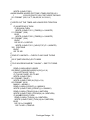
tpexport.aml
/* this aml creates an INFO program that formats the arc info items into
/* a readable tranplan format
&s covnam = [response 'Enter Coverage Name ']
&data ARC INFO
ARC
ERASE LINKS.NEW.PG
Y
PROGRAM LINKS.NEW.PG
SELECT %covnam%.AAT
OUTPUT LINKS.IN
Prototype Design - 14
CALCULATE $COMMA-SWITCH = -1
DISPLAY ANODE,BNODE,DIST,FOPT,FIELD1,FIELD2,DIRECT,9X,CAP,VOL PRINT
RUN LINKS.NEW.PG
ERASE TPNODES.PG
Y
PROGRAM TPNODES.PG
SELECT %covnam%.NAT
ALTER
X-COORD,,4,,,,,,,
ALTER
Y-COORD,,4,,,,,,,
OUTPUT NODES.IN
CALCULATE $COMMA-SWITCH = -1
DISPLAY 0X,'N',0X,NODE,2X,X-COORD,2X,Y-COORD PRINT
RUN TPNODES.PG
Q STOP
&END
arcout.f
PROGRAM LODUNP
IMPLICIT INTEGER*2 (A-Z)
C
C PROGRAM TO CONVERT TRANPLAN NETWORK FILES TO ASCII RECORDS
FOR
C
TRANSFERRING TO ANOTHER COMPUTER
C
INCLUDE '/trc/unlv/coe/legtrcf/crocef/u/includes/paramter.inc'
INCLUDE '/trc/unlv/coe/legtrcf/crocef/u/includes/tpcom.inc'
INCLUDE '/trc/unlv/coe/legtrcf/crocef/u/includes/ulnkcom.inc'
COMMON /A/ ITSAVE(MXSAVT)
INTEGER*4 ITSAVE
COMMON /B/ LPOINT(MXNODE)
INTEGER*2 LPOINT
INTEGER*4 TVOL(MXSAVT)
EQUIVALENCE (ITSAVE,TVOL)
INTEGER*4 N,IO(500),LUNIN,LUNOUT,NX,NY,NODXY,MASK20,I4
EQUIVALENCE (LUNIN,LUN)
LOGICAL*4 EXISTS
LOGICAL*2 NODCHK(MXNODE),FIRST,FIRSTT,FIRSTL
CHARACTER*32 FILNAM
Prototype Design - 15
CHARACTER*4 TAG
CHARACTER*1 YESNO
C
DATA FIRST/.TRUE./,FIRSTT/.TRUE./,FIRSTL/.TRUE./,NA/0/
C
MASK20 = ISHFT(1,20)-1
NUMBPR = 0
C
C OPEN ALL INPUT AND OUTPUT FILES
C
10 WRITE (*,11)
11 FORMAT (' Enter input file name>',$)
READ (*,13) FILNAM
13 FORMAT (A)
INQUIRE(FILE=FILNAM,EXIST=EXISTS)
IF (EXISTS) THEN
LUNIN = 11
OPEN(UNIT=LUNIN,FILE=FILNAM,STATUS='OLD',FORM='UNFORMATTED')
ELSE
WRITE (*,15)
15 FORMAT (' Input file does not exist -- Respecify? (Y/N)>',$)
READ (*,13) YESNO
IF (YESNO.EQ.'N'.OR.YESNO.EQ.'n') GO TO 9000
GO TO 10
ENDIF
WRITE (*,19)
19 FORMAT (' Enter output file name>',$)
READ (*,13) FILNAM
LUNOUT = 12
OPEN(UNIT=LUNOUT,FILE=FILNAM,STATUS='NEW',FORM='FORMATTED')
C
C READ IN HEADER RECORD INFORMATION AND WRITE OUT
C
READ (LUNIN,ERR=8900,END=8900) HEAD1,HEAD2
IF (FNAME(1).NE.'TRANPLAN') GO TO 8900
IF (EQUILM) THEN
NUMBPR = NUMITR
ELSE
IF (LODPCT(2).EQ.100) NUMBPR = NUMITR
ENDIF
C
WRITE (LUNOUT,23) HEAD1
C 23 FORMAT (10A8)
C***********************************************************************
C TRANPLAN HEAD2 VARIABLES
C***********************************************************************
C INTEGER*2 HEAD2,MAXZON,NUMPUR,NERR,MAXNEX,MAXNI,NLINK,
Prototype Design - 16
C 1
LTPEN,LINKGP(3),SCNLIN,ASSGRP,NODATA,NUMPRO,
C 2
TABLES,LODPCT(10),NUMITR,LODPUR,NMSELK,NMWEAV,
C 3
MOD30T(2),MAXLIN,MAXVEH
C INTEGER*4 CAPAC,VOLUME,MINX,MAXX,MINY,MAXY,NMTURN
C LOGICAL*2 TESSUM,WSA,LCOST,LUSER,LARGXY,FDOT,EQUILM,LARGND
C***********************************************************************
C
WRITE (LUNOUT,25) MAXZON,NUMPUR,NERR,MAXNEX,MAXNI,NLINK,
C 1
LTPEN,LINKGP,SCNLIN,ASSGRP,NODATA,NUMPRO,
C 2
TABLES,LODPCT,NUMITR,LODPUR,NMSELK,NMWEAV,
C 3
MOD30T,MAXLIN,MAXVEH
C 25 FORMAT (10I8)
C
WRITE (LUNOUT,27) CAPAC,VOLUME,MINX,MAXX,MINY,MAXY,NMTURN
C 27 FORMAT (7I11)
C
WRITE (LUNOUT,29)
TESSUM,WSA,LCOST,LUSER,LARGXY,FDOT,EQUILM,LARGND
C
C
C CHECK IF SHOULD DELETE EXCESSIVE NODE COORDINATES
C
WRITE (*,31)
31 FORMAT (' Delete excessive node coordinates (Y/N)>',$)
READ (*,13) YESNO
IF (YESNO.EQ.'N'.OR.YESNO.EQ.'n') THEN
DO 30 I=1,MAXNI
NODCHK(I) = .TRUE.
30 CONTINUE
ELSE
DO 40 I=1,MAXNI
NODCHK(I) = .FALSE.
40 CONTINUE
50 CALL UNLINK(N,IO,FIRST)
IF (ENDF) GO TO 90
NODCHK(ANODE) = .TRUE.
NODCHK(BNODE) = .TRUE.
GO TO 50
90 REWIND LUNIN
READ (LUNIN)
FIRST = .TRUE.
ENDIF
C
C READ LOOP FOR *LODHIST*
C
100 READ (LUNIN,END=500) N,(IO(I),I=1,N)
CALL GETTAG(IO,TAG,4)
IF (TAG.NE.'NODE') GO TO 150
C
Prototype Design - 17
C NODE DATA
C
IF (LARGXY) THEN
DO 120 I=2,N,2
NA = NA+1
IF (IO(I).NE.0) THEN
NX = IO(I) - 10000
NY = IO(I+1) - 10000
IF (NODCHK(NA)) WRITE (LUNOUT,111) NA,NX,NY
111 FORMAT ('N',I5,2I11)
ENDIF
120 CONTINUE
GO TO 100
ELSE
LOC = 0
140 LOC = LOC+2
IF (LOC.GT.N) GO TO 100
NODXY = IO(LOC)
NUMNOD = NUMNOD+1
IF (NODXY.EQ.0) GO TO 140
NX = IAND(NODXY,MASK20) - 10000
NY = IAND(IO(LOC+1),MASK20) - 10000
IF (NODCHK(NUMNOD)) WRITE (LUNOUT,111) NUMNOD,NX,NY
GO TO 140
ENDIF
C
150 IF (FIRSTT) FIRSTT = .FALSE.
IF (TAG.NE.'TURN') GO TO 200
C
C TURN PROHIBITOR DATA
C
DO 170 I=2,N,3
WRITE (LUNOUT,163) IO(I),IO(I+1),IO(I+2)
163 FORMAT ('T',3I5)
170 CONTINUE
GO TO 100
C
C LINK DATA
C
200 IF (FIRSTL) FIRSTL = .FALSE.
CALL UNLINK(N,IO,FIRST)
IF (ENDF) GO TO 500
C
C WRITE OUT THE STANDARD TRANPLAN LINK ATTRIBUTES
C
Prototype Design - 18
WRITE (LUNOUT,201)
ANODE,BNODE,ASGRP,DIST,TIME1,TIME2,DIRCOD,LG1,
1
LG2,LG3,CAPCY,VOL,COST,USER,TWOWAY
201 FORMAT (2I5,I1,I4,'T',2I4,4I2,2I6,1H1,2I4,L1)
C
C WRITE OUT THE TIMES AND LOADS PER ITERATION
C
IF (NUMITR.NE.0) THEN
IF (EQUILM) THEN
WRITE (LUNOUT,211) (TIMES(I),I=1,NUMITR)
211 FORMAT (10I8)
ELSE
WRITE (LUNOUT,221) (TIMES(I),I=1,NUMITR)
221 FORMAT (10I4)
ENDIF
DO 300 IP=1,LODPUR
WRITE (LUNOUT,211) (VOLS(IT,IP),IT=1,NUMITR)
300 CONTINUE
ENDIF
GO TO 200
C
C END OF LINK DATA -- CHECK IF ANY SAVE TURNS
C
500 IF (NMTURN.EQ.0) GO TO 8000
C
C FILE WAS REWOUND BY "UNLINK" -- SKIP TO TURNS
C
READ (LUNIN) HEAD1,HEAD2
600 READ (LUNIN,END=8000) N,(IO(I),I=1,N)
CALL GETTAG(IO,TAG,4)
IF (TAG.NE.'SAVE') GO TO 600
WRITE (LUNOUT,601)
601 FORMAT ('SAVE')
WRITE (LUNOUT,603) N,(IO(I),I=1,N)
603 FORMAT (8I10)
MAXNI1 = MAXNI+1
READ (LUNIN) (LPOINT(I),I=1,MAXNI1)
WRITE (LUNOUT,603) (LPOINT(I),I=1,MAXNI1)
READ (LUNIN) (ITSAVE(I4),I4=1,NMTURN)
WRITE (LUNOUT,603) (ITSAVE(I4),I4=1,NMTURN)
IF (NUMBPR.EQ.0) THEN
READ (LUNIN) (TVOL(I4),I4=1,NMTURN)
WRITE (LUNOUT,603) (TVOL(I4),I4=1,NMTURN)
ELSE
DO 740 J=1,NUMBPR
DO 734 NP=1,TRNPUR
Prototype Design - 19
DO 730 NA=1,NMTURN,500
NB = NMTURN-NA+1
IF (NB.GT.500) NB = 500
READ (LUNIN) (IO(I),I=1,NB)
WRITE (LUNOUT,603) (IO(I),I=1,NB)
730
CONTINUE
734 CONTINUE
740 CONTINUE
ENDIF
C
8000 CLOSE (LUNIN)
CLOSE (LUNOUT)
STOP 'LODUNP Normal Stop'
8900 WRITE (*,8901)
8901 FORMAT (' Input file is not a TRANPLAN file')
CLOSE(LUNOUT,STATUS='DELETE')
9000 STOP 'LODUNP Abnormal Stop'
END
convert.for
C Read the Links.in and Nodes.in files and write to the network.in
C file in TRANPLAN format
C
INTEGER X
CHARACTER*1 LINKS(80),NODES(80)
C
C
Open the read file and the two output files
C
Open(Unit=5,File='links.in',status='OLD')
Open(Unit=6,File='nodes.in',status='OLD')
Open(unit=7,File='network.in',status='UNKNOWN')
C
100
READ(6,200,END=700) NODES
200
FORMAT(80A1)
500
WRITE(7,600) (NODES(X), X=2,80)
600
format (79A1)
GO TO 100
C
700
READ(5,200, END=900) LINKS
800
WRITE(7,600) (LINKS(X), X=2,80)
GO TO 700
900
END
Prototype Design - 20
tparc.f
C
C
THIS PROGRAM COMBINES LINK.DAT AND NODE.DAT INTO TPARC.F
AS REQUIRED FOR INPUT TO ARC OF ARC/INFO
INTEGER NODE,NLINKS,nnode
CHARACTER*5 ANODE,BNODE
PARAMETER (NODE =2038,NLINKS=3260)
CHARACTER X(NODE)*9,Y(NODE)*9,N(NODE)*5
OPEN (UNIT=10,FILE='node.dat')
OPEN (UNIT=15,FILE='link.dat')
OPEN (UNIT=20,FILE='tparc.dat')
10
DO 10 I=1, NODE
READ (10,500,END = 20) N(I),X(I),Y(I)
NNODE = NNODE + 1
CONTINUE
20
DO 100 J=1, NLINKS
READ (15,510,END=200) ANODE,BNODE
WRITE(20,*) J + 100
DO 110 I=1,NNODE
IF (ANODE.EQ.N(I)) THEN
WRITE (20,*)X(I),Y(I)
GOTO 999
ENDIF
110 CONTINUE
999 CONTINUE
DO 120 I=1,NNODE
IF (BNODE.EQ.N(I)) THEN
WRITE (20,*) X(I),Y(I)
GOTO 1000
END IF
120 CONTINUE
1000 CONTINUE
WRITE(20,*) (' END')
100 CONTINUE
200 WRITE(20,*) (' END')
500 FORMAT(A5,A9,A9)
510 FORMAT(2A5)
END
Prototype Design - 21
tplink2.f
c
C
THIS PROGRAM EXTRACTS THE NODES AND LINK DATA FILE FROM
TRANPLAN OUTPUT FILE
INTEGER KK
CHARACTER TEMP*60 ,ANODE*5,BNODE*5,DIRECT*2,CAP*6,VOL*6
CHARACTER XCOO*9,YCOO*9,NODEN*5,LDIST*4,FOPT*1,FIELD1*4,FIELD2*4
OPEN (UNIT =5 ,FILE = 'hwy.dat')
OPEN (UNIT = 10, FILE = 'node.dat')
OPEN (UNIT = 15, FILE = 'link.dat')
OPEN (UNIT = 20, FILE = 'TPIN.dat')
KK = 100
50
READ (UNIT=5,100,END=1000)TEMP
100 FORMAT(A60)
IF (TEMP(:1) .EQ.'N') THEN
NODEN = TEMP(2:6)
XCOO = TEMP(9:17)
YCOO = TEMP(20:28)
WRITE(10,110)NODEN,XCOO,YCOO
110 FORMAT(A5,A9,A9)
ELSE IF(TEMP(:1).NE.'T') THEN
ANODE = TEMP(1:5)
BNODE = TEMP(6:10)
WRITE(15,120)ANODE,BNODE
120 FORMAT(A5,A5)
KK = KK + 1
LDIST = TEMP(12:15)
FOPT = TEMP(16:16)
FIELD1 = TEMP(17:20)
FIELD2 = TEMP(21:24)
DIRECT = TEMP(25:26)
CAP = TEMP(33:38)
VOL = TEMP(39:44)
WRITE(20,130)KK,LDIST,FOPT,FIELD1,FIELD2,DIRECT,CAP,VOL
& ,ANODE,BNODE
130 FORMAT(I4,',',A4,',',A1,',',A4,',',A4,',',A2,',',A6,',',A6,
& ',',A5,',',A5)
ENDIF
GOTO 50
1000 CONTINUE
CLOSE (UNIT=5)
CLOSE (UNIT=10)
END
Prototype Design - 22
REFERENCES
ESRI. Arc/Info Reference Manuals. 1993. Environmental Systems Research Institute,
Inc., 380 New York Street, Redlands, CA, 93273.
Hazarvartian, Kim Eric, John Collura. "A Computer-Aided Project Management System
for Transportation Consultants." ITE JOURNAL, April 1994: 18-24.
MicroStation Reference Manuals. 1992. Intergraph Corporation. Huntsville, AL
Jensen, Jeffery, Xiao-Hui Yu. "Design of Computer Based System to Evaluate
Transportation Related Strategies for Air Quality Enhancement." Senior Design Report.
1994. University of Nevada, Las Vegas.
ORACLE Refernce Manuals. 1989. Intergraph Corporation. Huntsville, AL.
UAG. 1992. User Manual Supplement and Installation Instructions. The Urban Analysis
Group. 375 Diablo Road, Ste 110. Danville, CA 94526.
Prototype Design - 23