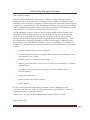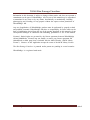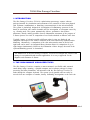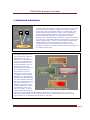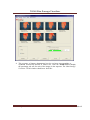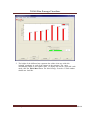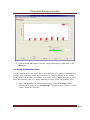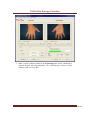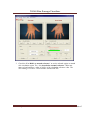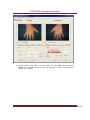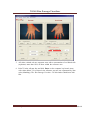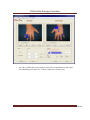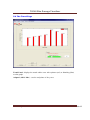
1
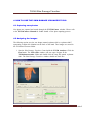
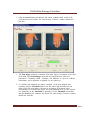
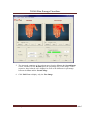
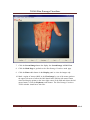
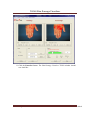
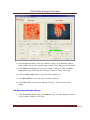
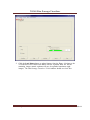
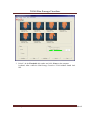
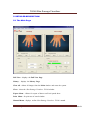
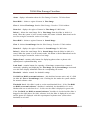
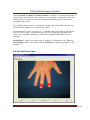
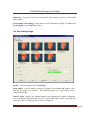
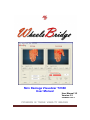
Skin Damage Visualizer TiVi60
User Manual
User Manual 3.2
Version 3.2
October 2013
PIONEERS IN TISSUE VIABILITY IMAGING
TiVi60 Skin Damage Visualizer
Dear Valued Customer!
Welcome to the WheelsBridge Skin Damage Visualizer TiVi60 system designed for
automatic analysis of the extent of areas plagued with erythema (vasodilatation) and
blanching (vasoconstriction) frequently accompanying contact dermatitis and vasospasm
caused by use of vibrating tools. The Skin Damage Visualizer was designed especially for
observer-independent automatic analysis of the microcirculation of the hands and is, due
to its portability, well suited for measurements at the work-site.
The Skin Damage Visualizer utilizes a highly sensitive digital camera equipped with
polarization filters making it possible to “see through” the top layer of the skin and
probe the microcirculation of the dermal structures. The versatile system software –
based on the MATLAB® high performance language for technical computing – allows
for rapid and easy capturing and analysis of tissue viability images. Among the many
useful features of the Skin Damage Visualizer software the following are particularly
helpful in the evaluation of microvascular disturbances in the hands due to occupational
hazards:
?
Automatic capturing of a sequence of photos.
?
Easy identification of skin areas plagued with erythema and blanching by use of
superimposed color schemes.
?
Zoom-in features to display details of images.
?
Marking of a normal skin reference area as a basis for visualization of erythema
and blanching.
?
Uploading of up to eight images to display consecutive changes in skin
microvasculature.
?
Integrated trend analysis.
?
Export of data to Excel® spreadsheet.
?
Online manual
We are convinced that the Skin Damage Visualizer will be a helpful tool in the
assessment and follow-up of microvascular disturbances of the hands in a variety of
conditions related to occupation medicine.
Thank you for choosing the WheelsBridge Skin Damage Visualizer TiVi60.
WheelsBridge AB
Skin Damage Visualizer TiVi60 3.2
Sida 1
TiVi60 Skin Damage Visualizer
Information in this document is subject to change without notice and does not represent a
commitment on the part of WheelsBridge AB. No part of this manual may be reproduced
or transmitted in any form or by any means, electronically or mechanically, including
photocopying and recording, for any purpose without the express written permission of
WheelsBridge AB.
Any use of applicatio n of WheelsBridge products must be performed by properly trained
and qualified personnel. WheelsBridge AB takes no responsibility for action taken on the
basis of information derived from the use of the product described in this manual or from
consequential damages in connection with furnishing, performance or use of this manual.
Licensee’s limited rights are governed by the license agreement between WheelsBridge
AB and MathWorks. Licensee may not modify or remove any license agreement file
(MarthWorks or third party) that is included with the MCR Libraries (“MCR Library
License”). Licensee of this Application accepts the terms of the MCR Library License.
The Skin Damage Visualizer is patented and/or patents are pending in several countries.
WheelsBridge is a registered trade mark.
Skin Damage Visualizer TiVi60 3.2
Sida 2
TiVi60 Skin Damage Visualizer
1. INTRODUCTION
The Skin Damage Visualizer TiVi60 is a polarization spectroscopy camera software
package intended for visualization and assessment of the extension of skin areas plagued
with erythema (vasodilatation) or blanching (vasoconstriction) in the microcirculation.
The system is particularly designed for investigation of inflammatory processes in the
hands in association with contact dermatitis and for investigation of vasospasm caused by
e.g. vibrating tools. The system automatically delivers quantitative data of these
parameters, thereby making possible observer-independent assessment of the progress of
a disease process over time or comparison of test results obtained at different work sites.
Typically, images of a hand recorded at different points in time are displayed and
compared with respect to the relative extension of the areas affected by erythema and/or
blanching. Alternatively a comparison of the skin microvascular status in the left and
right hand can be made. An integrated library function allows for comparison of up to
eight images simultaneously. Based on the information of these images, the trend of the
erythema/blanching process is determined.
The intended use of the Skin Damage Visualizer TiVi60 is to investigate the extent of skin
damage in occupational health research applications. It is not yet approved for the
diagnosis and treatment of disease.
2. THE SKIN DAMAGE VISUALIZER TiVi60
The Skin Damage Visualizer comprises a camera mounted to a flexible table mounted
stand during image capturing, a portable computer and a software package for image
processing and data presentation. All interaction with the Skin Damage Visualizer is
made through the computer keyboard. The system is truly portable and can easily be
moved from one workplace to another, thereby facilitating investigations at the work-site.
Skin Damage Visualizer TiVi60 3.2
Sida 3
TiVi60 Skin Damage Visualizer
3. OPERATING PRINCIPLES
flash
detector
filter
polarized
light
skin
depolarized
light
Linearly polarized white light is partly reflected by the upper layer
of the skin and partly diffusely scattered in the deeper dermal
layers where the microvascular network is located. Most of the
directly reflected light preserves its state of linear polarization,
while the light diffusely scattered in the tissue successively
becomes randomly polarized. The backscattered linearly
polarized light directed towards the detector is effectively blocked
by a filter with a polarization direction perpendicular to that of the
linearly polarized light. A portion of the randomly polarized light
passes through this filter and reaches the detector. This
arrangement gives the impression that the camera can see
through the top layer of the skin and probe the microcirculation in
the deeper dermal layers.
The green component of the
light reaching the detector is
attenuated due to a high
absorption in red blood cells
while the red component is
virtually unaltered because of
its low absorption in the red
blood cells. Surrounding
tissue absorbs green and red
polarizartion photo
light to approximately the
same amount. The Skin
Damage Visualizer takes
advantage of this wavelength
dependence in red blood cell
absorption. By first separating
red plane
green plane
the colour matrixes and then
applying an algorithm in which
the value of each picture
algorithm
element in the green colour
matrix is subtracted from the
corresponding value in the
red colour matrix, an output
matrix representing the local
red blood cell concentration is generated. By applying a threshold based on e.g. a region of
interest including healthy skin, the extension and location of areas with values above or below
this threshold can be displayed superimposed on the photo.
Skin Damage Visualizer TiVi60 3.2
Sida 4
TiVi60 Skin Damage Visualizer
4. HOW TO USE THE SKIN DAMAGE VISUALIZER TiVi60
4.1 Capturing new photos
New photos are captured and stored through the TiVi701Camera window. Please refer
to the TiVi701Camera Manual for further details of the photo capturing process.
4.2 Analyzing the images
The following section uses the test images named erythema-0001 to erythema-0007
representing a slight skin irritation on the back of the hand. These images are stored in
the TiVi60demonstration folder.
1. Start the Skin Damage Visualizer from inside the TiVi700 Analyzer. Click the
First button. The Pick a File window will now open. Navigate to the
TiVi60demonstration folder and double-click the image file named erythema0001. The Skin Damage Visualizer window should now look like:
Skin Damage Visualizer TiVi60 3.2
Sida 5
TiVi60 Skin Damage Visualizer
2. Click the Second button and load the file named erythema-0006 stored in the
TiVi60demonstration folder. The Skin Damage Visualizer window should now
look like:
3. The First Image represents a situation with minor degree of erythema at the back
of the hand. The Second Image represents the same hand now with more
pronounced – but hardly visible - erythema. The difference is, however, difficult
to determine, and in particular to quantify, by the naked eye.
4. To visualize and determine the relative extension of the areas plagued with
erythema, drag the Threshold slider to the left and/or right and note how the
extent of the red areas change. All areas in the images of the hands with a
concentration of red blood cells above the actual threshold level are now colored
red. Eventually set the Threshold by printing 0.3 in the Threshold edit textbox
and click Enter on the computer key-board. The Skin Damage Visualizer window
should now look like:
Skin Damage Visualizer TiVi60 3.2
Sida 6
TiVi60 Skin Damage Visualizer
5. The increased extension of the erythema area from the First to the Second Image
is now visualized. In the Results panel, the percentage area of the image of the
respective hand colored red is displayed as well as the difference in percentage
between the First and the Second Image.
6. Click Full View to display only the First Image.
Skin Damage Visualizer TiVi60 3.2
Sida 7
TiVi60 Skin Damage Visualizer
7. Click the Second Image button the display the Second Image in Full View.
8. Click the Main Page to get back to the Skin Damage Visualizer main page.
9. Click the Photo radio-button in the Display panel to view the images only.
10. Mark a region of interest (ROI) in the First Image by use of the mouse (point to
the upper left corner of where the ROI should start, hold the left mouse button
down and drag the pointer to the lower right corner of the ROI and release the left
mouse button). Click the Erythe ma radio button. The Skin Damage Visualizer
TiVi60 window should now look like:
Skin Damage Visualizer TiVi60 3.2
Sida 8
TiVi60 Skin Damage Visualizer
11. Click the Zoom In 1 button. The Skin Damage Visualizer TiVi60 window should
now look like:
Skin Damage Visualizer TiVi60 3.2
Sida 9
TiVi60 Skin Damage Visualizer
12. Click the Save 1 button to store the zoomed in image. In the Save As window,
select a folder and give the zoomed image a name. Click Save to store the image.
13. Click Full View to display the zoomed in image in full view. Click the Main
Page button to get back to the Skin Damage Visualizer TiVi60 main page.
14. Click the Zoom Out1 button to get back to the original view.
15. Click Reset ROI 1 to reset the region of interest marking.
16. Click Clear All to clear the Skin Damage Visualizer TiVi60 window from
images.
4.2 Working with the Library
1. Click the Library button to get to the Library page. The Skin Damage Visualizer
TiVi60 window should now look like:
Skin Damage Visualizer TiVi60 3.2
Sida 10
TiVi60 Skin Damage Visualizer
2. Click the Load Photos button to upload images from the library. Navigate to the
TiVi60demonstration folder and double click the erythema-0001 file. All the
remaining images named erythema will now be uploaded (maximum eight
images). The Skin Damage Visualizer TiVi60 window should now look like:
Skin Damage Visualizer TiVi60 3.2
Sida 11
TiVi60 Skin Damage Visualizer
3. Print 0.3 in the Threshold edit textbox and click Enter on the computer
keyboard. After a while the Skin Damage Visualizer TiVi60 window should look
like:
Skin Damage Visualizer TiVi60 3.2
Sida 12
TiVi60 Skin Damage Visualizer
4. This sequence of images demonstrates how the red areas (corresponding to
erythema) successively increase in relative size. Click the Trend button to display
the percentage red area for each of the images in the sequence. The Skin Damage
Visualizer TiVi60 window should now look like:
Skin Damage Visualizer TiVi60 3.2
Sida 13
TiVi60 Skin Damage Visualizer
5. The height of the different bars represents the relative skin area with skin
irritation (erythema) in each of the images in the sequence. The y-axes
automatically adapts to the highest value. To display the bars in a 100% full scale
mode, click the 100% Max button. The Skin Damage Visualizer TiVi60 window
should now look like:
Skin Damage Visualizer TiVi60 3.2
Sida 14
TiVi60 Skin Damage Visualizer
6. Click the Clear All button to erase the images and bring the system back to the
Main page.
4.3 Using a Reference Area
In many applications the user would like to refer the degree of erythema or blanching to a
reference area comprising normal skin circulation. By using the features in this section,
the threshold is set in terms of percentage of reference area (to display erythema as values
above the threshold value or to display blanching as values below the threshold value).
1. Begin with uploading the whitehand-0001 image as the First Image and the
whitehand-0002 image as the Second Image. The Skin Damage Visualizer TiVi60
window should now look like:
Skin Damage Visualizer TiVi60 3.2
Sida 15
TiVi60 Skin Damage Visualizer
2. Mark a region of interest (ROI) in the First Image that can be considered to
represent normal skin microcirculation. The Skin Damage Visualizer TiVi60
window could now look like:
Skin Damage Visualizer TiVi60 3.2
Sida 16
TiVi60 Skin Damage Visualizer
3. Check the “Use ROI1 as normal reference” to use the selected region as normal
skin circulation region. The “% above/below normal reference” slider now
turns red and assumes a value of 100% of the circulation reference value. The
Skin Damage Visualizer TiVi60 window should look like:
Skin Damage Visualizer TiVi60 3.2
Sida 17
TiVi60 Skin Damage Visualizer
4. Drag the slider to the right or insert the value 150 in the Edit text box and click
Enter on the computer keyboard. The Skin Damage Visualizer TiVi60 window
should now look like:
Skin Damage Visualizer TiVi60 3.2
Sida 18
TiVi60 Skin Damage Visualizer
5. All values colored red now represent areas with a concentration of red blood cells
(erythema) more than 150% of those within the reference area.
6. Print 75 in the edit text box and click Enter on the computer key-board. Areas
with values below 75% of those in the reference area are now represented by blue
color (blanching). The Skin Damage Visualizer TiVi60 window should now look
like:
Skin Damage Visualizer TiVi60 3.2
Sida 19
TiVi60 Skin Damage Visualizer
7. All values colored blue now represent areas with a concentration of red blood
cells (blanching) less than 75% of those within the reference area.
Skin Damage Visualizer TiVi60 3.2
Sida 20
TiVi60 Skin Damage Visualizer
5. DETAILED DESCRIPTION
5.1 The Main Page
Full View – displays the Full View Page.
Library – displays the Library Page.
Clear All - deletes all images from the Main window and resets the system.
Close – closes the Skin Damage Visualizer TiVi60 window.
Export Menu – Allows for export of data to an Excel spread sheet.
Print Menu – for print out of actual window.
Manual Menu – displays on-line Skin Damage Visualizer TiVi60 manual.
Skin Damage Visualizer TiVi60 3.2
Sida 21
TiVi60 Skin Damage Visualizer
About – displays information about the Skin Damage Visualizer TiVi60 software.
Reset ROI 1 – deletes a region of interest in First Image.
Clear 1 - deletes First Image from the Skin Damage Visualizer TiVi60 window.
Zoom In 1 – displays the region of interest in First Image if a ROI exists.
Delete 1 – deletes the actual image file in First Image from the folder in which it is
stored. When the system is in the zoom-in mode, this button is labeled Save 1 and can be
used for saving the zoomed-in version of an image.
Reset ROI 2 – deletes a region of interest in Second Image .
Clear 2 - deletes Second Image from the Skin Damage Visualizer TiVi60 window.
Zoom In 2 – displays the region of interest in Second Image if a ROI exists.
Delete 2 – deletes the actual image file in Second Image from the folder in which it is
stored. When the system is in the zoom-in mode, this button is labeled Save 2 and can be
used for saving the zoomed-in version of an image.
Display Panel – contains radio-buttons for displaying photos alone or photos with
superimposed erythema/blanching areas.
Load Panel – contains buttons for capturing a New image (assumes that a camera is
connected), uploading and displaying the First Image and the Second Image. Associated
text edit boxes display information about the corresponding file names.
Threshold – includes controls for threshold settings.
Use ROI1 (or ROI2) as normal reference – this checkbox becomes active only if a ROI
(in either the First or Second Image) exist. Checking the box makes the system calculate
the normal reference value.
Threshold Level – this slider is used to set the actual threshold level. If the “Use ROI1
(or ROI2) as normal reference” checkbox is unchecked, the threshold level is set in
absolute units on as scale from 0 to 1. In this case the slider is displayed in green color.
If the “Use ROI1 (or ROI2) as normal reference” checkbox is checked and the slider is
dragged to the right (above the 100% reference level) the slider is displayed in red color
and the photos are displayed with their superimposed erythema areas (values above
threshold) in red color.
Skin Damage Visualizer TiVi60 3.2
Sida 22
TiVi60 Skin Damage Visualizer
If the “Use ROI1 (or ROI2) as normal reference” checkbox is checked and the slider is
dragged to the left (below the 100% reference level) the slider is displayed in blue color
and the photos are displayed with their superimposed blanching areas (values below
threshold) in blue color.
The threshold value can also be set directly by printing the actual value in the text edit
box and clicking Enter on the computer key-board.
The threshold level can be set from 0 to 1 in absolute scale (green slider) or alternatively
from 0 to 500 % relative to normal reference area, red or blue slider depending on if
values above threshold (erythema) or values below threshold (blanching) are to be
displayed.
Results Panel – displays the relative area of erythema (or blanching) in the First and
Second Image if these exist. If both exist the Difference of these two quantities is also
displayed.
5.2 The Full View Page
Skin Damage Visualizer TiVi60 3.2
Sida 23
TiVi60 Skin Damage Visualizer
Main Page – brings the system back to display the Skin Damage Visualizer TiVi60 Main
Page window.
Second Image (First Image) - this button is used to alternatively display the First or the
Second Image in the Full View window.
5.3 The Library Page
Trends – used for displaying the Trend Page.
Load Photos – used for loading a sequence of images. In the Pick a File window select
only the first image in the sequence – the remaining images (up to eight images) will be
loaded automatically.
Library Panel – displays the uploaded images with superimposed erythema information
(red) or blanching information (blue) as set by the threshold slider. Below each image the
actual file name and capturing date & time are displayed.
Skin Damage Visualizer TiVi60 3.2
Sida 24
TiVi60 Skin Damage Visualizer
5.4 The Trend Page
Trend Panel – displays the actual relative area with erythema (red) or blanching (blue)
as a bar graph.
Adapted (100% Max) – sets the end points of the y-axes.
Skin Damage Visualizer TiVi60 3.2
Sida 25