1
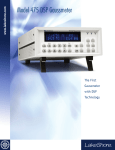
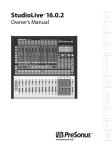
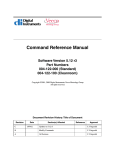
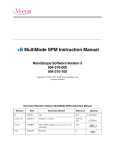
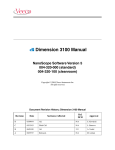
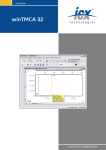
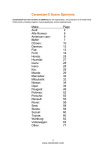
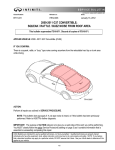
Support Note No. 229, Rev. B
Magnetic Force Microscopy (MFM)
Applicable to Dimension™ Series and MultiMode™ Systems
Support Note Table of Contents
229.1 Magnetic Force Imaging Overview 2
229.2 MFM Using Interleave Scanning and LiftMode 3
229.2.1 Procedure 4
229.2.2 Frequency Modulation 9
229.3 Troubleshooting Suggestions 10
229.3.1 MFM Image Verification 10
229.3.2 Saturation in Amplitude Detection 10
229.3.3 Optical Interference 10
229.4 Advanced Topics 11
229.4.1 Lift Scan Height and Magnetic Imaging Resolution 11
229.4.2 Fine Tuning Interleave Controls 12
Drive Amplitude 12
Setpoint 13
229.5 Installation of Extender Electronics Module 14
229.5.1 Setting the Extender Electronics for Dimension or MultiMode 15
229.5.2 Microscope Parameter Files 15
229.5.3 Important Points 17
This support note describes how to perform magnetic force microscopy (MFM)
imaging on either a Dimension-series system or a MultiMode AFM and replaces
Support Note 206, Magnetic & Electric Force (MFM & EFM) Imaging with
SPMs—Dimension-series Microscopes and Support Note 207, Magnetic & Electric
Force (MFM & EFM) Imaging with SPMs—MultiMode Microscopes. Support
Notes 230 and 231 provide information on Electric Force Microscopy (EFM) for
Dimension series systems and MultiMode systems, respectively
Document Revision History: Support Note: 229
© Digital Instruments, 1996
520 E. Montecito St.
Santa Barbara, CA 93103
(805)899-3380
Section(s)
Ref.
DCR
Rev.
Date
Rev. B
25JUN96
addition on pp. 16-17
0120
Rev. A
22MAY96
Initial Release
0062, 0110
Approval
229-1
Magnetic Force Microscopy
Support Note No. 229
229.1 Magnetic Force Imaging Overview
MFM imaging utilizes the Interleave and LiftMode procedures discussed in
Chapter 12 of your product instruction manual; users are advised to read appropriate sections prior to attempting MFM imaging. Best results will be obtained with
Digital Instruments’ Extender™ Electronics Module. This hardware unit allows
phase detection and frequency modulation for optimal MFM imaging. Instructions
for software installation of the Extender Electronics Module can be found at the end
of this support note; complete instructions for hardware and software installation
are found in Support Note 205A Hardware Installation—Phase Extender Electronics, MultiMode™ AFM and Support Note 232A Hardware Installation—Extender
Electronics, Dimension™ Series Systems.
In MFM, a tapping cantilever equipped with a special tip is first scanned over the
surface of the sample to obtain topographic information. Using LiftMode as shown
in Figure 229-1, the tip is then raised just above the sample surface. The surface
topography is scanned while being monitored for the influence of magnetic forces.
These influences are measured using the principle of force gradient detection. In
the absence of magnetic forces, the cantilever has a resonant frequency f0. This frequency is shifted by an amount ∆f proportional to vertical gradients in the magnetic
forces on the tip. The shifts in resonant frequency tend to be very small, typically in
the range 1-50 Hz for cantilevers having a resonant frequency f0 ~100 kHz. These
frequency shifts can be detected three ways: phase detection, which measures the
cantilever’s phase of oscillation relative to the piezo drive; amplitude detection,
which tracks variations in oscillation amplitude; and frequency modulation, which
directly tracks shifts in resonant frequency. Phase detection and frequency modulation produce results that are generally superior to amplitude detection.
5
4
3
2
1
Magnetic Fields
1&2
3
4&5
Cantilever traces surface topography on first trace and retrace.
Cantilever ascends to Lift scan Height.
Lifted cantilever profiles topography while responding
to magnetic influences on second trace and retrace.
Figure 229-1 MFM LiftMode Principles
229—2
Support Notes
Support Note No. 229
Magnetic Force Microscopy
All standard Dimension-series SPMs and MultiModes are capable of MFM imaging using amplitude detection techniques. By adding an Extender™ electronics
module (see Figure 229-2), either system may also be used for frequency modulation or phase detection, giving improved results. Amplitude detection has largely
been superceded by frequency modulation and phase detection. A more extensive
discussion of force gradient detection and MFM imaging is given in the reprint
Magnetic Force Microscopy: Recent Advances and Applications. Contact Digital
Instruments to obtain a copy.
NOTE: In the instructions below, steps specific to phase and amplitude imaging are described independently. Use the icons in the margin to locate steps specific
to either frequency modulation and phase detection, or amplitude detection.
.
Figure 229-2 Extender™ Electronics Module (required for MFM phase
detection and frequency modulation)
229.2 MFM Using Interleave Scanning and
LiftMode
This section provides instructions for using the LiftMode of Interleave scanning to
obtain MFM images. These guidelines will help in obtaining an MFM image of a
standard magnetic sample (metal-evaporated video tape). Standard tape samples are
provided with purchase of MFM probes, and can be obtained free of charge from
Digital Instruments. Other samples can also be used; however, you will not have the
benefit of comparing your results with the images shown here. Obtaining a good
image of the tape sample will familiarize you with Interleave and MFM techniques
and provide a check that the system is correctly tuned to image magnetic samples of
interest. Many of the principles discussed here also apply to Electric Force Microscopy (EFM), described elsewhere.
Support Notes
229—3
Magnetic Force Microscopy
Support Note No. 229
For MFM procedures, NanoProbe™ magnetic coated tips are required. Various
kinds of MFM probes are available for specific applications; contact Digital Instruments for more information. The remainder of this chapter assumes that the reader
is familiar with the operation of TappingMode to obtain topographical images of a
sample surface and has read the description of Interleave scanning in their manual.
LiftMode allows the imaging of relatively weak but long-range magnetic interactions while minimizing the influence of topography (Figure 229-1). Measurements
are taken in two passes across each scanline; each pass consists of one trace and one
retrace. In the first pass, topographical data is taken in TappingMode on one trace
and retrace. The tip is then raised to the lift scan height and a second trace and
retrace performed while maintaining a constant separation between the tip and local
surface topography. Magnetic interactions are detected during this second pass.
Using LiftMode, topographical features are virtually absent from the MFM image
(see Figure 229-7).
The procedure below gives suggested parameter values that should work well for
most applications. Further adjustment will, in some cases, improve the quality of
MFM scans, and some experimentation may be needed to optimize the imaging of
specific samples. See the suggestions at the end of this section.
As mentioned above, the NanoScope III uses force gradient detection for MFM
imaging. Within this general technique, there are three possible schemes, known as
frequency modulation, phase detection, and amplitude detection. All three are discussed here. Prior to 1994, amplitude detection had been the standard method for
magnetic force imaging on the NanoScope III. However, hardware that allows
phase detection and frequency modulation is now available for all TappingModecapable microscopes in the form of Digital Instruments’ Extender™ Electronics
Module. (Microscopes without the Extender addition cannot utilize phase detection; for more information, contact Digital Instruments.) Phase detection and frequency modulation detection are superior methods for magnetic force imaging,
offering greater ease of use, better signal-to-noise ratios, and reduced artifact content as compared to amplitude detection. If extensive MFM imaging is planned, the
Extender Electronics module is strongly recommended.
229.2.1 Procedure
1. Mount a NanoProbe magnetic probe on the scanner or tip holder. The tip should
be magnetized with a strong permanent magnet before installing the tip holder on
the AFM head. Tips are usually magnetized with the field aligned along the tip axis
(perpendicular to the sample surface). The MFM then senses force gradients due to
the perpendicular component of the samples’s stray field. Tip magnetizers are provided with MFM probes purchased from Digital Instruments.
229—4
Support Notes
Support Note No. 229
Magnetic Force Microscopy
2. Set up the AFM as usual for TappingMode operation. In all Channel panels, the
Highpass and Lowpass filters should be Off. Set the Rounding parameter in the
Microscope / Calibrate / Scanner window to zero (0.00).
3. The procedure to tune the cantilever drive frequency and amplitude depends on
whether you are using phase detection or amplitude detection. Both cases rely on
automatic Cantilever tune just as when preparing for TappingMode; see Chapter 8
of the product instruction manual. MFM cantilevers have resonant frequencies
between 50 and 100 kHz. If using the AutoTune feature, these values can be used
as bounds for the frequency sweep. With the Extender option, two curves appear in
the Cantilever Tune box: the amplitude curve in white, and the phase curve in yellow (Fig. 229-3). Microscopes without the Extender Electronics Module display
only the amplitude curve.
• Setting a Drive Frequency for Phase Detection
The Drive frequency should be set to the center of the cantilever resonance, as
shown in Figure 229-3. This will be done automatically if using AutoTune.
Phase
Detection
MFM / EFM
Figure 229-3 Cantilever Tune for Phase Detection and Frequency
Modulation
To correctly track the cantilever phase, the Phase offset parameter must be
adjusted. This is automatically done in AutoTune; alternatively, Zero Phase can be
selected from the menu bar above the Cantilever Tune frequency sweep window.
The phase curve should appear as in Figure 229-3, decreasing with increasing frequency, and crossing the center line (corresponding to a 90° phase lag) at the peak
frequency. The phase curve then measures the phase lag between the drive voltage
and the cantilever response. Again, vertical gradients in the magnetic force cause a
shift ∆f0 in the resonance frequency. In this case, resonance shifts give rise to phase
Support Notes
229—5
Magnetic Force Microscopy
Support Note No. 229
shifts ∆φ which then give an image of the magnetic force gradients; see
Figure 229-4.
Technical Note:
The Extender electronics give a measure of the phase lag of the cantilever oscillation relative to the piezo drive. This measurement is monotonic versus frequency as is the true phase lag in degrees. The Extender measurement; however,
has slightly different nonlinear characteristics vs. frequency. The measurement
technique allows optimal signal-to-noise ratios; however, absolute values of
phase data should be taken as approximate. Users requiring quantitative measures of force gradient are advised to use frequency modulation (See
Section 229.2.2).
Proceed to Step #4 below.
.
180
Phase (deg)
∆F0
90
∆φ
0
Drive Frequency
Figure 229-4 Shift In Phase at Fixed Drive Frequency
Amplitude
Detection
MFM / EFM
Setting a Drive Frequency for Amplitude Detection
Set the Drive frequency to the left side of the cantilever resonance curve, as
shown in Figure 229-5. This can be done by using the AutoTune feature to first
find the resonance peak, then using Offset under the Cantilever Tune menu
bar to manually move the drive frequency to the side of the resonance. For
maximum sensitivity, set the Drive frequency to the steepest part of the resonance curve. As the tip oscillates above the sample, a gradient in the magnetic
force will shift the resonance frequency f0; (see Figure 229-6). Tracking the
variations in oscillation amplitude while in LiftMode yields an image of the
magnetic force gradients.
Proceed to Step #4 below.
229—6
Support Notes
Support Note No. 229
Magnetic Force Microscopy
Figure 229-5 Cantilever Tune for Amplitude Detection
Amplitude
∆F0
Drive Frequency
Figure 229-6 Shift In Amplitude at Fixed Drive Frequency
4. Adjust the Drive Amplitude so that the RMS voltage response of the photodetector is approximately 2 volts. (Somewhat larger values may be beneficial if using
amplitude detection.) This can be done with Auto Tune by selecting an appropriate
Target Amplitude (in this case, 2V) before tuning, or by exiting Cantilever Tune
and manually adjusting the Drive Amplitude parameter under Feedback Controls.
Quit Cantilever Tune and return to Image Mode. Under Interleave Controls set
the Lift start height to 0 nm, and Lift scan height to 100 nm. (The lift height can
be optimized later.) Set the remaining Interleave parameters (Setpoint, Drive
Amplitude, Drive frequency, and gains) to the Main Controls values. This can be
Support Notes
229—7
Magnetic Force Microscopy
Support Note No. 229
done by setting the flags left of the Interleave Control column to “off” (grayed
bullets).
5. Under Scan Controls, set the Scan size to 5 µm and Scan rate to 1–2 Hz. For
the left image, set the Z range to 75 nm and the Line direction to Retrace. Engage
the AFM and make the necessary adjustments to obtain a good topographical image
while displaying height data. Use the maximum possible Setpoint to ensure that the
tip is contacting the surface only lightly. The image should be similar to the topographic image shown on the left of Figure 229-7. The surface is fairly flat with
lubrication nodules of various sizes. A good image of the nodules provides a check
that the tip is sharp.
Figure 229-7 Topographic (left) and Magnetic Force Gradient Image
(right) of Metal Evaporated Tape at 100 nm Lift Height
Phase
Detection
MFM / EFM
6. The MFM data can be shown on Channel 2; however, the parameter settings are
different depending on whether Phase Detection or Amplitude Detection is being
used
• Phase Detection
Set the Channel 2 image Data type to Phase, Z range to 3 degrees, and Line
direction to Retrace.
229—8
Support Notes
Support Note No. 229
Magnetic Force Microscopy
NOTE: It is important that the Scan direction be set to Retrace for both the
main and interleave scans. If instead it is set instead to Trace, a band may
appear along the left side of the images due to the time taken for the tip to move
between the surface and the lift scan height.
Amplitude
Detection
MFM / EFM
• Amplitude Detection
Set the Channel 2 image Data type to Amplitude, Z range to 1 nm, and Line
direction to Retrace.
7. Change Interleave mode to Enable to invoke LiftMode. Set the Channel 2 Scan
line to Interleave to display the interleaved data. (This can only be done after
Interleave mode is Enabled.) A magnetic force gradient image similar to that
shown on the right of Figure 229-7 should appear as the Channel 2 image. The
alternating dark and light stripes represent the recorded magnetic information, and
signify a varying resonant frequency and hence magnetic force gradient on the tip.
As usual, keep the Setpoint as large as possible while consistent with a good
image. Wider scans (> 25 µm) will reveal separate tracks in which the magnetic
stripes are at different angles.
229.2.2 Frequency Modulation
Phase
Detection
With the Extender Electronics Module, it may be desirable to use frequency modulation. This activates a feedback loop which modulates the Drive Frequency to
keep the cantilever’s phase lag at 90 degrees relative to the drive, corresponding to
resonance. The frequency Data Type displays the resulting shift in Drive Frequency in Hz, and gives the most direct, quantitative image of force gradients.
To enable frequency modulation, follow the procedure above for obtaining an MFM
image with phase detection, but switch the Channel 2 image Data type to Frequency. Try a Z range (frequency shift) of approximately 10 Hz. Select Other
Controls, then adjust the frequency modulation gains. Setting both frequency modulation Integral gain and Proportional gain to 100 is a good starting point. As
with the topography gains, the scan can be optimized by increasing the gains to
maximize feedback response, but not so high that oscillation sets in. With 225micron MFM cantilevers, gains are usually in the range of 100–250.
Support Notes
229—9
MFM / EFM
Magnetic Force Microscopy
Support Note No. 229
229.3 Troubleshooting Suggestions
229.3.1 MFM Image Verification
The procedure described above should produce a good magnetic force gradient
image of the videotape sample. If there is a problem, check that the Interleave
Mode is set to Lift, that Interleave is Enabled and that the Scan Line is set to
Interleave. Check also that the Interleave values of Drive Amplitude and Drive
Frequency are initially set equal to the main Scan Controls values.
229.3.2 Saturation in Amplitude Detection
If using amplitude detection, the magnetic force image can saturate (appear completely featureless) if the Interleave Drive Amplitude is significantly different
than the Drive Amplitude in the main scan. Adjust the Interleave Setpoint to
restore the image. (Note that the Interleave Setpoint has no physical effect in LiftMode since there is no surface feedback during the lift pass.
229.3.3 Optical Interference
Amplitude
Detection
When using Amplitude Detection, optical interference may sometimes appear in
the Lift (magnetic force gradient) image when imaging highly reflective samples.
Optical interference appears as evenly spaced, sometimes wavy lines with ~1–2 µm
spacing superimposed on the lift image. This occurs when ambient laser light (i.e.,
light passing around or through the cantilever, then reflecting off the sample) interferes with laser light reflecting from the cantilever. Interference can be alleviated by
moving the beam spot up the cantilever away from the tip; about one-third of the
cantilever length works well. The adjustment can be refined by carefully moving
the beam spot laterally a small distance on the cantilever while scanning until interference fringes are minimized. Be careful not to move the beam off the cantilever or
feedback may be lost.
NOTE: Optical interference is essentially eliminated by using phase detection or
frequency modulation.)
229—10
Support Notes
MFM / EFM
Support Note No. 229
Magnetic Force Microscopy
229.4 Advanced Topics
229.4.1 Lift Scan Height and Magnetic Imaging Resolution
The most important parameter affecting imaging resolution is the Lift scan height.
The range of 10–200 nm is most useful. In general, MFM resolution is roughly
equal to the lift height: smaller Lift Scan heights give better resolution; conversely,
magnetic features smaller than the Lift Scan height may not be resolved. The tip
also experiences stronger fields close to the surface, giving improved signal-tonoise ratios.
For example, the image of metal-evaporated tape in Figure 229-7 has a resolution
limited by the 100 nm Lift Scan height. To improve the resolution, try reducing the
Lift scan height to ~ 25 nm. Ensure that the tip does not strike the surface on the
low point of its swing in the Lift image. Tip strikes appear as black or white spots,
or even noisy, high-contrast streaks crossing the image. If the tip begins to strike the
surface, reduce the Interleave Drive Amplitude. (In general, MFM tips are not
damaged by intermittent tip strikes, except in extreme cases of very large amplitude
and small lift heights.) An example of an image of the metal-evaporated tape taken
with a Lift scan height of 30 nm is shown in Figure 229-8. Note the fine magnetic
structure that is not visible in Figure 229-7. When imaging a sample for the first
time, begin with moderate Lift scan heights (50 nm or greater), then adjust downward. On relatively smooth samples (e.g., hard disks), lift heights down to 0 nm can
be used, as long as the drive amplitude is adjusted accordingly. (Lift scan heights of
0 nm still correspond to a non-zero mean tip-sample distance. See the section on
Setpoint below.) It is usually not beneficial to use Lift scan heights much smaller
than the surface roughness. Users are encouraged to experiment for the best images
on their samples.
The ultimate resolution of MFM with the NanoScope III is near 20 nm. Resolution
is affected by properties of the tip, including mechanical sharpness and magnetic
structure. When in good condition, NanoProbe magnetically coated tips routinely
give 50 nm resolution, and many achieve 30 nm or better.
Support Notes
229—11
Magnetic Force Microscopy
Support Note No. 229
Figure 229-8 High-resolution Magnetic Force Gradient Image of
Metal Evaporated Tape at 30 nm Lift Height
229.4.2 Fine Tuning Interleave Controls
Certain scanning parameters found under Interleave Controls can be set to values
in the Interleave (Lift) scan that differ from the values in the main scan. These
parameters are enabled by clicking on the circular flag to the immediate left of the
desired Interleave control, toggling its state from “off” (gray bullet) to “on” (green
bullet). When the flag is set to “off”, the main scan control parameter setting takes
precedence. When the flag is set to “on,” the displayed Interleave scan value is
active, overriding the main scan value.
Drive Amplitude
For MFM, of particular use is the Interleave Drive Amplitude. This parameter can
affect a magnetic force image in a variety of ways.
• Increasing the Drive Amplitude can improve the signal-to-noise ratio when
using phase detection or frequency modulation. This is because intrinsic, lowlevel noise interferes less when measuring the phase of a larger cantilever oscillation amplitude and hence stronger photodetector output. As an illustration, try
setting the Interleave Drive Amplitude to 0; the resulting phase image will be
pure noise because measuring the phase of a non-oscillating cantilever is meaningless.
229—12
Support Notes
Support Note No. 229
Magnetic Force Microscopy
In LiftMode, the Interleave Drive Amplitude can often be set to a value larger
than in the main scan, thus giving optimal signal-to-noise. In some cases this is
beneficial as long as the Drive Amplitude is not increased to the extent that the
tip strikes the surface on the low point of its swing. The signatures of tip-sample
contact are white and black spots in the image, or, in extreme cases, noisy, highcontrast streaks across the whole image. It is usually safe to increase the Drive
Amplitude until the first signs of tip strike are noticed, then reduce the amplitude slightly.
CAUTION: Before enabling the Interleave Drive Amplitude, check that its value
is not much larger than the main Drive Amplitude value. This will prevent the cantilever oscillation from jumping to a very large amplitude when the parameter is
enabled, possibly damaging the tip. The Drive Amplitude can be adjusted even
when the parameter is disabled (i.e., when the flag is set to “off” (gray bullet)).
Amplitude
Detection
MFM / EFM
• When using amplitude detection, variations in Drive Amplitude affect sensitivity and image contrast as well as signal-to-noise ratio. This is because
changes in the oscillation amplitude change the slope of the amplitude vs. frequency curve, and hence the effective sensitivity; see Figure 229-6. With phase
detection and frequency modulation, changes in amplitude produce no change
in contrast, and results are thus more reproducible than with amplitude detection.
NOTE: On some microscope models, there is a lowpass filter in the scanning electronics that prevents fast switching of the Drive Amplitude between main and
Interleave scanning. This can interfere with very fast rates (> a few Hz).
Setpoint
For the most reproducible results, it is best to use a consistent setpoint. In LiftMode, the total tip-sample distance htot is the sum of the average tip-sample distance in TappingMode hT, and the lift scan height hlift (see Figure 229-9). In
TappingMode, the average tip-sample distance hT is equal to the oscillation amplitude, which is determined by the setpoint. Large variations in setpoint can thus
change the total tip-sample distance in Liftmode, sometimes with visible results in
the magnetic image. For this reason, reproducible results are most easily obtained
by using consistent setpoints. Note that a lift scan height of 0 nm still gives a mean
tip-sample distance of hT in LiftMode.
Support Notes
229—13
Magnetic Force Microscopy
Support Note No. 229
Lift pass
TappingMode pass
htot =
hT + hlift
hlift
hT
Figure 229-9 Tip Heights and Oscillation Amplitudes in TappingMode and
LiftMode
The relationship between setpoint voltage and oscillation amplitude is known as the
sensitivity. Its value can be determined with Force Calibration; see Chapter 11 in
the product instruction manual. For 225 µm MFM cantilevers, the sensitivity is typically in the range 15-20 nm/V. (The exact value depends on the position of the
laser spot on the cantilever, the cantilever geometry, and the particular instrument.)
A 1V Setpoint typically corresponds to hT ~15-20 nm.
229.5 Installation of Extender Electronics Module
In the Spring of 1994, Digital Instruments began making available its Extender
Electronics Module (sometimes referred to as “phase box” or “phase extender”) for
customers wanting phase detection and frequency modulation MFM. Hardware
changes, different for each system type, are required to retrofit Dimension Series
systems or MultiMode systems originally shipped without the Extender Electronics
module.
For Dimension systems, the Extender is installed using 37-to-37 pin ribbon cables
between: 1) the NanoScope III or IIIA SPM controller and the Extender Electronics
Module; as well as 2) from the Extender to the microscope. The hardware change
consists of replacing the main electronics backplane board at the rear of the microscope (this may be done by either the customer or a factory representative).
Detailed installation instructions are provided with the new hardware when
shipped. For more information, contact Digital Instruments.
For MultiMode systems, the Extender is installed using a 37-to-37 pin ribbon cable
between the NanoScope III or IIIA SPM controller and the Extender Electronics
229—14
Support Notes
Support Note No. 229
Magnetic Force Microscopy
Module, and a 37-to-25 pin ribbon cable from the Extender to the microscope. The
hardware change consists of replacing a circuit board in the base of the microscope
(this may be done by either the customer or a factory representative). Detailed
installation instructions are provided with the new hardware when shipped. For
more information, contact Digital Instruments.
229.5.1 Setting the Extender Electronics for Dimension or MultiMode
The Extender Electronics box is equipped with a slider switch for switching internal electronics between Dimension-series and MultiMode SPM signals. This
switch may be accessed through a hole on the underside of the box. In the drawing
below, the switch is set to “Dimension”.
Dimension
MultiMode
For Dimension-series SPMs, the switch should always be set to “Dimension”, and
for MultiMode SPMs, it should be set to “MultiMode”. Use a pencil to access the
switch through the hole. CAUTION! Do not insert a conducting object (e.g.,
screwdriver) into the Extender box.
229.5.2 Microscope Parameter Files
There are two parameter (par) file contexts that are used with the Extender Box:
Extended AFM and Extended STM. The former of these two contexts is used for
the following operational modes: contact AFM, TappingMode AFM, LFM, MFM,
force modulation, electric field measurement and others. The latter context is for
use only with STM.
For each scanner intended to be used with the Extender, there must be a PAR file
for the context required. For example, if there are three scanners, all intended for
both STM and AFM use, a total of six PAR files are required.
Support Notes
229—15
Magnetic Force Microscopy
Support Note No. 229
(NOTE: Due to the many Digital Instruments’ microscope systems available, the
variety of scanners, when the system was purchased, and the system’s history of
software updates, not all systems will have PAR files with the same name or naming scheme. You can determine the exact name of the PAR file to be modified by
using the DOS EDIT file editor to list the contents of the file /SPM/SYSTEM.PAR. The name of the most recent PAR file in use will be on the line that
starts with the words \Microscope file:. Caution: When closing the
System.par file after viewing it, if you are asked to SAVE the file or to SAVE
CHANGES, be sure to say No.)
To modify the PAR files on a MultiMode or Dimension system, locate the proper
PAR file in the /SPM/EQUIP directory on your computer. Use a text editor to
modify the file. The text must be saved as plain ASCII (standard DOS text). DI recommends using the DOS EDIT file editor. (Microsoft Word® or other similar desktop-editors normally save files with embedded formatting commands causing the
par files to be unreadable by the NanoScope software.) Using the EDIT program,
modify the file to include a new line at the bottom of the file. For example:
If the line
\Is FM: No
is present in the file, then change the line to read:
\Is FM: Yes
If the line
\Is FM: No
is not present, add the line:
\Is FM: Yes
Then locate the line:
\In Polarity: Reverse
and change it to read:
\In Polarity: Forward
229—16
Support Notes
Support Note No. 229
Magnetic Force Microscopy
Then locate the line:
\In Polarity: AUX D: Reverse
Change it to read:
\In Polarity AUX D: Forward
Repeat the above procedure for each scanner (i.e. PAR file) in use. After the cables
are connected, power up the NanoScope controller and start the microscope control
program.
229.5.3 . Important Points
1. Extender-compatible microscope electronics are required to permit operation of
the phase detection extender option. Standard electronics on these microscopes
require hardware upgrades. Consult your Digital Instruments sales representative
for details.
2. Turn off the power to the NanoScope controller whenever connecting or disconnecting the Extender.
3. In LiftMode, the best performance is obtained if the RMS amplitude is kept
below 7.0 volts, the limit of the RMS output’s linear operation.
Support Notes
229—17