1
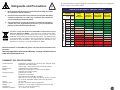
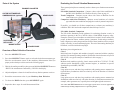
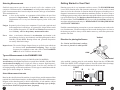
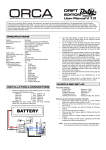
MONARCH INSTRUMENT
Instruction Manual
EXAMINER 1000
Vibration Meter
Electronic Stethoscope
Printed in the U.S.A.
Copyright 2008, Monarch Instrument, all rights reserved
1071-4400-114R
1008
15 Columbia Drive
Amherst, NH 03031 USA
Phone: (603) 883-3390
Fax: (603) 886-3300
E-mail: [email protected]
Website: www.monarchinstrument.com
Safeguards and Precautions
Use the chart below as a guide to judge the overall vibration severity of your equipment.
Refer to page 12 for further details.
VIBRATION SEVERITY PER ISO 10816-1
1. Read and follow all instructions in this manual carefully, and retain
this manual for future reference.
Machine
3. This instrument is not user serviceable. For technical assistance,
contact the sales organization from which you purchased the
product or Monarch Instrument directly.
In order to comply with EU Directive 2002/96/EC on Waste Electrical and
Electronic Equipment (WEEE): This product may contain material which
could be hazardous to human health and the environment. DO NOT
DISPOSE of this product as unsorted municipal waste. This product needs
to be RECYCLED in accordance with local regulations, contact your local
authorities for more information. This product may be returnable to your
distributor for recycling - contact the distributor for details.
Vibration Velocity Vrms
2. Do not use this instrument in any manner inconsistent with these
operating instructions or under any conditions that exceed the
environmental specifications stated.
in/s
mm/s
0.01
0.02
0.03
0.04
0.07
0.11
0.18
0.28
0.44
0.71
1.10
1.77
0.28
0.45
0.71
1.12
1.80
2.80
4.50
7.10
11.2
18.0
28.0
45.0
Class I
small
machines
Class II
medium
machines
Class III
large rigid
foundation
Class IV
large soft
foundation
good
satisfactory
unsatisfactory
unacceptable
Monarch Instrument’s Limited Warranty applies. See www.monarchinstrument.com
for details.
Warranty Registration and Extended Warranty coverage available online at
www.monarchinstrument.com.
EXAMINER 1000 SPECIFICATIONS
Vibration Sensor:
Display:
Measurement
Range:
Frequency Range:
Output:
Power:
Operating Time:
Weight:
Dimensions:
Operating conditions:
Piezoelectric accelerometer 100 mV/g with magnetic base,
probe and 5 foot cable to BNC
LCD 3.5 digit , measurement, hold, low battery indicator
Acceleration 0.01-19.99 g (RMS)
Velocity 0.01-19.99 in/sec., 0.1-199.9 mm/sec (RMS)
Envelope 0.01-19.99 ge (peak)
Overall 10 Hz - 10 kHz
Envelope 0.5 kHz-10 kHz
Sensor Excitation: 18 Vdc @ 2 mA (BNC)
Audio Out: 3.5 mm mini plug; 250 mW into 8 ohms, 150 mW
into 32 ohms; Adjustable volume control with off position
(2) “AA” cells
20 hours continuous without headphones
Instrument: 7 oz. (0.19 kg); Complete Kit: 2.85 lb (1.30 kg)
6.3 x 3.3 x 1.25” (152 x 83 x 32 mm)
-14° to 122°F (-10° to 50°C)
16
GLOSSARY (for vibration purposes)
Piezoelectric A material in which electrical properties change when subjected to
force.
Process Measurements
Variables such as temperature, pressure, speed and
flow used to assess internal conditions of efficiency.
Radial
Direction perpendicular to the shaft centerline.
Repeatability A measure of the deviation between successive measurements made
under the same conditions.
RMS
Peak Vibration x .707. ( in/s or mm/s)
Rolling Element Bearing A bearing consisting of balls or rollers operating between
fixed and rotating races.
Route
A sequence of measurements arranged for convenience
during acquisition.
Sensitivity
Used to describe a transducer’s electrical output for a unit variation
of the mechanical quantity measured.
Stress
Force per unit area
Synchronous Frequency components that are an integer multiple of
running speed.
Transducer
A system consisting of a sensor and signal conditioner to convert a
physical quantity into an output for display, monitoring
and analysis.
Transmission Path The path from source (excitation) to sensor.
Trending
The plot of a variable over time used as an indicator of change.
Velocity
A vector quantity of the time rate change of displacement.
TABLE OF CONTENTS
OPERATING THE EXAMINER 1000
Overview ...........................................................................
1
Controls and Functions........................... ...........................
1
Rear Panel, Batteries and Connections .............................
2
Parts of the System ...........................................................
3
Overview of Data Collection Procedure..............................
3
APPLYING THE EXAMINER 1000
What is Predictive Maintenance? .......................................
4
Benefits of Predictive Maintenance ....................................
4
Why Measure Vibration? ....................................................
5
Selecting Machinery & Measurements................................
6
Selecting Measurement Types ...........................................
7
Getting Started in your Plant...............................................
8
Establishing a Data Collection Route..................................
9
What are you Measuring? .................................................. 10
Vibration Conversions
Measurement Techniques .................................................. 11
D = 19.10 x 10³ x (V/F)
D = 70.4 x 10⁶ x (A/F2)
Evaluating overall Vibration Measurements ........................ 12
V = 52.36 x 10⁻⁶ x D x F
V = 3.68 x 10³ x (A/f)
A = 14.2 x 10⁻⁹ x D x F2
A = 0.27 x 10⁻³ x V x F
where:
15
D = Displacement (mils peak-to-peak)
V = Velocity (in/s zero-to-peak)
A = Acceleration (in/s2 zero-to-peak)
F = Frequency (cpm)
Evaluating Acceleration Envelope Measurements............... 13
GLOSSARY ........................................................................ 14
Vibration Severity Chart per ISO 10816-1 ........................... 16
OPERATING THE EXAMINER 1000
GLOSSARY (for vibration purposes)
Overview
Acceleration A scalar quantity that specifies time rate of change of velocity.
Expressed in either g’s or m/sec2 where 1 g = 386.1 in/sec2 and
9.8066 m/sec2.
Acceleration Enveloping
A high-frequency, filtered data collection method
expressed in ge.
Accelerometer
A transducer which converts acceleration motion in to an
electrical output.
Amplitude
The magnitude of vibratory motion. Can be measured as peak-topeak, zero-to-peak, or RMS.
Axial
The direction parallel to the axis of rotation.
Baseline
Recorded values taken when a machine is known to be good. The
standard which all additional readings will be compared to.
CPM
Unit of frequency measurement-cycles per minute.
Displacement A scalar quantity specifying the change of position of a body
measured from the resting position.
Dynamic Force A force that varies with time.
Force
Energy applied to a mass producing a deflection (static force) or
motion (dynamic force).
Frequency
The repetition rate of a periodic event, expressed in cycles per
second (Hz), CPM, RPM, or multiples of running speed (orders).
g’s
Units of acceleration referenced against the force of gravity.
(1g=32.1739 ft./sec/sec; 1g=9.8066 m/sec/sec)
Gear Mesh Frequency
A frequency generated by a gear. Defined as the
number of gear teeth on a gear times its shaft-rotating frequency.
Hertz (Hz)
A unit of frequency measurement, cycles per second.
High-pass Filter A filter that allows only those components above a selected frequency
to pass.
Integration
The time-based process of converting acceleration and velocity to
velocity or displacement.
in/sec, ips
Abbreviations for inches per second, a measure of velocity.
Mass
The measure of body resistance to acceleration. Proportional to,
but not equal to, weight (mass = weight/gravity).
Measurement Point A location on a machine or component where all subsequent
measurements should be made for accurate comparison.
Mechanical Impedance
Ratio of applied force to resulting velocity during
simple harmonic excitation.
Overall
The amplitude of vibration within a specified frequency range.
Peak Value
The absolute value zero to the maximum excursion on a dynamic
waveform. Also true peak and zero-to-peak.
Periodic Monitoring Measurements recorded at intervals of time.
The EXAMINER 1000 is designed to be used with vibration limits established in
ISO Standard 10816 to help you detect signs of malfunction or changes in rotating
machinery during operation. This is accomplished with overall vibration (ISO VIB)
and envelope measurements. Problems with bearings occur when there is a
microscopic crack or flaw or when there is a breakdown in lubrication which leads
to metal-to-metal interaction. The EXAMINER 1000 is designed to detect flaws
or a lack of lubrication in bearings and gears at an early stage by measuring the
high-frequency impacts through acceleration envelope methods.
Vibration measurements are made by pressing the accelerometer sensor against
designated Measurement Points on your equipment with either the stringer probe or
with the magnetic base.
Controls and Functions
ON/SELECT Button - Press this button to turn power on. Power automatically
turns off after ten minutes of non-use. After turning the EXAMINER “on”, press
the ON/SELECT button again to select the measurement type. Pressing and holding
the ON/SELECT button while collecting data will HOLD the display value, indicated
by the word “HOLD” in the display. To release from HOLD mode, press the ON/
SELECT button again.
DISPLAY- The digital display shows the numerical value of the measurement. An
arrow indicates the measurement type selected. The units of vibration are
automatically displayed as the type of measurement is selected. The user may work
in either metric or imperial units in the V-velocity mode.
Type of
Measurement
Low Battery
Indicator
Hold Reading
Indicator
1
Type of Measurement
Indicator
Value of Measurement
V
A
E
LoBat
HOLD
0.09
Units of
Measure
g
GE
in/s
mm/s
14
Comparison with Other Machinery
When several similar machines are used under the same operating conditions,
evaluation can be carried out by measuring all machines at the same Points and
comparing the results.
REAR PANEL CONNECTIONS
CONNECTIONS
1234
1234
E
Use trend Comparison similar to overall vibration to establish severity levels.
Accelerating Envelope readings tend to decrease as Overall Vibrations readings
increase. This happens when the defect in the bearing is becoming more severe and
the frequency it generates becomes lower which makes it better read with the
Velocity-type readings.
Audio Comparison with Other Bearings on the Same Machinery
When several bearings are used under the same operating conditions, evaluation
can be carried out by listening to the audio signals to determine changes. This method
will help to locate the defective bearing quickly. Measure all machines at the same
Points and compare the results. Listen for increases in signal and for “clicking”
patterns which indicate wear.
13
1
A
M
0
I
0
N
0
E R
VIBRATION METER
ELECTRONIC STETHOSCOPE
REFER TO OPERATORS MANUAL
FOR INSTRUCTIONS
QUICK REFERENCE
INSTRUCTION
PANEL
CONNECTIONS
SENSOR IN
AUDIO OUT
Evaluating Acceleration Envelope Measurements
Use the same techniques of comparison as for Overall Vibration readings.
Remember, acceleration envelope is an advanced “early warning” of a developing
problem. High values do not necessarily indicate bearing failure. They can
also indicate:
A. Lack of lubrication or decreasing oil viscosity due to high bearing
temperature caused by overload or external heat source.
B. Breaking of the lubricant film by excessive imbalance, misalignment, or
housing deformation. Loss of boundary lubrication.
C. A rubbing seal or cover.
D. Gear mesh interaction (bad lubrication, defects)
E. Dirt or particles in the lubricant, or a seal or filter problem.
X
AUDIO OUT
SENSOR IN
Measurement Types
V
velocity
A
acceleration
E
envelope
Units
mm/s in/s
g
ge
Monarch Instrument
15 Columbia Drive
Amherst, NH 03031 USA
VOLUME
CONTROL
Trend Comparison
The most efficient and reliable method of evaluating vibration severity is to compare
the most recent reading against previous readings for the same measurement Point,
allowing you to see how the Point’s vibration values are “trending” over time. This
trend comparison between present and past readings is easier to analyze when the
values are plotted in a “trend plot”. A trend plot displays current and past values
plotted over time. Measurement records should also include a baseline (known good)
reading. The baseline value may be acquired after an overhaul or when other
indicators show that the machine is running well. Subsequent measurements are
compared to the baseline to determine machinery changes.
PRODUCT SERIAL
NUMBER
BATTERY
C O M PA R T M E N T
Contains two “AA”
alkaline batteries.
1234
1234
1234
1234
1234
AUDIO OUT
1/8” (3.5 mm)
stereo mini plug
TOP VIEW
SENSOR INPUT
BNC Connector
output 18 vdc @ 2 mA
2
Parts of the System
Evaluating the Overall Vibration Measurements
EXAMINER 1000 METER
ON-TIME SOFTWARE AND
OWNERS MANUAL (optional)
HEAD PHONES
HOLSTER
ACCELEROMETER
WITH CABLE
MAGNETIC BASE
STINGER PROBE
Overview of Data Collection Procedure
1. Press the ON/SELECT button.
2. Press the ON/SELECT button again to select the desired measurement type.
Place the accelerometer sensor on the machinery Measurement Point (use
proper probe technique as discussed on the following pages).
3. Wait for the reading to stabilize, then press and hold the ON/SELECT button to
“HOLD” the measurement. Indicated by HOLD in the display.
4. Adjust headphones volume level and listen for any distinct patterns or noises.
5. Record the measurement value in your Machinery Data Worksheet.
6. To release the HOLD function, press ON/SELECT again.
7. Repeat the above steps for each Measurement Point.
3
Three general principles are commonly used to evaluate your vibration measurement
values:
ISO 10816 Standard Comparison - Compare values to the limits established in
the ISO 10816 Standard. See Vibration Severity Chart on page 16.
Trend Comparison - Compare current values with values of Baseline for the
same Points over a period of time.
Comparison with Other Machinery - Measure several machines of a similar
type under the same conditions and judge the results by mutual comparison.
If possible, you should use all three comparisons to evaluate your machinery’s
condition. ISO 10816 and trend comparisons should always be used.
ISO 10816 Standard Comparison
The ISO 10816 Standards provide guidance for evaluating vibration severity in
machines operating in the 10 to 200 Hz (600 to 12,000 RPM) frequency range.
Examples of these types of machines are small, direct-coupled, electric motors and
pumps, production motors, medium motors, generators, steam and gas turbines,
turbo-compressors, turbo-pumps and fans. Some of these machines can be coupled
rigidly or flexibly, or connected through gears. The axis of the rotating shaft may be
horizontal, vertical or inclined at any angle.
Machinery class designations are:
Class l
Individual parts of engines and machines, integrally connected with the complete
machine in its normal operating condition. (Production electrical motors of up to 20
HP (15 kW) are typical examples of machines in this category.)
Class ll
Medium-sized machines typically, electric motors with 20 to 75 HP (15-75 kW)
without special foundations, rigidly mounted engines, or machines on special
foundations up to 400 HP (300 kW).
Class lll
Large prime movers and other large machines with rotating masses mounted on
rigid and heavy foundations which are relatively stiff in the direction of vibration
measurement.
Class lV
Large prime movers and other large machines with rotating masses mounted on
foundations which are relatively soft in the direction of vibration measurement (for
example, turbo-generator sets, especially those with lightweight ub-structures).
Note: These ISO 10816 Standard classes do not apply to prime movers or driven equipment in
which the major working components have a reciprocating motion.
12
Measurement Techniques
What Is Predictive Maintenance?
In general, vibration of anti-friction bearings is best monitored in the load zone of the
bearing. Equipment design often limits the ability to collect data in this zone. Simply
select the measurement Point which gives the best signal. Avoid painted surfaces,
unloaded bearing zones, housing splits, and structural gaps. When measuring vibration
with a hand-held sensor, it is very important to collect consistent readings, paying
close attention to the sensor’s position on the machinery, the sensor’s angle to the
machinery, and the contact pressure with which the sensor is held on the machinery.
• Location - always collect at the same point on the machine. Mark
locations.
• Position - Vibration should be measured in three directions:
A axial direction
H horizontal direction
V vertical direction
• Angle Always perpendicular to the surface (90o +10o).
• Pressure - Even, consistent hand pressure must be used (firm, but not
so firm as to dampen the vibration signal). For best results
use the magnetic base. If using the stinger/probe is the only
method available to collect data, it is best to use a punch to
mark the location for the probe-tip to ensure a consistent
coupling to the housing.
Predictive Maintenance can be defined as collecting information from machines as
they operate to aid in making decisions about their health, repair and possible
improvements in order to reach maximum runability, before any unplanned breakdown. Machinery maintenance has evolved because of the demands to become
more profitable through reduced maintenance costs. Below is the progression of
these maintenance philosophies:
• Break Down Maintenance
• Preventive Maintenance
• Predictive Maintenance
Break Down Maintenance occurs when repair action is not taken on a problem
until the problem results in the machines failure. Run to failure problems often cause
costly secondary damage along with expenses resulting from unplanned downtime
and unplanned maintenance.
Preventive Maintenance occurs when a machine, or parts of a machine, are
overhauled on a regular basis regardless of the condition of the parts. While better
than run to failure, preventive maintenance results in excessive downtime due to
unnecessary overhauls and the excessive costs of replacing good parts along with
worn parts.
Optimum Measurement Conditions
Perform measurements with the machine operating under normal conditions. For
example, when the rotor, housing, and main bearings have reached their normal
steady operating temperatures and with the machine running under its normal rated
condition (for example, at rated voltage, flow, pressure and load). On machines
with varying speeds or loads, perform measurements at all extreme rating conditions
in addition to selected conditions within these limits. The maximum measured value
represents the vibration severity.
Stinger Mounted
Vibration Sensor
Magnetically
Mounted
Vibration Sensor
load zone
11
Predictive Maintenance is the process of determining the condition of machinery
as it operates, to predict and schedule the most efficient repair of problem components
prior to failure. Predictive Maintenance not only helps plant personnel eliminate
unplanned downtime and the possibility of catastrophic failure, but allows them
effectively order parts, schedule manpower, and plan multiple repairs during
scheduled downtime.
Benefits of Predictive Maintenance
Documented experience proves that plants which establish a predictive maintenance
program are able to:
• Improve Machinery Reliability-reduced “unplanned failures”
• Reduce Maintenance Costs-knowing the exact problem to fix
• Increase Production-optimize machinery capabilities
• Lower Energy Consumption- less vibration usually means less friction
• Extend Bearing Service Life- reduce vibration and lubrication failures
• Improve Product Quality- where less vibration improves finish
The benefits are numerous and will vary depending upon the implementation
of your Predictive Maintenance Program.
4
Why Measure Vibration?
What are you Measuring?
Vibration is considered the best operating parameter to judge dynamic conditions
such as balance (overall vibration), bearing defects (enveloping) and stress applied
to components. Many machinery problems show themselves as excessive vibration.
Rotor imbalance, misalignment, mechanical looseness, structural resonance, soft
foundation, and gearmesh defects are some of the defects that can be measured by
vibration. Measuring the “overall” vibration of a machine, a rotor in relation to a
machine or the structure of a machine, and comparing the measurement to its normal
value (norm) indicates the current health of the machine.
Vibration is the behavior of a machine’s mechanical components as they react to
internal or external forces. Since most rotating machinery problems show themselves
as excessive vibration, we use vibration signals as an indication of a machine’s
mechanical condition. Also, each mechanical problem or defect generates vibration
in its own unique way. We therefore analyze the “type” of vibration to identify its
cause and take appropriate repair action. With overall vibration monitoring (VIB
ISO) using the Examiner 1000, analysis of the cause of excess vibration relates to
the monitoring equipment’s probe position; either horizontal, vertical, or axial.
The EXAMINER 1000 measures the vibration of a machine while it is operating.
Trending these measurements shows how a machine’s condition changes over a
period of time. Analyzing these, along with other measurements, provide insight into
the condition of the machine and which components may be wearing or failing. How
to best monitor a machine’s condition requires one to know which measurements to
take and where and how to take them. Sensors are placed at strategic Points on
the machinery to monitor the machine’s condition.
Horizontal - Typically, unbalanced shafts tend to cause excess radial (horizontal
and vertical) vibrations, depending on the machine support design.
Vertical - Excessive vertical vibration can indicate mechanical looseness as well as
imbalance.
Axial - Excessive axial vibration is a strong indicator of misalignment.
It’s important to note that these are general guidelines and that knowledge of your
machinery and proper hand-held probe techniques are necessary to accurately analyze
the cause of excessive vibration.
The EXAMINER 1000 processes the accelerometer’s mechanical vibration energy
into an electrical signal and displays the measurement value in numerical form for
evaluation. Commonly measured physical characteristics in Predictive
Maintenance are:
• Vibration (as explained above)
• Temperature
• Oil Analysis
Temperature
As a bearing fails, friction causes its temperature (or its lubricant’s temperature) to
rise. While trending a bearing if the temperature rises followed by a vibration increase,
then it is safe to conclude their was a loss of lubrication which induced the mechanical
failure. If vibration increased first, followed by increased temperature readings then
a mechanical defect caused the lubrication failure.
Lube Oil Analysis (Ferrography)
Monitoring oil condition warns of an increase in foreign substances, such as water,
which can degrade the lubricating properties of the oil and cause bearing failures. It
also detects the presence of metallic particles carried into the oil stream. These
metallic particles are analyzed to determine which part of the machine is wearing
and how fast. Lubrication analysis is the earliest warning of a developing problem.
Lube oil testing results can be trended with On-Time software.
5
Multi-Parameter Monitoring
Using different measurement types to monitor your machinery for changes. This
allows for early detection of specific machinery problems that may not show under
normal overall vibration monitoring. For example, if a rolling element bearing has a
defect on its outer race, each roller will strike the defect as it goes by and cause a
small, repetitive vibration signal. However, this vibration signal is of such low
amplitude that under normal overall vibration monitoring, it is lost in the machine’s
rotational and structural vibration signals. Acceleration Enveloping can measure
these signals better than overall readings. Use both measurement types for
bearings and gearboxes. As ENV values begin to decrease, rely on VEL
readings.
Overall Vibration Monitoring -Monitors normal, low frequency machine vibration.
Detects rotational and structural problems like imbalance, misalignment, and
mechanical looseness.
Enveloping - Amplifies high-frequency, repetitive bearing and gear mesh vibration
signals for early detection of bearing problems, but does not detect non-repetitive
rotational or structural events like imbalance, misalignment, and looseness. Provides
earliest detection of high frequency metal-to-metal contact or poor lubrication in
problem bearings.
10
Establishing a Data Collection Route
Selecting Machinery and Measurements
The Machinery Data Worksheet helps organize data for routine data collection.
Vibration readings are taken on the Points (bearings) established in your route and
recorded using your naming convention on the worksheet. Vibration, speed,
temperature, pressure or any process data may be recorded using this type of
systematic approach.
Maintenance personnel have always made visual and hands-on inspections of their
machinery on a periodic basis. Systematic data collection and trending allows for
recall and comparison of events over time but is not a replacement for good
maintenance practices. Collecting machinery data is an aid to the maintenance
professional, which is used in addition to good maintenance practices.
Steps for Route collection
1. Determine the machines which require data collection.
2. Define each measurement type for data collection Points on each Machine.
Several Points will have numerous readings i.e. VEL and ENV and Temp.
3. Establish a Route with the Machines grouped by physical location.
4. Walk the Route, collecting and recording data for each Point.
5. Transfer data values to your On-Time Trending software.
Selecting and Classifying Machinery
Recording Data for a Machine
A1234567B
C
1234567
1234567
1234567
1234567
1234567
1234567
The vibration sensor is
placed on each data
collection Point. The
Point, direction of the
sensor and the value are
recorded
on
the
Machinery
Data
Worksheet.
D
MOTOR
12345
12345
12345
12345
12345
12345
12345
12345
12345
PUMP
example of Machinery Data Worksheet
Point AVV is
taken on the
outboard end of
the motor, in the
vertical position
with a velocity
type reading.
AHV -Point A in
the horizontal
position with a
Velocity type.
9
Machine Identification Water Pump #707
Machine Description AC motor 1800 RPM, flexible
coupling, 3 vane pump. CAUTION HOT WATER!!!
Date
Jan
Jan
Jan
Jan
Jan
Jan
2
2
2
2
2
2
Point Direction Type Value
1999
1999
1999
1999
1999
1999
A
A
A
B
B
B
V
H
X
V
H
V
V
V
V
V
V
Env
0.06 in/s
0.04 in/s
0.03 in/s
0.07 in/s
0.05 in/s
0.001 ge
Setting up an effective Predictive Maintenance Program requires a careful study of
the needs of the plant. It is necessary to know each machine and its response to
change. The following is an example of machinery classification:
CRITICAL
ESSENTIAL
REDUNDANT
Critical Machines expensive premium equipment, generally >500 HP. Usually
less than 5% of all plant equipment. Maintenance dollars per horsepower per year
average $11.00. This category of equipment is very well maintained and monitored.
Continuous monitoring systems are better suited for this type of equipment.
Essential Machines medium size equipment, 100-500 HP. This group may be 3040% of all the equipment in the plant. Maintenance costs can average $22.00 per
horsepower per year. Less attention is paid to these machines even though their
repair costs can be as high as critical machines. Select some of these machines for
your Predictive Maintenance Program.
Redundant Machines small redundant equipment usually < 100 HP. This group
can be as much as 50% of all machines in a plant and yet they are usually neglected.
By far the most expensive to maintain at $49.00/HP/year, this group will benefit
the most from Predictive Maintenance practices. At many facilities, this group
consumes 80% of the annual maintenance budget. If you want to have an immediate
impact begin with these machines. Also include machines with known problems or a
history of problems. Personnel Safety is always the first priority in selecting
machinery to monitor.
6
Selecting Measurements
Getting Started in Your Plant
Establish measurement types that most accurately reflect the condition of the
equipment. Different causes or “mechanisms” are acting on the machine; various
types of measurements have been developed to measure each type of mechanism.
Those mechanisms are:
Stress A force on the machine or components which deflects the part. Best
measured in Displacement. The Examiner 1000 does not measure
Displacement as it is a very low vibration frequency, below 10 Hz (600
RPM).
Planning your work is very important to achieve success. The EXAMINER 1000
is an overall vibration meter and electronic stethoscope. It can be used as a stand
alone device for the collection of vibration data for the purposes of trending or as a
diagnostic instrument used to troubleshoot machinery defects. In order to setup a
trending program you must collect data on the same point with the same measurement
type at a defined interval. The Machinery Data Worksheet allows for record keeping
of collected data. The EXAMINER may be used with the On-Time software to
store data and perform trend analysis. REPEATABILITY IS REQUIRED FOR
ACCURATE TRENDING.
Fatigue Repeated cycles of stress on a component. If you bend a part back and
forth enough times it will fatigue. As a general rule, fatigue failures result
from vibration frequencies 10 -2000 Hz and Velocity measurements are
used. Velocity will be the primary measurement taken.
Force
Mass x acceleration. Measured in Acceleration. Acceleration is the
rate of change of velocity. Acceleration is used for high frequencies above
2000 Hz (120,000 RPM). Bearing defects and gearmesh frequencies
are usually found in this range.
Impact forces The result of fatigue. Impact forces are cyclical events which can
be detected with Acceleration Enveloping. These are high
frequency-low amplitude events and a filter in the EXAMINER
1000 is set at 10-30 kHz to measure them.
Establish a standard naming convention so you can communicate your results to the
rest of maintenance. Vibration readings are taken on the bearing caps or as close to
the bearings as possible. Always collect data the same way, at the same point on the
machine each time.
Direction for placing the Sensor
Vertical
For Vertical and Horizontal readings,
the sensor is placed in a radial position.
Axial
Types of Measurements in the EXAMINER 1000
Velocity- Good for frequency ranges 10-2000 Hz (600-120,000 RPM).
Acceleration-used for higher frequencies or speeds above 2000 Hz (120,000 CPM).
Acceleration Enveloping-uses a high pass filter to measure high-frequency,
repetitive bearing and gearmesh vibration signals. Used for early detection of
developing bearing or lubrication problems. Use this type in combination with the
other types to detect changes in machinery.
Select Measurement Intervals
Based on the classification of the machine, its repair history and the amount of data
required for a detailed trend analysis. At the beginning of a Predictive Maintenance
Program, collect data frequently to build a rapid history of each machine. Adjust
your program as you go. If measurement results are indicating signs of change,
measurements should be performed more frequently.
7
Horizontal
Also establish a starting point for each machine. Begin from the OUTBOARD
END of the DRIVE UNIT, calling this point A. Proceed to label Points (bearings)
as needed until you have reached the outboard end of the driven unit.
POINT
12345
12345
A1234567B
C
D
1234567
1234567
1234567
1234567
1234567
1234567
1234567
MOTOR
12345
12345
12345
12345
12345
12345
12345
12345
PUMP
8