1
SSC-349
(Phase I)
DEVELOPMENT
OF A
GENERALIZED ONBOARD
RESPONSE MONITORING
SYSTEM
This cksxmenthas ken approved
for public relewe and sale;its
distributionis unlimited
SHIP STRUCTURE COMMITTEE
1990
SHIP STRUCTURF COMMIITEF
The SHIP STRUCTURE COMMllTEE is constitutedto prosecutea researchprogramto improvethe hull
structuresof ships and other marine structuresby an extensionof knowledgepertainingto design,
materials,and methodsof construction.
RADM J. D. Sipes, USCG, (Chairman)
Chief, Office of Marine Safety, Security
and EnvironmentalProtection
U. S. Coast Guard
Mr. H. T. Hailer
k.sociate Administratorfor Shipbuildingand Ship Operations
MaritimeAdministration
Mr. Alexander Malakhoff
Director,StructuralIntegrity
Su roup(SEA 55Y)
Nava
? Sea Systems Command
Mr. ThornasW. Allen
EngineeringOMcer (N7)
MilitarySealift Command
Dr. Donald UU
Senior Vke President
American Bureauof Shipping
CDR Michael K. Parmelee, USCG,
Secretary, Ship StructureCommittee
U.S. Coast Guard
CONTRACTING Oi=F ICFR TECf-fNICAl REPRESENTATIVFS
Mr. Greg D, Woods
Mr. WilliamJ. Siekierka
SEA 55Y3
SEA 55Y3
Naval Sea Systems Command
Naval Sea Systems Command
The SHIP STRUCTURE SUBCOMMlll_EE acts for the Ship StructureCommittee on technicalmatters by
providingtechnicalcoordinationfor determinatingthe goals and objectivesof the programand by
evaluatingand interpretingthe resultsin terms of structuraldesign,construction,and operation,
AMERICAN BUREAU OF SHIPPING
MVAL
Mr. Stephen G. Arntson(Chairman)
Mr. John F. ConIon
Mr. William Hanzalek
Mr. PhilipG. Rynn
Mr. RoberlA Sielski
Mr. Charles L. Null
Mr. W. Thomas Packard
Mr. Allen H. Engle
Mll ITARY SFAI Im C() MMAN13
U. S, COAST GUARD
Mr. Alberl J. Attermeyer
Mr. Michael W. Touma
Mr. Jeffery E. Beach
CAPT T. E, Thompson
CAPT Donald S. Jensen
CDR Mark E. fdoll
SEA SYSTEMS
COMMAND
MARITIME ADMINISTRATION
Mr. FrederickSeibold
Mr. Norman O. Hammer
Mr. Chao H. Lin
Dr. Walter M. Maclean
sHIP STRUCTI IRF SUBCOMMllTF~FM5FRS
lL %
COAST GUARi_J ACA~FMy
LT Bruce Mustain
u.s. MFRCHANT
Mr. Alexander B. Stavovy
MARINE ACADF MY
NATIONAL ACADEMY OF SCIENCES Dr. C. B. Kim
U. S. NAVAL ACADEMY
Mr. Stanley G. Stiansen
Dr. Ramswar Bhattacharyya
SOC ETY OF NAVAL ARCHITECTS AND
~
s
~
Dr. W. R. Porter
Dr. William Sandberg
AMERICAN
IRON AND STEEL INSTITUTE
WELDING RESEARCH COUNCIL
Dr. Martin Prager
Mr. AlexanderD. Mlson
Member Agencies:
Unitsd States Coast Guard
Naval Sea Systems Command
Maritirrre Administration
Amerixm Bureau of Sh(oping
Militaty Seahft Command
Address Correspondence to:
Ship
Structure
Committee
Sacretary,
ShipStructure
Committee
U.S.CoastGuard(G-MTH)
2100 SecondStreet
S.W.
Washington,
D.C.20593-0001
PH:
FAX:
(202) 267-0003
(202) 267-0025
-
An Interagency
AdvisoryCommittee
DedicatedtotheImprovementofMarineStmdures
December
3, 1990
SSC-349
SR-1300
DEVELOPMENT
OF A GENERALIZED
ONBOARD
RESPONSE MONITORING
SYSTEM
from the first phase of a two
This report presents
the results
phase
project
concerning
the development
of a standard
Ship
Response Monitor
(SRM ). It is intended that the SRM will provide
sufficient
information
to ships’ officers to assess the potential
for structural
damage
due to undesirable
loading
conditions Although
considerable
work has been done in th~s area, a set of
for monitoring
equipment
have not
standard
performance
criteria
The design
accepted
by the marine
industrydeveloped
and
specifications
developed
for the SRM during this first phase were
During
the
based on an analysis
of performance
requirements.
second phase of the project,
a prototype
un~t w~ll be built and
evaluated
under service conditions.
e.
Rear Admiral, .U.s. Coast Guard
Ship Structure Committee
Chairman,
Technical
1. ReportNo.
2.
Government
Accession
No.
Report
Documentation
3.
Recipient’s
Cotalog
5.
Report Date
6.
Performing
Orgnnizat, o” C~de
8.
Performing
Organization
Page
No.
SSC-349
1
4.
Title
nnd $,Ubtitle
Development
Monitoring
7.
of a Generalized
System - Phase I
Onboard
May 1987
Response
AUYhar/S)
OTC-84-24,
F. W. DeBord,Jr.
9. Performing
Organization
Report No.
SR-1300
and B. Hennessy
Narn.s and Address
10,
OFFSHORE TECHNOLOGY
CORPORATION
578 Enterprise
Street
Escondido,
CA
92025
Work lJnit No. (T RAIS)
11.Contract
nr Grant No.
DTCG23-85-C-20080
13. Type of Repart and Period Covered
12.
Sponsoring
AgencYNmnc
7
and Address
Commandant
U.S. Coast Guard
2100 Second Street, SW
Washington,
DC
20593
15. Supplemcntory
Sponsored
Final
Phase
14.Sponsoring
G-M
Report
I
Agency
Code
Notes
by the Ship
Structure
Committee
and its member
agencies.
16. Ahstruct
Design specifications
for a standard Ship Response Monitor (SRM)
are
developed
on the basis of an analysis of performance
requirements.
Issues addressed
in the analysis of performance
requirements
include
major and optional system functions,
sensors and interfacing,
packaging,
displays and controls,
and selection of an appropriate
controller.
Cost implications
for the options reviewed are discussed
and recommendations
for the basic SRM are developed.
It is concluded
that to insure acceptance
by operating companies,
the SRM should be
designed as a single function bridge instrument
which can be
purchased
and installed
for between $30,000 and $40,000.
Based on
these conclusions
a design is developed
and specifications
are given
for the unit to be evaluated during Phase 11 of the project.
The
recommended
design consists of standard industrial
measurement
and
control hardware operating under control of software written in a
high level language.
This will provide transportability
to alternate
hardware if so desired in the future.
The evaluation
unit should be
provided with two standard accelerometers
and two to four additional
sensors to be selected by the operating company.
The unit should be
configured
such that variations
in packaging,
displays and controls
are evaluated.
17.
Key Words
18. Distribution
Statement
Available
from:
Nat’1 Technical
Information
Service
Springfield,
VA
22161 or
Nat’1 Technical
Information
Facility
National Maritime Research Center
Kinqs Point, NY
10024-1699
Ship Response
Shipboard
Instrumentation
Ship Operations
lg.Security Classic. (ofthiz
Unclassified
report)
20.
SecuritY
Classic.
(ofthiz
page)
(8-72)
Pages
22.
Unclassified
I
Form DOT F1700.7
21. No. of
Reproduction
1
of completed
i
page authorized
I
Price
METRtC CONVERSON
b
FACTORS
t
Armoxhmtc ConwdtA,to
Aworrknmo
Motrk M.smrm
fhudorrs
When YtnJKfww
Wttm VW Know
To Fhd
hltidv h
WIW
Swtlbd
LEN
LEMG7M
iut
~.m
m
mM
9.2
1.2
mthutua
mntlnutus
-m
rlnta9
kllmmtus
mmu@
kkuwt
MEA
P
P.
4-
—
TEWEBAI’WE
tad
—
0.
0.
3.
::
PREFACE
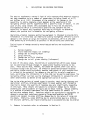
For approximately twenty-five years, various government agencies and
private organizations have completed projects where shfp responses in heavy
weather were monitored and displayed. Although most of these were research
projects, over the years the concept of displaying these measurements for the
navigating officer has been recognized as a means to improve operations and
minimize damage in heavy weather.
In 1985, the interagency Ship Structure Committee initiated a project to
develop a generalized onboard response monitoring system. The objective of
this project is to design a commercially producible response monitoring system
that will have application on any vessel. This report presents results of the
first phase of the project. Based on a review of previous work, performance
requirements were finalized and a design specification was prepared. During
Phase II, three prototype units will be built, and these will be evaluated
during use on several types of ships.
iii
TABLE OF CONTENTS
Page
INTRODUCTION
1.1 Background
1.2 Objectives
1
2.
APPLICATIONS FOR RESPONSE MONITORING
3
3.
REVIEW OF PREVIOUS WORK
5
4.
ANALYSIS OF PERFORMANCE REQUIREMENTS
4.1 Major System Functions
4.2 Sensors
4.3 Sensor Interfacing and Cabling
4.4 Functions in Addition to Response Monitoring
4.5 Packaging
4.6 Display Methodologies
4.7 Controls
4.8 Computer and Peripheral Selection
4.9 Summary of Cost Implications
4.10 Recommendations
10
10
11
HARDWARE SPECIFICATION
5.1 General Description
5.2 Regulations, Codes and Standards
5.3 Sensors
5.4 Signal Conditioning and Conversion
5.5 Interfacing and Cabling
5.6 Control and Display Console
5.7 Operator Controls
5.8 Packaging and Ship Interface Requirements
5.9 Input/Output Devices
5.10 Spare Parts
5.11 Testing and Support
25
25
25
27
28
28
28
SOFTWARE SPECIFICATION
6.1 General Description
6.2 Supervisory Software
6.3 Application Software
6.4 Displays
6.5 Testing and Support
37
7.
FUTURE ENHANCEMENTS
43
8.
CONCLUSIONS AND RECOMMENDATIONS
44
9.
REFERENCES
45
1.
5.
6.
:
::
::
35
;$
38
38
42
APPENDIX A - Performance Requirements as Developed by SNAME HS-12 Panel
APPENDIX B - Drawings and Parts List
APPENDIX C - Manufacturer’s
15
16
17
18
19
19
21
23
Specifications
v
LIST OF FIGURES
NUMBER
TITLE
5-1
STD Bus Implementation of the Standard Response Monitor
26
5-2
Preliminary Console Layout
34
6-1
Typical Graphical Displays
39
6-2
Characteristic
41
PAGE
Statistics Display
LIST OF TABLES
NUMBER
1
TITLE
PAGE
Partial Listing of Previously Completed
Response Monitoring Projects
6
2
Summary of User-Selectable
3
Comparison of Alternate Computer Hardware
20
4
Summary of Costs for Standard System and Some Options
22
5
Typical Sensor Interfacing and Sampling Requirements
30
Sensors
vi
14
1.
1.1
INTRODUCTION
Background
For approximately 25years various organizations in the U.S., Europe and Japan
have been investigating the use of shipboard instrumentation systems to aid
mariners in making decisions related to safe and efficient operation of their
ships. These “Ship Response Monitors” typically provide ship motions and/or
hull stress data on a near real-time basis to permit the navigating officer to
assess the severity of the environment and the way the ship is responding to
The majority of these projects have been developmental in
that environment.
nature, and although they have demonstrated the concept of using response
monitoring, to date the idea has not been commercialized to the point where
standard equipment is available and used on a large number of vessels.
In an attempt
to bridge the gap between the previously completed development
projects and custom installations, and a standard, commercially available ship
response monitor, the Ship Structure Committee is currently sponsoring a
project to develop a generalized onboard response monitoring system. As a
starting point for this work, performance requirements were provided by the
Society of Naval Architects and Marine Engineers’ HS-12 Panel on Hull
Instrumentation (see Appendix A) based on a review of previous work. The
concept given in these performance requirements is to develop a standardized
response monitor (SRM) with two standard sensors, several user-selectable
sensors, necessary signal conditioning and standard displays for presentation
of the information to ship’s personnel. The provision of several userselectable sensors will permit configurations of the system for different ship
types and operating company preferences, while maintaining the standardization
necessary for commercial production.
In addition, the system will be
adaptable to optional enhancements for vessel or trade applications where
these are desirable.
The current project is divided into two phases. During Phase I these
performance requirements were evaluated and the design of a standardized ship
response monitor (SRM) was completed.
Phase II work will include fabrication
of three prototype units and evaluation of these aboard vessels in service.
This report presents the results of the Phase I work.
1.2
Objectives
The primary objective of the Phase I work reported herein was the development
of specifications for the prototype Ship Response Monitors to be built and
tested during Phase II. Although a significant amount of previous work has
been completed in the area of ship response monitoring, a concise set of
standard performance requirements have not previously been developed or
accepted by the marine industry. Therefore, the first task completed was
definition and review of these performance requirements.
Subsequently, design
specifications were developed.
Results of these two tasks are discussed in
the following sections of this report.
During Phase II the primary objective will be evaluatio~ of the SRM concept by
producing, installing and using three systems aboard sh~ps. In addition
to
providing operator feedback on the concept and usefulness of the system, this
phase will provide critical review of the specific design features incorporated in the prototypes and an opportunity to evaluate alternate design
features. At the conclusion of Phase II, a final desfgn incorporating
comments of navigating officers and operating companies will be available to
industry.
*“
2
2.
APPLICATIONS FOR RESPONSE MONITORING
The need to supplement a master’s feel of ship response with measured response
has been commented on by a number of researchers including Chazal et al (1)
and Hoffman et al (10). Assessment of the potential for damage or the
capability to safely complete a task depends on the experience of the
navigating officer and his experience with a specific class of vessel. In the
case of very large vessels this assessment may in fact not be possible.
Instrumentation which is sufficiently sensitive and reliable has the
capability to detect ship responses which may be difficult to otherwise
detect, and provide this information for navigating officers.
Operations-oriented response monitoring equipment is intended to provide this
information in a form that can readily be used by navigating officers to avoid
damage to the vessel or cargo and injuries to personnel, while at the same
time operating as efficiently as possible in the existing sea conditions.
Typical types of damage caused by wave-induced motions and accelerations
. include:
;:
3.
4.
5.
6.
Bottom slamming
Flare immersion impact (or slamming)
Damage due to shipping water
Cargo shifting
Damage due to fluid sloshing
Damage due to hull girder bending (infrequent)
In most of the above cases, the motions or accelerations which cause damage
can be controlled through changes in speed and/or heading relative to the
seas. These actions must, however, be traded off against their cost due to
increased voyage time and fuel. An effective operations-oriented response
monitoring systemshould
accurately measure some aspect of ship response that
is related to the potential for damage or the ability to safely complete a
task, and display the information in a form that can be easily understood. The
navigating officer can then use the displayed information in conjunction with
other observations to decide on the appropriate course of action.
Due to the wide variety of vessel types in service, their design features and
operational profiles, problems experienced in heavy weather and information
required to detect the severity of response may vary significantly depending
on ship type. Many vessels are subject to structural damage due to bottom
slamming and crew discomfort or injury due to heavy rolling. Bottom slamming
is a problem of primary importance for high speed vessels or vessels in
ballast with reduced draft. Container vessels are particularly susceptible to
damage to above deck containers caused by large accelerations and RO/RO
vessels are subject to cargo shifting, damage due to the nature of cargo and
Similarly, cargo shifting due to accelerations may be a problem
tie-downs.
for dry bulk carriws, and liquld sloshing due to accelerations may be problem
1. Numbers in brackets refer to references in Section 9.
for Iiquld bulk carriers.
Also, for bulk carriers where loading can be highly
Other vessels
variable, longitudinal bending moments might be significant.
such as RO/ROs may be susceptible to damage due to torsional loads based on
In certain cases such as some LASH ships,
the arrangement of their structure.
afterbody slamming and propeller racing can be a problem area. On passenger
and ferry vessels the key requirement is to keep motions and accelerations to
a comfortable level.
Government service vessels are susceptible to the above problems, but they
High speed surface combatants such as
also pose some unique problems.
destroyers are subject to damage due to shipping water and damage to weapons
Vessels with highly flared
and antenna systems due to large accelerations.
bows are subject to flare impact damage.
In addition to damage considerations
for these vessels, successful completion of operations such as search and
rescue, flight operations, replenishment at sea and even use of weapons is
affected by motions and accelerations, and thus provide an opportunity for
application of response monitoring.
In all of the above cases the important considerations are measurement of
relevant responses, provision of sufficient accuracy and reliability to insure
that changes can be adequately detected, and presentation of the resulting
If these criteria can be met,
information in a form which is meaningful.
response monitoring equipment should provide valuable assistance to the
navigating officer. Analysis of performance requirements and development of
the SRM design presented in the following sections are based on these
considerations and previously completed work.
4
3.
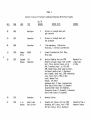
REVIEW OF PREVIOUS WORK
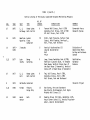
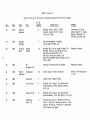
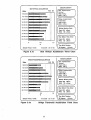
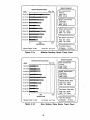
Since 1960, various government agencies, educational institutions and private
companies have conducted research programs to develop shipboard
instrumentation systems intended to provide indications of dynamic hull
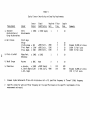
stresses. Table 1 lists a number of these projects and describes the
measurements that were made. The table begins with a reference that describes
the instrumentation system. This is followed by the name and type of vessel
and a listing of the sensors installed to monitor or infer hull stresses.
A review of the projects listed in the table and other references provide no
clear direction for selection of an optimum sensor suite for a Standard
Response Monitor. Some researchers contend that it is adequate for certain
types of ships to monitor bow motions (15). Others argue in favor of a more
comprehensive sensor suite including vibration measurements and direct
These
measurement of stresses (actually strains) at a number of locations.
additional measurements have been strongly recommended for certain ship types
(27).
Previous projects have included a number of alternate measurements to monitor
In most cases, these were research efforts and sensor suites
ship response.
therefore could be more complex than those necessary for operational response
A representative listing of measurements made during these
monitoring.
previous projects or identified by the SNAME Panel HS-12 includes:
.
*
Bow Vertical Accelerations
*
Midship Biaxial Accelerations
*
Aft Lateral Accelerations
*
Midship Deck Stresses (longitudinal and shear)
*
Longitudinal Bending Moment Stresses
*
Shaft Torque and RPM
*
Speed and Heading
*
Roll and Pitch (period and angle)
There is even less aqreement from prior work reqardinq data processing and
One researcher suggests that in most cases relative Root Mean
presentation.
Square (RMS) values of accelerations in analog form provide adequate
information (15). Others have proposed that watchstanders should be given
comprehensive tabular data in engineering units displayed on a video display
unit (9,12). Still others contend that trend displays should be provided to
give information on whether or not a situation is worsening (25). Most
researchers recognize the need to provide accurate information which is not
misleading since it will be used in stressful situations (17). The update
rate of displays is another matter which must be given consideration.
One
5
TABLE 1
Partial Listing of Previously Completed Response Monitoring
NO. OF
SENSORS
Projects
SENSOR SUITE
REMARKS
REF.
YEAR
42
1961
Destroyer
2
Strains in strength deck port
and starboard
43
1973
Container
2
Strains in strength deck port
and starboard
44
1969
Container
6
2 bow emergence, 3 bottom deflections, 1 vertical acceleration
15
1970
Boogabills
RO/RO
3
Lateral Acceleration,
Pitch Rate
28
1973
SeaLand
McLean
SL”7
65
Research for
Vertical Bending Port and STBD
Midship Torsional Shear, Port & STBD
a New Class
Roll, Pitch, Vertical Accel. at CG
of Ship
FWD. Transverse Accel. at CG & FWD
RPM, Rudder Angle, Wind speed & direct.
Horizontal bending Port. & Starboard
Real Sidewall Shear Port, STBD & Amidships
Long. Stress Port & STBD at Deck
Level, Neutral Axis
Bottom.
Aft Shear
Deckhouse Vert. & Trans. Accelerations
After Hatch Corner Shear (12 channels)
Assorted Other Shear (14 channels),
Transverse Stress (7 channels), Transverse
Deck Girder Stress (4 channels)
Container
6
Bending Strains
J. G.
Great Lakes
6
Munson
Bulk Carrier
Forward Hull Stress, Port and STBD
Amidships Hull Stress, Port & STBD
Aft Hull Stress, Port & Starboard
SHIP
TYPE
Roll Rate,
m
45
1975
27
1976
Container
Converted from a
Research System
TABLE 1 (cent’d.)
Partial Listing of Previously Completed Response Monitoring
Projects
NO. OF
SENSORS
REMARKS
SENSOR SUITE
REF.
YEAR
SHIP
TYPE
27
1976
c. J.
Great Lakes
Bulk Carrier
6
Forward Hull Stress, Port & STBO
Amidships l-lullStress, Port & ST8D
Aft Hull Stress, Port & STBD
Lancer
Class
Container
59
Draft, Tank Pressures, Ballast Tank
Status, Hold Flooding, Bow Accel.,
Roll, Pitch, Hull Stresses
5
Vertical Accelerations
lateral Acceleration
Rol 1
Pitch
Callaway
19
1976
American
Aquarius
15
1976 1980
3 vessels
3,12
1977
Lash
Italia
Barge
Carrying
9
Long. Stress Amidships Port & STBD,
Vertical & Lateral Accel. in Forward
Deck House, Vertical Stress Fwd. of
the Deck House (3 channels), Vertical
Stress Aft of Deck House (2 channels)
27
1977
S. J.
Great Lakes
Bulk Carrier
6
Fwd. Hull Stress,
Port & STBD.
Amidships Stress, Port & STBD
Hull Stress, Port and Starboard
(2)
Converted from a
Research System
Evaluation of
Operational Monitoring and Guidance
System
4
cm%
Qualitative
Guidance
Feature
Research Project
8
1978
tlollandia Container
3.16
1980
Furman
Victory
Cargo Ship
15
Bow Stress, Port and Starboard
Bow Biaxial Accelerometers, Roll Angle
Midship Hull Stress (2)
32
1980
Burns
Harbor
8u1k
15
Bending Stress (10) FWD., Amidships & Aft,
Hatch Corner Stress (3), Vertical Accelerometer, Lateral Accelerometer
I
TABLE 1 (cent’d)
Partial Listing of Previously Completed Response Monitoring
Projects
b
TYPE
NO. OF
SENSORS
REMARKS
SENSOR SUITE
REF.
YEAR
SHIP
30
1978
Antonio
Johnson
4
Midship Stress (Port & STBD)
Forward Quarter Point Stress
(Port and STBD)
30
1978
Seal-and
Economy
3
Bow Accelerometer, Amidship
Strain Gage Bridges (2)
20
1978
SS Esso
Ilonn
19
Midship Deck Strain Gage Bridges (4),
Midship Vertical Acceleration (2),
Bow Axial Acceleration (3),
Bow F1uid Pressure Sensors (4)
Relative Ship/Sea Motion Sensors (5),1
Pitch, Roll
Research Project
39
1980
Vertical Acceleration
Research Project
21
1983
22
Tanker
(VLCC)
m
RN
Frigates (2)
Information did not
answer Captain’s needs.
Wanted “Guidance” in
Pitching and Rolling
on Bridge
Icebreaker
32
Strain Gages in Bow Structure
1985
Container
1
Single Strain Gage Bridge
22
1985
Car Carrier
8
Midship Hull Stress (3), Bow Biaxial
Accelerometers, RPM, Governor Notch,
E.M. Log
22
1985
Bulk Carrier
8
Midship Hull Stress (3), Bow Biaxial
Accelerometers, RPM, Gov.Notch, E.M. Log
24
1985
Container
Ships (2)
9
Bow Vertical Accel., Midships Vertical
Accel ., Midships Transverse Accel., Uind
Speed & Direction, Propeller Torque RPM,
Ship Course and Speed
Pierre
Radisson
Used to Aid Navigation
In Ice
recent project (21) provided updates every 4 seconds. However, operational
experience suggested that an update every 10 seconds would be more appropriate
for proper assimilation of the data. Some researchers have suggested that the
master should be provided with predictive capabilities and guidance on action
to be taken, in addition to instantaneous information on stress levels (30,
38).
Most researchers agree that a response monitor should include alert
functions. There is, however, little agreement on acceptable levels of
response or the specific measurements to be monitored (l). One researcher
recommends variable levels that can be set by individual masters based on
experience with a specific ship (17). This is consistent with the view that
alert levels should not be absolute, but instead should represent an
indication for growing concern. This approach is consistent with the
objectives of most response monitoring projects to provide information that
It also perm~ts
can be used for decision making by the navigating officer.
knowledge transfer between masters and junior officers or between individuals
experienced with a certain vessel class and those without this experience.
In an effort to resolve these varying views, a classic paper on stress and
motion monitoring for merchant vessels was presented at the 1980 SNAMESTAR
Symposjum by Chazal et al (l). From the paper and resulting discussions a
consensus seemed to emerge. What is needed is “a simple system consisting of
no more than two or three sensing devices that could be installed on different
ships”, with indicators having a common element of presentation (17). This
suggests that the SRM should have a basic configuration applicable to a range
of vessels. This configuration should support several standard sensors and
several user-specified sensors selected based on vessel type or service.
In
addition, it’should provide a capability for future enhancement on a custom
basis.
Other areas where a review of the literature provides general guidance are
reliability and maintenance, dependability with respect to accuracy,
flexib~lity with respect to sensors and sensor locations and benefit versus
Reliability in a shipboard environment is critical for several
cost
reasons. First, incorrect information could pose a safety hazard. Also,
repair capabilities will be limited and systems with even moderate failure
rates will not be readily accepted. The system must be dependable.
Should
the system fail, all failures must be graceful. That is, if failures occur
they should not result in the display of erroneous data, and the system should
provide an indication of the extent of the failure and validity of remaining
displays. This is a key factor in acceptance by operators since they must
“trust” the system. The system should be adaptable to a wide variety of
sensor locations and sensor types since measurements that are relevant on one
vessel may be of llttle value on another. Finally, the cost of the system
must be such that operating companies feel the investment is justified in
light of benefits.
●
4.
4.1
ANALYSISOF REQUIREMENTS
Major System Functions
The major system function for the standard response monitor (SRM) is
presentation of information to navigating officers which permits real-time
assessment of the potential for damage. This objective is well wfthin the
current state-of-the-art in instrumentation and computer applications.
However in the past most applications were oriented toward research, as
compared to the operations orientation desired for the SRM. The operational
aspects of the system must be the primary consideration in all decisions
regarding performance requirements and design if the system is to be accepted
by the industry.
Issues discussed in the following sections address two major areas; (1) what
capabilities should be included in the SRM and (2) how should navigating
officers jnteract with the system? Throughout the definition of these
performance factors, capabilities and flexibility must be traded off against
cost . Operating company acceptance of the SRM will be a function of cost and
perceived utility, and the cost will be a function of basic capability and the
potential for expansion. TWO questions related to cost must be addressed when
First, what is the minimum cost that will
defining performance requirements.
provide installation of a satisfactory SRM? Secondly, what will operating
companies be willing to pay for an SRM?
systems, basic equi
rnent
Given the current s~ate-of-the-art in instrumentation
that measures and d~splays up to two parameters could be installed on a sI ip
for as little as $20,000. This approach would include analog (meter) displays
and would provide little if any capability to process the measurements and
configure displays for ease of interpretation.
This approach would certainly
not meet the requirements developed by the SNAME HS-12 panel (Appendix A).
These requirements can probably be met for between $25,000 and $40,000,
depending upon the capability for expansion built into the system. At the
high end of the available range of capabilities, very sophisticated systems
could be installed for costs in excess of $100,000.
This type of system would
provide capabilities for complex calculations, highly variable displays,
expansion to a very large number of sensors and potential for application to
other shipboard computing tasks.
The price that owners should be willing to pay for the SRM can be evaluated in
several ways. First, a system that has a cost comparable to other bridge
equipment such as radar ($25,000 - $75, 000) WOUI d probably be acceptable,
provided that it is perceived to be useful. A more precise way to evaluate
acceptability of cost is to estimate the savings that could be attributed to
use of theOOOO system. Hoffman and Lewis (10) completed an analysis of cost
10
savings for a modern containers hip making 17 trans-Atl antic voyages per
yea r. They estimated the annual savings due to use of a heavy weather damage
avoidance system to be:
1.
2.
3.
Annual Savings in Repair Costs
Annual Savings Due to Lost Time
Annual Savings in Fuel
Total Annual Savings
$18,000
$75,000
$30,000
$123,000
These estimates were completed in 1975. In 1986 the total
savings would be
approximately $211,000, based on the consumer price index increases over this
time period.
This analysis assumed that the monitoring system would eliminate 67% of the
damage and that the equipment would reduce voluntary delays due to speed
reductions by 50%. These assumptions appear to be reasonable and indicate
that the cost of even a sophisticated SRM could be recovered in one year.
Considering all of the above, it is recommended that the target cost for the
basic SRM with standard sensors, user-selectable sensors and installation be
set at $30,000 to $40,000. This will provide all capabilities specified by
the SNAME panel and it will require a capital investment by the ship owner
which is similar to that required for other bridge equipment. Although based
on the analysis of savings given by Hoffman and Lewis (10) it would appear
that a more expensive system could be justified, it is felt that the
recommended target cost will result in wider acceptance by the industry.
It
must be remembered that the ability of an SRM to reduce damage by 67% and
delays by 50% has not been demonstrated, and owners are more likely to try the
equipment if the capital cost is maintained at a level where even small
reductions in damage and delays result in an economic benefit.
4.2
Sensors
As discussed in Section 2, specific sensors incorporated in the SRM should
probably vary depending on the type of vessel to be instrumented, however
previous work (15) suggests that several “standard” measurements are relevant
for most vessels. With these considerations in mind the SNAME HS-12 Panel
recommended incorporating two standard sensors and several additional sensors
to be specified by the specific operating company, depending on the type of
vessel and service. This approach provides two benefits. The inclusion of
standard sensors provides consistency from ship to ship such that navigating
officers moving from one vessel to another have familiar output available from
the SRM. In addition, these two standard sensors should provide relevant
information on any vessel, even if they are not supplemented with user
selectable sensors. The two to four user-selectable sensors can be used to
tailor the SRM to the needs of a specific vessel. These could be specified
such that known problem areas are addressed or simply to provide other desired
displays.
11
4.2.1 Standard Sensors
Performance requirements developed by the SNAME HS-12 Panel specify a vertical
accelerometer at the bow and a lateral accelerometer in the pilot house as
standard sensors for the SRM. These sensors are believed to provide
sufficient information to give an indication of the potential for the types of
damage discussed in Section 2, on most vessels. Bottom slamming, flare
immersion impact, damage due to shipping water and damage due to longitudinal
bending can be related, at least indirectly, to vertical accelerations at the
bow. Cargo shifting and fluid sloshing damage are in most cases caused by
lateral accelerations due to heavy rolling, and therefore can be related to
lateral acceleration in the pilot house.
Sensors to provide the specified acceleration measurements are commercially
available in a variety of types, cost ranges and qualities. These include
strain gage, piezoelectric and force-balance (servo) devices with costs
ranging from several hundred to several thousand dollars each. Selection of
the specific accelerometers for the SRM should be based primarily on their
ability to provide the required accuracy and reliability.
In addition, due to
possible variations in vessel sizes and types, a capability to provide
variable sensitivity is desirable. Based on these considerations, the servotype devices are recommended. These accelerometers are force-balance devices
in that they measure the current required to magnetically suspend a seismic
mass at a fixed point. As compared with strain gage or piezoelectric sensors,
these devices provide superior linearity, frequency response, cross-axis
Even at the intermediate
sensitivity, resolution, stability and reliability.
price range, servo accelerometers provide sufficient accuracy and stability
for use in inertial navigation systems, an application that is significantly
more demanding than the SRM. In addition, sensitivity can typically be
programmed such that one sensor type can be used for the complete range of
vessel types and measurements expected.
Since most of these devices were
originally designed for application in navigation systems, the designs are
rugged and suitable for operation in relatively harsh environments.
4.2.2 User-Selectable Sensors
A list of typical user-selectable sensors that could be included to tailor the
SRM for a specific application is given in Table 2. It should be noted that
other measurements or sensors are possible; however, the list given in the
table represents a fairly complete description of the types of measurements
made in the past and those believed to be relevant for response monitoring.
Roll angle is a measurement that could be used to supplement lateral
acceler~tion measurements on vessels such as containerships, R()/ROs or tankers
where cargo tiedowns or f’ uid sloshing are critical.
In addition, this would
be a relevant measurement on military vessels where operations are affected by
rolling. Roll angles can be sensed by interconnection to most modern ship’s
gyrocompasses or by using pendulums, instrumentation gyros, or vertical
reference sensors.
Pendu” urns are not recommended since accelerations can
cause errors in the measured angles. Instrumentation gyros are not subject to
these errors, they have limited life (500-1000 hours) due to moving parts.
The vertical reference sensors do not suffer from either of these problems,
but they are relatively expensive. Most roll sensors are two-axis devices and
would therefore also provide measurement of pitch angle. This measurement
12
This measurement could be used to supplement the bow vertical acceleration on
high speed or shallow draft vessels subject to bottom slamming. These sensors
would provide measurement of roll and/or pitch periods if proper analysis
routines are included.
In particular, roll period measurement can be used to
monitor changes in stab!lity and are recommended by the SNAME panel. This
measurement could also be obtained from the lateral acceleration.
Shaft torque might be of interest to provide bridge personnel with a measure
of propulsion plant loading or to give an indication of propeller racing in a
seaway. On vessels equipped with torque meters, interfacing to these would be
relatively simple. On other vessels, commercially available torque meters
could be installed, or the shaft could be strain gaged. This latter approach
would require installation of a telemetry system or slip rings. The preferred
approach would be installation of a commercially available torque meter.
Installation of strain gage arrays could be used to address a number of
potential problems. On vessels with specific local problems, such as hatch
corners or foundations, one or more strain gage bridges could be installed at
Local strain gage installations would also be useful on
specific locations.
vessels with flare immersion damage problems or for unusual cargo tie down
Arrays of strain gages can also be used to provide more direct
arrangements.
measurement of hull bending or torsional loadings. The simplest of these
would include longitudinal strain measurements at the sides of the strength
deck, near the location of expected maximum bending moment.
If desired, these
installations could be expanded to provide measurements at several
longitudinal and/or vertical locations.
On container or RO/RO vessels where tie down loads are critical, these could
be measured with load cells or inferred from accelerations.
Load cells are
available that could monitor cable tensions or compression loads between cargo
and the ship’s structure.
In addition, container dogs or other special
fasteners could be designed and built to incorporate a direct load
Tie down loads can also be monitored in an indirect manner by
measurement.
monitoring accelerations of the cargo.
If the weight of the cargo and
geometry of tie downs are known, loads can be calculated.
These could be
equipped with cables that permit installation at any desirable location.
Accelerometers could be similar to the standard sensors and would be installed
in portable enclosures such that they could be attached to the cargo of
interest.
Vessels with severe bottom or flare slamming problems could be instrumented
for more direct measurement of these loads with strain gage arrays or
deflection sensors. Strain gage arrays could be installed to monitor shell
plating loads or stiffener loads at relevant locations, depending on the
vessel design. Alternately, direct measurement of deflections in shell
plating or stiffeners could be made using linear displacement transducers.
Either of these approaches would probably require sampling rates higher than
standard measurements and some design work to insure that the installation is
satisfactory for the specific ship.
In cases where vibrations
due to slamming or machinery-excited vibrations are
of interest, these could be monitored with either accelerometers or strain
gages. Accelerometers similar to the standard sensors could be mounted as
necessary for the vibration mode of interest. Adjustment of the scale would
13
TABLE 2
SUMMARY OF USER-SELECTABLE SENSORS
Variable
1. Roll and Pitch Angles
>
Available Sensor
Interface to Shjps’ Gyrocompass
Pendulums
Instrumentation Gyro
Vertical Reference Sensor
Cost Range
(Instal1ed)
$ 1,000-1,500
1,000-2,000
5,000-10,000
15,000-35,000
2. Roll and Pitch Periods
Same as Roll and Pitch Angles
or Accelerometers
3. Shaft Torque
Interface to Existing Torque Meter 1,000-2,000
Commercial Torque Meter
10,000-20,000
Strain Gage Array
10,000-15,000
4. Local Stress
Strain Gage Array
2,000-5,000
5. Vertical Bending Moment
Strain Gage Array
5,000-15,000
6. Hull Torsion
Strain Gage Array
5,000-15,000
7, Tie Down Loads
Load Cells
Accelerometers
1,000-2,000ea
1,000-2,000ea
8. Extra Accelerometers
Accelerometers
1,000-2,000 ea
9. Vibrations
Accelerometers
Strain Gage Array
1,000-2,000 ea
2,000-5,000 ea
10. Slamming Loads
Strain Gage Array
Deflection Sensors
Accelerometer
+-
5,000-15,000
10,000-25,000
1,000-2,000
11. Vessel Speed
Interface to Ships Log
1,000-2,000
12. Heading Angle
Interface to Ship Gyro Compass
1,000-2,000
13. Wave Height Sensor
Sensor for Underway Wave Measurement Not Yet
Available
14
probably be required and sampling rates would probably be higher than those
for the standard sensors. These factors would have to be analyzed on a caseby-case basis. Strain measurements from gages installed specifically for
vibration monitoring or from other gages could also be used to monitor
vibrations.
Again, adjustment of the sampling rate would probably be
required. For certain modes of vibration such as hull bending, the standard
Sampling rate
sensors could be sampled such that vibrations are monitored.
would be increased and measurements could be analyzed to display the high and
low frequency responses separately.
In addition to the sensors described above, other relevant parameters could be
monitored by interfacing the SRM to existing ship systems. Examples would
include ship speed, heading or shaft RPM. These installations could be easily
accomplished, and could be used to monitor and reduce operating costs. Such
additions would also be valuable, for example, on vessels susceptible to
propeller racing in a seaway.
It is recommended that the SRM be designed such that any two to four of the
above sensors could be user-specified for inclusion along with the standard
accelerometers.
The design should be developed such that the device is
“configured” for these without requiring custom hardware or software. The
- system should include provisions for configurations that require higher than
standard sampling rates.
4.3
Sensor Interfacing and Cabling
All standard and user-selectable sensors require interfacing and most require
digitization of analog signals. Modularized hardware is commercially
available which permits interfacing with a wide variety of sensors, and most
of these permit installation of the hardware required for the basic system and
incremental
expansion for optional sensors. The features to be provided
include signal amplification, low pass filtering and digitization.
The system
selected should permit voltage inputs, current inputs and digital inputs such
that interfacing with other ships equipment as well as specially installed
sensors is possible.
The primary decision to be made is the location of the interfacing hardware.
This equipment could be located in the SRM console, or it could be located
near sensors or groups of sensors.
If equipment is located in the SRM
console, required excitation to sensors would be transmitted to sensors and
analog sensor outputs would be transmitted to the SRM using multi-pair cables
run from the SRM to each sensor or group of sensors. Remote location of
interfacing hardware could be accomplished using a variety of commercially
available Remote Acquisition Units (RAUS). These small, stand-alone, modular
units could be installed at locations near groups of sensors to provide
interfacing with one to several dozen sensors. The RAUS provide signal
conditioning and digitization of data under control of a dedicated
microprocessor.
This data would then be transmitted serially to the SRM
console on the bridge. RAUS are well suited to applications where a number of
sensors are clustered at areas remote from the main computer.
15
Considerations in selecting the location for interfacing hardware include
cost, expected number of channels and sensor locations, computing power
available in the SRM, cabling requirements, space requirements in the SRM
console, signal quality, system reliability and maintenance, and power at
Based on requirements developed in the previous sections,
remote locations.
the SRM will include up to six sensors located primarily in the bow, on the
bridge and either amidships or in engineering spaces. Cabling can be a major
expense; however, installation of a cable for one or two analog signals
(interfacing hardware in SRM console) is no more expensive than installation
of a cable for serial digital signals (RAU at sensor location).
Installation
of a large cable for many analog signals or multiple cables to a large number
of locations would however be significantly more costly.
For the basic system, space in the SRM console is not an issue, however if
space must be provided for interfacing equipment necessary for all possible
system expansions, a much larger console would be required. Another
consideration is transmission of analog data in a noisy environment.
If
cables are properly shielded and only high level signals are transmitted,
analog cabling to the SRM console will be acceptable.
Low level signals would
be subject to degradation due to long cable runs. If RAUS are installed at
remote locations system reliability will be affected and maintenance will be
complicated, since electronic equipment will be located throughout the ship.
Computing power Is not really an issue in the decision to locate interfacing
hardware in the SRM console since the main processor must either digitize
sensor data or communicate with the RAUS. The primary tasks that will be
required from the SRM processor are data conversion and generation of
displays, which must be completed in either case. This assumes that the
Remote Acquisition Units are basic interfacing and digitizing units, rather
than Remote Processors which complete calculations and transmit formatted data
for display. The more sophisticated units would cost between $4,000 and
$8,000 each as compared to approximately $700 each for the basic RAUS and
could be used to add computing power to the system. Even with the most basic
processor in the SRM, this would not be required unless extensive expansion is
necessary.
For the basic SRM, installation of interfacing hardware in the SRM console is
recommended since a small number of sensors are located at widely separated
areas of the ship. The cost of cabling would be similar with or without RAUS,
and the cost of the RAUS would add to the installed cost of the system. Since
modular signal conditioning that could be used in the SRM console typically is
available in units capable of 16 channels, the approach of keeping all
electronics in the console would permit expansion to at least this number of
sensors with no increase in console size. If future enhancements require
expansion beyond this number of channels , or if these result in a large number
of sensors grouped at specific locations, the use of RAUS should be
considered, primarily as means to reduce cabling cost and space required in
the SRM console.
4.4
Functions in Addition to Response Monitoring
It has been suggested that other capabilities, in addition to response
monitoring, might be built into the system. TWO primary motivations exist for
including additional functions. The first of these is the possibility that
16
navigating officers will accept the system more readily if additional, useful
functions are provided. The second is related to additional justification of
the cost. Ideas which have been suggested include:
1.
2.
3.
4.
5.
Text display for steaming orders or short messages/reminders.
True wind calculator.
Capabilities built-in to provide guidance.
Loading Calculator
Administrative functions such as complete word processing,
bookkeeping or inventory.
Any of these functions could be included.
However they affect system
complexity and cost to varying degrees. Simple message displays could be
implemented on almost any machine capable of monitoring function, but this
would require a keyboard. A capability to calculate true wind speed and
direction from apparent wind, ship speed and heading input by navigating
officers, would be useful and could be easily implemented.
Guidance could
take many forms ranging from a simple system which the operator could query
with “what if’s” to complex systems that recommend action. The simplest
system could again be implemented on most machines but more complicated
systems require additional computing power and elaborate software
In addition, these systems are typically ship specific, and are
development.
therefore not consistent with the concept of a generic SRM. The loading
calculator interface and administrative functions would require software and
computing power which is completely different from the monitoring function.
These administrative tasks could best be completed using a desktop computer
with commercial applications software.
In addition to cost and complexity, provision of additional functions will
affect the way the system is viewed by navigating officers and the ease with
which it can be used. If the system begins to take on the look and functions
of a desktop computer, it will not look like a piece of bridge equipment and
will then probably not be used as such. Also, the provision of a complete
keyboard, disk drives, printer and applications software will increase the
knowledge that an operator must have to use the system. This would be totally
different than a system which requires pressing function keys or turning
selector switches to operate.
Based on the above, it is recommended that the SRM be configured as bridge
equipment and that capabilities be limited to bridge functions. The display
of messages is not recommended since this would require a full keyboard and
the unit would then resemble a computer. The true wind calculator poses no
problems and can be included in the SRM. At this time. cluidance capabilities
should not be included, but should be considered as a fu~ure enhancement.
The
loading calculator interface could also be included as a future enhancement.
Other administrative functions are not recommended.
4.5
Packa~in~
The princi~al issue to be addressed is the tvQe of console s~ecified for the
SRM hardwa;e on the bridge. The key require~ent is that the’ system must look
like ship’s equipment rather than a computer system. Based on recom=ations
in the previous sections, the hardware could be packaged in an enclosure as
small as 22” x 18” x 13”. This size would be similar to other bridge
17
equipment such as LORAN C and SATNAV equipment, and would permit flexibility
in location such that the equipment could be mounted from overhead, placed in
a standard deck mounted console or mounted on a table or shelf. There are
advantages and disadvantages for each of these options including space
requirements , visibility, ease of service and access to controls. The type of
mounting could in fact be left to the preference of a particular operating
company.
Other considerations related to packaging include interfacing with the ship
The SRM must be compatible with shipboard electrical
and maintenance.
systems. The power supply should include an uninterruptible power supply
(UPS) and should be capable of being configured for alternate voltages and
The packaging should be designed for ease of access for service,
frequencies.
and provisions for “board swap” repairs should be provided.
The recommended approach for packaging is to provide an enclosure for the SRM
that is as small as is practical and can be mounted from the overhead or
inside a deck console. Both of these arrangements should be evaluated during
the prototype testing. The system must be compatible with shipboard
electrical systems and must include a UPS.
4.6
Display Methodologies
Performance requirements developed by the SNAME HS-12 Panel specify a video
display unit for the SRM. The exact format of displayed data is therefore
completely flexible at this time. The questions to be addressed during
definition of performance requirements are (1) would a color display be
worthwhile and (2) what displays should be included in the basic unit. Use of
a high resolution color display rather than a monochrome display will increase
costs by approximately $1,500 to $3,000 per unit. This must be evaluated in
light of the advantages and disadvantages.
Typically, a well designed color
display provides the user with an improved capability to assimilate
information quickly, and attention Is quickly directed to alerts or changes in
status. In the case of the SRM these features are thought to be valuable in
light of the fact that the system will be most useful during stressful
situations.
On the negative side, colors must be carefully evaluated to
insure good visibility in both bright sunlight and bridge night lighting.
Also, since color displays are not typical on most ships, the use of color may
cause the SRM to be perceived as not being standard shipboard equipment.
The manner of presentation will be equally important to the usefulness of the
system. Options include display of numerical data, graphical data, data in
engineering units or “normalized” data. Typically, a simple bar chart type
graphical display is the most quickly understood.
However, for certain types
of measurements the navigating officer(s) may need numerical displays to
improve resolution. Similarly, some navigating officer(s) may find data in
engineering units valuable. The specifications given in the SNAME HS-12
Performance Requirement provides for all of these capabilities and would allow
navigating officer(s) to select the formats that are most useful. These must
be implemented with ease of understanding and usefulness given primary
consideration.
18
The recommended approach for displays is to provide a number of displays that
can be selected by an owner or operator. These must be kept simple with the
Any alerts provided in the displays should
most meaningful data highlighted.
be configured such that masters set the alert levels. The SRM should at a
minimum include a high resolution monochrome display with brightness and
However, during development, software should be written
contrast controls.
This should not require
such that color can be added as a future enhancement.
additional effort during development of the prototypes.
4.7
Centrals
Two primary requirements for controls are ease of use and simplicity. The
basic requirement is that actions by the navigating officer prior to use
should only include turning the power on. The approach proposed by the SNAME
HS-12 Panel includes the use of function keys and rotary switches for all
Such an approach provides single key press or switch
operator controls.
control of all functions, and the keys are labeled such that the navigating
officer does not have to remember a sequence of commands. This will provide
interaction with the navigating officer similar to other bridge instruments
such as LORAN or SATNAV units. One feature which should also be included is
provision of diagnostics such that the validity of displays can be assessed.
The exact layout of the control panel should be carefully designed using human
engineering principles to insure that it can be easily learned and used.
Still, an infinite number of possibilities exist and the only final evaluation
may come during actual use.
The SRM desjgn should proceed in a manner that keeps the control panel as
mockups of several
simple as possible. During the Phase II fabrication,
control arrangements should be reviewed by the Project Technical Committee and
at least one mariner prior to finalizing the design. The final design should
permit control of any function with single key presses or by selecting a
switch position , and controls should be included that permit testing the unit
for proper operation.
4.8
ComDuter and Perir)heral Selection
The selection of a specific processor for the SRM is not really a performance
requirement but rather results from the performance requirements.
The
objective should be to use the most inexpensive system that will meet the
performance requirements and will provide reliability and maintainability.
A
large number of systems are available which would satisfy any of the levels of
performance and expandability discussed above. Several have been selected for
consideration and these are summarized in Table 3. Included are systems that
satisfy basic requirements and provide for various levels of expandability.
All of these units are available in a form suitable for installation in an
instrument, and parts and service are available worldwide.
In addition, most
have been successfully used in shipboard applications.
If the recommendations given in the previous sections are accepted, any of the
processors considered would provide adequate performance.
It should be noted
at this point that two approaches to providing any of the processors discussed
in the table are available. These include adapting an existing computer such
19
as an IBM PC to the SRM, or basing the system on industrial measurement and
control equipment. This latter approach provides a large selection of
processors and interfacing equipment in a convenient modular system designed
for use in measurement and control applications.
Table 3 also provides information on capabilities for adding future
enhancements.
Even the least capable processor would permit expansion to up
to 32 channels at a 20 Hz sampling rate or increases in sampling rate up to
200 Hz for six sensors. These could be achieved without additional processing
If capabilities
for expansion of the number of sensors or use
capabilities.
of sensors requiring sampling rates greater than these must be provided, then
the three more expensive systems should be considered or RAUS should be
If word processing and administrative functions are desired, the
included.
IBM PC system would provide the widest range of applications software. The
major difference between the two least expensive systems is the capability to
provide adequate guidance capabilities as a future enhancement.
This is
thought to be an important enhancement based on previous response monitoring
projects and the 8-bit processor should, therefore, be eliminated from
consideration.
It is recommended that the system be designed around one of the commercial
measurement and control bus systems using an 16-bit processor. This is the
most cost effective approach and provides hardware that is designed for
All basic system capabilities
operation in an industrial environment.
recommended in the previous sections could be achieved with this hardware and
most future enhancements, including guidance, would be possible. Software
should be developed such that it is transportable from one processor to
another to permit future manufacturers to base the system on hardware that
they routinely use in their instrumentation.
This could be achieved by
programming in the “C” language, standard FORTRAN, or PASCAL. The basic SRM
should include provisions for communication with other devices such that
future enhancements beyond the installed capability could be provided by
Interfacing with RAUS or other computer systems.
4*9
Summary of Cost Implications
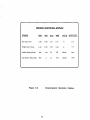
Table 4 provides a summary of the cost implications associated with all of the
options discussed in the previous sections. These are approximate since
complete specification of every system Is not possible at this time. Relative
costs should however be meaningful.
The basic system costs assume that user
selectable sensors are a pair of strain gage bridges or additional
These would increase if the more expensive user-selectable
accelerometers.
sensors are selected (see Table 2 for cost ranges). The cost of future
enhancements varies depending on the processor selected. Guidance requires
software development in all cases, and a capability for simple text requires a
keyboard and elementary word processing software. Administrative software
would be purchased and would require a keyboard and disk drive(s).
Loading
calculator software could probably be purchased for the IBM PC or HP 9816
machines; however, purchase and translation would be required for the others.
20
Oooc
Cogo
00
00
z
0“
=J-
wow
“m
Ln
0
K
0
0
0
c
0
0
o
0
m“
m“
m
o
0
0
m
.
m
o
0
0
o
0
0
.
m
m
4
e
N
0
0
o
0
0
m
o
0
0
U-J
*
#
.@
I
“u
z
*
1
1
I
a
H
21
al
L
Summary of Recommendations
4.10
The key issues addressed in the previous sections are definition of
requirements for an SRM, provisions for expandability of the SRM which should
be included, use of the system for purposes other than response monitoring and
cost implications due to these. Principal conclusions are as follows:
1.
The basic SRM with a capability to monitor and display data from up
to six channels can be achieved within a budget of approximately
$35,000 per unit , including installation.
2.
The true wind calculator should be included in the basic SRM.
3*
Display of simple text messages should be considered to be a future
enhancement since provision of a full keyboard is not recommended.
The units should be capable of communicating with terminals, other
shipboard equipment, or other computers to permit future enhancements.
4.
More elaborate additional features such as administrative software or
a loading calculator would significantly add to system cost and complexity and are not recommended for the basic SRM.
5.
Expandability beyond the six channels discussed above. up to a
certain limi~ing- number of channels, is possible with-any of the
systems reviewed without a requirement for additional processing
power. Additional capabilities could be provided in any system by
using distributed processing as the system became more complex.
There are limitations to this in terms of update rate for screen
displays.
Based on a review of past work and analysis of alternate performance
requirements the following recommendations are offered:
1.
The primary objective of this project should be to produce a design
which is accepted by the industry. This will require continued focus
on COST, PERCEIVED UTILITY, and SIMPLICITY.
In addition, the SRM
must be perceived as a bridge instrument rather than a computer
system. This leads to the recommendations that additional functions
not be included, packaging should be very carefully reviewed and
controls should be designed similar to other bridge instruments.
2.
With respect to detailed design, adherence to the Performance
Requirements developed by the SNAME HS-12 Panel, included in Appendix
A, is recommended with the following exceptions:
a.
During Phase 11 several mockups of the controls should be built
and reviewed with’ the PTC and at least one mariner.
b.
Alternate packages (desk console and overhead console) could be
included in the three prototype SRMS. It is hoped that both of
these can be evaluated.
22
3.
The display methodologies given in Appendix A should be used with the
exception that minor changes should be implemented as problems are
noted during software development.
Critical review of displays
It is hoped
should be a primary objective of the at-sea testing.
that the use of color in displays can be evaluated on at least one of
the prototype units.
4.
One of the two least expensive processors discussed should be
selected for detailed design. Either of these will provide adequate
capability for the basic SRM and some expansion capability.
23
5.
5.1
HARDWARE SPECIFICATION
General Description
The Standard Response Monitor (SRM) system design developed based on
requirements discussed in the previous sections uses current sixteen-bit
The computer system is based on the standard (STD)
microprocessor technology.
measurement and control bus system. The concept of using a standard
industrial measurement and control bus such as the STD bus provides a large
selection of off-the-shelf components, modular design and components designed
for application in harsher environments.
Components selected for the system
are all complementary metal-oxide semi-conductors (CMOS) to provide low power
consumption and heat generation, high ambient noise immunity and reliability.
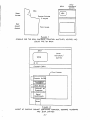
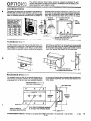
The SRM package can range from a self-contained desktop or overhead mounted
unit to a free standing console. Total system weight (excluding transducers
and Uninterruptible Power Supply) should be less than 30 pounds. Stand alone
system dimensions should be approximately 22”W x 18”D x 13”H.
Two standard acceleration sensors for the SRM system will be packaged in
weather and oil tight NEMA-4X enclosures.
Each accelerometer enclosure will
measure approximately 6“W x 6“D x 4“H and weigh approximately 4 pounds.
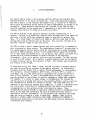
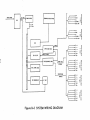
Figure 5.1 shows a functional diagram of the SRM system as implemented on the
STD bus system. This system is easily expandable from the six channel base
unit to 16 channels, and may be expanded to 32 channels with additional
boards. The following sections provide specifications for hardware. Appendix
B includes the following drawings:
B-1
B-2
B-3
B-4
Preliminary Console Drawing
Preliminary Console Assembly
Wiring Diagram
Parts List
Manufacturers’
Appendix C.
5.2
.
specifications
for major system components are included in
Rules, Regulations, Codes and Standards
.
The eq~jpment
and materials
shall
be designed,
manufactured,
inspected
and
tested in accordance with the Classification Society, regulations, and codes
or standards as specified herein.
Classification Society:
American Bureau of Shipping, Rules for Building and Classing Steel
Vessels, current edition.
24
Regulations:
U.S. Coast Guard
Codes and Standards:
IEEE-45 Standards and Practices.
Electronics Engineers
Institute of Electrical and
Standards and Practices, Instrument Society of America
UL 1012 Power Supplies, Underwriters Laboratories
UL 478 Electronic Data Processing Units and Systems, Underwriters
Laboratories
National Electrical Manufacturers Association
(NEMA)
C.SA 22.2 No. 154-1975 Data Processing Equipment, Canadian Standards
Association
IEC 435 Safety of Data Processing Equipment,
Technical Commission
5.3
International Electro-
Sensors
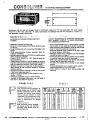
The basic SRM system will include a capability for six sensors. These include
the two standard sensors, vertical bow accelerometer and transverse bridge
accelerometer, and up to four user-selectable sensors. Servo type
accelerometers have been selected for standard and user-selectable
acceleration measurements due to their overall reliability and resolution.
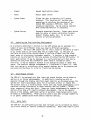
Specifications for these accelerometers (Sundstrand Data Control Model QA1200) are as follows:
2 g (can be changed for different
applications
Nominal Range:
Non-Linearity:
0.05% of full scale
Natural Frequency:
100 Hz
Hysteresis:
0.22% of full scale
Resolution:
0.0005% of full scale
Cross Axjs Sensitivity:
0.002 g per g
Damping Ratio:
0.6 typical
Operating Temperature:
-55° c to 95° c
Shock Survival:
100 g for 11 ms
25
A test coil
offsetting
unit. This
control and
is also provided on the accelerometers for the purpose of
the accelerometer against gravity in the case of the vertical
test coil is also used for testing the accelerometers from the
display unit by inducing a known current into the coil.
The list of user-selectable sensors given in Table 2 includes strain gages,
additional accelerometers and roll/pitch sensors. Strain gage bridges will be
configured depending on the specific application using AILTECH SG 158 weldable
gages. These gages are hermetically sealed and have the following
specifications:
Rated Strain Level
+ 20,000 microinches per inch
Nominal Gage Factor
1.9
Maximum Excitation Current
50 ma continuous
Temperature Range
Oto
Static Acceleration
50 g
Sinusoidal Vibration
35g,
Shock
100 g, 7 millisecond duration
Active Gage Length
0.21 inches
180 degrees F
2oto
2ooocps
The recommended approach for measurement of roll and/or pitch is to interface
the SRM to existing ship’s gyrocompass when possible. This would be
accomplished with complete isolation such that operation or failure of the SRM
would in no way affect the gyrocompass.
The Datawell Hippy 120 vertical reference unit is recommended for userselectable measurement of roll and pitch if interfacing to the ship’s
gyrocompass cannot provide these measurements.
This unit has indefinite life
and is not subject to errors due to accelerations.
In addition, it is
considerably less expensive than other sensors with these features.
Specifications are:
Pitch and Roll Range
+ 60 degrees
Linearity
0.05 degrees up to 5 degrees
0.15 degrees up to 30 degrees
1.0 degree
Stability
<1 degree over 1 year
Zero Offset
<0.5 degrees
Operating Temperature
o - 35 degrees C
Vibration
c16 Hz - 1 mm peak amplitude
>16 Hz - 1 g max acceleration
26
Other user-selectable sensors, such as torque meters will be selected on a
case by case basis and complete specifications can therefore not be provided
at this time.
5.4
Signal Conditioning and Conversion
Analog signals from the accelerometers and other selected sensors will be
processed by the signal conditioning card on the STD bus system. This card is
capable of amplifying and filtering up to 16 discrete analog input channels.
Each input channel may be individually amplified at gains ranging from 1 to
1000. Similarly, each input channel is individually low-pass filtered at cutoff ranges ranging from 0.1 Hz to 10 kHz. Specific gains and filter
frequencies will be set at the factory depending on the sensor suite and type
Typical gains and cut-off frequencies are
of vessel under consideration.
given in Table 5.1. The basic SRM system will be configured with only six of
the possible 16 channels active.
After analog signals are amplified to + 10 vdc and filtered, they are passed
The unit
via ribbon cable to a 12-bit analog to digital (A/D) converter.
selected has resolution of 0.024% and accuracy of + 0.032%. It is capable of
accepting 16 inputs and can convert data at rates up to 5000 channels per
second.
5.5
Interfacing and Cabling
Cabling to each of the accelerometer packages is accomplished with a single
eight conductor shielded cable from the SRM display unit to the sensor
Mil-Spec type connectors will be provided on the rear of the SRM
enclosure.
display for this purpose. A similar waterproof connector will be provided on
each of the accelerometer enclosures.
Interfacing and cabling to the user-selectable sensors and any optional
sensors will be similar, although certain sensors will require wiring
different from that required for the accelerometers.
As an example, strain
gage type sensors would again require an eight conductor shielded cable run
from the SRM display unit to the strain gage junction box location.
However,
connections would be different.
Interfacing to various ships sensors such as
LORAN or NAVSAT will require the addition of a serial interface card to the
SRM computer.
Interfacing to other ship systems could require simple two-wire
In all
voltage or current connections or addition of frequency counters.
cases, isolation must be provided when the SRM is connected to ship systems.
The approach taken for cabling is specification of one type of cable and
connectors, to be used with any sensor. Wiring at the sensor junction box and
in the SRM will then be varied depending on the sensor requirements.
5.6
Control and Display Console
All of the system components except the transducers themselves are housed in
the display console.
Included in the console are the STD bus computer system,
the keypad interface, the CRT display, and the system power supply. Included
27
TABLE
5
Typical Sensor Interfacing and Sampling Requirements
Sensor
*
Signal
Conditioning
1. Standard
Accelerations or
Cargo Accelerations
Servo
Accelerometer
+ 10VDC
* 15VI)Csupply
2. Hull Stress
Strain Gage
Bridge
1 Active Gage
2 Act. Gages
3 Act. Gages
+ !3nV
* 7.5mv
i lm’lv
+5VDC Excit.
+5VDC Excit.
+5VOC Excit.
Sensor
Measurement
N
m
Required
Gain
Filter
m
Sample
Rate
1
2
10
2000
1300
1000
;
::
;
;:
3. Pitch & Lo-Roll
Hippy Vert.
Reference
A 10VDC
A 15VDC
1
2
10
4. Shaft Torque
Accurex
k 5VDC
None
2
2
10
5. Vibrations
A 10VDC
a. Acceler.
b. Strain Gage +2.5mV
c. Act. Gages
1
100
500
500
+15VW SU~P~Y
k 5VOC Excit.
4000
100
Comments
Assumes 30,000 psi stress
(1000 E) full scale
(1000 E) full scale
Assumes 10,000 psi stress
(333 E) full seal e
1
Assumes 2-pole Butterworth filter with 6 db/octave
2
Specific values for gain and filter frequency will be specified based on the specific requirements
measurement and vessel.
roll- off; specified frequency is “Corner” (-3db) frequency
of the
in a recessed area on the back of the enclosure are the power sensor,
printer/terminal, and external display connectors.
The SRM enclosure is designed such that it can be mounted in any of three
First, providing that 13 inches of vertical rack space is
configurations.
available, the system may be mounted in an existing standard 19 inch rack
cabinet. Secondly, the system may be mounted hanging from the overhead or
table bottom on its gimbal style mount. Thirdly, the system may be mounted on
any existing table or console space, again on its gimbal style mount.
The control and display console will provide the following functions
accessible to operating personnel:
Controls for power up/down, CRT brightness and contrast, keypad back
lighting dimmer
Numerical data entry keypad
Function keypad for selecting major system operations
Visual alerts when selected levels exceed pre-set values
True wind calculator to calculate true wind speed and direction from
user input data
Display of sensor data and statistics in alphanumeric and graphical
formats
Display current ships time
In addition, the following controls are provided for use by factory and
service personnel:
System set-up menu for setting default operating parameters such as
sensor calibration data, data display options (i.e. 0-10 scale or
engineering units, RMS and peak values etc.)
D.agnostic functions to identify component failure or malfunction
The CRT wi” 1 be non-glare, monochrome, green, unless color specified, and
capable of graphic representation of data and flashing or highlighted
The design will include a 13 inch (diagonal)
characters for alert conditions.
CRT . This size was selected to minimize the size of the SRM console, and
Graphic displays and alerts will be
still prov de adequate visibility.
visible as far away as 20 ft and all data will be legible at a distance of 8
ft. The size of the CRT does not affect resolution For graphics or number of
approximately 6 minutes in the event of a power failure. This period may be
extended with the addition of an external battery. This time period will
permit the SRM to power down gracefully, and then restart with the same
displays and memory condition that existed prior to loss of power.
5.7
Operator Controls
Controls for the SRM system have been modeled closely after those outlined in
Appendix A. All of the controls except the CRT brightness and contrast,
keypad dimmer and ON/OFF power switch are implemented in the form of a custom
designed membrane switch keypad. The keypad is translucent and will have
incandescent backlighting controlled by a dimmer. Feedback of key presses
will be in the form of an audible beep with each keystroke. Each of the
switch pads on the key pad will have its function printed on it and in the
case of major functions a graphical symbol depicting the function will be
included (i.e. a “wind sock” for the true wind calculator mode). Extra switch
pad area will be designed into the standard keypad to accommodate additional
sensors or the expansion of the SRM system functions at a later date. Though
on “standard” units this extra switch area will appear as blank panel space,
switch “zones” will only be printed if used. The following is a list of
standard operator controls and a brief description of their operation:
.
Vertical Bow:
Displays bow vertical acceleration data
Transverse Bridge:
Displays bridge transverse acceleration data
User Sensors (up to 4):
Displays data for a particular user-selected
sensor. Up to four of these can be included and
the keypad would be labelled with the actual
sensor descriptions.
True Mind:
Accepts user input ships heading and speed, and
apparent wind direction and speed, then displays
corrected (true) wind direction and speed
Alert Set:
Allows user to define alert levels
Clock Set:
Allows user to set real-time system clock
Alpha/Graphic:
Allows user to select between graphical and
numerical data
.“
Long:
Sample length selector for 15 minute sample
Dimmer:
Keypad backlighting dimmer
Power:
Master power switch
System Check:
Allows the user to execute a full system
perform such
checkout. This function will
operations as calculate the checksum of the
system ROM, execute a RAM test, check the
transducer operation. Can be used by operator
when system malfunction.is suspected.
System Set-up:
Password protected function. Enters menu driven
mode for entry of sensor calibration factors,
default display modes, etc. To be used by
factory or service personnel.
5.8
Packaging and Ship Interface Requirements
- As previously mentioned in Section 5.1 the SRM system may be packaged in a
number of ways and different ships may require different packaging
requirements.
The basic SRM system can fit into a space or enclosure as small
as 22 inches wide by 18 inches deep and 13 inches hi h. In the case of
available existing ships console space it could be s7ipped into the blank
panel space of an existing instrument console.
If desired, a free standing
console can be provided for the sole purpose of containing the SRM system. In
other applications it may be packaged in a self-contained unit that may be
mounted and hung from the overhead or shelf above a navigation table.
Similarly, it may be pedestal mounted on the navigation table or other flat
space. One possible package arrangement is illustrated in Figure 5.2. Note
that this design is preliminary since several mockups are to be prepared and
evaluated during Phase II, prior to finalizing the design.
5*9
Input/Output Devices
The SRM will be equipped such that input and output devices can be added as
options or as future enhancements.
In addition to interfacing with an
operator through the display and front panel controls as discussed above, the
system will have input/output ports for an optional printer or remote CRT.
The printer port is a hi-directional serial port and future enhancements could
therefore include interfacing to other external devices (LORAN C, SATNAV,
other computers) using this port. These are future enhancements as opposed to
Due to the modular
options since they will require software development.
nature of the system, additional serial or parallel input/output ports could
be added as enhancements.
These could be used to add data storage capability
or to permit communication with several external devices.
5.10
Spare Parts
The SRM will be configured such that most failures can be corrected by replacing circuit boards or certain transducer assemblies. Board swap repairs could
31
mu eonw PUTE—. NW,s
,r
&
18,00:00
,“
18:1$:00
1’
,,
1’
18,30,00
,
.
‘
!4!45 :00
m
1’
.~
10:00,00
1’
1’
.,
m
SAMPLE
LENGTH
1’
19:i5:oo
,“,IJ
[9:30:00
19:45!00
\
?O:OO
:00
?0:15:00
.
.!
‘
0
m
,
BRIGHTNEW
1’
00
m
0,s
G
Figure
00
-RAST
GO
1’
.!
s
1’
, v
?
w
5.2
Preliminary
.
32
m,
Console
—
Layout
FOwlm
be completed on the SRM console by any qualified electronics technician.
Standard transducers and other transducers mounted in packages could be
replaced in a similar manner. Sensors such as strain gages would require
special installation and would therefore have to be replaced by specialized
personnel. Since board swap repairs are possible, and parts could be
delivered to a vessel at almost any port within 48 hours, spare parts are not
The system will be designed such that if a failure occurs, the
recommended.
For transducers, a single failure would be noted on
SRM will fail gracefully.
the display and other sensors would continue to operate normally.
In the
event of a processor failure, internal diagnostics should detect the problem
and notify the navigating officer that data is erroneous.
The electronics components to be used in the SRM console have extremely good
reliabilities, with typical mean time between failure (MTBF) ranging from 30
to 40 years. Standard accelerometers have an approximate MTBF of 10years and
strain gage installations using the sealed, weldable gages typically have a
MTBFof 5years.
If a system was configured with 2 strain gage bridges in
addition to the 2 standard sensors, the overall MTBF would be approximately 2
years for the entire system and 6 years for the console electronics.
During
the evaluation of three units in Phase II, any failures that occur will be
carefully analyzed and problem parts will either be replaced or spares will be
provided.
5.11
Testing and Support
Achieving satisfactory reliability of the SRM will be dependent on the testing
procedures employed, as well as the reliability of system components.
At the
beginning of Phase 11, a quality assurance procedure will be prepared which
specifies testing to be completed on each unit. Tests will include acceptance
tests of incoming components, burn-in of the entire system with temperature
cycles, and a final system acceptance test that checks operation of all
components and features. Each unit delivered will undergo all tests and logs
will be maintained on each unit’s history.
Manuals to be delivered with each system will include:
1.
User’s Manual
2.
Software Documentation
3.
Service Manual
The User’s Manual and Software Manual are described in Section 6.5. The
service manual will provide all information necessary to understand system
configuration, troubleshoot problems, and make any necessary repairs. It will
include a complete wiring diagram, part numbers and vendor service contacts,
and procedures to be used when replacing parts or diagnosing problems. Each
set of manuals will be configured with the documentation appropriate to the
specific sensors and options used on a particular vessel.
In addition to instructions and the tutorial included in the User’s Manual,
training courses will be conducted for ship’s personnel upon completion of
each installation.
These will include approximately 2 hours of class-room
33
type instruction and 2 hours of demonstrations using the SRM. In addition,
during voyages, instructor/observer staff members will provide continued
review and explanation of course materials and principles of use for the
SRM . Ten sets of course notes will be delivered to each ship. In addition to
features and operation of the 5RM, the training course will include a review
of how the system can be used to aid shiphandling in heavy weather. This will
be based on course materials developed by Lindemann [41].
34
6.
6.1
SOFTWARE
General Description
Software
developed for the SRM should meet three basic requirements.
First,
it must be invisible to the navigating officer such that he only has to turn
on the power to start system operation, and all functions are available with a
key press. Secondly, since the systems include user-specified sensors and
some future systems may include optional sensors, the software must provide
built-in capabilities for flexibility in the number and type of sensors
Finally, to permit transportability of software to
scanned and in displays.
different hardware that the eventual manufacturers may use, source code should
be written in a standard high-level language such as FORTRAN 77, C, or PASCAL.
Software should be modular and contain two basic packages or routines. The
supervisory package will control system initialization and self-test on
startup, and will then monitor the system control panel and call the
Applications
appropriate applications to complete the requested operations.
software will consist of all subroutines necessary for data co” lection,
calculations and display generation. The approach in software development
will be such that software is not ship or application specific
6.2
Supervisory Software
Supervisory software will control system operation.
On power up the software
will perform a self-test of memory and sensors , and will report any faults on
the display. The system will then be initialized to provide the default
display and data collection and display will be initiated.
From this point on
the software will execute a loop which collects one scan of data, checks the
keypad for a key press, and updates the display as necessary.
If a key press
is detected, the supervisory software will call the subroutine necessary to
respond to the keypress and then return to the normal operating loop. In
addition to checking for a key press, the system will also monitor the
external device connector to see if any commands are generated from an
external keyboard or other device. This feature will be included to permit
future expansion for operation with a keyboard or other external device and to
permit special diagnostics by service personnel.
35
Applicati oris Software
6.3
Application software will consist of a library of routines that execute all
system functions and provide the appropriate response to all operator
commands.
An abbreviated listing of these includes:
*
Sample all channels at the specified rate and store readings
*
Convert readings to engineering units
*
Calculate Max, RMS, and normalized values
*
Format Displays
*
Calculate true wind
*
Modify system setup when requested with proper password
(service personnel)
*
Modify alert levels (master or navigating officer)
*
Set the real-time clock
*
Perform ’system self-test
*
Communicate with an external device (RS-232)
The software must be designed such that the system can be configured for any
of the proposed sensors. Also, software should be truly modular such that
future manufacturers can add or change functions simply by adding an
application module and changing several lines of code in the supervisory
software.
6.4
.
Displays
Two basic types of displays will be provided and several optional formats will
be available for each. The basic graphical display is illustrated in Figure
6.1 for several sensors. This example assumes that the user-specified sensors
are bending strain amidship and strain in a bow bottom plate. This will
include a bar-chart time history of any channel selected by the operator along
with a simple statistical summary of all other channels. The values can be
displayed in engineering units or normalized (0-10) values. Also, the
‘displays-will show both peak and RM5 values.
If alert levels set by the
navigating officer are exceeded these will be indicated on the display. The
period of time which the display is based on is operator selectable and can be
15, 5or 1 minute.
Figure 6.2 illustrates the numeric display. This display includes statistics
for all channels for the previous sample period.
It also includes a listing
of the alert levels. This display will be useful when a navigating officer
wants a complete description of the previous sample period or when a sensor
malfunction is suspected. All displays will include other pertinent
information such as system time and the sample period currently in use. If
system or sensor errors are detected, an error message will also be displayed.
36
SENSORSUMMARY
BOW VERTICAL ACCELERATION
Alert Set
Time
,-.—
18:00:00
I
b.
i,
i,
h.
1.
1,
i,
,
,
18:15:00
,
,
18:30:00
*
18:45:00
19:15:00
RMS:
,
.
,
,
,
,
,
,
*
,
,
*
,
,
,
*
h.
i“
1,
1,
1.
19:30:00
1,
1,
4.
19:45:00
20:00:00
1,
1,
14
i,
h,
1,
1,
20:15:00
0
1.0
0.5
G
Sample Period: 15 Min
Figure
6.la
10123186
20:17:54
Bow Vertical
)
BendingSwain
)
[
Midship
I
Peak: 225 uStrain
RMS: 135 uStrain
~
Bow Bottom Plate Strain ~
I
Peak: 225 uStrain
RMS: 135 uStrain
I
I
EEEJ
Acceleration
Trend
Chart
SENSOR SUMMARY
BRIDGETRANSVERSE ACCELERATION
Alert Set
Time
0.49 g
EErl
1.
6
19:00:00
r
18:00:00
18:15:00
m
m
18:30:00
18:45:00
19:00:00
19:15:00
~ Midship Bending Strain
1
Peak: 225 uStrain
RMS: 135 uStrain
19:30:00
19:45:00
20:00:00
]
J
( Bow Bottom Plate Strain )
Peak: 225 uStrain
RMS: 135 uStrain
I
20:15:00
o
1.0
0.5
I
G
Sample Period: 15 Min
Figure
6.lb
10123186
Bridge
.
37
20:17:54
Transverse
G&23&_)
Acceleration
Trend
Chart
T
SENSOR SUMMARY
MIDSHIP BENDING STRAIN
Alqt
Time
18:00:00
18:15:00
18:30:00
18:45:00
i
,
,
,
‘---,
,
,
Set
c
,
.
.
,
,
.
.::li
,
19:00:00
19:15:00
K
,
19:30:00
19:45:00
-i
20:00:00
,
,
,
,
,
.
.
.
.
.
20:15:00
0
500
MICROSTRAIN
Sample Period: 15 Min
Figure
:
1 0/23/86
6.lc
1
E
!OOO
E
20:17:54
Midship
Bending
-,
Strain
Trend
Chart
SEN60RSUMMARY
BOWBOITOMPIATESTRAIN
Time
.
.
‘-77:
,
[8:00:00 ~
;
18:15:00
c
h
,
8:30:00
,
,
.
.
,
,
8:45:00
9:00:00
:1:
9:15:00
,
,
,
,
,
.
.
,
Eiii77
●
,
9:30:00
9:45:00
‘ii!
h
,
0:00:00
.
0:15:00
Esizl
,
.
k
o
500
‘
-.
E
MICROSIRAIN
SamplePeriod: 15 Min
Figure
6.ld
10123186
20:17:54
Bow Bottom
38
ciisEEJd
Plate Strain
Trend
Chart
SE~sOR
=ATl=l~S
SmsQB
DISPLAY
BWL!N!IS
ALE RT SET
Bow Accel Vert
0.55
-0.50
0.01
0.41
G
0.6
Bridge Accel Transv.
0.40
-0.42
0.02
0.30
G
0.5
Midship Bending Strain
225
-1oo
50
186
uStrain
800
Bow Bottom Plate Strain
800
10
450
uStrain
1000
Figure
2
6.2
Characteristic
39
Statistics
Display
6.5
Testing and Support
All supervisory and applications software must be completely tested and
documented.
Extensive software testing is necessary to insure that the system
operates free of “bugs”, and any failures that might occur are graceful. A
formal test plan must be developed and submitted for approval at the beginning
of the Phase II work. The procedure that should be followed is testing of
each individual software module and subsequent testing of the system as each
module is added, until proper operation of the entire system is verified.
In
addition, the software should be tested at each stage to insure proper
Each unit
operation after a power failure or improper inputs from operators.
delivered must be tested as per the formal test plan, after the system has
been configured for the specific application.
Documentation provided with the units will include a User’s Manual and a
Software Manual in addition to the hardware manuals discussed in Section 5.
The User’s Manual will provide all information necessary to effectively
operate the SRM. It will give a brief description of the system, including
objectives for using the SRM, and will jnstruct the user in all system
Included in the manual will be a tutorial that can be followed to
functions.
gain familiarity with all features and functions. The Software Manual will
document system software and provide detailed descriptions of the methods for
all calculations.
It will include several levels of flow charts and a
complete source listing of all software modules.
40
7.
FUTURE ENHANCEMENTS
The specification given in the previous sections defines the Standard Ship
Response Monitor in its basic configuration.
Since some operating companies
may have a desire to add features and capabilities, a discussion of features
which could be supported by the design as future enhancements is thought to be
These optional features are not included in the SRM but they
worthwhile.
could be supported by the system and if requested by a particular operating
company, they could be included on an extra cost basis.
The SRM as defined in the previous sections includes interfacing for 6
sensors. As many as 26 additional sensors could be added within the specified
enclosure size and sufficient computing power is available to process this
data. If a large number of sensors are added as options, some type of data
storage media would probably also be required. This could be included as an
optional internal floppy or hard disc drive.
The SRM includes a serial communications port and a capability to communicate
with a keyboard or other device. The input/output format will be.specified in
the system manuals and the device could be interconnected to other equipment
supporting NEMA standards, similar to the communications capability provided
for in most LORAN and SATNAV units. As an option, data output to another ship
system could be custom formatted to permit transfer of any required
Also, as an option, a printer could be added. The SRM includes
information.
an auxiliary CRT output. As an option, a second display could be provided at
a remote location such as the captain’s office. This display would duplicate
the display on the bridge.
As developed during this Phase I study, the SRM is simply a response monitor
and does not provide any guidance to navigating officers. As discussed by
Lindemann [15] and Chazal [1], a logical future enhancement is incorporating
this guidance. Using Lindemann’s definitions, the basic SRM is a Level 1
instrument that provides monitoring to supplement’ the navigating officer’s
feel of ship response. A Level 2 instrument would include a capability to
provide guidance on the effects of actions intended to reduce wave response.
For example, if a course or speed change is contemplated, the navigating
officer would be provided with data on the probable effects, and he could use
the information to decide on a course of action. The basic SRM could be
enhanced in the future to provide this capability.
A Level 3 instrument would
not only predict the effects of planned actions, but would also provide
recommendations on the optimum actions that should be taken. These
recommendations would attempt to keep wave response within an acceptable level
while at the same time minimizing the loss of speed toward the vessel’s
destination and fuel consumption.
At the present time, adequate technology
does not exist to develop a level 3 capability.
However, when accurate
methods to predict added resistance , non-linear response and response in
combined sea conditions are available, the SRM design could be enhanced to
incorporate this feature.
.
41
8.
CONCLUSIONS AND RECOMMENDATIONS
Based on the performance requirements developed in Section 4, a design
specification for the Standard Ship Response Monitor has been developed. This
design meets all of the requirements developed by SNAME HS-12 Panel and
provides sufficient capacity for adding future enhancements.
The design
specified in the previous section meets the cost criteria of $30,000to
$40,000 per unit including four sensors and installation.
The modular nature
of this design will provide opportunity for eventual manufacturers to make
modifications prior to production, based on findings from the the Phase 11
shipboard evaluation.
It is recommended that Phase II of the project proceed
as planned, using the design specified herein for evaluation aboard three
vessels.
The Phase 11 evaluation aboard vessels in service
should concentrate on
applicability of the SRM to different vessel types, acceptance by navigating
officers and training required to insure acceptance and proper use, and
evaluation of the SRM design and functions.
In order to assess applicability
to different vessel types, the three ships should provide an opportunity to
evaluate effectiveness of the SRM in helping navigation officers deal with
different types of ship responses. For example, use of the SRM on a highspeed container ship, a RO/RO, and a tanker or bulk carrier would permit
evaluation of the SRM for a variety of vessel sizes and response problems.
The high-speed container ship would provide a platform to assess effectiveness when dealing with bottom slamming and cargo tiedown problems. The RO/RO
would also address cargo tiedown problems and could, in addition, be used to
address torsional hull loads. The tanker or bulk carrier could provide
evaluation in the presence of flare slamming and cargo shifting (or sloshing)
problems.
During these evaluations, emphasis should also be placed on the training
required to insure understanding and proper use of the SRM by navigating
officers. This should include both formal training and continued interaction
with project personnel during and between voyages. This process will not only
provide navigating officers with an improved understanding of the use of the
SRM for shiphandling in heavy weather, and thus benefit the operating
companies, but it should also define the level of training required for future
SRM installations.
. Detail ed”evaluation
of the prototype SRM design should focus on three primary
areas.’ First, since an infinite number of variations in control arrangement
are possible, it is recommended that several mockups of possible arrangements
be developed and reviewed with at least one master mariner and personnel
familiar with previous response monitoring projects. Secondly, the Phase II
onboard evaluations should place a heavy emphasis on display formats. This is
probably the most important aspect of the design in terms of the usefulness of
the unit and the way that it is perceived by navigating officers. Criticism
from all shipboard personnel who use the system should be solicited and
included in the final report. Finally, the use of color should be evaluated
on at least one of the units. This can be accomplished by letting one ship
operate a monochrome unit and then change it to color.
42
9.
REFERENCES
1.
Chazal, et al, “Status Report on the Application of Stress and Motion
Monitoring in Merchant Vessels”, SNAME Spring Meeting/STAR Symposium,
Coronado, Cal iforni a, June 4-6, 1980.
2.
Hoffman D. & Garzke W.H., Jr., “Heavy Weather Monitoring and Guidance
System on the S.S. Lash Italian, U.S. National Maritime Research
Center, July 1980.
3.
Hoffman D. & Zubaly R.B., “Design of a Ship Response Monitoring and
Guidance System for U.S.N.S. FURMAN”, U.S. National Maritime Research
Center, December 1980.
4.
Korvin-Kroukovsky,
1961.
5.
“Minimum Software Specification, Ship Response Monitoring & Guidance
System USNS FURMAN”, CMS, 9 November 1978.
6.
Oakley, O.H., et al, “A Summary of Wave Data Needs and Availability”,
Ship Research Committee, Washington, D.C. 1979.
7.
Robertson
S. & Lindeman K., “An Introduction to Ship Handling in
Rough Weather”, DNV Report No. 81-0215. (also see Reference No. 41).
8.
Taylor K.V., “Onboard Guidance for Heavy Weather Operation”,
Institute of Marine Engineers, Operation of Ships in Rough Weather,
London, England, February, 1980.
9.
Dickey R.L., DeLong R.C. & Gregov Z., “A Hull Monitoring System for
Safe and Economic Operations”, Ship Automation 11, Volume 5.
10.
Hoffman D., & Lewis E.V., “Heavy Weather Damage Warning Systems”,
Technical Report, National Maritime Research Center, September 1975.
11.
Hoffman D., “Heavy Weather Damage Avoidance System (HWDAS) On the
S.S. Lash Italian, Technical Paper, National Maritime Research
Center, December 1977.
12.
“Preparation and Evaluation of Extended Software for the SMGS Onboard
U.S.N.S. FURMAN and S.S. Lash Italian, prepared for NMRC, Kings
Point, New York, by Hoffman Maritime Consultants, Inc.
13.
Edwards, G., “Monitoring Ship Systems for Optimum Efficiency and
Safety”, Technical Paper, Sydney Technical College.
B.V., Theory of Seakeeping
, SNAME, New York,
14. Lindemann K., Odland J., Strengehagen J., “On the Application of Hull
Surveillance Systems for Increased Safety and Improved Structural
Utilization in Rough Weather”, Transactions SNAME, Volume 85, 1977.
43
16. Lindemann K. & Robertson
S., “S03-Prosjektet”, U.S. Department of
Transportation Report CG-M-9-81, 1981. (NTIS PB 82265281).
16. Breit S., “The Test and Evaluation of the Ship Monitoring and
Guidance System Onboard the USNS FURMAN”, National Research Center,
August 1981.
17. Cojeen H.P., & Chazal E.A., Jr., “Help for Human Beings - It’s
Instrumental”, Proceedings of the Marine Safety Council, Volume 39,
April 1982.
18.
Boylston J.W., Boentgen R.R., &Wheaton J.W., “Instrumentation
Only Way”, The Ship Structure Symposium 75and SNAME.
19.
Dickey R.L. & DeLong R.C., “A Hull Monitoring System for Safe and
Economic Operations”, Shtp Operation Automation, Second International
Symposium.
- The
20. Gran S.1, “Measuring Ship Behavior In Waves”, Veritas, No. 91,
February 1978.
21.
Gauvin D., “NAWS - A Hull Response Monitor for Navigation in Ice - An
Operator’s Perspective”, Marine Engineering Digest Revue Technique
Maritime, July 1985.
22.
Nitta A., Jumana A., Yuasa M., Suzuki K., & Tatara Y., “On Board Test
Of Hull Strength Monitoring System”, Technical Bulletin of Nippon
Kaiji Kyokai, Volume 3, 1985.
23.
Petrie G.L., MacLean W.M., Cojeen H.P., Schudel G., “The Usefulness
of Response Monitoring for Estimation of Bow Structural Loadings”,
SNAME, April 1985.
24.
Hachmann D., & Westram A., “A German Ship’s Motion/Load
Germanischer Lloyd, Hamburg, October 1985.
25.
Strengehagen J., “Hull Surveillance Experience and Possibilities”,
Veritas No. 89, July 1977.
26.
Carleton H. & Winton H., “Heavy Weather Damage Instrumentation
Sytems”, Technical Report, National Maritime Research Center, 1974.
27.
Great Lakes Carriers Hull Stress Monitoring System, by Center for
Maritime Studies, December 1978.
28.
Fain R.A., “Design and Installations of a Ship Response Instrumentation System Aboard the SL-7 Class Containership S.S. SeaLand
McLean”, Technical Report, National Maritime Research Center, 1973.
29.
“What’s A Human Factor”, Proceedings of the Marine Safety Council,
Volume 39, No. 4, April 1982.
44
Indicator”,
30. Hoffman, D., & MacLean W.M., “Ship Response Control During Heavy
Weather Operations”, Proceedings Fifth Ship Control Systems
Symposium, Volume 4, 1978.
31. Lindemann K., “The Navigator, Ship Handling In Rough Weather and Hull
Surveillance Systems”, Proceedings of the F’ rst International
Conference on Human Factors in the Design ald Operation of Ships,
February, 1977.
32. Hoffman Maritime Consultants, “Specifications for the Hull Stress
Monitoring and Guidance System”.
January 1980.
33. Oswald, James, “The Cruel Sea and the Seakindly System”, Sea
Technology.
July 1976.
34. Safety at Sea International, “Reducing Damage to the Hull in Rough
Weather”.
Vol. 105, December 1977.
35. Anonymous, “New Technology for Improved Operating Economics”,
International Symposium on Ship Operations Proceedings, Sept. 23-24,
1980.
36. Ditchburem, J., “Operation of Ships in Rough Weather”, Seaways, June
1980.
37. Fraser, Gordon, “Stress Limits”, The Naval Architect, May 1981.
38. Hoffman, D., & Petrie, G.L., “Shipboard Guidance for Operations in
Heavy Weather”, Satellite Applications to Marine Technology
American Institute of Aeronautics and.Astronautics
Conference.
(AIAA) et al. New Orleans, Louisiana, November 15-17, 1977.
39. Lloyd, ARJM, “Statistical Ship Motion Recorders”, The Naval
Architect, May 1981.
40. Hoffman, D., & Petrie, G.L., “Integrated Computer Systems for Weather
Bound Vessel Operations”, Computers in Industry.
Vol. 1, 1980.
41• Lindemann, K., “Summary of a Course in Shipbuilding in Rough
Weather”, U.S. Department of Transportation
September, 1981. (NTIS AD A115176).
Report, CG-M-7-81.
42. Chuang, S.L., “The TMB Flexing Stress. Monitor”, DTMB Report 1560,
February, 1962.
43. “Evaluation of a Prototype Stress Warning System” LOCKHEED Report,
Sea Use Program Test C-5, October 1973.
44. “Bow Slamming Indicators”, Brown Brothers Co., Ltd. Edinburgh,
Scotland.
45. “Auto Ship Bridge - Navigation Monitor System”, Mitsui Engineering
and Shipbuilding Co. Ltd., Japan.
45
.
.
APPENDIX
A
Performance Requirements
Developed By:
SNAME
HS-12 Panel on Hull Instrumentation
A-1
PERFORMANCE REQUIREMENTS
The SRM shall be composed of a console, display unit,
(a)
function controls and keypad, micro-computer, signal conditioners, sensors and
cables, and should be configured as a navigation console as shown in Exhibit
B, Figure 1.
The computer Exhibit B, Figure 2 shall be of adequate
(b)
capacity to support the analysis of output from the standard and optional
sensors, provide formatted displays, user information, system status, sensor
calibration and diagnostic aids, and have a back-up power supply, which will
not cause program loss during power supply interruptions.
Expandability shall be considered so that capacity could be
(c)
added at a later date to support guidance and predictive functions relative to
monitored responses and other functions, such as loading calculator or vessel
administrative applications.
Controls and function switches shall be based on human
(d)
engineering principles.
(e)
Basic sensors shall be selected to implement displays of
vertical acceleration at the bow, and lateral acceleration in the pilot house.
(f)
Optional sensors, to satisfy owner-specified requirements,
shall be selected to implement displays which as a minimum include:
Roll period
Roll angle
Pitch period
Pitch angle
Shaft torque
Local stress
Vertical bending moment
..
*
“
Still-water bending moment
Yaw angle
Tie-down tension
Hull
(container lashings, etc.)
torsion
Vertical acceleration of bridge aft
Vertical acce” eration of midships
.
.
A-2
Heave period
Heave amplitude
slamming
loads
at the
bow
Vibrations
Vessel speed and heading
Sensing units shall be selected with due consideration of
(9)
the working environment.
(h)
Suitable enclosures or protective devices shall be provided
for the sensing units.
Sensors shall be selected to provide 2 years minimum
(i)
to satisfy
the need for
service life. Redundancy of sensors may be provided
long-term
service.
Function controls and keypad shall be provided as shown in
(j)
Exhibit B, Figure 3 (representative optional configuration), and described as
follows:
General - The user interface shall consist of a control
panel which furnishes single-key function switches to select instruction, menu
and display modes and other functions, a numerical keypad, a multi-position
switch for selection of sample length, lighted control switches and buttons,
and a dimmer to control illumination intensity.
Function keys and keypad shall be laid out with simplicity
and clarity as main priorities in order to make the mechanics of SRM operation
simple, clear and easy to carry out under extreme conditions of user fatigue
and vessel motions.
The true wind calculator function shall contain a straight
for cdlct.tlating
true wind from measured wind speed
forward interactive routine
It is intended as a means of
and direction, and vessel speed and heading.
encouraging the officers to use the SRM so as to develop experience,
confidence and familiarity with the display and the keyboard.
The alert set function shall be provided so that alert
levels may be set , changed or cancelled in this mode.
The clock set function shall initialize the time of day to
provide accurate time points on the time-history monitoring displays.
The numerical display function shall provide for single key
selection of numerical or graphical display while in monitoring mode to
provide a choice of display format, which will apply to each parameter.
Other function keys shall provide for entry and display of
night messages, standing orders, work ‘ists or other items of interest to the
officers.
A-3
b
A Visua” Display Unit (VDU) shall be provided with the
(k)
capability of flashing and highlighting individual characters and providing
variable display intensity
The VDU may have color
display
capability
but, in
this case, care must be exercised to avoid hues which may become invi~ible
under artificial ambient light, such as red-bridge illumination.
While additional remote “slave” displays will
be optional,
(1)
provision for future remote display shall be made by incorporating plug-in
connectors
in the console.
Each parameter display; such-as one shown in Exhibit B,
(m)
Figure 4, shall be accessed by means of a single-function button.
Each display shall be laid out with particular attention to
(n)
simplicity, clarity and ease of interpretation.
Each display shall provide a capsule status of all
(o)
monitored parameters in addition to a time-history for the selected parameter.
(P)
Each display shall reflect the following options:
Sample length - long sample length (15 minute), short
(5 minute) or immediate (1 minute) intervals for display update may be
selected by means of a 3-position switch on the control panel (user option);
Graphical or numerical data - selection shall be made by
operating a single-function button on the control panel (user option);
Alert function - parameter values which exceed set values
shall be indicated by either flashing characters, highlighting, or variation
of background intensity, etc. (software option);
Data reduction - parameter data shall indicate peak values
and either Root Mean Square (RMS) or significant values (software option);
generalized
option);
Units
- data shall
be presented
in either
engineering
or
(say 0-10 scale) units (software option with potential as a user
Status line/other information - each display shall show
some indicators of system status and some other key information such as ship
heading, speed, rpm (software option).
The menu display shall list each monitoring function
(q)
(vertical acceleration, lateral acceleration, two optical parameters), and the
other selected functions.
Diagnostic functions shall provide means to better define
(r)
the symptoms associated with any obvious irregularity in the system-and
provide a means of self-checking to confirm the validity of data when no
problems may be evident. This shall include automatic internal open-circuit
checks and automatic sensor calibration checks, for example as a minimum.
A-4
(t)
isolate
problems
faults.
Means shall
and determine
be provided to interrogate the system to
check-off points of potential
correctable
The design and construction of the SRM system shall reflect
(u)
consideration of the need for reliability and diagnostics so that the system
may fail “gracefully”, i.e., certain components or subsystems may fail without
making the unaffected functions inoperative. Bearing in mind the inability
of
a service
technician
to carry
spares of all components and parts,
it is of
special
importance
that the officers
be able to carry
out a reasonably
thorough
diagnosis,
even covering items beyond their own ability to repair, so
as to better ensure the effectiveness of a technician when he arrives.
Specifications shall indicate areas which may be affected
(v)
by government regulations, and other codes and standards.
A-5
EXHIBIT B
Figures
1, 2, 3 and 4
A-6
Oihtr
5RM
ln5WUman7/
Con~ro15
o
VD4
{ Keypad
From keasa
n
FIGURE
~~~
THE 5RM:
CONT~OL%,
I
FLINCT]ON
g~lTcHE%,
KEypA~l
ANP
C6LOQ CRT ON BALK
5 RM
Ot har
c1
Instrument
Vpu
/
rois
Cant
00
.
~antro15
(SRM
Cotnput&f
for5R
r
I
~[
r-
L.
.
r- -
Disk ~rlVQ9
.-- —- -H.
I
Computar
fern
I
Expansion
L- ..—-.—
- —-.
1
r1
I
I
L
5ignal
cartclitiona~
-—-—,
LAYOUT
bF
CON50LE
&n50r
~
I
I
LW31NET
A~~
CdNTAININ~
~19K
A-7 ‘
.
COMPuTER, 9EN50Q9,
PRIVES
KEYBOARD
-i
<<<<<<<<<<<<<<<<<
5’ <<<4<<<<<<<<<<<<<
3<
~c*cc
C<<
C<<<
<<<<c
CCCC
cc<<<
<<<<<<<<
c
m
“++++
i-n
r
ml
z
- .
3
c1.
❑
APPENDIX B
Drawings and Parts List
B-1
,---’---
-,
‘ - L------
- . - .-----------------.
”-----
-.-J
T
T
9“
.1
FIGURE B-1
PRELIMINARYCONSOLE ARRANGEMENT
B-2
-R
SUPPLY
\
-%R%,
CLKJ
TOP VIEW
CARDckE
-R
/
SUPPLY
SIDE VIEW
FIGURE B-2
PRELIMINARY CONSOLE ASSEMBLY
B-3
5HIP5 POWR
‘r$
=7
POWER
SUPPLY
UPS
+ 5 vdc
12 VCEC
1
I
I
CPU
I
I
I----w@
“’p’’’’’”
CARD
1-
——————i
1
I
EXCIT/OALANtE CARD
I
1HIGH LEVEL:
I
---
;
[
I
I
m
I
:
I
REALTIME CLOCK
--i
---
T
i
L -----
-— --SIGNALS
STRAINCAGE
-----SIGNALS
E
Figure
B-3
SYSTEM
WIRING
DIAGRAM
TABLE B-4
PARTS LIST FOR SRM
(User Selectable Sensors Not Included)
Qty
Item
Model Number
Vendor
1
8088 CPU Card
8816
Ziatech
1
CRT Controller
ZT-8844
Ziatech
1
512K Memory Card
ZT-8824-512
Ziatech
1
12Bit A/D Card
LPM-AD12
WinSystems
1
Amp/Filter Card
AF16-1
Arctec Offshore
1
Parallel
zSBX-30
Ziatectl
1
Card Cage
BR08
Pro-Log
1
Power Supply
M281
Pro-Log
1
Cabi net
Custom Consoliner Series TA Instrument Case Co.
4-6
Remote Enclosures
NEMA-4X Series
Hoffman
1
UPS Power Supply
----
Quests Systems
1
Video Monitor
CHM-1290
Sony
1
Memb. Switch Panel
Custom Design
Jayco
8-12
Cable Connectors
PTO7-A-1O-6P
Bendix
8-12
Bulkhead Connectors PTO8-A-1O-6S
Bendix
As
Needed
Cable
Bel den
#9783
APPENDIX C
Manufacturer’s
c-1
Specifications
STD Bus Computers
-.
7 iatech’s
line
ofSTD-8088vrocmsor
boards
~comains a candidate
forjust
aboutanytest
andcontrol
application.
Featuring
Intel’s
8088/86
family
ofprocessors,
these
single
boardcomputers
havebeendesigned
withreliability
andoperating
system
support
inmind.
TheZT 8806,
Ziatech’s
mostpopular
SBC,
combines
theworld’s
mostwidely
usedprocessor,
tlw8088,
withfive
memorysockets
andbasic
1/0
functions.
Supported
byfouroperating
systems
andmany development
tools,
theZT 8806comes
in5 and8 MHz speeds
and,ifrequired,
canhost
the8087mathco-processor.
Featuring
the80188processor,
Ziatech’s
a numberofsophisticated
2T 8814contains
systems-level
features
including
on-board
DMA,
processor
instruction
overlap,
interrupt
control,
andtimer
functions.
Fivememorysockets
onboardandanSBX connector
maketheZT 8814
ideal
formany OEM applications
featuring
userwritten
operating
systems
orSTD VRTX.
Themostrecent
memberofZiatech’s
SEC
family
istheZT 8816.
Featuring
theextensive
use
ofsurface
mountdevices
forcompactness,
and
NEC’SnewV50 forcomputational
power,
the
ZT 8816k a sdf-contained
system
requiring
only
theaddition
ofpurchased
oruserdesigned
1/0.
Incorporating
a full
16-bhdatapathon-board,
the
ZT 8816conforms
totheexisting
STD-8088
specification.
TheZT 8816processor
wasdesigned
withoperating
systems
support
inmind.
&
v-
Singls_Board
Computer
ZT8806
8088
Ziatech
alsooffers
multiprocessing
capability
fordemanding
real-time
requirements.
One or
moreZT 8830Intelligent
Control
Processors
can
beusedtoreduce
intense
STD Busbackplane
activity
foundindemanding
control
applications..
AllofZiatech’s
processor
boards
comewitha
firmware
option
forsimple
development
functions.
.-
ZT 8806/8807 SinghBoard8088
8088 Computer
8256
8087”
ZT 881418815SingleBoard80186
80188 Computer
518 MHz 320
128
518 MHz 64
32
1 Mb (1)
RS-232
422/449
1 Mb
16
(5)
6
8-bit
(3)
3
16-bit
Yes
.ZT 8816/8817 SingleBoardNECV50 NS16450 5/8 MHz 256
NECV50 Computer
PD70216
FPP”
512
1 Mb RS.232
+ 16
422/485
battery
backed
ZT B830Intelligmrt
1/0
Control
Processor
80$8-2
8256
6 MHz
.32
32
ZT 7806 SingleBoard
GPIBComputer
6085A
6250
9914A
3 MHZ
6
16
64K*” (1)
RS~232
422/449
64K
(2)
US-232
(3)
8
16-bit
(5)
8
6-bit
Yes
4
● optional
“* on-boardmemoryaddressingonly
7
c-2
ZT 881618817
Single Board Computer
STD Bus Sin Ie Board Computers offer 16-bit
rocessor and data bus,
832K on-boar # memory capacity and execute IB ~PC
software on board.
The ZT 8816/8817SingleBoard Computers
implement the full 16-bitdata bus operation
of the NEC V50 microprocessor,
while conformingtotheSTD Bus Manufacturer’s
Group
lEEE P961 specification.
Through the extenSiVe use of surfacemount deviceson both
sidesof thePCB, thesesingleboardcomputers
provide the functionality
of three or more
“through hole” component based STD Bus
boards.
fVhen used with Ziatech’sSTD DOS V50
operating system and the new ZT 8844
Video/KeyboardController,
theZT 8816/8817
willexecutemany of theIBM PC’s wide range
of development toolsand applications
programs on-board.The new SBCS are also supported
by Ziatech’s
IBM PC-based
ment systems for use in applications
operating
systems.
,-7
BE
au
I
I
‘:’’’’’’’’’+=’
,
4
BYTE-WIDE
MEMORY
SOCKETS
1
De;?
developwithout
____
---.— ..—
——
..
... ..._ . ... . _
[ STD BUS
.-
*8-bit accesses off-board
*8080 emulation
mode (V50)
*DMA channel (V50)
*Interrupt
controller
(V50)
*Two serial channels (V50, NS16450)
*Three counter/timers
(V50)
*Optional
develo~m’ent/debug
monitor
*Burned in at 55 C and tested to
*STD-8088 Bus compatible
*8088/8086
& 80188-/80186 code compatible
*256 Kbyte EPROM capacity
*512 Kbyte DRAM
*64 Kbyte battery-backed
RAM capacity
*Real-time
clock with battery backup (58274)
*AC/DC power-fail
protection
*Latching
user connectors
*Programmable
wait-states
*16-bit data bus on board
guaranteereliability
*Two-year warranty
c-3
~Ii)
ZIATECH
CORPORATION
PROM
FUNCTlONAL
tures include
Ioopback
diagnostics,
interrupt
generation
and
jumper
DCE or DTE configuration.
CONSIDERATIONS
V50 (u PD70216) Processor
The NEC V50 is a full 16-bit microprocessor
that is code compatible
with the 8088/8086 &
80188/80186
line of microprocessors,
In addition, the V50 includes
both performance
and
instruction
set enhancements.
Increased
performance
is primarily
due to two internal
16l)it data buses and special hardware
dedicated
calculation.
Added
address
to
effective
1/0,
expanded
include
string
instructions
rotate and shift, bit and nibble manipulation,
and an 8080 emulation
mode. The emulation
mode instructions
enable existing
8-bit applications to be upgraded
to 16-bit with little or
no software
modification.
Counter/Timers
The ZT 8816/8817
has three independent
16bit counter/timers
(8254 architecture)
that can
be used as timers or event counters.
There are
counter/timer
modes:
six
programmable
interrupt
on end of count, frequency
divider,
software
triggered,
square
wave
generator,
hardware
triggered
and retriggerable
one-shot.
One
counter/timer
is
connected
as
an
interrupt
source
internal
to the V50 and is
used to generate
timed or periodic
interrupts.
A second counter/timer
is programmed
as an
interrupt
source or as a baud rate generator
for
the
V50
serial
channel.
The
third
counter/timer
is available
through
a front
plane connector.
Memory and 1/0 Addressing
The ZT S816/8817
is populated
with 512
Kbytes of DRAM, up to 64 Kbytes of battery backed RAM and four 28-pin JEDEC compatible byte-wide
sockets. The byte-wide
sockets
accept 8K, 16K, 32K and 64K ROM devices.
All memory
local
to the ZT 8816/8817
is
addressed
with full 16-bit operation.
Additional memory
can be accessed
through
the
STD-8088
Bus to meet system requirements.
Memory transfers
to and from the STD Bus
are automatically
reduced
from 16-bit to 8-bit
operations
for full bus compatibility.
The
ZT 8816/8817
directly
addresses
up
to 1
Mbyte of memory.
The ZT 8816/8817 includes some of the most
commonly
used 1/0 functions.
Additional
1/0
functions
can be accessed
through
the STD
Bus. The ZT 8816/8817
directly
addresses
up
to 64 Kbytes of 1/0 for 16-bit addressing,
or
256 bytes for 8-bit 1/0 addressing.
,
Interrupts
The ZT 8816/8817
includes
one programmable
interrupt
controller
(8259A architecture) with eight interrupts.
One input is dedicated to a counter timer for timed or periodic
interrupts.
Another
input
is programmable
connected
to a second counter timer or a front
plane connector.
A third input is programmed
for connection
to the V50 serial controller
or a
front plane connector.
Three more inputs are
dedicated
to the
16450
serial
controller,
optional floating
point processor and STD Bus
INTRQ* signal. The last two inputs are dedicated for use through
a front plane connector.
Three sources of non-maskable
interrupts
are
the STD 13US NM!RQ* signal, and optionally,
the power
fail protection
and parity
error
detector circuitry.
The ZT 8816/8817 supports
the STD-8088 Bus address-cascade
protocol for
controller
expansion.
Casslave
interrupt
cading interrupt
controllers
provide
up to 40
additional
interrupt
inputs.
Direct hIemory Access (DhlA)
The ZT 881 6/8817 provides
one DMA channel to the user through
a connector
for highspeed transfer
between memory and 1/0. The
DMA channel includes 20-bit address registers
and 16-bit count
registers.
Byte and word
“t~ansfcrs i~” single, block and demand
modes
arc supported.
The ZT 8816/8817 also supports
Dh4A from an external
STD Bus controller
to
local memory.
..
.
Serial
maskable
selectable
Real-Time
Clock and Battery
The
ZT
8816/8817
includes
a battery
backed-up
real-time
clock (National
MM 58274
RTC). The RTC provides time information
for
year, month, day, hours, minutes,
seconds and
1/10 seconds. A data-changed
flag allows simple testing
for time rollover.
A 3.9V, IAH
lithium battery supplies
backup power for the
RTC and static RAM. Refer to the electrical
specifications
below for data retention
times.
Communications
The ZT 8816/8817
includes
two asynchronous
serial
communication
channels,
each
with a programmable
baud rate generator.
The
V50 provides
one serial channel
(a subset of
the
825 1A) configured
as RS-232C.
The
National
NS16450 (functionally
equivalent
to
the 8250A and 16450 used in IBM PCs and
ATs) provides the second serial channel configured m RS-232C or RS-422/485.
Other fea-
AC/DC Power Fail Protection
The ZT 8816/8817
can monitor both AC and
DC, allowing
for an orderly
shutdown
during
a power failure.
The ZT 8816/8817
can be
jumper programmed
to detect AC power fail-ure by monitoring
a 24V AC signal derived
F.a
L-4
—.—
from the same supply that powers
the STD
Power supply requirements:
+5V +/- 59’0@ 2A maximum
and 1A typical
:.
add 0.30A maximum
and O-15A typical
with four ROM devices
+12V @ 0.25A maximum
and 0.2A typical
-12V @ 0.25A maximum
and 0.2A typical
Data retention
for RTC and battery-backed
RAM
5 years typical and 2 years minimum
ordering
information
for 24V AC
trartsformcr.
When the AC power drops, an
NMI is generated
to notify the processor of an
impending
failure.
The processor
can then
save critical
data before the DC monitor generates a reset. The DC monitor resets the V50
and activates
the DCPWRDWN*
signal (STD
pin 6) when the +5V supply (STD pins 1&2)
drops below operating
range.
BUS.
See
Nlechanical
STD-8088
1/2” or
standard
Measures
Height =
Development
Considerations
Ziatech
offers
two software
development
tools for ZT 8816/88!7
applications,
ST13 PDS
and STD DOS V50. T-he STD prototype
Devel.
opment System uses an IBM or compatible
PC
as a development
station to create, download
and debug stand-alone
application
programs
written in assembly and selected other popular
languages.
The second development
tool, STD-DOS V50,
is an adaptation
of the IBM PC DOS- operating
system that resides on the STD Bus. Applications can be developed
much faster bccausc:
1) programmers
familiar
with PC DOS do not
have to learn a ncw operating
systcm, 2) the
operating
system includes software
that is easily integrated
into the application,
and 3)
extensive
industry
support of PC DOS makes
available
a large number of development
tools
such as program editors, compilers,
assemblers
and debuggers. STD DOS can also be executed
in the target
system
to provide
the user’s
application
with services such as file memory
and 1/0 management.
Multitasking
target systems featuring
VRTX
and
Multi-DOS
are
available
for these SBCS also. For more information on these development
tools and target
system options,
refer to. Ziatech’s
Technical
Data Book.
Component n
Environmental
0° to 65° C operating
temperature
15V0 to 950/0 relative
non-condensing
Electrical
STD-8088
4
t
0.91
1
Connectors
Three
latching
user
J1 14-pin serial
J2 14-~in serial
J3 26-pin DMA,
and AC input
PI 56-pin STD
connectors:
channel
channel
counter/timer.
interrupt,
Bus connector:
Ordering
Information
ZT 8816
5 MHz Single Board V50 computer
and manual
ZT 8817
8 MHz Single Board V50 computer
a“nd manual
“
opt 01 13BUG 88 system including PROM
and serial cable
Opt 02
Serial Cable
with
opt 03 Wallplug 24V AC Trnnsformcr
2 meter cord.
SPECIFICATIONS
.-
Bus compatible
except requires two
5/S” card slots at either end of a
STD Bus card cage
4.5” (1 1.3 cm) x 6.5” (16.5 cm)
0.91” (2.3 cm)
range
humidity
Bus compatiblefor5 MHz (ZT 8816)
and 8 MHz (ZT 8817)
All products
arc shipped
FOB San Luis
arc avaiiObispo, CA, U.S.A. 0Eh4 discounts
nb~c for quantity
purchases.
Contact
Ziatcch
for additional
information.
Warr~
Two ysam fmrn shipping date, coveting all defects in materials and workmanship. Ziatech will repair or replace
products which prove to be defective during the warranty period prcwided they are promptly returned to Ziatech at customers
altered
ordamagedbynon-Zlatach
personnel.
No otherwarranty
isexpressed
orimplied.
expense and have not beenrapaimd,
Service
after
warranty
k available
ata predesignated
semicecharge.
We arenotliable
forconsequential
damages.
=1111
ZIAiiECbl
CORPaRATION
c-5
3433 RobertoCourt
San Lu,sObl$po.Cal,fom,a 93401 USA
(s051 541-040a
.
ITT Telex 499.2316
1-
——.
-“
‘..
1~
,L
-G>+:.-
ZT 8816 Single Board NEC V50 Computer
(FrontView - for another point of view, turn the page)
Ziatech Corporation
3433 Roberto Court, San Luis Ohispo, CA 93401 (805) 541-0488
C-6
.
. .
-l
.
.
.
.
.
-+_______
1
ZT 8816 Single Board NEC V50 Computer
(Rear View - for another point of view, turn the page)
Ziatech Corporation
343 3 Roberto Court, San Luis Obispo, CA 93401 (805) 541-048
c-7
STD Bus Memory/Mass Storage
memory board available in 128K to 1 Mbyte
configurations.
When used with Ziatech’s 8 MHz 8088-based
STD Bus computers, these memories deliver
maximum performance. For example, when either
the ZT 8820 Byte-wide Memory or the ZT 8824
DR4M are used with an 8 MHz CPU, they
operate without wait states at 8 MHz and offer a
60070increase over similar 5 MHz products.
Mass Memory
Disks have become more attractive for use in
STD systems with the introduction of the new
small 31A” drives which are better suited for
industrial environments than previous dkk drives.
The 3 !4” floppies are the most popular due to
their removable medla,and low cost. Many STD
Bus-based OEM products are developed with these
for the convenience of PC data interchangeability.
Floppy drives are available in both 3 Y2” and
5 !4” formats while Winchester drives are offered
in a 3 ~2” format. Both 3 M” drives are available in
an STD Bus, board-mounted format which allows
them to be installed directly into the card cage.
The disks are supported by Ziatech’s ZT 8850
Floppy/Winchester Disk Controller. This multiunit disk controller includes a SCSI (Small
Computer Systems Interface) compatible host
adaptor for Winchester disk and streaming tape,
as well as a floppy disk controller that can control
up to three 31/2” or 5 ‘A” floppy disk drives.
The = 8850 Winchester/Floppy Disk Controller with
the ZT B651 Floppy Disk Drive and ZT 8852 Winchester
Disk Drive.
Main Memory
iatech’s byte-wide and dynamic memories are
compatible with all STD-8088 processor boards
that meet the STD-8088 specification.
The ZT 8820 Byte-wide Memory Board is
compatible with STD-8085, 8088, 80188, and 280
STD Bus CPU Boards. It accommodates most
popular byte-wide memory chips and, if required,
is configurable into two separate memory
partitions with ROM on one and lL4M on
the other.
The ZT 8824 MegaRAM Board is a highdensity, STD-8088/80188 compatible dynamic
z
ZT 8820 BytAVide
MemoryBoard
ZT 8824
MegaRAMBoard
}WinchesterDiskDrive
optional
‘For refreshconflictsonly
●
●
C-8
9
ZT 8844
Video/Keyboard Controller
IBM PC-equivalent EGA video controller brings high resolution and color
graphic displays to STD-8088 based systems.
The ZT 8844 providesIBM PC-equivalent
graphicscapability
on a singleSTD Bus Controller.This controllerenables Ziatech’s
STD DOS system to execute most existing
graphics-oriented
IBM PC softwaretoolsand
applications
(i.e.,
Lotus 1-2-3,GEM, Turbo
Pascal,
and FlightSimulator).
The ZT
8844 automatically changes
between
(EGA),
IBM
Color
Enhanced
Graphics
Graphics
Adaptor
Adaptor
(CGA),
Monochrome Display Adaptor (MDA), and
other popular PC video modes dependingon
theapplication
softwarebeingrun at thetime.
The ZT 8844 is supported in Ziatech’s
STD DOS and STD Multi-DOS development
and
target
environments.
)
l!ED
,.
PEGAlA
GRAPHICS
CONTROLLER
2;fS6KBuES
MEMORY
‘~F”
AUTOSWITCH
‘-
BIOS
I
)
f
*Two user configurable
(Ioadable) 8 Kbyte
*IBM PC videosoftware
compatibility
character generators for a total of 1024
*STD-8088 compatible
(5or 8 MHz CPU)
characters
*Compatible.
withIBMs EGA, CGA and
*256 Kbytes dual-port
memory for display
MDA
and CPU access
*Fullsupportof HerculesMonochrome
Graphicsmode and Plantronics
Colorplus
“ ●16 colors supported from a 64-color palette
.* Light pen interface
mode
*Supported by on-board
16 Kbyte BIOS
*AutomaticVideoMode Switch(Par~dke
*Burned in at 55° C and
Systems’
AutoSwitchTM
feature)
*lBM PC/XT compatible
keyboardinterface .
tested to guarantee reliability
*Support
of off-board
speaker
*Two-year
and LEDs
c-9
warranty
ZIATECI-I
41111
CORPORATION
■ nm —.■—
n.n=
.—
-——
UK”T=U-U
Jayco Plastics of Califomi~
Inc.
m
o~~:e:f~~~~~.~~mm
Telephone:
(71 4) 974-1701
MAN-MACHINE
MEMBRANE
INTERFACES
SWITCHES
Membrane switches are normally.open, momentary contact switches. Their light weight and low
profile (0.030 - 0,040’thick)
make them ideal for use on portable equipment and on rack console
and desktop units where space may be limited. Membrane switches are more reliable and
economical than conventional switching systems. Fufiher, they add design flexibility which simply
isn’t available with any other switch technology.
Simplicity = dependability. The switch consists of two contacts, one above the other, separated by
a specific volume of air. Finger pressure on the top contacts closes the switch, and release of
pressure opens itThe contacts are usually made of printed conductive ink Therefore, membrane
switches are designed specifically for low voltage and low current applications (see technical
Specifim-tions).
“HYBRID SWITCH PANELS
Membrane switches are made of flexible materials. Hybrid switch panels utilize some aspect of
membrane switch construction, but are built on printed curcuit boards’They are therefore a hybrid
of membrane and PCB technology,
All hybridswitch circuit~ is usually contained on the,PCB and switch closure is performed by either
a printed membrane or a metal dome ( as in a tactile switch). Hybrid switches can be mounted
directly to your chassis with no additional subpanel required. They can also be supplied as a subassembly complete with connectors, hardware and LEDS mounted and ready for installation.
Significant savings result from the reduction of the amount of components necessary to order,
stock and assemble. Hybrid switches provide all the advantages of design freedom offered by
membrane switches as well as conventional mounting and connection techniques
c-lo
FRONT DISPIAY PANELS& OVERLAYS
Most membrane switches incorporate a front display panel. Overlays are usually printed on
polycarbonate or polyester materials, with all printing subsurface fordurability.
The surfaceofthe
overlayscan be treatedwithspecialcoatingsto improve chemical and abrasion resistanceand to
vary the surface texture. Any coloror combination of colorsare possible.JAYCO can match to’
federalstandard,Pantone or your supplied colorchips.
Various adhesives are availablefor different applications or the panel can be supplied as
assemblies complete with hardware.
KEYBOARDS AND KEYPADS
These simple switch arrays usually do not incorporate all the design features available with custom
membrane switch panels. Since JAYCO manufactures custom keyboards and keypads to your
precise design there are no limitations regarding size, layout, number of switcheq circuit~ or
graphic design. You receive an economical keyboard with no standard keyboard compromises
.
SILICONE RUBBER KEYPADS
Refer to separate data sheet for full information.
SPECIAL PROJECTS
JAYCO manufactures man-machine interfaces for a variety of applications. Occasionally, an
application requires a solution best provided by resources in addition to JAYCO. JAYCO will then
pool their resources, expertise and contacts throughout the industry on your behalf to create the
ideal solutionfor you.As a project leader, JAYCO will assume full responsibilityfor the project from
design to delivery. You receive technical help, service and commitment of the same caliber as if
JAYCO was manufacturing the part.And, there is no risk JAYCO will only accept projects that are
within their capabilities.
TECHNICAL
SPECIFICATIONS
Typical Values
CURRENT RATING
50mA at 30VDC
CIRCUIT RESISTANCE
Less than 100 Ohms
CONTACT BOUNCE
Less than 5 Milliseconds
(non-tactile)
Less than 20 Milliseconds
(tactile)
INSULATION RESISTANCE
1 Gohm Min at 100 VDC
DIELECTRIC STRENGTH
250 VRMS Min
CAPACITANCE
27 pf between any
two traces
ACTUATION FORCE
Variable from 80 Grams
OPERATING TEMPERATURE
40nC to +80”C
OPERATIONAL
LIFE
Greater than 5 Million Operations
(non.tactile)
Greater than 1 Million operations
(tactile)
TERM INATlON
Berg “Clincher”offered as standard’
TOLERANCES
+ or–O.01O“as standard
EMBOSS HEIGHT
0.010-0.01 5“
I
‘ The information contained herein is believed to be accurate and reliable, but is for guidance only. Customers should verify performance
specifications in actual conditions of use.
C-n
to
CC)NSOLINER
For 19” PANEL MOUNTED
EQUIPMENT
:-e
(
NOMINAL
PANEL
HEIGHT
Gonsoljners
may be used as storage, transit or Permanent
from 5%” to 26%” high. Like most TA
any applicable military specification.
●
●
●
●
●
●
●
●
●
●
●
●
Cases,
Consoliners
housing for 19“ rack equipment with panel heights
are watertight and can be produced to conform to
Standard Consoliner Features
Consoliner Options
(INCLUDED IN STANDARD CONSOLINER
NUMBER)
(CANNOT BE SPECIFIED BY STANDARD CONSOLINER
PART NUMBER. CONTACT TA SALES DEPARTMENT
FOR ORDERING INFORMATION)
PART
Watertight neoprene Chevron seal
Either 2 or 4 chest handles (TC81Y09 on pg 26) for ease
of carving
Panel mounting rails with pre-punched EtA/NEMA hole
pattern
10-32 panel-mounting
clipnuts supplied loose for
customer installation
Manual pressure relief valve (TC78V01 on pg 26) located
●
within
●
handle
Choice
●
●
●
for protection
of 0.10’
(Code
(Code U) panel rail
P) or 1.35”
recess locations
Toggle latches (TC82Z13 on pg 26) located on cover so
they don’t interfere with equipment operation (except on
body on cases with minimum (1.59”) cover height)
Spherical bumpers on hinge side of case (except 7“
deep bodies) as well as either dimples or bumpers
opposite opening
Storage tray assembly available in cover (or both covers
if dual cover case) see page 14
Choice of 12 panel heights, 3 cover heights, 4 body
depths, 4 finishes
Continuous separable hinge for cover removal
Available in fabricated construction onlv (see Daae 8)
from 0.071” thick 6061-T4 aluminum
- ‘
‘ “ “
●
●
●
●
Dual covers avaitable with or without panel mounting
rails at either or both openings as shown on page 14
Panel mounting rails available in cover as well as case
body for mounting additional instruments
Automatic Breather Valve (TC78V07 on pg 26) in place
of manual pressure relief valve
Watertight access doors, recessed cups and recessed
brackets as shown on page 15
Continuous panel rail to fill gap between top and bottom
of customer panel and inside of case body
Shear lugs, guarded handles and latches, and silicone
Chevron seal for extremely rough use
Provisions for chassis slide mounting or, rear chassis
support
Stacking receptacles can be added to allow stacking
several Consoliners on top of each other
Foam inserts or lining in cover above storage tray
assembly
--i“
PANEL RAILS
‘F
1.35
T
TABLE
RECESSED RAIL CODE U
PANEL MOUNTING SURFACE RECESSED 1.35”
BELOW PARTING
MOUNTED
COMPONENTS
SWITCHES
DEPTHS
AVAILABLE.
CODE
U
OTHER
CONTACT
PANEL
REGARDLESS
OF
TA SALES
SUFFIX.
RAILS ARE
RECESS
DIMENSION.
FLUSH RAIL CODE P
PANEL
0.10”
MOUNTING
BELOW
CUSTOMER
SURFACE
PARTING
RECESSED
LINE POSITIONS
PANEL APPROX
TA
PANEL CUE L!2E
lmwrr kUMBmHE16H7
II
NOMINAL
RECESS
FOR MODIFICATION
ALL RECESSED
PANEL
SUCH AS KNOBS,
AND METERS.
DEPARTMENT
NOTE:
LINE TO PROTECT
FLUSH
TO
5%”
r
$+’4”
33
“. w
35
~~
11.59
12’/4”
Iw
15Y4°
,71#*
37
38
3~
40
19%”
21”
.74,#$
~1~,,
41
42
~.J
~
13.34
15.06
16.64
16.59
20.24
22.09
25.59
27.34
, ~1~
TOP OF STRIKER RIM
10
TA INSTRUMENT
6.34
&og
9.64
iiEEzEE
TYPEOF
DUMPER
OPPOSITE
PANEL
OPENING
5.45
.7.21
$.95.
10.70
12<45
14.20
15.95 ‘
17.70
19.45
21.20
24.70
26.45
., 2
-.2
2.
2
2
4
“’4 “4
4.
4
4
4
CASE CO. 4625 AlgerSt., LosAngeles,California90039 (818) 242-8855 TWX 910-4974780
.-,..-
1
z
2
,-2
2
2
2
‘:2
‘2
.4
4
4
4
.
4 . ..
~4
,“4,
8
8
8...
‘ ‘7+-3
“6
~~ ,:s
8
B
8
Code Ident 53o3I
DIMPLE
DIMPLE
TCO1E?S-l
TCO1E75-1
TCO1E75-1
TC01E75-1
TCO1E761
TCO1E75-1
TC01E75-I
TG01E75-I
TCO1E75-1
TC01E75-I
@ 1985
The optional features shown below cannot be ordered by standard TA part
number code shown on page 6, but require a modification suffix be added by TA
Sales Department upon receipt of order.
OPTIONS
ACCESS
DOORS
The exclusive TA access door can be added to most standard instrument cases, provided enough clearance is allowed for hardware mounting and corner radii. The access door is particularly
useful for ventilating electronic equipment when in operation or
@
equipment requiring frequent maintenance. It allows quick access
to test leads or power cables when direct connection into instrument panel is impractical. Custom sizes avaiiable on special
order. See Technical Data Sheets 8142 and S143 for details.
—ACCESS
OPENING
LENGTH +1.15
~OUTSIDE
~
Sizes tooled as of date of
Publication. Contact TA
Sales Department for
additional information.
I
f .46
-02
3.00
8.00
-03
4.00
5.50
.t1.32
A
II=FE
-04
4.38
8.00
-06
5.00
9.00
RECESSED
~
ACCESS
OPENING
WIDTH +278
1
B
‘! 1
>--
.50R
ACCESS
OPENING
7
t
ACCIRMs
OPENINI IG
WIDTH I
WIDTH I LENGTtf
_
M
!
PARTNO. ACCESSOPENING
TC63D15
CASE WALL
@
m
/ CAPTIVE SLOTTED THUMBSCREWS
/
~, QTY VARIES WITH DOOR SIZE
GUARD RIBS AVAILABLE
ON
STANDARD SIZES ONLY
/
-11.12
!-\
v
CUPS
..
TA offers recessed cups which can be used either alone or In
combination with an aocess door. These cups allow for the mount-
and fittings sre watertight. If not, an access door can be provided
to cover the cup when not In use. Contact TA sales department for
ing of fittings and connectors in the sides of a case without
compromising the watertight integrity, providing the connectors
list of standard sizes availabie. Custom sizes available on special
order. See Technical Data Sheet 8129 for further details.
R2
RN TO
FICATION
RECESSED
BRACKET
not required with the door open. Openings at each end allow cooling for internal components. See Technical Data Sheet 8131 for
further details.
TA% recessed bracket is used with a watertight access door to
mount controls, connectors, indicators, etc. in a protected recess
on the sidea, front, or rear of a case, when watefiight Integrity ie
ACCESS OPENING
THRU CASE/ COVER WALL
.-
BOTH ENDS OPEN
?%/
r
x
:x
1
CL
ENGTH
OPENING
HEIGHT
I
‘“”’’’y’-z-/-”E---”--x-J
“
/
J
HOLE PATTERN
CUSTOMER
TO
FLAT AREA OF RECESSED BRACKET ‘
IS .50 LESS THAN OPENING HEIGHT
SPECIFICATION
TA INSTRUMENT
CASE CO.
—
4S25 Alger St.,
Lo@
Angslea, (kdifomla 90039
r-1
2
(81S) 242-s$55
DEPTH
k
TWX WO+7~780
Code Idmt s3031
@
1985
15
.-
.,
i.
.
MAN-MACHINE
MEMBRANE
.. .... .
. .. . .. . ~...-.—.
. .. .
. --.....-— — . ..—.-,... ...
.
.
<
. ...-..,,
I
“
INTERFACES
SWITCHES
Membrane switches are normally open, momentary contact switches. Their light weight and low
profile (0.030” -0.040” thick) make them ideal for use on portable equipment and on rack console
and desktop units where space may be limited Membrane switches are more reliable and
economical than conventional switching systems. Further, they add design flexibility which simply
isn’t available with any other switch technology.
Simplicity = dependability. The switch consists of two contactq one above the other, separated by
a specific volume of air. Finger pressure on the top contacts closes the switch, and release of
pressure opens itThe contacts are usually made of printed conductive ink Therefore, membrane
switches are designed specifically for low voltage and low current applications (see technical
specifications).
HYBRID SWITCH PANELS
Membrane switches are made of flexible materials. Hybrid switch panels utilize some aspect of
membrane switch construction, but are built on printed curcuit boards They are therefore a hybrid
of membrane and PCB technology.
All hybridswitch circuitty is usually contained on the PCB and switch closure is performed by either
a printed membrane or a metal dome ( as in a tactile switch). Hybrid switches can be mounted
directly to your chassis Wh no additional subpanel required. They can also be supplied as a sub
assembly complete with connecto~ hardware and LEDS mounted and ready for installation.
Significant savings result from the reduction of the amount of components necessary to order,
stock and assemble. Hybrid switches provide all the advantages of design freedom offered by
membrane switches as well as conventional mounting and connection techniques
C-14
~~
~
CIPTKM$%
The optional features shown below cannot be ordered by standard TA part
number code shown on page 6, but require a modification suffix be added by TA
Sales Department upon receipt of order.
-—
ACCESS DOORS
The exclusive TA access door can be added to most etandard lnstrument cases, provided enough clearance Is allowed for hard-
ware mounting and corner radii. The access door Is particularly
useful for ventilating electronic
Slzts
equipment
when In operation or
—ACCESS
OPENING
LENGTH +1.1 5
~
tooled● s of date of
PubScation.COntSctTA
S.le$ Departmenttor
additionalIntornwtlon.
I
I 3.9u ]
-02
1
7“SDR
ACCESS
OPENING
TCWD15
I
—
Pli!l
equipment requiring frequent maintenance. It allows quick aocesa
to test leads or power cables when direct connection into lnstrument panel is impractical. Custom sizes available on special
order. See Technical Data Sheets 8142 and S143 fOr details.
fm
I*
n
@
f
dl.12L\
—.
—
. .... .
——-+
. —..
... ., —..__-—.
v
/
L
a
CAPTIVE SLOTTED THfJhlBSCREWS
OTY VARIES WITH DOOR SIZE
GUARD R;SS AVAILABLE
ON
STANDARD SIZESONLY
. . . .. . . .
--. —-—
-—
and fittings are watertight. If not, an access door can be provided
to cover the cup when not In usa. Contact TA sales depafiment for
TA offers recessed cups which can be used either alone or In
combination with an access door. These cups allow for the mounting of fittings and connectors In tha aides of a case wfthout
list of standard sizes available. Custom sizes available on ap9Clal
ordar. See Technical Data Sheet 8129 for further details.
Compromising the watertight Integrity, provldlng the connectors
-’
6$,
.!.
.:.~~.
‘..,,...
.
“-
R2
-I
RN TO
FICATION
WI
RECESSED
TA’s recessed
mount
ERACIIZT
not requked with the door open. Openings at each end allow COOlktg for internal components.
See Technical Data Sheet 8131 for
bracket Is used with a watertight access door to
controls,
connectors,
Indicators,
etc. In a protected
recess
further details.
on the sides, front, or rear of a case, when watertight integrity Is
ACCESS OPENING
THRU CASE I COVER WALL
BOTH ENDS OPEN
I
.
I
HOLE PATTERN
CUSTOMER
TA INSTRUMENT
TO
FLAT AREA OF RECESSED BRACICa
IS .50 LESS THAN OPENING HEIGHT
SPECIFICATION
CASE CO. 4s25 AIgar st., LOSAngeles.oatltoms sccss
(ala) 242.sB55
C-15
TWX 91ti97475c
cods Idsnt e3asI
@ 1985
15
FRONT DISPIAY
PANELS&
OVERLAYS
Most membrane switches incorporate a front display panel. Overlays are usually printed on
polycarbonate or polyester materialq with all printing subsurface for durability.The surface of the
overlays can be treated with special coatings to improve chemical and abrasion resistance and to
vary the surface texture. Any color or combination of colors are possible. JAYCO can match to
federal standard, Pantone or your supplied color chips
Various adhesives are available for different applications or the panel can be supplied as
assemblies complete with hardware.
KEYBOARDS AND KEYPADS
These simple switch arrays usually do not incorporate all the design features available with custom
membrane switch panels. Since JAYCO manufactures custom keyboards and keypads to your
precise design there are no limitations regarding size, layout number of switches circuitw or
graphic design. You receive an economical keyboard with no standard keyboard compromises
SILICONE
RUBBER KEYPADS
Refer to separate data sheet for full information.
SPECIAL PROJECTS
JAYCO manufactures man-machine interfaces for a variety of applications. Occasionally, an
application requires a solution best provided by resources in addition to JAYCO. JAYCO will then
pool their resources, expertise and contacts throughout the industry on your behalf to create the
ideal solution for you. As a project leader, JAYCO will assume full responsibilityfor the project from
design to delivery. You receive technical help, service and commitment of the same caliber as if
JAYCO was manufacturing the pafi And, there is no risk JAYCO will only accept projects that are
within their capabilities
TECHNICAL
SPECIFICATIONS
Typical Values
CURRENT RATING
50mA at 30VDC
CIRCUIT RESISTANCE
Leaa than 100 Ohms
CONTACT.BOUNCE
Less than 5 Milliseconds
(nomtactile)
Less than 20 Milliseconds
(tactile)
INSULATION RESISTANCE
1 Gohm Min at 100 VDC
..
●
DIELECTRIC STRENGTH
250 VRMS Min
CAPACITANCE
27 pf between any
two traces
ACTUATION FORCE
Variable from 80 Grams
OPERATING TEMPERATURE
4WC to *“c
OPERATIONAL LIFE
Greater than 5 Million Operations
(non-tactile)
Greater than 1 Million Operations
(tactile)
TERMINATION
Sarg “Clinched offered as standard
TOLERANCES
+ or4.01 O“as standard
EMBOSS HEIGHT
mol 0-0.015“
The information contained herain is believed to be accurate and reliable, but is for guidance only. Customers should verify psrforrnance to
apecifiitions
in actual conditions of use
C-16
cor4s~3L!P4ER
For 19” PANEL
MOUNTED
EQUIPMENT
I
Consoliners may be used as storage, transit or Permanent housing for 19” rack ~ulPment
with panel heights
from 5%” to 26%” high. Like most TA cases, Consoliners are watetlight and Can be produced to conform to
any applicable military specification.
(INCLUDED IN STANDARD CONSOLINER
NUMBER)
●
●
-4
●
●
●
●
●
●
●
●
(CANNOT BE SPECIFIED BY STANDARD CONSOLINEFI
PART NUMBER. CONTACT TA SALES DEPARTMENT
FOR ORDERING INFORMATION)
PART
Dual covers available with or without panel mounting
rails at either or both openings as shown on page 14
Panel mounting rails available in cover as well as case
body for mounting additional instruments
Automatic Breather Valve (TC78V07 on pg 26) In place
of manual pressure reiief valve
Watertight access doors, recessed cups and recessed
brackets as shown on page 15
Continuous panel rail to fili gap between top and bottom
of customer panel and inside of case body
Shear lugs, guarded handles and latches, and sillcone
Chevron seal for extremely rough use
Provisions for chassis siide mounting or rear chaasis
support
Stacking receptacles can be added to allow stacking
several Consoliners on top of each other
Foam inserts or lining in cover above storage tray
assembiy
●
Watertight neoprene Chevron seal
Either 2 or 4 chest handles (TC81Y09 on pg 26) for ease
of carrying
Panel mounting rails with pra-punched EIA/NEMA hole
pattern
10-32 panel-mounting
cllpnuts supplied
loose for
customer installation
Manual pressure iellef valve (TC78V01 on pg 26) located
wlthln handle for protection
Choice of O.lW’ (Code P) or 1.35” (Code U) panel rail
recess Iocatlons
Toggle latches (TC82Z13 on pg 26) located on cover so
they don’t interfere with equipment operation (except on
body on cases with mlnlmum (1.59’) cover height)
Spherical bumpers on hinge side of case (except 7“
deep bodies) as well as either dimples or bumpers
opposite opening
Storage tray assembly available in cover (or both covers
if dual cover case) see page 14
Choice of 12 panel heights, 3 cover heights, 4 body
depths, 4 finishes
Continuous separable hinge for cover removal
Available In fabricated construction only (see page 8)
from 0.071” thick 6061-T4 aiuminum
●
●
●
PANEL RA:LS
IF
1.3s
-f
RECESSED
<
RAIL CODEU
PANEL MOUNTING SURFACE RECESSED 1.3S”
BELOW
PARTING
MOUNTED
LINE TO PROTECT
COMPONENTS
SUCH
PANEL
AS KNOBS,
SWITCHES AND METERS. OTHER RECESS
DEPTHS AVAILABLE. CONTACT TA SALES
DEPARTMENT FOR MODIFICATION SUFFIX.
NOTE ALL RECESSED PANEL RAILS ARE
CODE
U REGARDLESS
DIMENSION.
r“
T
.10
RECESS
FLUSH RAIL CODE P
PANEL MOUNTING SURFACE RECESSED
0.10” BELOW PARTING LINE POSITIONS
CUSTOMER PANEL APPROX FLUSH TO
TOPOF
lo
OF
TA INSTRUMENT
NOMINM
Th
S13E
=
H
=
HUSSES IwSt
E
Ho.
PAm
no.
OF
LmsE2
HMOI.E2
SMlmlm
OF
33
6.34
6.45
2
2
34
a.oe
7.21
2
2
15V4°
17’,+”
19W
21”
24,h*~
35
36
37
3a
3s
M41
42
4$
9.s4
11.59
13.34
15.09
164s4
lase
20.W
22.09
8.95
10.70
12.45
14.20
15.ss
17.70
19.45
21.20
2
2
2
4
4
4
4
4
2
2
2
2
z.
25.59
26%”
44
27.34
24.70
26.45
4
4
5%”
T
w.”
10%”
12%”
,4,*
IVE IIF
SLIPNUTS
BUMPER
suPFuEn
OrPom mm
m Som
OPESIHE
MO.OF
2
4
4
4
4
4
4
8
8
8
8
.8
8
8
8
4
8
DIMPLE
DIMPLE
TC01E75-1
TCOI E75-1
TCO1E751
TCO1E75-1
TCO1ET&l
TCOI E7$I
TCO1E?&l
TCOI E751
TC01E75-1
TC01E75-1
STRIKER RIM
CASE
CO.
4S25 AlgarSL, Lo8Angelti,
Cdlfornla~o
C-17
(BIB) 242-SS55
TWX 910497-7oo
Code ldent 5s031
@ 19s5
I
I
I
[
.
SUNDSTRAND DATA CONTROL’S
Q-FLEX@ SERVO ACCELEROMETER
,,,
,_”
.“$’yi!!+
+ ,:>,.* ?‘m”>
(
“ .
“b==
I
I
-.,----- .“
.,,~.:
I
,“
!
1
I
I
i
EisAzY..es
Cost-E;fective High Accuracy
Field-Adjustable Voltage
Sensitivity and Range
Better than 5 micro g Threshold
and Resolution
Dual Built-h-i Test Capability
Wide Dynamic Range
[
f
I
“~
Sundstrand Data Control’sQA-900 Q-Flex@ servo accelerometer
isspecifically
designed for the high accuracy, low frequency
application.
Consistently Repeatable
Accuracy and Stability
Self-Contained Sensor and .
Electronics in One Small
Hermetic Package
!
●
High Accuracy, Low Frequency
Environments:
The Q-Flex@ accelerometer is the only linear servo instrument
with a patented etched quartz seismic system for completely elastic
non-wearing suspension. This seismic system and a specially
designed solid-state
hybrid electronicsmodule are contained in one
miniature hermetic package.
The QA-900 electronics develops an acceleration-propoflional
servoed current “when in operation. This current keeps the seismic
element in a position-captured mode. In this mode, the
accelerometer provides an accurate and continuous measure of
both static and dynamic acceleration with no low frequency roll-off
errors.
The QA-900’s voltage sensitivity and/or range maybe changed at
any time by simply changing the external, user-supplied load
resistor. Changing the load resistor will not affect the QA-900’s
performance characteristics or frequency response.
Laboratories
Research Centers
Equipment Monitoring Stations
Instrumentation Facilities
C-18
7Z9&3R3iaaaR
Data
PERFORMANCE
ELECTRICAL
Range
*20g
Frequency Response
0-10!+2
10-300 Hz
*0.1 ‘A max
NaturalFrequency
500 Hz min
Linear
Output
Sensitivity
Current
Thermal
*5°/0
Transverse
Isolation,
max
1.3mAlg
Coefficient
180 ppm/°
Sensitivity
nom
Shock
30pg/g2 max
Damping
Ratio
0.3 to 0.8
at 50 VDC
+
to +85°C
-54°c to +107*C
100g peak
250a oeak. 6 msec
Limit
Sine Vibration
max
Error
-40*C
StaticAcceleration
Overrange Limit
90pg/0 C nom
Linearity
10 megohms
StorageTemperature Range
C nom
0.002q/9
15mA per supply
case to all pins
Specified
Performance
Temperature
Range
10mg max
Coefficient
VDC
ENVIRONMENTAL
5gg max
Bias
Bias Thermal
*13 VDC to *18
@iescent CurrentMax
Resolution/Threshold
Current
InputVoltage
Limit
30g
peak,
20 to 1800 Hz
PHYSICAL
Weight
65 grams
“.
Division. Sundstrand
Data Control,
Inc. 206/885-3711.
‘
Sundstrand Data Control, Inc. n
flEDMOND. WASHINGTON
9SJ252 ‘~
uml of .%ndatrand Corporation U*
C-19
.
, Advanced
Electronics
FM
●
*
..
,.5f::&
g.,
.....:-... 5
SG 128, IVIG128, SG 158 S&ies
120 and 350 OHM Quarter Bridge
Measurements from –452° to 6000F.
,.
For Static and Dynamic
,,*
..-
.Lf?
;“-’--”:-.
SG 128
SG 158
.
.
FEATURES
●
●
●
SELF TEMPERATURE
NICKEL-CHROME
ALLOY
120 AND 350 OHM RESISTANCE
●
ALL WELDED
●
●
INTEGRAL CABLE
NO ADHESIVES REQUIRED
●
SIMPLE RAPID INSTALLATION
.
-.
;
CONSTRUCTION
. ..
in temperature
-75 F and other cryogenic ranges.
‘
sDans
– 452’
to
“
Every Ailtech Strain Gage is pre-tested at the factory to
its maximum operating temperature to assure proper
operation in its intencted application.
Ailtech Weldable Strain Gages are easily installed using low
energy capacitive discharge spot welding equipment. A series
of spot welds quickly makes the gage an integral part of the
test structure. assuring complete strain transmmsion.
,. 1
-1
.,-, .:;.
.,. .1*
..;!::
-..:
:..-)
:
...-
“
.
‘
The 350 ohm filament permits higher excitation voltages and
reduces errors associated with long leads. All closures on
these strain gages are welded. This all-welded construction is
the only ‘type gage readily usable in hostile environments such
as nuclear reactors, steam turbines, and pressurized
chambers.
,
-+.
provide more
from
4,.
...
.:;:.:
,.
self-temperature compensated for your material. Quarter
bridge gages are normally used from 75- to 600’F for static
measurements. Half bridge configurations
,.!
,:
AlLTECH Weldable Strain Gages are available with 120 and
~ 350 ohm, quarter bridge, nickel-chrome filaments, and are
suitable for static and dynamic measurements from -452
to
+600-F. They provide minimum apparefit strains and are
Compensation
i
.“
DESCR~PTION
A[LTECH Sealed Strain Gages are quickly installed in the
‘
field, providing immediate, reliable strain data — in almost any
environment — al the lowest overall cost by eliminating hours
of tedious preparation. installation and gage protection
procedures.
precise
J
‘:,c.:~
.:, ~ ....
:: :;’ ,.‘,?iii+;
,....,..
,..,;!
.,,
\
1
i
COMPENSATED
●
I
I
:
HIGH TEMPERATURE
600 F STATIC AND DYNAMIC
●
‘\, -
,@j2a
‘-
-.
.. . .
.L
.,.
4
Eaton Corporation
Electronic Instrumentation Divi
i-rail
,dvanced
Electronics
5340 ALLA ROAO ● LOS ANGELES M 90066
TELEPHONE:(213) 6.22.3061 ● TWX 91 *343-6%9
.
:,
.-
.
ELEHRICAL
SPECIFiCATIONS
Gage Factor Change with Temperature:
Strain Gage Resistance
Model:
SG 128
Resisterrce:120 ohms=
MG 128
SG 158
1‘ 350 ohms* 10 120 ohms z 5
*When compensated for materials with thermal coefficient of
expansion between 6.0 and 10.5 ppm/OE = 3 ohms when
compensated for other expansion ranges.
Gage Factor varies inversely with temperature approximately
1% per 100”F over the compensated temperature range.
Additional Environments:
The strain gages have been subjected to the following
environments and levels without deterioration of performance.
Linear Sinusoidal Vibration: 359, 20 to 2000 cps
Static Acceleration: 50g
Shock: 100g half sine, 7 millisecond durat!on
“
Acoustic Noise: 150 db
Ambient Pressure: Vacuum to 4000 psi (2500 psi for .125
.
dia. cable)
Integral Lead Wre Resistance
.09 ohmslft. at 75’F
Excitation
Current
Continuous: 50 rna maximum
Pulsed: To 300 ma Depending on operating temperature and
test structure.
Insulation
MECHANICAL
Resistance
Greaterthan 1000 megohms at 50 vdc measured at 75°F
PERFORMANCE
Electrical Connections:
Red — Active, Black - Dummy, White-Common
SPECIFtCATtONS
Gage Factor
SG 128 and SG 158
- MG 128
Strain Gage Center:
1.9 Nominal
1.7 Nominal
of the gage, ge center is at the center of the mounting flange.
Actual gage factor is reported for each lot.
Gage factor for all gages within a particular lot is within
=3%
.
Rated Strain. Uvel:
= 20,000 microinches per inch
Fatigue Life:
Exceeds 10e cycles at z 1,000 microinches per inch
Transverse Sensitivity:
Negligible (Line weld between strain tube and mounting
flange)
ENVIRONMENTAL
SPECIFICATlONS
Operable Temperature Range
.
StatiC and dynamic measurements -452
Active Gage Length:
0.91” for SG 128,0.61”
for SG 158 and 0.21” for MG 128
Strain Gage and Mounting Flange Material:
AISI Type 321, Stainless steel. Intended for mounting on
weldable ferrous and nonferrous materials excluding
aluminum and magnesium.
Lead Mre:
Three No. 28 AWG nickel-clad solid copper wires individually
insulated with braided fiberglass sleeving that are installed in
a 0.093” diameter Type 321 stainless steal tube for up to 50
foot lengths and
., .125 dia. to 100 feet.
ORDERING iNFORMATION
Detailed ordering information and available options are
shown on a separate instruction sheet.
to 600SF,
Compensated Temperature Range
Gages are individually temperature compensated
Temperature Range
Designation
75 to 60tYE
-01
-11
0 to 180°F.
.-09
SPECIFICATfONS
Strain Gage Configurations:
Refer to dimensional outline drawings shown on front.
Special Range
(Specify on order)
Caution: ff the temperature..of the strain gage exceeds
650”F, the temperature compensation will be irreversibly
affected.
Apparent Strain vs. Temperature
Each gage is adjusted to an optimum unmounted terminal
slope value, depending upon the material on which the gage
Standard Gages
Standard Gages are stocked in limited quantities for
immediate shipment. These gages solve the majority of strain
measurement problems encountered. They include ten feet of
integral cable, and are compensated to match 1018 steel (6S]
or 321 stainless steal (9S) over the temperature range of 75
to 600W.
Custom Gages
Ordering of Custom Gages with other cable lengths,
i
temperature ranges, options, compensations etc., requires a
.detailsd build-up of the custom model. number.
Consult
factory
for further
information
or applications
assistance.
is to be mounted, within a strain tolerance of 50 microinches
per inch. When the gage is installed. the mounted terminal
slope will be zero within a strain tolerance consisting of the
summation of= 75 microinches per inch and= 3% of the
unmounted terminal slope.
~
:$
z
z
0
- lm
.Y
a
-~
-WY
-a
-q
.
-200
4
-m
APPUWt $tmn w. Tomp-lwm
C-21
-a
CWWO (Typid)
●6UJ
F
-m
.Im
HIPPY IZI
I-EWE COMPEN5HTOR
.
—-—
,-
-y—~i-T-T~-~
.
iil
i;
I
-
:“
t
—. — .___/.,
~
~;!(”
—t”
.
L—___
I
._ ---.—
.!
I
-...
!J:~
L.
i
11
i
“~
‘ :
— ‘ .yy-..,
- ——
1,!
———
______
j
I
‘~i
!Ilii
. -——
-“-~-l
.
I j
i–- w
[~’
“1
* . ... . . . . . .
~i
il~~l!ll
_{._..._ ..;
i , , .,.*.__.._j_._.~_
~---$—.*
●
L_.-–:.+_...
-1
r
:/;
1.
,.~
i
1
I
1
I
&
l,,
i
~
~;
i.”!”
“~“ “;. .,*
-1
!~ll’
_{...._-._;._
I
;.. .—.
;1.”1_
---——-- —.. .--.-—“.:.
,-- —.--.-,.—
i -!4.
~ [--~~)!
~1~
-.
‘ .. __l_~__]LiL1-.___
L.
J’”
--+_.
-
I
–
—
T
... .. .,-..+
.- L.._
‘
Ji
_,
1
summary
The
Hippy-120
demands
heave
of a large
maintaining
compensator
frequency
the conception
designed
range
stabilizer
to give
and a low ship
a satisfying
manoeuvring
appearing
to the conflicting
is used with which we have long experience
(wave measuring
in a much
buoy).
. The pendulum system, natural period 120 seconds, attenuates
and the re;ainder,
answer
sensitivity,
which does not need attendance,
of an instrument
except a yearly check.
To this purpose a pendulum
tougher environment
has been
working
at frequencies
ship manoeuvring
around 1/120 on 1/60
Hz, is filtered
effects
out
by a digltai band pass filter.
This filter allows true phase and amplitude transfer in the frequency range down to
1/30 Hz together with sufficient suppression of ship manoeuvring effects at
t/ 60 and 1/120
I+z.
The lowest frequency in the working range is of utmost importance
has to be with the wave
can be substantially
The system
so lifetime
After
lower
than
not contain
is rtot limited
power
initiated
does
direction,
wave
moving
up, communication
data
sequence.
when sailing
frequencies
frequencies.
parts,
Datawell bv
excapt
gimbal
rings,
laboratory
by wear.
by the end of selftest
baud rate,
as in this case the encounter
(on RS232
(fixed),
scales
for instrumentation
Zomerluststraat
or RS422)
or by a message
and format.
is either
automatically
specifying
.
2012 LM
4
Haadem - The Netherlands
tel. 023-316053
telex: 41415 datel nl
c-22
J?sc:ipnnn 01 tieavecompe” .ators versions Elanri C
The heave compensator
can be delivered in two versions B (analog) and C (analog + dig,tal).
Acceleration is meas~~ed by an accelerometer mounted on a gravity stabilized platform
pendulum
or an equivalent
length
The same pla~orrn
is used as a reference
The ana/og
is
ve=idn
manoeuvring
[obtained
by analog
acceleration)
for pitch/roll
double
real time
heave
integration
of
The
For compensation
purposes,
and
both amplitude
between
working
of which
4
range
range
extension
improvement
to 1.7%
problems
times
frequencv
15 to 30 sec period] leaving
(from
One degree
amplitude
sec
an
and turn around
times is used for a two
for turn around false output
of about
suppression.
seventeen
an
times.
An automatic warning is given when, due to
error.
The resulting
of Izo
of about 70 times in the compromise
phase must be true in the working range.
phase error is equivalent
period
digital version (delayed filtering) givx
improvement
roll and acceleration.
pitch,
a natural
measurements.
only for slow
intended
use. It delivers.
with
km.
of 3.6
compensation
error can be expressed
Ooppler shift, too much heave energy is present
in the ‘error vector’ i.e. the relative vectorial
below 0.033
difference
Version C is an extension
between
true and indicated
displacement
Hz.
of the B version.
vector.
If ship speed, with wave direction,
value comparable
frequencies
increases
with wave velocity.
are lowered
a
to
min. width
the encounter
due to Doppler
576 mm
/.
shift.
w.
Futiher the turn around effects increase
praporhonal
to the ship speed squared.
~
Turn around means 180” course change.
The Doppler
working
shift asks for an extension
range to lower frequencies.
theory dictates a larger sensitivity
effects proportional
period in the working
The resulting
‘-
““---
I
of the
However,
A
filter
for turn around
to the square of the longest
max. height
840
mm
range.
compromise
limits the applicability.
specifications for heave pitch roll sensor,
‘-=-.=-4$
.....—
Hippy-120
..—
A
Version
The Hippy-120
B
c
analog
digitized
analog
digitized
x
x
x
x
x
x
analog
x
x
x
x
x
x
x
outputs:
Heave
real time Heave
77.2
sec delayed
Programmable
Pitch/roll
Heave (digitally
filtered)
scale
Real time SIN (pitch ?roll)
digitized
Programmable
Vertrcal accleratmn
Error
Heave
0.32
(degrees/SIN)
.,
analog
digitized
sec delaved
& 80 sec delayed
- Heave between
1/60 and 1/30 Hz
analog
digitized
x
x
x
Error warning
Error Heave level detector
Flag
supply
Any voltage
10-30Vdc
between
7.5
Power consumption
0.25
Temperature
range
vihrarlof7
-5-
Storage
Woik!ng
W
+40”
o-
range
x
C
35’C
x
x
w
x
x
x
x
x
<:16 Hz
1 mm peak max.
x
x
>-16 HZ
1 g
x
x
x
x
peak max.
see figure
120 kg
, C-23
heave/acceleration
Error vector
Analog filtered Heave
Digital filtered Heave
Acceleration
3.5%( 0.067-1 .OHZ)
3%(0.033 -O.5HZ)
<l%
for<
O.5Hz
1.6 Hz cut off, 5th order
programmable
programmable
1 V/m
1 Vim
1 V/m/sec2
Scale accuracy (within temp. range)
<1.5%
42?6
< 1.5%
-10 -+10 V [2048
Range
–10 -+10
Change in accuracy during 1 year
<1%
<1%
Zero offset
Time delay
<5cm
zero
zero
77.20
version C
version 8
I
programmable
State digitized output
Scale analog output
Turn around (180° course
false
heave output
(cm)
Far other
course
V (2048
bits)
<1%
p<1
sec
zero
and speed changes
4x [ship speed (m/sec)]z
see next page
160 msec
Acceleration
10
msec
Analog filtered Heave
10
tnsec
Pitch/roll
10
msec
Error/Heave
2.72
Pitch angle is angle between ro//axis and horizontal plane.
Roll angle is angle between pitch axis and horizontal plane.
10 SIN (pitch/roll
Scale analog
angle) V
Programmable
digitized
Output range
-10-
Linearity
<0.05°
up to
5°
<0.1 5“
up to
30”
<
_lOV
1“ UP
(2048
bits)
to 60”
Zero offset
Within
temp. range <0.5°
Zero stability
Within
time over, 1 year<
Noise
<0.05°
For sinusoidal
Aa
For sinusoidal
change
acceleration:
and period tlrne T >>120
a is peak value of horizontal
accelerations
Aa = A s/3600
For sudden
is caused by horizontal
accelerations
Aa = alg (radian).
(radian)
sec
Digitally filtered Heave
‘ Definition
offset
sec
0.32
0.24x [ship speed (m/sec)12
-
A temporary
m/sec2
0.32
change ):
Update cycle of analog outputs (version C)
pitch/roll
-10 -+10 V (2048
bits)
and period time T<<
see:
acceleration
(m/sec2.1
120 see:
“
As is peak value of horizontal’ displacement
in ship speed (V m/see):
Aa = A Vl180(radian).
C-24
(m.)
1°
sec
bits)
MULTIPLE PAIR 1NDIVIDUALL%SHIELDED (cc)nt’d.)
22 GAG= (cent’d.)
STRANDED
(7 x 30) .76 mm diam.
CONDLiCTORS
9767
P
w
2493
60C
z~
GAGZ
STRANDED
100
305
442
250
76.2
112,4
500
1524 I 228.8 tin;~~coppptr
3048 ;J876
‘
49.2iultm
I
1000
CONDUCTORS
[10
11.24-UM
37.lrukm
22 [7X30)
[.76]
37
.850
21.6
60
66V.
30
I
9a
55
180
1.7
armmwPvc/wef.
x 20) .94 mm diam.
1,1!,lH! COnplV
,111,.lt,t~t~!
.,11,.,,1.. ,.(1,, ,.. ,1,,.
cdw
(h:,,,! w,,,. ,.>:s,lWG ,,,, .b?AWL’,IIti W AWG>LWW-%n
AK’(;,][s!tl JW(:
wfesl tmu!r HEL L-IF(lIL MIIIWU mI potvt!sfet MM !lt 1.,w Y.’II1cfirm III. 17l)L.,, u‘htv
III .SMW,, ht.dhfn<t,,,<..I<,I.,W b,.fti,.,.,, -41
V,.IA
t MI, dI,IIt, t, r,. m,,<JI I;II(W,VMI,,
..1,,!,-/,!! I 1,{i,,f... u,ll ,!, 1: ,,,, ,!! ,,,!,, ,,..,,,.,:,,1, ,. ,.,.,.,.1..,,,.,,
11.3{UM’
37.lf-Lkm
.!7,,,‘1,.1)!),,1!,:,,,1 1,,, 1!,,:,
3
.356
,,,1..,.1,,41
9,04
, ,>, ,,,.,,,...,,
, ,G,,,t
,,.,,,,.
r ,..,
,.,,
.
. ...;,
50
66%
30
9B
55
180
2.4
50
66%
30
90
55
180
2.4
CtlrmrwPwlm.
:98
500 I ’52:
632
!000 i XJ4 }: I 12: :
.250
%3
100% Individually
$hloldad Pairs
211!?3
I
762
II
60C
...— —-.
11.3 fL’M’
37,1 fllkm
,&9$M,”
6
I .471 I 11.96
ChrOnwPK j-f.
34,4&rl
i
100 13051;05
/50 1?5JISI0
500 1521 I !01 6
!000 ?0,:H I ?0.12
m
24~x
60C
20 (IOX30)
,o[#JM,
11<3iL’M’
3?.l~km
$
180
2.4
55
180
2.4
55
180
2.4
98
55
160
2.4
30
98
55
160
3.9
88%
30
86
55
180
3.9
86Y9
30
90
56
180
3.9
66%
50
66?4
50
66%
30
50
66%
;
50
66%
TT-R-Tm 60
T-1-G-h
Chmfno PVC;xRef.
34.41h’km
11.3WM’
37.lwm
55
50
11.3jLM’
37.ll}km
9876
3098
T
3098
T
1
12
I .600 t 15.24
98
CfLnmwPvc;asr.
—..
——
98791
%
~*lJJ
1.
.4...4
‘ 1o11‘ ?05
‘~ ‘)5
~~; I ifi ~! Ill
20(IOX30)
, I !,:’ .1
I 3;* !
:;0.1}!
2!)I ?
10!%]M’
34.41LJkm
‘
1000
60C
18 GAGE
STRANDED
—.
—.. —
t
! 00
500
000
?3
60C
—.
9774
I
w
lW.
305
!+1
-.
w
r.
.163
!)1 5
3
I .398 I 9.96
,
Chruw PVCixkoi.
I 00
‘loo
(h-lo
.
60C
—. ..—.
9775 I
,.
152.1
:!04 n
diam.
8.3fVM’
27.2(ukm
18 [16x30)
[1,19]
6.4fuM’
21fuknl
30
Uffmrc W
@ckcI.
24ti
Indlvidully
Shlaldod Paha
I 16.64
Clwmm Pvc ,axet.
(16 x 30) 1.19 mm
.----4$ m
w-
15 I ,655
1.
CONDUCTORS
9773
ll,3fUM’
37.lwkm
‘0!1
;;~ ,
:(10[)
‘:IJ 1
.h : ‘)
,,00
W&
6.4(1!M’
21iLxm
I
S.3Q’M’
272Wkm
9
I .6551:5W
ChfomoPVC Ixmf
50
.
SHIP
STRUCTURE
COMMITTEE
PUBLICATIONS
SSC-333
Advance Methods for Shi~ Motion and Wave Load Prediction
by William J. Walsh, Brian N. Leis, and J. Y. Yung
1989
SSC-334
Influence of Weld Porositv on the Inteurity of Marine
Structures
by William J. Walsh , Brian
N. Leis,
and
J.
Yung
Y.
1989
SSC-335
Performance
of Underwater
Weldments
by R. J. Dexter,
Norris, W. R. Schickr and P. D. Watson
1986
SSC-336
LiQuid Slosh Loadinq in Slack Shi~ Tanks;
Forces
Internal Structures
& Pressures by N. A. Hamlin
SSC-337
Part 1 - Shi~ Fracture Mechanisms
A. Stambaugh
and William A. Wood
SSC-337
Part 2 - Shi~ Fracture Mechanisms
– A Non-ExDert’s
Guide
for Inspecting
and Determining
the Causes of Significant
Shiw Fractures by Karl A. Stambaugh
and William A. Wood
1987
SSC-338
Fatique Prediction
Corner Strain Data
1985
SSC-339
Ice
Loads
C. Daley,
Investigation
1987
E. B.
on
1986
by Karl
Analysis Validation
from SL-7 Hatch
by Jen-Wen Chiou and Yung-Kuang
Chen
and Ship Response to Ice – A Second
J. w. St. John,
R.
Brown,
J.
Me~err
Season
by
and
Glen
I.
1990
SSC-340
Ice Forces and Shi~ Res~onse
by C. Daley, J. W. St. John,
SSC-341
Global Ice Forces and Ship
J. W. St. John, B. Cowper,
SSC-342
Global Ice Forces and Shi~ Response to Ice - Analysis of
Ice Ramminq Forces by Yung-Kuang
Chen, Alfred L. Tunik,
and Albert P-Y Chen
1990
SSC-343
Global
Season
SSC-346
Fatique Characterization
of Fabricated
Ship Details Phase 2 by K. K. Park and F. V. Lawrence,
Jr.
1988
None
Shiw Structure
Bibliography
to Ice - Consolidation
R. Brown, and I. Glen
Report
1990
Res~onse to Ice by P. Minnick,
and M. Edgecomb
1990
Ice Forces and Ship ResDonse to Ice - A Second
by p. Minnick and J. W. St. John
1990
Committee
1983
Publications
- A Special
COMMITTEE
Commission
National
ON
MARINE
on Engineering
Academy
STRUCTURES
and Technical
of Sciences
- National
Systems
Research
Council
The COMMITTEE
ON MARINE STRUCTURES
has technical
cognizance
over
the interagency
Ship Structure Committee’s
research program.
Stanley G. Stiansen
(Chairman),
Riverheadr
NY
Mark Y. Berman, Amoco Production
Company, Tulsa, OK
Peter A. Gale, Webb Institute of Naval Architecture,
Glen Cove, NY
Rolf D. Glasfeld,
General Dynamics Corporation,
Groton, CT
Boca Raton, FL
William H. Hartt, Florida Atlantic University,
Paul H. Wirsching,
University
of Arizona, Tucson, AZ
Alexander
B. Stavovy, National Research Council, Washington,
DC
Michael K. Parmelee,
Secretary,
Ship Structure Committee,
Washington,
DC
LOADS
WORK
GROUP
Paul H. Wirsching
(Chairman),
University
of Arizona, Tucson, AZ
Subrata K. Chakrabarti,
Chicago Bridge and Iron Company, Plainfield,
Keith D. Hjelmstad,
University
of Illinois, Urbana, IL
Neshanic Station, NJ
Hsien Yun Janr Martech Incorporated,
College Station, TX
Jack Y. K. Lou, Texas A & M University,
Naresh Maniar, M. Rosenblatt
& Son, Incorporated,
New York, NY
Corvallis,
OR
Solomon C. S. Yim, Oregon State University,
MATERIALS
.
.
*
William
Fereshteh
Santiago
Paul
A.
WORK
IL
GROUP
“
Hartt
(Chairman),
Ebrahimi,
University
Ibarra,
Jr.,
Amoco
Lagace,
Massachusetts
H.
Florida
Atlantic
University,
Boca
of Florida,
Gainesville,
FL
Corporation,
Napervill@,
IL
Institute
of Technology,
Cambridge,
John Landes, University
of Tennessee,
Knoxville,
TN
Mamdouh M. Salama, Conoco Incorporated,
Ponca City, OK
Newport
James M. Sawhill, Jr., Newport News Shipbuilding,
News,
Raton,
MA
VA
FL