1
JSS
Journal of Statistical Software
June 2014, Volume 58, Issue 2.
http://www.jstatsoft.org/
R Marries NetLogo: Introduction to the
RNetLogo Package
Jan C. Thiele
University of Göttingen
Abstract
The RNetLogo package delivers an interface to embed the agent-based modeling platform NetLogo into the R environment with headless (no graphical user interface) or interactive GUI mode. It provides functions to load models, execute commands, push values,
and to get values from NetLogo reporters. Such a seamless integration of a widely used
agent-based modeling platform with a well-known statistical computing and graphics environment opens up various possibilities. For example, it enables the modeler to design
simulation experiments, store simulation results, and analyze simulation output in a more
systematic way. It can therefore help close the gaps in agent-based modeling regarding
standards of description and analysis. After a short overview of the agent-based modeling
approach and the software used here, the paper delivers a step-by-step introduction to
the usage of the RNetLogo package by examples.
Keywords: NetLogo, R, agent-based modeling, ABM, individual-based modeling, IBM, statistics, graphics.
1. Introduction
1.1. Agent- and individual-based modeling
Agent-based models (ABMs) or individual-based models (IBMs), as they are called in ecology
and biology, are simulation models that explicitly represent individual agents, which can be,
for example, humans, institutions, or organisms with their traits and behavior (Grimm and
Railsback 2005; Gilbert 2008; Thiele, Kurth, and Grimm 2011). A key characteristic of this
modeling approach is that simulation results emerge from the more or less complex interactions
among the agents. Therefore, such models are useful when local interactions on the micro
level are essential for the description of patterns on the macro level.
2
RNetLogo: R Marries NetLogo
The origins of the ABM approach go back to the late 1970s (e.g., Hewitt 1976) with the
development of so-called multi-agent systems (MASs) in computer science as a part of the
distributed artificial intelligence (DAI) research area (Green, Hurst, Nangle, Cunningham,
Somers, and Evans 1997; Sycara 1998). Their wider use in computer science began only in
the 1990s (Luck, McBurney, and Preist 2003; Wooldridge 2002; Weiss 1999). Definitions of the
term MAS and what an agent is, can be found for example in Wooldridge (2002) and Jennings
(2000). Examples for the use of MASs with intelligent agents in the field of computer science
include computer games, computer networks, robotics for manufacturing, and traffic-control
systems (for examples, see Oliveira 1999; Luck et al. 2003; Shen, Hao, Yoon, and Norrie 2006;
Moonen 2009).
With increasing importance of questions about coordination and cooperation within MASs
the connections to social sciences arose (Conte, Gilbert, and Sichman 1998) and the field
of agent-based social simulation (ABSS), that is, an agent-based modeling approach as part
of computational sociology became a ’counter-concept’ to the classical top-down system dynamics and microsimulation approaches (Gilbert 1999; Squazzoni 2010). ABSS is mainly
used for theory testing and development (Macy and Willer 2002; Conte 2006) and applied to
simulations of differentiation, diffusion, and emergence of social order in social systems (for
examples, see listings in Macy and Willer 2002; Squazzoni 2010) as well as to questions about
demographic behavior (Billari and Prskawetz 2003). The most famous models in social sciences are Schelling’s segregation model (Schelling 1969) and the Sugarscape model of Epstein
and Axtell (1996).
Strongly related to the development of ABMs in social sciences is the establishment of the
ABM approach in economics, which is called agent-based computational economics (ACE) and
related to the field of cognitive and evolutionary economics. The aims of ACE can be divided
into four categories: empirical understanding, normative understanding, qualitative insight as
well as theory generation and methodological advancement (for details, see Tesfatsion 2006).
It was applied, for example, to the reproduction of the classical cobweb theorem (e.g., Arifovic
1994), to model financial/stock markets (see LeBaron 2000, for a review) as well as to the
simulation of industry and labor dynamics (e.g., Leombruni and Richiardi 2004).
In contrast to ABSS and ACE, the agent-based modeling approach has a slightly longer
tradition in ecology (Grimm and Railsback 2005). The development of so-called individualbased models is less closely related to the developments of MASs, because ecologists early
became aware of the restrictions in classical population models (differential equation models)
and looked for alternatives. Over the last three to four decades hundreds of IBMs were
developed in ecology (DeAngelis and Mooij 2005). For reviews see, for example, Grimm
(1999) and DeAngelis and Mooij (2005).
Besides these four main research areas, there are many other disciplines in which ABMs are
increasingly used, often within an interdisciplinary context. Examples include ecological economics (e.g., Heckbert, Baynes, and Reeson 2010), marketing/socio-psychology (e.g., North
et al. 2010), archaeology/anthropology (e.g., Griffin and Stanish 2007), microbiology (e.g.,
Ferrer, Prats, and López 2008), biomedicine/epidemiology (e.g., Carpenter and Sattenspiel
2009), criminology (strongly related to ABSS, e.g., Malleson, Heppenstall, and See 2010) and
land-use management (e.g., Matthews, Gilbert, Roach, Polhill, and Gotts 2007).
Journal of Statistical Software
3
1.2. Links to statistics
Links to statistics can be found in agent-based modeling along nearly all stages of the modeling
cycle. Often, models are developed on the basis of empirical/field data. This gives the first
link to statistics as data are analyzed with statistical methods to derive patterns, fit regression
models and so on to construct and parameterize the rules and to prepare input as well as
validation data.
Often, agent-based model rules depend on statistical methods applied during a simulation
run. In very easy cases, for example, animal reproduction could depend on the sum of the
food intake in a certain period but it is also possible for agent behaviors to be based on
correlation, regression, network, point pattern analysis etc.
The third link comes into play when the model is formulated and implemented and some
parameters of the model are unknown. Then, methods of inverse modeling with different
sampling schemes, Bayesian calibration, genetic algorithms and so on can be used to obtain
feasible parameter values.
In the next stage, the model application, methods like uncertainty and sensitivity analysis
provide important tools to gain an understanding of the systems’ behavior and functioning,
i.e., to open the black box of complexity.
The last link to statistics is the further analysis of the model output using descriptive as well
as inferential statistics. Depending on the type of model, this can include correlation analysis,
hypothesis testing, network analysis, spatial statistics, time series analysis, survival analysis
etc.
The focus in this article is on those parts where statistical methods are applied in combination
with the model runs.
1.3. NetLogo
Wilensky’s NetLogo (Wilensky 1999) is an agent-based modeling tool developed and maintained since 1999 by the Center for Connected Learning and Computer-Based Modeling at
Northwestern University, Illinois. It is an open-source software platform programmed in Java
and Scala and especially designed for the development of agent-based simulation models. It
comes with an integrated development and simulation environment. It provides many predefined methods (so-called primitives and reporters) for behavioral rules of the agents. Because
it has a Logo-like syntax and standard agent types (turtles, patches, links), in combination
with a built-in GUI, it is very easy to learn. Due to its simplicity and relatively large user
community, it is becoming the standard platform for communicating and implementing ABMs
that previously has been lacking.
For an introduction to NetLogo see its documentation (Wilensky 2013). An introduction into
agent-based modeling using NetLogo can be found, for example, in Railsback and Grimm
(2012) or Wilensky and Rand (2014).
1.4. R
R (R Core Team 2014a) is a well-known and established language and open source environment
for statistical computing and graphics with many user-contributed packages.
For NetLogo users not yet familiar with R: R is very well documented; see, for example, the R
4
RNetLogo: R Marries NetLogo
language definition (R Core Team 2014c). Furthermore, many tutorials can be found in the
web, for example, Maindonald (2008); Venables, Smith, and R Core Team (2014); Kabacoff
(2011); Owen (2010); and many books are available, for example, Zuur, Ieno, and Meesters
(2009); Crawley (2005); Kabacoff (2010); Venables and Ripley (2002).
1.5. Note on this article
This work is a mixture of scientific article and tutorial for a scientific tool; writing styles
differ between these two elements, but section headings indicate what element each section
contains.
2. Introducing RNetLogo
RNetLogo (Thiele 2014) is an R package that links R and NetLogo; i.e., any NetLogo model
can be run and controlled from R and simulation results can be transferred back to R for
statistical analyses. This is desirable as NetLogo’s support of systematic design, performance,
and analysis of simulation experiments is limited. In general, much more could be learned from
ABMs if they were embedded in a rigorous framework for designing simulation experiments
(Oh, Sanchez, Lucas, Wan, and Nissen 2009), storing simulation results in a systematic way,
and using statistical toolboxes for analyzing these results. RNetLogo can be used to bridge
this gap since R (together with the enormous number of packages) delivers such tools. Such
a seamless integration was already the scope of the NetLogo-Mathematica Link (Bakshy and
Wilensky 2007a), which was designed to make use of Mathematica’s functionality for“advanced
import capabilities, statistical functions, data visualization, and document creation. With
NetLogo-Mathematica Link, you can run all of these tools side-by-side with NetLogo” (Bakshy
and Wilensky 2007b). RNetLogo offers such a framework for two freely available open source
programs with fast-growing communities. RNetLogo itself is open-source software published
under the GNU GPL license.
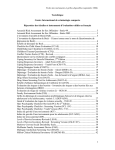
RNetLogo consists of two parts: R code and Java code (Figure 1). The R code is responsible
for offering the R functions, for connecting to Java, and for doing data transformations, while
the Java code communicates with NetLogo.
To connect the R part of RNetLogo to the Java part the rJava package for R (Urbanek 2010)
is used. The rJava package offers the ability to create objects, call methods and access class
members of Java objects through the Java Native Interface (JNI, Oracle 2013) from C. The
Java part of the RNetLogo package connects to the Java Controlling API of NetLogo. This
API allows controlling NetLogo from Java (and Scala) code (for details, see Tisue 2012).
When NetLogo code is given to an RNetLogo function, i.e., to the R part of RNetLogo,
it is submitted through rJava to the Java part of RNetLogo, and from there to NetLogo’s
Controlling API and thence to NetLogo. In case of reporters, i.e., primitives with return
values, the return value is collected by the Java part of RNetLogo, transformed from Java to
R by rJava and sent through the R part of RNetLogo to R.
Currently RNetLogo provides 17 functions (Table 1).
The functions that handle NetLogo code, like NLCommand or NLReport, expect it as a string.
Some other functions, e.g., NLGetAgentSet, construct such strings internally from the different
function arguments in the R part of RNetLogo. This string is then sent to the Java part of
Journal of Statistical Software
5
Figure 1: RNetLogo consists of two parts: an R and a Java part. The R part adds the
RNetLogo functions to R and uses rJava to connect the Java part. The Java part connects to
NetLogo via the Controlling API of NetLogo.
RNetLogo and from there it is evaluated through NetLogo’s Controlling API.
When the submitted NetLogo code is not valid NetLogo throws an exception of type ‘LogoException’ or ‘CompilerException’ containing the corresponding error message. This exception is further thrown by the Java part of RNetLogo, handled by rJava, and requested
finally by the R part of RNetLogo and printed to R’s command line. Runtime errors in NetLogo, like ‘java.lang.OutOfMemoryError’, are reported in the same manner. A message in
R’s command line is printed. But errors where the JVM crashes can cause crashes in rJava,
which can affect the R session as well.
Some functions of RNetLogo, like NLDoCommand or NLDoReportWhile, require further control
flow handling, i.e., loops and condition checkings, which are done by the Java part of RNetLogo. The methods command and report of class org.nlogo.workspace.Controllable of
NetLogo’s Controlling API are used as interfaces to NetLogo. All other things are done by
the R and the Java part of RNetLogo.
2.1. What else?
If only the integration of R calculations into NetLogo (i.e., the other way around) is of interest,
a look at the R-Extension to NetLogo at http://r-ext.sourceforge.net/ (see also Thiele
and Grimm 2010) can be useful.
If we want to use the R-Extension within a NetLogo model controlled by RNetLogo, we
should use the Rserve-Extension instead (available at http://rserve-ext.sourceforge.
net/), because loading the R-Extension will crash as it is not possible to load the JRI library
when rJava is active.
Loads a model into the NetLogo instance.
Quits a NetLogo instance.
Executes a command in the referenced NetLogo
instance.
Repeats execution of a command in the
referenced NetLogo instance a defined number
of times.
Repeats a command in the referenced NetLogo
instance while a NetLogo reporter returns TRUE.
NLLoadModel
NLQuit
NLCommand
Reports a value or list of values.
Repeats a command and a reporter in the
referenced NetLogo instance a defined number
of times.
Repeats execution of a command and a reporter
in the referenced NetLogo instance while a
conditional reporter returns TRUE.
NLReport
NLDoReport
NLDoReportWhile
NLDoCommandWhile
NLDoCommand
Scope
Creates an instance of NetLogo.
Function
NLStart
Arguments
nl.path
gui*
nl.version*
is3d*
model.path
all*
... [strings containing
NetLogo commands]
iterations
... [strings containing
NetLogo commands]
condition
... [strings containing
NetLogo commands]
max.minutes*
reporter
iterations
command
reporter
as.data.frame*
df.col.names*
condition
command
reporter
as.data.frame*
df.col.names*
max.minutes*
Concatenated result of
repeated reporter calls.
Result of the reporter.
Concatenated result of
repeated reporter calls.
–
–
–
–
–
Return value
–
6
RNetLogo: R Marries NetLogo
Reports the values of patch variables as a data
frame (optionally as a list, matrix or simple
vector).
Captures a network of links.
Sets a variable of one or more agents to values
in a data frame or vector.
Sets a variable of all patches in the NetLogo
World to the values in a matrix.
Sets the variable value of one or more patches
to values in a data frame.
Transforms a data frame into a NetLogo list or
multiple NetLogo lists (one for each column of
the data frame).
Appends a string to the NetLogo model’s code.
NLGetPatches
NLGetGraph
NLSetAgentSet
NLSetPatches
... [strings containing
model source code]
append.model*
agentset
input
var.name
patch.var
in.matrix
input
patch.var
in.data.frame
agent.var
agentset
as.data.frame*
agents.by.row*
as.vector*
patch.var
patchset
as.matrix*
as.data.frame*
patches.by.row*
as.vector*
link.agentset*
–
–
–
–
igraph graph object of
link agents.
–
Values of all requested
patch variables of all
requested patches.
Values of all requested
agent variables of all
requested agents.
Table 1: Functions provided by RNetLogo. All functions take an additional (optional) argument nl.obj which is not
listed in the table. It is a string identifying a NetLogo instance created with NLStart. Where functions take wildcard
arguments (...) a short description is given in squared brackets. Optional arguments are marked with an asterisk.
Details to the functions can be found in the manual pages of RNetLogo.
NLSourceFromString
NLDfToList
NLSetPatchSet
Reports variable values of one or more agents as
a data frame (optionally as a list or vector).
NLGetAgentSet
Journal of Statistical Software
8
RNetLogo: R Marries NetLogo
3. Using RNetLogo – Hands-on
3.1. Installation
To install and use RNetLogo we must have R (available from the Comprehensive R Archive
Network at http://CRAN.R-project.org/) and NetLogo (http://ccl.northwestern.edu/
netlogo/download.shtml) installed. The RNetLogo package is available from CRAN (http:
//CRAN.R-project.org/package=RNetLogo/) and is installed like any other R package; see
chapter 6 of R’s installation and administration manual (R Core Team 2014b) for information
on how to install a package. However, RNetLogo requires the rJava package (Urbanek 2010),
available from CRAN. It can happen that we have to reconfigure Java/R after installing rJava
on Unix machines. This topic has been discussed several times; see, for example, RWiki
(2006). The following sections provide an introduction to the usage of RNetLogo, however,
there are some pitfalls described in Section 5 one should be aware before starting own projects.
3.2. Loading NetLogo
To use the RNetLogo package the first time in an R session we have to load the package, like
any other packages, with
R> library("RNetLogo")
When loading RNetLogo it will automatically try to load rJava. If this runs without any
error we are ready to start NetLogo (if not, see Section 3.1). To do so, we have to know where
NetLogo is installed. What we need is the path to the folder that contains the NetLogo.jar
file. On Windows machines this could be C:/Program Files/NetLogo 5.0.5/. Here, we
assume that the R working directory (see, e.g., functions setwd()) is set to the path where
NetLogo is installed.
Now, we have to decide whether we want to run NetLogo in the background without seeing the
graphical user interface (GUI) and control NetLogo completely from R or if we want to see and
use the NetLogo GUI. In the latter case, we can use NetLogo as it was started independently,
i.e., can load models, change the source code, click on buttons, see the NetLogo View, inspect
agents, and so on, but also have control over NetLogo from R. The disadvantage of starting
NetLogo with GUI is that we cannot run multiple instances of NetLogo in one R session.
This is only possible in the so called headless mode, i.e., running NetLogo without GUI (see
Section 3.6 for details). Linux and Mac users should read the details section of the NLStart
manual page (by typing help(NLStart)).
Due to NetLogo’s Controlling API changes with the NetLogo version, we have to use an
extra parameter nl.version to start RNetLogo for NetLogo version 4 (nl.version = 4 for
NetLogo 4.1.x, nl.version = 40 for NetLogo 4.0.x). The default value of nl.version is 5,
which means that we do not have to submit this parameter when using NetLogo 5.0.x. Since
NetLogo 5.0.x operates much faster on lists than older versions it is highly recommended to
use it here (see also the RNetLogo package vignette “Performance Notes and Tests”).
To keep it simple and comprehensible we start NetLogo with GUI by typing:
R> nl.path <- getwd()
R> NLStart(nl.path)
Journal of Statistical Software
9
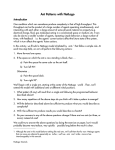
Figure 2: NetLogo (on the right) started and controlled from R (on the left).
If everything goes right, a NetLogo Window will be opened. We can use the NetLogo window
as if it had been started independently, with the exception that we cannot close the window
through clicking. On Windows, NetLogo appears in the same program group at the taskbar
as R. If possible, arrange the R and NetLogo windows so that we have them side by side
(Figure 2), and can see what is happening in NetLogo when we submit the following code.
3.3. Loading a model
We can now open a NetLogo model by just clicking on ”File -> Open...” or choosing one of
the sample models by clicking on ”File -> Models Library”. But to learn to control NetLogo
from R as when starting NetLogo in headless mode, we type in R:
R> model.path <- file.path("models", "Sample Models", "Earth Science",
+
"Fire.nlogo")
R> NLLoadModel(file.path(nl.path, model.path))
The Forest Fire model (Wilensky 1997a) should be loaded. This model simulates a fire
spreading through a forest. The expansion of the fire depends on the density of the forest.
The forest is defined as a tree density value of the patches, while the fire is represented by
turtles. If we want, we can now change the initial tree density by using the slider on the
interface tab and run the simulation by clicking on the setup button first and then on the go
button. In the next section, we will do the same by controlling NetLogo from R.
3.4. Principles of controlling a model
In a first step, we will change the density value, i.e., the position of the density slider, by
submitting the following statement in R:
R> NLCommand("set density 77")
10
RNetLogo: R Marries NetLogo
The slider goes immediately to the position of 77 percent. We can now execute the setup
procedure to initialize the simulation. We just submit in R:
R> NLCommand("setup")
And again, the command is executed immediately. The tick counter is reset to 0, the View
is green and first fire turtles are found on the left side of the View. Please notice that the
NLCommand function does not press the setup button, but calls the setup procedure. In the
Forest Fire example it makes no difference as the setup button also just calls the setup
procedure, but it is possible to add more code to a button than just calling a procedure. But
we can copy and paste such code into the NLCommand function as well.
We now want to run one tick by executing the go procedure. This is nothing new; we just
submit in R:
R> NLCommand("go")
We see that the tick counter was incremented by one and the red line of the fire turtles on
the left of the View extended to the next patch.
As we have seen, the NLCommand function can be used to execute any command which could be
typed into NetLogo’s command center. We can, for example, print a message into NetLogo’s
command center with the following statement:
R> NLCommand("print \"Hello NetLogo, I called you from R.\"")
The backslashes in front of the quotation marks are used to “mask” the quotation marks;
otherwise R would think that the command string ends after the print and would be confused.
Furthermore, it is possible to submit more than one command at once and in combination
with R variables. We can change the density slider and execute setup and go with one
NLCommand call like this:
R> density.in.r <- 88
R> NLCommand("set density ", density.in.r, "setup", "go")
In most cases, we do not want to execute a go procedure only a single time but for, say, ten
times (ticks). With the RNetLogo package we can do this with:
R> NLDoCommand(10, "go")
Now we have run the simulation for eleven ticks and maybe want to have this information in
R. Therefore, we execute:
R> NLReport("ticks")
[1] 11
As you might expect, we can save this value in an R variable by typing:
R> ticks <- NLReport("ticks")
R> print(ticks)
Journal of Statistical Software
11
[1] 11
This was already the basic functionality of the RNetLogo package. In the following section
we mostly modify and/or extend this basic functionality.
NetLogo users should note that there is no ”forever button”. To run a simulation for several
ticks we can use one of the loop functions (NLDoCommand, NLDoCommandWhile, NLDoReport,
NLDoReportWhile) or write a custom procedure in NetLogo that runs the go procedure the
desired number of times when called once by R.
To quit a NetLogo session, i.e., to close a NetLogo instance, we have to use the NLQuit function.
If we used the standard GUI mode without assigning the NetLogo instance to an R variable,
we can write:
R> NLQuit()
Otherwise, we have to specify which NetLogo instance we want to close by specifying the
R variable storing it. Please note that there is currently no way to close the GUI mode
completely. That is why we cannot run NLStart again in the same R session when NetLogo
was started with its GUI.
3.5. Advanced controlling functions
In Section 3.4, we used the NLDoCommand function to run the simulation for ten ticks. Here,
we will run the model for ten ticks as well, but we will collect the percentage of burned trees
after every tick automatically:
R> NLCommand("setup")
R> burned <- NLDoReport(10, "go", "(burned-trees / initial-trees) * 100")
R> print(unlist(burned))
[1] 0.4192073 0.7821574 1.1287747 1.4790215 1.8238240 2.1649971
[7] 2.5116144 2.8836382 3.2629210 3.6349448
This code ran the simulation for ten ticks and wrote the result of the given reporter (the result
of the calculation of the percentage of burned trees) after every tick into the R list burned.
If we want to run the simulation until no trees are left and know the percentage of burned
trees in every tick, we can execute:
R> NLCommand("setup")
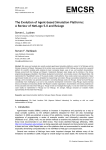
R> burned <- NLDoReportWhile("any? turtles", "go",
+
c("ticks", "(burned-trees / initial-trees) * 100"),
+
as.data.frame = TRUE, df.col.names = c("tick", "percent burned"))
R> plot(burned, type = "s")
The first argument of the function takes a NetLogo reporter. Here, the go procedure will be
executed while there are turtles in the simulation, i.e., any? turtles reports true. Moreover,
we have used not just one reporter (third argument) but a vector of two reporters; one
returning the current simulation time (tick) and a second with the percentage of burned
RNetLogo: R Marries NetLogo
0
20
percent burned
40
60
80
100
12
0
50
100
150
tick
200
250
300
Figure 3: The percentage of burned trees over time as the result of NLDoReportWhile, which
runs as long as there are turtles (any? turtles).
trees. Furthermore, we have defined that our output should be saved as a data frame instead
of a list and we have given the names of the columns of the data frame by using a vector of
strings in correspondence with the reporters. At the end, the R variable burned is of type
data.frame and contains two columns; one with the tick number and a second with the
corresponding percentage of burned trees. By using the standard plot function, we graph the
percentage of burned trees over time (Figure 3).
To demonstrate the NLGetAgentSet function, we use a different model. Therefore, we load
the Tumor model from NetLogo’s Models Library, set it up and run it for 20 ticks, as follows:
R>
+
R>
R>
R>
model.path <- file.path("models", "Sample Models", "Biology",
"Tumor.nlogo")
NLLoadModel(file.path(nl.path, model.path))
NLCommand("setup")
NLDoCommand(20, "go")
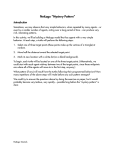
After we have run 20 ticks, we load the x and y positions of all tumor cells (which are turtles)
into a data frame and show them in a plot. But before we call the plot function, we will get
the spatial extent of the NetLogo World to use in the plot window (Figure 4):
R>
R>
R>
R>
cells <- NLGetAgentSet(c("xcor", "ycor"), "turtles")
x.minmax <- NLReport("(list min-pxcor max-pxcor)")
y.minmax <- NLReport("(list min-pycor max-pycor)")
plot(cells, xlim = x.minmax, ylim = y.minmax, xlab = "x", ylab = "y")
In a second step, we get only the metastatic cells and plot them again (Figure 5):
R> cells.metastatic <- NLGetAgentSet(c("xcor", "ycor"),
+
"turtles with [metastatic? = True]")
Journal of Statistical Software
13
−40
−20
y
0
20
40
Figure 4: A visualization of turtle locations obtained via NLGetAgentSet. Turtle locations
are displayed in the original NetLogo simulation (right) and in the R GUI of Windows (left).
−40
−20
0
x
20
40
Figure 5: Same as in Figure 4 but only with a subset of turtles that fulfill a condition (are
metastatic cells).
R> plot(cells.metastatic, xlim = x.minmax, ylim = y.minmax, xlab = "x",
+
ylab = "y")
We can use the NLGetAgentSet function to get patches and links as well. But there is a
special function for patches, called NLGetPatches, which makes life easier by returning the
RNetLogo: R Marries NetLogo
−30
−20
−10
y
0
10
20
30
14
−30
−20
−10
0
x
10
20
30
Figure 6: A simple visualization of the result of NLGetPatches as an image.
patch values as a matrix. We test this function by using the Fur model about patterns on
animals’ skin self-organization and plot the result in a simple raster image (Figure 6). We
load the model, set it up and get the patches as a matrix
R>
+
R>
R>
R>
R>
model.path <- file.path("models", "Sample Models", "Biology",
"Fur.nlogo")
NLLoadModel(file.path(nl.path, model.path))
NLCommand("setup")
NLDoCommand(5, "go")
patches.matrix <- NLGetPatches("pcolor", "patches", as.matrix = TRUE)
Now, we reorganize the matrix to make it fit for the image function and define the image
colors:
R>
R>
R>
R>
R>
patches.matrix.rot <- t(patches.matrix)
patches.matrix.rot <- as.data.frame(patches.matrix.rot)
patches.matrix.rot <- rev(patches.matrix.rot)
patches.matrix.rot <- as.matrix(patches.matrix.rot)
col <- c("black", "white")
Afterwards, we get the x and y limits (of the World) to use them for the image and draw the
matrix as an image:
R> x.minmax <- NLReport("(list min-pxcor max-pxcor)")
R> y.minmax <- NLReport("(list min-pycor max-pycor)")
R> image(x.minmax[1]:x.minmax[2], y.minmax[1]:y.minmax[2],
+
patches.matrix.rot, col = col, xlab = "x", ylab = "y")
Journal of Statistical Software
15
The code produced a simple raster image from the patches. It is also possible to create a
spatial object from the result of NLGetPatches as we see in the next example, where packages
gstat (Pebesma 2004) and sp (Pebesma and Bivand 2005) are used.
We start by loading the required packages and get the patches or, more precisely, the colors
and coordinates of the patches:
R> library("sp", "gstat")
R> patches <- NLGetPatches(c("pxcor", "pycor", "pcolor"), "patches")
Next, we convert the patches data.frame to a ‘SpatialPointsDataFrame’ and then use this
‘SpatialPointsDataFrame’ to create a ‘SpatialPixelsDataFrame’:
R> coordinates(patches) <- ~ pxcor + pycor
R> gridded(patches) <- TRUE
Now, we convert pcolor to a factor, define the colors for the plot and create it (not shown
here, similar to Figure 6):
R> patches$pcolor <- factor(patches$pcolor)
R> col <- c("black", "white")
R> spplot(patches, "pcolor", col.regions = col, xlab = "x", ylab = "y")
We see that it is possible to get the whole NetLogo View. As we can see in its manual page,
we can save the result of NLGetPatches into a list, matrix or, like here, into a data frame.
Furthermore, we can reduce the patches to a subset, e.g., all patches that fulfill a condition,
as we have done in the NLGetAgentSet example.
There are two other functions that operate the other way around. With NLSetPatches and
NLSetPatchSet we can push an R matrix/data frame into the NetLogo patches. NLSetPatches
function works only if we fill all patches, i.e., if we use a matrix which has the dimension of the
NetLogo World. For filling just a subset of patches we can use the NLSetPatchSet function.
The following example shows the usage of the NLSetPatches function. We reuse the
patches.matrix variable from NLGetPatches, change the values from 0 (black) to 15 (red)
and use this new matrix as input for the NetLogo patch variable pcolor (Figure 7):
R> my.matrix <- replace(patches.matrix, patches.matrix == 0, 15)
R> NLSetPatches("pcolor", my.matrix)
Another function, NLGetGraph, makes it possible to get a NetLogo network built by NetLogo
links into an igraph network. This function requires the R package igraph (Csárdi and Nepusz
2006). As an example, we can use the Small World model from NetLogo’s Models Library.
We build the NetLogo link network and transform it into an igraph network and finally plot
it.
We start by loading as well as setting up the model and get the graph from NetLogo:
R>
+
R>
R>
R>
model.path <- file.path("models", "Sample Models", "Networks",
"Small Worlds.nlogo")
NLLoadModel(file.path(nl.path, model.path))
NLCommand("setup", "rewire-all")
my.network <- NLGetGraph()
16
RNetLogo: R Marries NetLogo
Figure 7: A screenshot while NLSetPatches is executing. The color of the NetLogo patches
on the right hand side is changed gradually from black to red.
13
12
11
10
9
8
7
6
14
15
5
16
4
3
17
18
2
19
1
20
0
21
39
38
22
23
37
36
24
25
35
34
26
27
28
29
30
31
32
33
Figure 8: A graph generated by NetLogo links, sent to R via NLGetGraph, and plotted using
the igraph package (Csárdi and Nepusz 2006).
Now, the directed network graph plot (Figure 8) can be obtained with:
R> plot(my.network, layout = layout.circle,
+
vertex.label = V(my.network)$name, vertex.label.cex = 0.7, asp = FALSE)
Journal of Statistical Software
17
There are two further functions, which are not presented here in detail. The first one is the
NLSourceFromString function, which enables us to create or append model source code from
strings in R. A usage example is given in the code sample folder (No. 16) of the RNetLogo
package. Another helper function to send a data frame into NetLogo lists is NLDfToList. The
column names of the data frame have to be equivalent to the names of the lists in the NetLogo
model. The code sample folder (No. 9) includes a usage example.
3.6. Headless mode/Multiple NetLogo instances
As mentioned above, it is possible to start NetLogo in background (headless mode) without
a GUI. For this, we have to execute the NLStart function with a second argument. This
will fail if we do not open a new R session (after using RNetLogo in GUI mode) because, as
mentioned above, we cannot start several NetLogo sessions if we have already started one in
GUI mode.
The NLStart function will save the NetLogo object reference in an internal variable in the local
environment .rnetlogo. If we want to work with more than one NetLogo model/instance at
once, we can specify an identifier (as a string) for the NetLogo instance in the third argument
of NLStart.
We start with the creation of three NetLogo instances (maybe beside the one with the default
identifier which is _nl.intern_):
R>
R>
R>
R>
R>
R>
my.netlogo1 <- "my.netlogo1"
NLStart(nl.path, gui = FALSE, nl.obj = my.netlogo1)
my.netlogo2 <- "my.netlogo2"
NLStart(nl.path, gui = FALSE, nl.obj = my.netlogo2)
my.netlogo3 <- "my.netlogo3"
NLStart(nl.path, gui = FALSE, nl.obj = my.netlogo3)
All functions presented until now take as last (optional) argument (nl.obj) a string which
identifies a specific NetLogo instance created with NLStart. Therefore, we can specify which
instance we want to use. When working in headless mode, the first thing to do is always to
load a model. Executing a command or reporter without loading a model in headless mode
will result in an error. Therefore, we load a model into all instances:
R>
+
R>
R>
R>
model.path <- file.path("models", "Sample Models",
"Fire.nlogo")
NLLoadModel(file.path(nl.path, model.path), nl.obj
NLLoadModel(file.path(nl.path, model.path), nl.obj
NLLoadModel(file.path(nl.path, model.path), nl.obj
"Earth Science",
= my.netlogo1)
= my.netlogo2)
= my.netlogo3)
Now, we will set up and run the models over different simulation times. We run the first
instance (my.netlogo1) for 25 ticks:
R> NLCommand("setup", nl.obj = my.netlogo1)
R> NLDoCommand(25, "go", nl.obj = my.netlogo1)
Then, we run the second instance (my.netlogo2) for 15 ticks:
18
RNetLogo: R Marries NetLogo
R> NLCommand("setup", nl.obj = my.netlogo2)
R> NLDoCommand(15, "go", nl.obj = my.netlogo2)
and we simulate 5 ticks with the third instance:
R> NLCommand("setup", nl.obj = my.netlogo3)
R> NLDoCommand(5, "go", nl.obj = my.netlogo3)
To check if the above worked well, we compare the number of burned trees in the different
instances, which should be different:
R> NLReport("burned-trees", nl.obj = my.netlogo1)
[1] 1560
R> NLReport("burned-trees", nl.obj = my.netlogo2)
[1] 929
R> NLReport("burned-trees", nl.obj = my.netlogo3)
[1] 423
At the end, we quit the NetLogo sessions (the standard session with internal identifier _nl.
intern_ as well, if open):
R>
R>
R>
R>
NLQuit(nl.obj = my.netlogo3)
NLQuit(nl.obj = my.netlogo2)
NLQuit(nl.obj = my.netlogo1)
NLQuit()
4. Application examples
The following examples are (partly) inspired by the examples presented for the NetLogoMathematica Link (see Bakshy and Wilensky 2007b). These are all one-directional examples
(from NetLogo to R), but the package opens up the possibility of letting NetLogo and R interact
and send back results from R (e.g., statistical analysis) to NetLogo and let the model react to
them. Even manipulation of the model source by using the NLSourceFromString function is
possible. This opens up the possibility to generate NetLogo code from R dynamically.
4.1. Exploratory analysis
A simple parameter sensitivity experiment illustrates exploratory analysis with RNetLogo,
even though NetLogo has a very powerful built-in tool, BehaviorSpace (Wilensky 2012), for
this simple kind of experiment. Here, we will use the Forest Fire model (Wilensky 1997a)
from NetLogo’s Models Library and explore the effect of the density of trees in the forest on
the percentage of burned trees as described in Bakshy and Wilensky (2007b).
We start, as always, by loading and initializing the package (if not already done) and model:
19
0
20
percent burned
40
60
80
100
Journal of Statistical Software
0
20
40
60
density
80
100
Figure 9: Results of the Forest Fire model varying the density of trees. The y-axis is the
percentage of burned trees after no burning patches (i.e., no turtles) were left in the simulation.
R>
R>
R>
R>
+
R>
library("RNetLogo")
nl.path <- file.path(getwd(), "NetLogo 5.0.5")
NLStart(nl.path, gui = FALSE)
model.path <- file.path("models", "Sample Models", "Earth Science",
"Fire.nlogo")
NLLoadModel(file.path(nl.path, model.path))
Next, we define a function which sets the density of trees, executes the simulation until no
turtles are left, and reports back the percentage of burned trees:
R> sim <- function(density) {
+
NLCommand("set density ", density, "setup")
+
NLDoCommandWhile("any? turtles", "go");
+
ret <- NLReport("(burned-trees / initial-trees) * 100")
+
return(ret)
+ }
We run the simulation for density values between 1 and 100 with a step size of 1, to identify
the phase transition (Figure 9):
R> d <- seq(1, 100, 1)
R> pb <- sapply(d, function(dens) sim(dens))
R> plot(d, pb, xlab = "density", ylab = "percent burned")
As we know the region of phase transition (between a density of 45 and 70 percent), we
can explore this region more precisely. As the Forest Fire model uses random numbers, it
is interesting to find out how much stochastic variation occurs in this region. Therefore, we
define a function to repeat the simulations with one density several times:
RNetLogo: R Marries NetLogo
0
20
percent burned
40
60
80
100
20
45
50
55
60
density
65
70
Figure 10: Boxplots of repeated simulations (10 replications) with the Forest Fire model with
varying density (45–70 percent) of trees and the percentage of burned trees after no turtles
were left in the simulation.
R> rep.sim <- function(density, rep)
+
lapply(density, function(dens) replicate(rep, sim(dens)))
To get a rough overview we use this new function for densities between 45 and 70 percent
with a step size of 5, and 10 replications each (Figure 10):
R> d <- seq(45, 70, 5); res <- rep.sim(d, 10)
R> boxplot(res, names = d, xlab = "density", ylab = "percent burned")
Now, we have seen that the variation of burned trees at densities below 55 and higher than
65 is low. As a result, we can skip these values and have a deeper look into the region of
density values between 55 and 65. Therefore, we perform a simulation experiment for this
value range with a smaller step size of 1 percent and a higher amount of replication of 20 per
density value (Figure 11):
R> d <- seq(55, 65, 1); res <- rep.sim(d, 20)
R> boxplot(res,names = d, xlab = "density", ylab = "percent burned")
4.2. Database connection
There are R packages available to connect R to all common database management systems,
e.g., RMySQL (James and DebRoy 2012), RPostgreSQL (Conway, Eddelbuettel, Nishiyama,
Sameer, and Tiffin 2012), ROracle (Mukhin, James, and Luciani 2012), RJDBC (Urbanek
2011), RSQLite (James 2011) or RODBC (Ripley 2012). Thus the RNetLogo package opens
up the possibility to store the simulation results into a database.
21
0
20
percent burned
40
60
80
100
Journal of Statistical Software
55
57
59
61
density
63
65
Figure 11: Boxplots of repeated simulations (20 replications) with the Forest Fire model with
varying density (55–65 percent) of trees and the percentage of burned trees after no turtles
were left in the simulation.
In the following example we use the RSQLite package (James 2011), which provides a connection to SQLite databases (Hipp 2012), because this is a very easy-to-use database in a
single file. It does not need a separate database server and is, therefore, ideal for agent-based
modeling studies, where no large database management systems (DBMS) are used. The
database can store the results of different simulation experiments in different tables together
with metadata in one file. This makes it very easy to share simulation results. There are
small and easy-to-use GUI programs available to browse and edit SQLite databases; see, for
example, the SQLite Database Browser (Piacentini 2012).
In a first step we have to set up the connections to NetLogo (if not already done) and load as
well as initialize the example model:
R>
R>
R>
R>
+
R>
R>
library("RNetLogo")
nl.path <- file.path(getwd(), "NetLogo 5.0.5")
NLStart(nl.path, gui = FALSE)
model.path <- file.path("models", "Sample Models", "Earth Science",
"Fire.nlogo")
NLLoadModel(file.path(nl.path, model.path))
NLCommand("setup")
Then, we load the required RSQLite package and database driver as well as create a connection
to the database. If the database does not exist, this creates a file test_netlogo.db:
R>
R>
R>
R>
library("RSQLite")
m <- dbDriver("SQLite")
database.path = "test_netlogo.db"
con <- dbConnect(m, dbname = database.path)
22
RNetLogo: R Marries NetLogo
Next, we run the model for ten ticks and save the results (ticks and burned-trees) in the table
Burned1 of the database:
R> dbWriteTable(con, "Burned1",
+
NLDoReport(10, "go", c("ticks", "burned-trees"),
+
as.data.frame = TRUE, df.col.names = c("tick", "burned")),
+
row.names = FALSE, append = FALSE)
Afterwards, we can send a first query: how many lines has the new table?
R> dbGetQuery(con, "select count(*) from Burned1")[[1]]
[1] 10
In the second query, we select all rows from table Burned10 where tick is greater than 5:
R> rs <- dbSendQuery(con, "select * from Burned1 where tick > 5")
Then, we ask for the result of the query and print it:
R> data <- fetch(rs, n = -1)
R> str(data)
'data.frame':
$ tick : num
$ burned: num
5 obs. of 2 variables:
6 7 8 9 10
458 513 564 627 682
Next, we delete/clear the query:
R> dbClearResult(rs)
Afterwards, we append further results to the existing table:
R> dbWriteTable(con, "Burned1",
+
NLDoReport(10, "go", c("ticks", "burned-trees"),
+
as.data.frame = TRUE, df.col.names = c("tick", "burned")),
+
row.names = FALSE, append = TRUE)
and take a look at the table:
R> select.all <- dbGetQuery(con, "select * from Burned1")
R> str(select.all)
'data.frame':
$ tick : num
$ burned: num
20 obs. of 2 variables:
1 2 3 4 5 6 7 8 9 10 ...
134 205 273 343 404 458 513 564 627 682 ...
Now, we create a second table and save the results of ten repeated simulations of 20 ticks
each:
Journal of Statistical Software
23
R> for (x in 1:10) {
+
NLCommand("setup")
+
dbWriteTable(con, "Burned2",
+
NLDoReport(20, "go", c("ticks", "burned-trees"),
+
as.data.frame = TRUE, df.col.names = c("tick", "burned")),
+
row.names = FALSE, append = TRUE)
+ }
and calculate the mean number of burned trees (out of the 10 repetitions) for each tick, get
the result of the query and show it:
R> rs <- dbSendQuery(con,
+
"select avg(burned) as mean_burned from Burned2 group by tick")
R> data <- fetch(rs, n = -1)
R> str(data)
'data.frame':
20 obs. of 1 variable:
$ mean_burned: num 146 228 310 385 452 ...
Finally, we delete/clear the query and close the connection to the database:
R> dbClearResult(rs); dbDisconnect(con)
Note that there is also an extension to connect databases directly to NetLogo (see http:
//code.google.com/p/netlogo-sql/).
4.3. Analytical comparison
The example application of Bakshy and Wilensky (2007b) compares results of an agent-based
model of gas particles to velocity distributions found by analytical treatments of ideal gases.
To reproduce this, we use the Free Gas model (Wilensky 1997b) of the GasLab model family
from NetLogo’s Models Library. In this model, gas particles move and collide with each other
without external constraints. Bakshy and Wilensky (2007b) compared this model’s results to
the classical Maxwell-Boltzmann distribution. R itself is not a symbolic mathematical software
but there are packages available which let us integrate such software. Here, we use the Ryacas
package (Goedman, Grothendieck, Højsgaard, and Pinkus 2010) which is an interface to the
open-source Yacas Computer Algebra System (Pinkus, Winitzki, and Niesen 2007).
We start with the agent-based model simulation. Because this model is based on random
numbers we run repeated simulations.
We start with loading and initializing the RNetLogo package (if not already done) and the
model:
R>
R>
R>
R>
+
library("RNetLogo")
nl.path <- file.path(getwd(), "NetLogo 5.0.5")
NLStart(nl.path, gui = FALSE)
model.path1 <- file.path("models", "Sample Models", "Chemistry & Physics",
"GasLab")
24
RNetLogo: R Marries NetLogo
R> model.path2 <- "GasLab Free Gas.nlogo"
R> NLLoadModel(file.path(nl.path, model.path1, model.path2))
R> NLCommand("set number-of-particles 500", "no-display", "setup")
Next, we run the simulation for 40 times of 50 ticks (= 2000 ticks), save the speed of the
particles after every 50 ticks, and flatten the list of lists (one list for each of the 40 runs) to
one big vector:
R> particles.speed <- NLDoReport(40, "repeat 50 [go]",
+
"[speed] of particles")
R> particles.speed.vector <- unlist(particles.speed)
To calculate the analytical distribution, we have to solve the following equations:
2
−1
B(v) = v · e(−m·v) ·(2·k·T )
Z ∞
B(v) dv
normalizer =
(1)
(2)
0
B(v)normalized =
B(v)
for v = [0, max(speed )]
normalizer
(3)
Now, Yacas/Ryacas will be used. For this, we define Equation 1 with the mean energy derived
from the NetLogo simulation. We then define the normalizer integral and solve it numerically.
We start by loading the Ryacas package:
R> library("Ryacas")
We can install Yacas, if currently not installed (only for Windows – see Ryacas/Yacas documentation for other systems) with:
R> yacasInstall()
Next, we get the mean energy from the NetLogo simulation and define the function B and
register it in Yacas:
R> energy.mean <- NLReport("mean [energy] of particles")
R> B <- function(v, m = 1, k = 1)
+
v * exp((-m * v^2) / (2 * k * energy.mean))
R> yacas(B)
Then, we define the integral of function B from 0 to infinity and register the integral expression
in Yacas:
R> B.integr <- expression(integrate(B, 0, Infinity))
R> yacas(B.integr)
Now, we calculate a numerical approximation using Yacas’s function N() and get the result
from Yacas in R (the result is in the list element value):
25
0.00
0.02
density
0.04
0.06
0.08
0.10
Journal of Statistical Software
0
10
20
speed of particles
30
40
Figure 12: Empirical probability distribution of particle speeds generated by the agent-based
model (bars) with the theoretical Maxwell-Boltzmann distribution (blue line).
R> normalizer.yacas <- yacas(N(B.integr))
R> normalizer <- Eval(normalizer.yacas)
R> print(normalizer$value)
[1] 50
In a further step, we calculate the theoretical probability values of particle speeds using
Equation 1. We do this from 0 to the maximum speed observed in the NetLogo simulation.
First, we get the maximum speed from the NetLogo simulation:
R> maxspeed <- max(particles.speed.vector)
Next, we create a sequence vector from 0 to maxspeed, by stepsize, and calculate the
theoretical values at the points of the sequence vector:
R> stepsize <- 0.25
R> v.vec <- seq(0, maxspeed, stepsize)
R> theoretical <- B(v.vec) / normalizer$value
At the end, we plot the empirical/simulation distribution together with the theoretical distribution of particle speeds (Figure 12):
R> hist(particles.speed.vector, breaks = max(particles.speed.vector) * 5,
+
freq = FALSE, xlim = c(0, as.integer(maxspeed) + 5),
+
ylab = "density", xlab = "speed of particles", main = "")
R> lines(v.vec, theoretical, lwd = 2, col = "blue")
26
RNetLogo: R Marries NetLogo
4.4. Advanced plotting functionalities
R and its packages deliver a wide variety of plotting capabilities. As an example, we present
a three-dimensional plot in combination with a contour map. We use the “Urban Site –
Sprawl Effect” model (Felsen and Wilensky 2007) from NetLogo’s Models Library. This model
simulates the growth of cities and urban sprawl. Seekers (agents) look for patches with high
attractiveness and also increase the attractiveness of the patch they stay on. Therefore, the
attractiveness of the patches is a state variable of the model, which can be plotted in R.
First, we initialize the RNetLogo package (if not already done) and load the model:
R>
R>
R>
R>
R>
R>
library("RNetLogo")
nl.path <- file.path(getwd(), "NetLogo 5.0.5")
NLStart(nl.path, gui = FALSE)
model.path <- file.path("models", "Curricular Models", "Urban Suite")
model.name <- "Urban Suite - Sprawl Effect.nlogo"
NLLoadModel(file.path(nl.path, model.path, model.name))
We resize NetLogo’s World and set the parameter values:
R> NLCommand("resize-world -20 20 -20 20")
R> NLCommand("set smoothness 10", "set max-attraction 5",
+
"set population 500", "set seeker-search-angle 200",
+
"set seeker-patience 15", "set wait-between-seeking 5")
Then, we set up the simulation and run it for 150 ticks:
R> NLCommand("setup"); NLDoCommand(150, "go")
Next, we get the value of the variable attraction from all patches as a matrix as well as the
dimensions of NetLogo’s World:
R> attraction <- NLGetPatches("attraction", as.matrix = TRUE)
R> pxcor <- NLReport(c("min-pxcor", "max-pxcor"))
R> pycor <- NLReport(c("min-pycor", "max-pycor"))
Now, we define the advanced plotting function with a three-dimensional plot and a contour
map (adapted from Francois 2011):
R> kde2dplot <- function(d, ncol = 50, zlim = c(0, max(z)),
+
nlevels = 20, theta = 30, phi = 30) {
+
z
<- d$z
+
nrz <- nrow(z)
+
ncz <- ncol(z)
+
colors <- tail(topo.colors(trunc(1.4 * ncol)), ncol)
+
fcol <- colors[trunc(z / zlim[2] * (ncol - 1)) + 1]
+
dim(fcol) <- c(nrz, ncz)
+
fcol <- fcol[-nrz, -ncz]
+
par.default <- par(no.readonly = TRUE)
27
2
20
Journal of Statistical Software
2
3.5
10
2
2
3
3
3
1
1.5
2.5
3
4
3.5
4
32
2
32
3
tion
1
2
5.5
1.5
2.5
2.5
1.5
1.5
0
2
attrac
3.5
−10
2
y
2
2
2
2
x
2
2
−20
1.5
−20
−10
0
10
20
Figure 13: Spatial distribution of attractiveness of patches after 150 simulation steps. 3D
plot (left) and contour plot (right).
+
+
+
+
+
+
+
+
+
par(mfrow = c(1, 2), mar = c(0, 0, 0, 0), cex = 1.5)
persp(d, col = fcol, zlim = zlim, theta = theta, phi = phi,
zlab = "attraction", xlab = "x", ylab = "y")
par(mar = c(2, 2, 0.5, 0.5))
image(d, col = colors)
contour(d, add = TRUE, nlevels = nlevels)
box()
par(par.default)
}
We merge the data and execute the plot function (Figure 13):
R> d <- list(x = seq(pxcor[[1]], pxcor[[2]]),
+
y = seq(pycor[[1]], pycor[[2]]), z = attraction)
R> kde2dplot(d)
4.5. Time sliding visualization
As agent-based models are often very complex, more than three dimensions could be relevant
for their analysis. With the RNetLogo package it is possible to save the output of a simulation
in R for every tick and then click through, or animate, the time series of these outputs,
for example a combination of the model’s View and distributions of state variables. As a
prototype, we write a function to implement a timeslider to plot turtles. This function can be
extended to visualize a panel of multiple plots by tick. With a slider we can browse through
the simulation steps. To give an example, we use the Virus model (Wilensky 1998) from
NetLogo’s Models Library to visualize the spatial distribution of infected and immune agents
as well as boxplots of the time period of infection and the age in one plot panel.
28
RNetLogo: R Marries NetLogo
Figure 14: Timeslider example using the Virus model.
We first load the required package rpanel (Bowman, Crawford, Alexander, and Bowman 2007)
and define a helper function to set the plot colors for the logical variables (sick, immune) of
the turtles:
R> library("rpanel")
R> color.func <- function(color.var, colors, timedata) {
+
color <- NULL
Journal of Statistical Software
+
+
+
+
+
+
+
+
29
if (!is.null(color.var)) {
index.color <- which(names(timedata) == color.var)
color <- timedata[[index.color]]
color[color == FALSE] <- colors[1]
color[color == TRUE] <- colors[2]
}
return(color)
}
Next, we define the main function containing the slider and what to do if we move the slider.
The input is a list containing data frames for every tick. When the slider is moved, we send
the current position of the slider (i.e., the requested tick) to the plotting function, extract the
corresponding data frame from the timedata list and draw a panel of four plots using this
data frame.
R> plottimedata <- function(timedata.list, x.var, y.var, boxplot.var1,
+
boxplot.var2, color.var1 = NULL, colors1 = "black",
+
color.var2 = NULL, colors2 = "black", mains = NULL, ...) {
+
timeslider.draw <- function(panel) {
+
index.x <- which(names(timedata.list[[panel$t]]) == x.var)
+
index.y <- which(names(timedata.list[[panel$t]]) == y.var)
+
index.b1 <- which(names(timedata.list[[panel$t]]) == boxplot.var1)
+
index.b2 <- which(names(timedata.list[[panel$t]]) == boxplot.var2)
+
+
color1 <- color.func(color.var1, colors1, timedata.list[[panel$t]])
+
color2 <- color.func(color.var2, colors2, timedata.list[[panel$t]])
+
+
par(mfrow = c(2, 2), oma = c(0, 0, 1, 0))
+
plot(timedata.list[[panel$t]][[index.x]],
+
timedata.list[[panel$t]][[index.y]], col = color1,
+
main = mains[1], ...)
+
plot(timedata.list[[panel$t]][[index.x]],
+
timedata.list[[panel$t]][[index.y]], col = color2,
+
main = mains[2], ...)
+
boxplot(timedata.list[[panel$t]][[index.b1]], main = mains[3])
+
boxplot(timedata.list[[panel$t]][[index.b2]], main = mains[4])
+
title(paste("at time ",panel$t), outer = TRUE)
+
panel
+
}
+
panel <- rp.control()
+
rp.slider(panel, resolution = 1, var = t, from = 1,
+
to = length(timedata.list), title = "Time", showvalue = TRUE,
+
action = timeslider.draw)
+ }
In the third step, we initialize and run the NetLogo simulation and collect the results into the
timedata list. As mentioned above, we push a data frame containing the results of one tick
30
RNetLogo: R Marries NetLogo
into the timedata list. Here, we run 100 ticks and use the NLGetAgentSet function to collect
data from the turtles.
R>
R>
R>
+
R>
R>
R>
R>
R>
R>
+
+
+
+
library("RNetLogo")
nl.path <- file.path(getwd(), "NetLogo 5.0.5")
model.path <- file.path("models", "Sample Models", "Biology",
"Virus.nlogo")
NLStart(nl.path)
NLLoadModel(file.path(nl.path, model.path))
NLCommand("setup")
nruns <- 100
timedata <- list()
for(i in 1:nruns) {
NLCommand("go")
timedata[[i]] <- NLGetAgentSet(c("who", "xcor", "ycor", "age",
"sick?", "immune?", "sick-count"), "turtles")
}
In the last step, we collect the dimension of the NetLogo World to use it for the axis extent
of the plot and define the colors used for the variables sick (green = FALSE, red = TRUE)
and immune (red = FALSE, green = TRUE). Finally, we call the above-defined plottimedata
function to create the timeslider.
R>
+
R>
R>
R>
+
+
+
+
world.dim <- NLReport(c("(list min-pxcor max-pxcor)",
"(list min-pycor max-pycor)"))
colors1 <- c("green", "red")
colors2 <- c("red", "green")
plottimedata(timedata.list = timedata, x.var = "xcor", y.var = "ycor",
xlab = "x", ylab = "y", color.var1 = "sick?", color.var2 = "immune?",
boxplot.var1 = "sick-count", boxplot.var2 = "age", colors1 = colors1,
colors2 = colors2, mains = c("Sick", "Immune", "Sick-count", "Age"),
xlim = world.dim[[1]], ylim = world.dim[[2]])
Then we can move the slider and the plot is updated immediately (Figure 14).
5. Pitfalls
5.1. Amount of data
Please note that we are not able to stop the execution of a NetLogo command without closing
our R session. Therefore, it is a good idea to think about the amount of data which should be
transformed. For example, if we use the NLGetPatches function with the standard settings of
the Forest Fire model from NetLogo’s Models Library, we are requesting 63001 patch values.
If we ask for the pxcor, pycor and pcolor values, we are requesting for 63001 · 3 = 189003
values. All these values have to be transformed from NetLogo data type to Java and from Java
to R. This may take a while. For technical reasons, we are not informed about the progress of
Journal of Statistical Software
NetLogo
Boolean
String
Number
List of strings
List of booleans
List of numbers
Nested list (one nesting)
Nested list (multi-level nesting)
31
R
Boolean
String
Double
Vector of strings
Vector of booleans
Vector of doubles
List of vectors
List of lists, lowest level: vectors
Table 2: Mapping from NetLogo data types to R data types.
data transformation. Therefore, it looks like the program crashed, but if we are patient, the
program will return with the result after some time. Thus it is always a good idea to test the
code with a very small example (i.e., small worlds, low number of agents etc.). As mentioned
in Section 3.2, NetLogo 5.0.x is much faster at transferring data than NetLogo 4.x.
5.2. Endless loops
If we use the functions NLDoCommandWhile and NLDoReportWhile, we should double check our
while-condition. Are we sure that the condition will be met some time? To prevent endless
loops, these functions take an argument max.minutes with a default value of 10. This means
that the execution of these functions will be interrupted if it takes longer than the submitted
number of minutes. If we are sure that we do not submit something that will trigger an
endless loop, we can switch off this functionality by using a value of 0 for the max.minutes
argument. This will speed up the operation because the time checking operation will not be
applied.
5.3. Data type
The general mapping of NetLogo data types to R data types in RNetLogo is given in Table 2.
We should think about the data types we are trying to combine. For example, an R vector
takes values of just one data type (e.g., string, numeric/double or logical/boolean) unlike a
NetLogo list, which can contain different data types. Here are some examples.
First, we get a NetLogo list of numbers:
R> NLReport("(list 24 23 22)")
Second, we get a NetLogo list of strings:
R> NLReport("(list \"foo1\" \"foo2\" \"foo3\")")
Third, we try to get a NetLogo list of combined numbers and a string:
R> NLReport("(list 24 \"foo\" 22)")
The first two calls of NLReport will run as expected but the last call will throw an error,
because NLReport tries to transform a NetLogo list into an R vector, which will fail due to
the mixed data types. This is also relevant in particular for the columns of data.frames.
32
RNetLogo: R Marries NetLogo
Call
NLDoReport(2, "go",
"(list count fires count embers)")
Output of str(<Call>)
List of 2
$ : num [1:2] 2 2
$ : num [1:2] 0 4
NLDoReport(2, "go",
c("count fires", "count embers"))
List of 2
$ :List of
..$ : num
..$ : num
$ :List of
..$ : num
..$ : num
2
2
2
2
0
4
Table 3: Examples of results of NLDoReport with different NetLogo data structures. The
Forest Fire model is used with a world of only 3 × 3 patches and a density of 99 percent. The
model is reset before each example.
5.4. Data structure
Since RNetLogo does not restrict how NetLogo reporters are combined, it is very flexible but
makes it necessary to think very carefully about the data structure that will be returned.
How a NetLogo value is transformed in general is already defined in Table 2.
But this becomes more complex for iteration functions like NLDoReport where the return
values of one iteration are combined with the results of another iteration, especially when
requesting the result as a data frame instead of a list.
For example, it makes a difference in the returned data structure when we request two values
as a NetLogo list or as two single reporters in a vector (Table 3). Requesting the values
as a NetLogo list returns a top-level list containing a vector of two values for all requested
iterations. Requesting two single reporters returns these in a list as an entry of a top-level list.
Therefore, this results in a nested list structure. There is not a wrong or preferred solution,
it just depends on what we want to do with the result.
Requesting the result of NLDoReport as a data frame converts the top-level list to a data
frame in a way that the top-level list entries become columns of the data frame and one
iteration is represented by a row. This becomes problematic when nested NetLogo lists are
requested (Table 4). In such a case, the nested NetLogo lists are transformed into R lists and
the resulting data frame contains lists in its columns. Such a data structure is a valid, but
uncommon, data frame and some functions, like write.table, can operate only with a data
frame that contains just simple objects in its columns. To make a data frame with nested lists
fit for functions like write.table we have to use the I(x) function for the affected columns
to treat them ’as is’ (see help(I) for details, e.g., my.df$col1 <- I(my.df$col1)).
Furthermore, using an agentset in an NLDoReport iteration with data frame return value can
become problematic. As long as the number of members of the agentset does not change, it can
be requested without problems in a data frame. The data frame contains one column for each
agent and one row for each iteration. If the number of agents changes during the iterations
the resulting data frame is not correct as it contains entries that do not exist. The number of
columns equals the maximum number of agents over all iterations. For those iterations that
Journal of Statistical Software
Call
NLDoReport(2, "go",
"(list count fires count embers)",
as.data.frame = TRUE)
Output of str(<Call>)
’data.frame’:
2 obs. of 2 variables:
$ X1: num 0 0
$ X2: num 4 4
NLDoReport(2, "go",
c("count fires", "count embers"),
as.data.frame = TRUE)
’data.frame’:
2 obs. of 2 variables:
$ X1: num 0 0
$ X2: num 4 4
NLDoReport(2, "go",
c("count turtles",
"(list count fires count embers)"),
as.data.frame = TRUE)
’data.frame’:
2 obs. of 2 variables:
$ X1: num 4 4
$ X2:List of 2
..$ : num 0 4
..$ : num 0 4
33
Table 4: Examples of results of NLDoReport with different NetLogo data structures. The
Forest Fire model is used with a world of only 3 × 3 patches and a density of 99 percent. The
model is reset before each example.
contain less agents the columns of the data frame are filled with copied information from a
former column. In short, the information is wrong. The following example illustrates this.
The Forest Fire model is used with a world of only 5 × 3 patches.
R> res <- NLDoReport(3, "go", "[who] of turtles", as.data.frame = TRUE)
R> str(res)
'data.frame':
$ X1: num 2
$ X2: num 0
$ X3: num 3
$ X4: num 1
$ X5: num 2
$ X6: num 0
$ X7: num 3
3 obs. of
4
2
0
3
1
4
2
7 variables:
0
6
4
1
5
3
2
The first iteration contains four turtles, the second five and the third seven turtles. The
returned data frame therefore contains seven columns. Entries in columns for the first and
the second row (i.e., iteration) are repeated from the first columns. But fortunately we are
warned by R that the length of the vectors differ. When we cannot be sure that the number
of return values is always the same over the iterations we should use the default list data
structure instead of the data frame return structure. Furthermore, if we want to request
an agentset, we should better use the NLGetAgentSet function in an R loop, as shown in
Section 4.5, because it returns the requested values in a sorted order; for agents by their who
number and in case of patches from upper left to lower right.
34
RNetLogo: R Marries NetLogo
These examples illustrate that it is necessary to think about the data structure that is required
for further analyses and which function can process such a data structure.
5.5. Working directory
We should avoid changing the working directory of R manually, because NetLogo needs to
have the working directory pointed to its installation path. As the R working directory and
the Java working directory depend on each other, changing the R working directory can
result in unexpected behavior of NetLogo. Therefore, we should use absolute paths for I/O
processes in R instead of submitting setwd(...). Note that the RNetLogo package changes
the working directory automatically when loading NetLogo and changes back to the former
working directory when the last active NetLogo instance is closed with NLQuit.
6. Discussion
This article gave a theoretical and practical introduction to the RNetLogo package. The reader
should be well-prepared to start his/her own projects based on RNetLogo after studying the
examples. Since there are so many interesting packages available in R with connections to
many other programs, it is really amazing what this connection offers to both, R users and
NetLogo users.
Note that there are code samples for all functions in the example folder (RNetLogo/examples/
code_samples) of the RNetLogo package. Furthermore, there are some example applications
in the example folder, similar to those presented here.
As presented the RNetLogo package successfully links the statistical computing environment
R with the agent-based modeling platform NetLogo. Thereby it brings together the world of
statistics and data analysis with the world of agent-based modeling. From the viewpoint of
an R user it opens up the possibility to access a rule-based modeling language and environment. Therefore, (nearly) all types of agent-based and system-dynamics models can be easily
embedded into R. NetLogo’s Models Library gives a nice impression of what kind of models
can be built, from deterministic to stochastic, from non-spatial to spatial models, from 2D to
3D, from cellular automata over network models and artificial neural networks to L-systems
and many others more.
Bringing simulation models to R is not entirely new. There are, on the one hand, other
modeling environments, like Repast (North, Collier, and Vos 2006), that open the possibility
to send data to R. But the ability to control simulation experiments from R is new for such
modeling tools. NetLogo was selected because it is very easy to learn, very well designed, and
much better documented than other ABM platforms. It has a very active user community
and seems to be the most appropriate basis for all kinds of modelers, from beginners to
professionals and from ecology over social sciences to informatics. On the other hand, there
are packages available to build simulation models directly in R, like simecol (Petzoldt and
Rinke 2007). Especially simecol is fast and very flexible and a good choice in comparison
to implementations in pure R but it does not provide specific support for making model
development and simulation efficient as agent-based model environments like NetLogo and
Repast do.
Some first use-cases of RNetLogo have been presented in this article. Beside the advanced
visualization possibilities and connections to other software an important application area is
Journal of Statistical Software
35
the design and analysis of simulation experiments in a systematic, less ad-hoc, way. R delivers
all necessary functions of the design of experiments (DoE) principles. With RNetLogo the
technical connection between all kinds of DoE and ABM is available.
There are already ready-to-use solutions for model analysis/DoE techniques available for
agent-based modeling, like BehaviorSearch (Stonedahl and Wilensky 2013), MEME (Iványi,
Gulyás, Bocsi, Szemes, and Mészáros 2007), and openMOLE (Reuillon, Chuffart, Leclaire,
Faure, Dumoulin, and Hill 2010), but they are less flexible and adaptable than R. Often, for
one task, several packages in R are available and if not, writing own functions is flexible and
fast, especially because many scientists know R already from its application for data analysis.
Since RNetLogo does not restrict the user to predefined analysis functions it opens up a large
flexibility. But RNetLogo can only check the submitted NetLogo code strings at runtime.
This is a disadvantage, although the NetLogo code strings are typically simple and lack of
automated checking encourages well-designed analysis. Nevertheless, RNetLogo requires the
user to understand data types and structures of both NetLogo and R.
RNetLogo pushes the documentation and therefore the reproducibility of agent-based modeling studies, a key feature of science, to a new level. Using RNetLogo in conjunction with
tools like Sweave (Leisch 2002), odfWeave (Kuhn, Weston, Coulter, Lenon, and Otles 2010)
or SWord (Baier 2009) will contribute to replicability and reproducibility of agent-based simulation studies by automatic and self-documented report generation. For example, Sweave
can embed R code in a LATEX text document. When compiling the Sweave document, the
R code is evaluated and the results (not only numeric but also images) can be embedded
automatically in the LATEX document. The RNetLogo package opens up the possibility to
embed not only results of R, but also the result of a NetLogo simulation. We can create a
self-documented report with NetLogo simulations and R analytics (with or without source
code). For an example see the Sweave code of this article.
Since models become more complex their computational requirements are increasing as well.
A lot of these requirements are compensated by increasing computational power, but the use
of modern model development and analysis techniques for stochastic models, like Bayesian
calibration methods, make a large number of repeated simulations necessary. Using RNetLogo
includes, of course, an overhead when converting model results from NetLogo to R and vice
versa, but there are already techniques available to spread such repetitions to multi-cores and
computer clusters (see the RNetLogo package vignette “Parallel Processing with RNetLogo”).
To sum up, I expect that this contribution will make agent-based modeling with NetLogo more
popular and easier in the R community and will support the methodological developments
towards rigorous model development, testing and analysis in the ABM community.
Acknowledgments
I would like to thank two anonymous reviewers as well as Volker Grimm and Winfried Kurth
for their very valuable comments on an earlier version of the manuscript.
References
Arifovic J (1994). “Genetic Algorithm Learning and the Cobweb Model.” Journal of Economic
36
RNetLogo: R Marries NetLogo
Dynamics and Control, 18(1), 3–28.
Baier T (2009). SWordInstaller: SWord: Use R in Microsoft Word (Installer). R package
version 1.0-2, URL http://CRAN.R-project.org/package=SWordInstaller.
Bakshy E, Wilensky U (2007a). NetLogo-Mathematica Link. Center for Connected
Learning and Computer-Based Modeling, Northwestern University, Evanston, IL. URL
http://ccl.northwestern.edu/netlogo/mathematica.html.
Bakshy E, Wilensky U (2007b). “Turtle Histories and Alternate Universes: Exploratory Modeling with NetLogo and Mathematica.” In M North, C Macal, D Sallach (eds.), Proceedings
of the Agent 2007 Conference on Complex Interaction and Social Emergence, pp. 147–158.
Argonne National Laboratory and Northwestern University.
Billari FC, Prskawetz A (2003). Agent-Based Computational Demography: Using Simulation
to Improve Our Understanding of Demographic Behaviour. Contributions to Economics.
Physica-Verlag.
Bowman A, Crawford E, Alexander G, Bowman RW (2007). “rpanel: Simple Interactive
Controls for R Functions Using the tcltk Package.” Journal of Statistical Software, 17(9),
1–23. URL http://jstatsoft.org/v17/i09/.
Carpenter C, Sattenspiel L (2009). “The Design and Use of an Agent-Based Model to Simulate
the 1918 Influenza Epidemic at Norway House, Manitoba.” American Journal of Human
Biology, 21(3), 290–300.
Conte R (2006). “From Simulation to Theory (and Backward).” In F Squazzoni (ed.), Epistemological Aspects of Computer Simulation in the Social Sciences, Second International
Workshop, EPOS 2006, Brescia, Italy, October 5–6, 2006, Revised Selected and Invited
Papers, volume 5466 of Lecture Notes in Computer Science, pp. 29–47. Springer-Verlag.
Conte R, Gilbert N, Sichman JS (1998). “MAS and Social Simulation: A Suitable Commitment.” In J Sichman, R Conte, N Gilbert (eds.), Multi-Agent Systems and Agent-Based
Simulation, First International Workshop, MABS ’98, Paris, France, July 4–6, 1998, volume 1534 of Lecture Notes in Computer Science, pp. 1–9. Springer-Verlag.
Conway J, Eddelbuettel D, Nishiyama T, Sameer KP, Tiffin N (2012). RPostgreSQL:
R Interface to the PostgreSQL Database System. R package version 0.3-1, URL http:
//CRAN.R-project.org/package=RPostgreSQL.
Crawley MJ (2005). Statistics: An Introduction Using R. John Wiley & Sons.
Csárdi G, Nepusz T (2006). “The igraph Software Package for Complex Network Research.”
InterJournal, Complex Systems, 1695. URL http://igraph.sf.net.
DeAngelis DL, Mooij WM (2005). “Individual-Based Modeling of Ecological and Evolutionary
Processes.” Annual Review of Ecology, Evolution, and Systematics, 36, 147–168.
Epstein JM, Axtell R (1996). Growing Artificial Societies: Social Science from the Bottom
Up. The Brookings Institution, Washington, DC.
Journal of Statistical Software
37
Felsen M, Wilensky U (2007). “NetLogo Urban Suite – Sprawl Effect Model.” URL http:
//ccl.northwestern.edu/netlogo/models/UrbanSuite-SprawlEffect.
Ferrer J, Prats C, López D (2008). “Individual-Based Modelling: An Essential Tool for
Microbiology.” Journal of Biological Physics, 34(1–2), 19–37.
Francois R (2011).
“2D Kernel Density Estimator: Perspective Plot and Contour Plot.” URL http://web.archive.org/web/20120706042750/http://addictedtor.
free.fr/graphiques/RGraphGallery.php?graph=1.
Gilbert GN (2008). Agent-Based Models. Quantitative Applications in the Social Sciences.
Sage, Los Angeles, CA.
Gilbert N (1999). “Simulation: A New Way of Doing Social Science.” American Behavioral
Scientist, 42(10), 1485–1487.
Goedman R, Grothendieck G, Højsgaard S, Pinkus A (2010). Ryacas: R Interface to the
Yacas Computer Algebra System. R package version 0.2-10, URL http://CRAN.R-project.
org/package=Ryacas.
Green S, Hurst L, Nangle B, Cunningham P, Somers F, Evans R (1997). “Software Agents:
A Review.” Technical Report TCD-CS-1997-06, Trinity College Dublin, Department of
Computer Science.
Griffin AF, Stanish C (2007). “An Agent-Based Model of Prehistoric Settlement Patterns
and Political Consolidation in the Lake Titicaca Basin of Peru and Bolivia.” Structure and
Dynamics, 2(2), 1–46.
Grimm V (1999). “Ten Years of Individual-Based Modelling in Ecology: What Have We
Learned and What Could We Learn in the Future?” Ecological Modelling, 115(2), 129–
148.
Grimm V, Railsback S (2005). Individual-Based Modeling and Ecology. Princeton University
Press, Princeton.
Heckbert S, Baynes T, Reeson A (2010). “Agent-Based Modeling in Ecological Economics.”
The Annals of the New York Academy of Sciences, 1185, 39–53.
Hewitt C (1976). Viewing Control Structures as Patterns of Passing Messages. A.I.Memo
410. MIT Press.
Hipp DR (2012). “About SQLite.” URL http://www.sqlite.org/about.html.
Iványi MD, Gulyás L, Bocsi R, Szemes G, Mészáros R (2007). “Model Exploration Module.”
In M North, C Macal, C Sallach (eds.), Proceedings of the Agent 2007 Conference on
Complex Interaction and Social Emergence, pp. 207–215. Argonne National Laboratory
and Northwestern University.
James DA (2011). RSQLite: SQLite Interface for R. R package version 0.11.1, URL
http://CRAN.R-project.org/package=RSQLite.
James DA, DebRoy S (2012). RMySQL: R Interface to the MySQL Database. R package
version 0.9-3, URL http://CRAN.R-project.org/package=RMySQL.
38
RNetLogo: R Marries NetLogo
Jennings NR (2000). “On Agent-Based Software Engineering.” Artificial Intelligence, 117(2),
277–296.
Kabacoff R (2010). R in Action. Manning.
Kabacoff RI (2011). Quick-R: Acccessing the Power of R. URL http://www.statmethods.
net/.
Kuhn M, Weston S, Coulter N, Lenon P, Otles Z (2010). odfWeave: Sweave Processing
of Open Document Format (ODF) Files. R package version 0.7.17, URL http://CRAN.
R-project.org/package=odfWeave.
LeBaron B (2000). “Agent-Based Computational Finance: Suggested Readings and Early
Research.” Journal of Economic Dynamics and Control, 24(5–7), 679–702.
Leisch F (2002). “Sweave: Dynamic Generation of Statistical Reports Using Literate Data
Analysis.” In W Härdle, B Rönz (eds.), Compstat 2002 – Proceedings in Computational
Statistics, pp. 575–580. Physica-Verlag.
Leombruni R, Richiardi M (2004). Industry and Labor Dynamics: The Agent-Based Computational Economics Approach: Proceedings of the Wild@ace2003 Workshop, Torino, Italy,
3–4 October 2003. World Scientific.
Luck M, McBurney P, Preist C (2003). Agent Technology: Enabling Next Generation Computing (A Roadmap for Agent Based Computing). AgentLink, University of Southampton,
Southampton.
Macy MW, Willer R (2002). “From Factors to Actors: Computational Sociology and AgentBased Modeling.” Annual Review of Sociology, 28, 143–166.
Maindonald JH (2008). Using R for Data Analysis and Graphics: Introduction, Code and
Commentary. URL http://CRAN.R-project.org/doc/contrib/usingR.pdf.
Malleson N, Heppenstall A, See L (2010). “Crime Reduction Through Simulation: An AgentBased Model of Burglary.” Computers, Environment and Urban Systems, 34(3), 236–250.
Matthews RB, Gilbert NG, Roach A, Polhill JG, Gotts NM (2007). “Agent-Based Land-Use
Models: A Review of Applications.” Landscape Ecology, 22(10), 1447–1459.
Moonen JM (2009). Multi-Agent Systems for Transportation Planning and Coordination.
ERIM Ph.D. Series Research in Management. Erasmus Research Institute of Management
(ERIM), Erasmus University Rotterdam.
Mukhin D, James DA, Luciani J (2012). ROracle: OCI Based Oracle Database Interface
for R. R package version 1.1-1, URL http://CRAN.R-project.org/package=ROracle.
North MJ, Collier NT, Vos JR (2006). “Experiences Creating Three Implementations of the
Repast Agent Modeling Toolkit.” ACM Transactions on Modeling and Computer Simulation, 16(1), 1–25.
North MJ, Macal CM, Aubin JS, Thimmapuram P, Bragen MJ, Hahn J, Karr J, Brigham
N, Lacy ME, Hampton D (2010). “Multiscale Agent-Based Consumer Market Modeling.”
Complexity, 15(5), 37–47.
Journal of Statistical Software
39
Oh R, Sanchez S, Lucas T, Wan H, Nissen M (2009). “Efficient Experimental Design Tools for
Exploring Large Simulation Models.” Computational & Mathematical Organization Theory,
15(3), 237–257.
Oliveira E (1999). “Applications of Intelligent Agent-Based Systems.” In Proceedings of SBAI
– Simpósium Brasileiro de Automação Inteligente, pp. 51–58. São Paulo.
Oracle (2013). “Java Native Interface.” URL http://docs.oracle.com/javase/7/docs/
technotes/guides/jni/index.html.
Owen WJ (2010). The R Guide.
Owen-TheRGuide.pdf.
URL http://CRAN.R-project.org/doc/contrib/
Pebesma EJ (2004). “Multivariable Geostatistics in S: The gstat Package.” Computers &
Geosciences, 30(7), 683–691.
Pebesma EJ, Bivand RS (2005). “Classes and Methods for Spatial Data in R.” R News, 5(2).
URL http://CRAN.R-project.org/doc/Rnews/.
Petzoldt T, Rinke K (2007). “simecol: An Object-Oriented Framework for Ecological Modeling
in R.” Journal of Statistical Software, 22(9), 1–31. URL http://www.jstatsoft.org/v22/
i09.
Piacentini M (2012). SQLite Database Browser. URL http://sourceforge.net/projects/
sqlitebrowser/.
Pinkus A, Winitzki S, Niesen J (2007). Yacas Computer Algebra System. URL http://yacas.
sourceforge.net/homepage.html.
Railsback SF, Grimm V (2012). Agent-Based and Individual-Based Modeling: A Practical
Introduction. Princeton University Press.
R Core Team (2014a). R: A Language and Environment for Statistical Computing. R Foundation for Statistical Computing, Vienna, Austria. URL http://www.R-project.org.
R Core Team (2014b). R Installation and Administration 3.1.0 (2014-04-10). URL http:
//CRAN.R-project.org/doc/manuals/R-admin.pdf.
R Core Team (2014c). R Language Definition: Version 3.1.0 (2014-04-10) DRAFT. URL
http://CRAN.R-project.org/doc/manuals/R-lang.pdf.
Reuillon R, Chuffart F, Leclaire M, Faure T, Dumoulin N, Hill D (2010). “Declarative Task
Delegation in OpenMOLE.” In W Smari, J McIntire (eds.), Proceedings of the 2010 International Conference on High Performance Computing and Simulation (HPCS), pp. 55–62.
Caen, France.
Ripley B (2012). RODBC: ODBC Database Access. R package version 1.3-5, URL http:
//CRAN.R-project.org/package=RODBC.
RWiki (2006). “rJava – R/Java Interface.” URL http://rwiki.sciviews.org/doku.php?
id=packages:cran:rjava.
40
RNetLogo: R Marries NetLogo
Schelling TC (1969). “Models of Segregation.” The American Economic Review, 59(2), 488–
493.
Shen W, Hao Q, Yoon HJ, Norrie DH (2006). “Applications of Agent-Based Systems in
Intelligent Manufacturing: An Updated Review.” Advanced Engineering Informatics, 20(4),
415–431.
Squazzoni F (2010). “The Impact of Agent-Based Models in the Social Sciences After 15 Years
of Incursions.” History of Economic Ideas, XVIII(2), 197–233.
Stonedahl F, Wilensky U (2013). “BehaviorSearch.” URL http://behaviorsearch.org.
Sycara KP (1998). “Multiagent Systems.” AI Magazine, 19(2), 79–92.
Tesfatsion L (2006). “Agent-Based Computational Economics: A Constructive Approach to
Economic Theory.” In L Tesfatsion, K Judd (eds.), Handbook of Computational Economics,
volume 2, chapter 16, pp. 831–880. Elsevier.
Thiele JC (2014). RNetLogo: Provides an Interface to the Agent-Based Modelling Platform
NetLogo. R package version 1.0-0, URL http://CRAN.R-project.org/package=RNetLogo.
Thiele JC, Grimm V (2010). “NetLogo Meets R: Linking Agent-Based Models with a Toolbox
for Their Analysis.” Environmental Modelling Software, 25(8), 972–974.
Thiele JC, Kurth W, Grimm V (2011). “Agent- and Individual-Based Modeling with NetLogo: Introduction and New NetLogo Extensions.” In K Römisch, A Nothdurft, U Wunn
(eds.), 22. Tagung der Sektion Forstliche Biometrie und Informatik des Deutschen Verbandes Forstlicher Forschungsanstalten und der Arbeitsgemeinschaft Ökologie und Umwelt der
Internationalen Biometrischen Gesellschaft – Deutsche Region, 20–21th September 2010 in
Göttingen (Germany), Die Grüne Reihe, pp. 68–101.
Tisue S (2012). “Controlling API.” URL https://github.com/NetLogo/NetLogo/wiki/
Controlling-API.
Urbanek S (2010). rJava: Low-Level R to Java Interface. R package version 0.8-8, URL
http://CRAN.R-project.org/package=rJava.
Urbanek S (2011). RJDBC: Provides Access to Databases Through the JDBC Interface. R
package version 0.2-0, URL http://CRAN.R-project.org/package=RJDBC.
Venables WN, Ripley BD (2002). Modern Applied Statistics with S. 4th edition. SpringerVerlag, New York.
Venables WN, Smith DM, R Core Team (2014). “An Introduction to R.” Notes on R: A
Programming Environment for Data Analysis and Graphics, Version 3.1.0 (2014-04-10),
URL http://CRAN.R-project.org/doc/manuals/R-intro.pdf.
Weiss G (1999). Multiagent Systems: A Modern Approach to Distributed Artificial Intelligence. MIT Press, Cambridge, MA.
Wilensky U (1997a). “NetLogo Fire Model.” URL http://ccl.northwestern.edu/netlogo/
models/Fire.
Journal of Statistical Software
41
Wilensky U (1997b). “NetLogo GasLab Free Gas Model.” URL http://ccl.northwestern.
edu/netlogo/models/GasLabFreeGas.
Wilensky U (1998). “NetLogo Virus Model.” URL http://ccl.northwestern.edu/netlogo/
models/Virus.
Wilensky U (1999). NetLogo. Center for Connected Learning and Computer-Based Modeling,
Northwestern University, Evanston, IL. URL http://ccl.northwestern.edu/netlogo/.
Wilensky U (2012). “BehaviorSpace.” URL http://ccl.northwestern.edu/netlogo/docs/
behaviorspace.html.
Wilensky U (2013). NetLogo User Manual, Version 5.0.5. Center for Connected Learning
and Computer-Based Modeling, Northwestern University, Evanston, IL. URL http://ccl.
northwestern.edu/netlogo/docs/.
Wilensky U, Rand W (2014). An Introduction to Agent-Based Modeling: Modeling Natural,
Social and Engineered Complex Systems with NetLogo. MIT Press. Forthcoming.
Wooldridge M (2002). Introduction to Multiagent Systems. John Wiley & Sons, New York,
NY.
Zuur AF, Ieno EN, Meesters E (2009). A Beginner’s Guide to R. useR! Springer-Verlag.
Affiliation:
Jan C. Thiele
Department of Ecoinformatics, Biometrics and Forest Growth
University of Göttingen
Büsgenweg 4
37077 Göttingen, Germany
E-mail: [email protected]
URL: http://www.uni-goettingen.de/en/72779.html
Journal of Statistical Software
published by the American Statistical Association
Volume 58, Issue 2
June 2014
http://www.jstatsoft.org/
http://www.amstat.org/
Submitted: 2012-01-11
Accepted: 2014-01-21