1
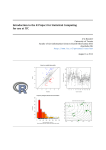
1
Estimating tides in strainmeter data
Introduction
At time periods of days to months earth tides dominate the signal in strain and tiltmeter data. In fact the
earth tides provide a known strain signal with which to perform an in-situ calibration of the instruments.
However, to identify transients in strain data the tidal signal must be removed and the relation between
external forces and strain change identified. Consider Figure 1 which shows the strain changes recorded by
5 volumetric dilatometers in Parkfield at the time of the M6.0 28 September 2004, Parkfield earthquake.
We see the tides clearly and we see an apparent change in strain rate that preceded the earthquake by ~7
days. We can also see however, that the strain changes are temporally correlated with the atmospheric
pressure.
Performing a tidal analysis of strain or tilt data is therefore necessary for two reasons; the amplitudes and
phases of the main tidal constituents can be used to calibrate the instrument and, once known, the tidal
parameters can be used to predict the tides at any time and the tidal signal may be removed from the data.
To remove the tides we need to identify the phase and amplitude of the main tidal constituents in the time
series. There are a variety of free software packages that estimate the tides in time series data.
• PIASD. Package for Interactive Analysis of Strain Data (Agnew May 2004).
• T-tide. A Matlab program that performs classical harmonic analysis for periods shorter than one year
(Pawlowicz, R., Beardsley, B., and Lentz, S., 2002).
• TSOFT. A windows based tidal analysis package (Van Camp, M., and Vauterin, P. 2005)
• ETERNA. Uses the least squares method to estimate tidal parameters, meteorological and hydrological
responses (Wenzel, 1996). Runs on an MS-DOS system.
• BAYTAP-G. A package that implements Bayesian statistics to estimate tidal parameters and
meteorological responses (Tamura et al., 1991). It is written in FORTRAN77 and runs on most UNIX
like systems. BAYATP-G is widely used in the scientific community and it is the package we will use
in this course.
BAYTAP-G
In the lecture on earth tides we saw that the tides can be thought of as a series of bands, or groups separated
by one cycle/month. BAYTAP-G assumes that within one group the phase and amplitude of the individual
tides are constant and it is these two terms that we solve for within each group. With an increasing number
of data points we can resolve more groups of tides and determine a more accurate description of the tidal
signal.
BAYTAP-G assumes that a signal yi can be decomposed into a tidal signal ti, a trend term di, perturbation
term ri and a random noise term ei,
(1)
y i = t i + d i + ri + e i
The perturbation term, or response term, is the change in the signal induced by another force such as
atmospheric pressure.
Tidal parameters, the trend, response terms and noise are estimated through an iterative method similar to
least square adjustment by minimizing equation (2) for a data set of length n,
2
K
n
" M
%
2
2
y
A
C
+B
S
-d
b
x
-hz
+
(
)
! $ i ! m mi m mi i ! k i-k i ' D ! [ d i -2d i-1 +d i-2 ]
&
i=1 #
m=1
k=0
i=1
n
M
2
2
+ WEIGHT ! "( A m -A m-1 ) + ( Bm -Bm-1 ) %
#
&
m=2
2
(2)
2
2
Donnalee
Microstrain
1.5
Vineyard
Frolich
1
Jack Canyon
0.5
Red Hills
2004/9/16
2004/9/18
2004/9/20
2004/9/22
2004/9/24
2004/9/26
2004/9/28
165
ATM Pressure (mbars)
Atmospheric pressure
160
155
150
145
2004/9/16
2004/9/18
2004/9/20
2004/9/22
2004/9/24
2004/9/26
2004/9/28
2004/9/30
Figure 1. Strain change measured by volumetric dilatometers in Parkfield September 2004.
where M is a group number of tidal constituents, Cmi and Smi are the summation of the cosine and sine parts
of each of the constituents in the m-th group respectively (theoretical values), Am and Bm are the tidal
constants to be determined, di is the trend, xi are associated data, bk are response weights, h is step value
and zi is a step function whose value is zero until a step occurs and increases by one after a step. D and
WEIGHT are hyperparameters that are chosen to minimize ABIC.
BAYTAP-G assumes that the trend varies smoothly and is represented by
di = 2di-1 - di-2 + ui
(3)
3
where di is the trend at observation point i and di-1 and di-2 are the trend values at the two preceding data
points. The term ui represents a white noise component.
The program varies D and each time computes the Akaike Bayesian Information Criterion (ABIC) value.
The best set of tidal parameters, trend values and response coefficients are found when the ABIC value is
minimized. The user can control how many iterations are stepped through and place constraints on
minimum values of D. The program will stop when the minimum ABIC is reached.
The following notes illustrate how to use BAYTAP-G to estimate the phase and amplitudes of the main
tidal constituents in strain or tidal data. These constituents can be to generate a time series correction to
remove the tidal signal from the dataset. They can also be used to calibrate the instrument by comparing the
observed phase and amplitude with that predicted by theory. We will work through two examples:
1. We will estimate the tides in data from a Gladwin tensor strainmeter and form a set of amplitudes and
phases of the M2 and O1 tides as measured by each gage.
2. We will estimate the tidal parameters for the M2 and O1 tides as measured by a volumetric dilatometer
and also estimate the atmospheric pressure response.
Installing and running BAYTAP-G
BAYTAP-G is written in FORTRAN77. It is available as a tar file from the National Astronomical
Observatory, Mizusawa, Japan via anonymous ftp. The recommended reference is (Tamura et al., 1991).
Since the program does not produce any graphics it is easily installed and compiled using f77 or g77. The
BAYTAP-G manual explains all possible processing options and data formats. The following examples
however, summarize the most important options for strain data analysis.
BAYTAP-G requires two input files; a file that contains the processing options, the input05.dat file, and a
tidal data set, in this case strain. Associated data sets e.g. atmospheric or pore pressure are optional input
files. Everything input to the program is read in formatted statements. This means that you have to be
careful that the input files are formatted correctly. In both the examples below we will use the user-defined
format (type 1 in the user’s manual).
The strain data should be cleaned before input to BAYTAP-G. By cleaning we mean obvious outliers, steps
and periods of noisy data are removed regardless of whether the irregular data are geophysical or
instrumental in origin. It is also important to remove any steps or outliers in associated data sets if they are
going to be used.
Estimation of the phase and amplitudes of the earth tides for a 3-component tensor
strainmeter.
For this example we will look at the 3 component strain data measured by the Gladwin Tensor Strainmeter
at Pinyon Flat Observatory (PFO) in Southern California. A laser strainmeter and three volumetric
dilatometers have also been installed at PFO and so the data set proves an interesting one in terms of
comparing the measured earth tides with that measured by a co-located laser strainmeter and dilatometers
and with theoretical models. The instrument was installed in December 1983 and samples at 18 minute
intervals. The data set consists of 3 months of data measured in 1990 (figure 2). The data have had borehole
trends removed and have been lowpass filtered and decimated to 3-hour sample intervals. The sample data
sets are in the data directory, /home/data/baytap_examples and are called input05.dat.pft, input12.dat.pft1,
input12.dat.pft2 and input12.dat.pft3.
4
150
100
50
COUNTS
0
-50
-100
-150
-200
gage1
gage2
gage3
-250
1990/Jan/1
1990/Feb/1
1990/Mar/1
1990/Apr/1
Date
Figure 2. Three months of data from Pinyon Flat GTSM. The data are edited and have had the borehole
trends removed.
Parameter Input File.
The input05.dat file defines the period of data being analyzed and contains all the parameter settings used
by the program. All processing parameters must be placed between &PARAM and &END.
Example of input05.dat file.
Line
1
&PARAM
2
KIND=7,
3
SPAN=1780 ,
4
SHIFT=1780,
5
DMIN=1,
6
LPOUT=0,
7
FILOUT=1,
8
TIMSYS=0.0D0,
9
MAXITR = 21,
10
&END
5
11
12
13
14
15
16
17
18
19
20
1990 1 1 8.45 2170 3.0
0
GROUPING ( 0:AUTO; -2,-1,1--6:MANUAL )
12 1 0
I/O UNIT, FORMAT, STEP ( TIDAL DATASET )
9999
TITLE
STRAIN TIDE ANALYSIS
9999
PINYON FLAT CALIFORNIA
STATION NAME
GLADWIN TENSOR STRAINMETER
INSTRUMENT NAME
9999
COUNTS
UNIT OF TIDAL DATA
KIND. Defines the kind of theoretical tide calculation for analysis.
1. Gravity tide, micro-Gal, increase is taken to be positive.
2. NS Tilt, millisecond of arc. Subsiding northern ground taken to be positive. For a horizontal pendulum
tiltmeter, tending the pendulum to the north is positive and for a water tube tiltmeter, uplift of water
level in the northern pot is positive. For water tube tiltmeters, the data set must be the difference of
water levels between the northern and southern pots.
3. EW Tilt, millisecond of arc. Subsiding eastern ground is taken to be positive. There is an optional
parameter AZ that allows analysis of the tilt tide in any direction. If the direction of tilt is n degrees
measured clockwise from north, set KIND=2 and AZ=n.
4. NS Strain.
5. EW Strain.
6. NE Strain.
7. Strain. The tide generating potential / mean earth radius / acceleration due to gravity is used as the
theoretical tide where the mean radius is assumed to be 6371023.6 m. This value is non-dimensional.
8. Ocean tide, cm, uplift is taken to be positive. The theoretical value is defined as potential / mean
gravity where mean gravity is 982.024 Gals.
SPAN. The number of observations to process in one window.
SHIFT. The number of data points the data window being analyzed is shifted by. For example, if
SPAN=744 and SHIFT=720, the data window will be 744 observations long and overlap by 24 data
points. If SHIFT is set to zero the trend is not obtained and BAYTAP-G processes with the entire data
set ignoring the SPAN parameter. If the SHIFT is greater than the SPAN the data that are skipped are
not used in the analysis.
DMIN. The lower limit of hyperparameter D. BAYTAP-G searches for the value of D that minimizes the
ABIC value. The range searched for the D value is DMIN=<D =<1000.0. The default value is 0.25.
LPOUT. Tidal analysis output. If LPOUT=0 the estimated tidal factors and the frequency response of
associated data are printed. If LPOUT=1 and SHIFT>0, the determined trend and irregular part are
also printed. If LPOUT=2 then debug information is printed along with the output of LPOUT=1. The
default value is 0.
FILOUT. Tidal calculations output. BAYTAP-G assumes the input data can be decomposed into four
parts: the tidal component, trend, response part (if an associated dataset exists) and irregular part
(noise). The result of this decomposition is written to an output16.dat file when FILOUT=1.
TIMSYS. Correction amount by which to adjust time system to UTC. For example, if the data are
observed in UTC, TIMSYS=0.0. If the time system is Japanese Standard Time (JST), TIMSYS = -9.0.
The difference between ephemeris time (dynamic time) and universal time is fixed to 51 seconds.
MAXITR. Upper limit of number of iterations to search minimum ABIC. The default value is 21.
6
The input data are described on lines 11 to 20 of the above example.
11. Beginning date of analysis, number of samples and resample interval. The FORMAT is as follows,
YYYY MM DD NNNN
S.S
(3I5,F5.0,I5,F10.0).
where YYYY is the year, MM the month and DD the day of the month. NNNN is the number of
samples and S.S is the sample interval in hours. If the files are type 1 (user defined format type) the
sample interval given here is ignored and the value is defined in the tidal data set (input12.dat file).
12. Grouping of tidal constituents. The number of tidal constituents to be determined by the program is set
here. If this parameter is zero, the number of groups is automatically selected according to the data
length as follows.
Data window (days) Number of groups
0 to 8
3
8 to 16
5
16 to 180
12
180 to 364
14
364 to 2000
15
> 2000
20
Groups can also be defined manually. If the grouping parameter is set to -2, -1, 1, 2, 3, 4, 5 or 6 then 3,
5, 12, 14, 15, 20, 22 and 31 groups are adopted respectively no matter what the data length is.
However, it is advisable to select the number of groups considering the quality and amount of data.
13. Tidal data set. The input unit number for the tidal dataset, format specification, and flag to re-estimate
a step size respectively are specified on this line. The unit number corresponds to the input file name of
the tidal data set. For example, 12 would imply the filename of the tidal dataset is input12.dat. The
format type describes the format of the data; it is one of -1, 0 or 1.
14-16. Title line. This will be printed in the output files. Descriptive text can be recorded within the next 10
lines. It must be preceded and followed by the term 9999.
17. Station name
18. Instrument name
20. Unit of tidal data. Since one of the main reasons we look at the amplitude and phases of the tides is for
calibration purposes we input the data in volts, or counts, as measured by the data logger. Then we can
relate the amplitude and phase of the tide in counts to that predicted in nanostrain.
7
Tidal Data Input file
We specified on line 12 of the input05.dat file that the strain data file would be called input12.dat. We also
specified that the data would be input in a user-defined format. We will define what the format will be in
the input12.dat file. The following is an example of an input12.dat file.
Line
1
2
3
4
5
6
7
8
1.
2.
3.
4.
5.
6.
Content
PINYON FLAT OBSERVATORY, GTSM, GAUGE 1
33.610 -116.4550 0.00 982.024
1990 1 1 8.45
2170 3.0
99990.0
(6F12.4)
4565.000 44566.000 44567.000 44568.000 44565.000 44566.000
4565.000 44563.000 99999.000 44561.000 44563.000 44564.000
…..
Title
Coordinates of site. Latitude and longitude (degrees), altitude (m), acceleration due to gravity (cm/s2).
Date of first observation. The format is YYYY MM DD HH.HH where YYYY is the year, MM is the
month, DD is the day of the month and HH.HH is the hour.
Number of observations, sampling interval (units of hours), missing data flag. The missing data flag
must be positive or zero. If it is positive, data whose absolute values are greater than the missing data
flag are ignored. If it is zero, all observations are used in the analysis.
Format of input data. Describes the format of the data in a FORTRAN77 formatting statement, e.g.,
6f12.4 would imply six values per row each twelve characters long with four decimal places.
Input data.
The tidal analysis output file
The following is a description of the results from BAYTAP-G after analyzing the data from gage 3 of the
Pinyon Flat tensor strainmeter. The tidal results are output to file output06.dat. In our example lines 1 to 71
list all the parameter settings, data start date, and station information. You should check these values to
make sure that your input files are formatted correctly. Note that all the parameter settings are listed. If we
did not specifically set them then the default values are used where necessary. Line 74 contains the date and
time of the first and last data points of each window. This is another opportunity to check the time interval,
dates and number of sample has been read in correctly.
The ABIC trace information follows. BAYTAP-G varies the parameter D to try and attain a minimum
value for the ABIC value. The program starts with a D value that is four times DMIN and iterates until it
reaches a minimum. If the minimum value is not reached and BAYTAP reaches the DMIN value then a
warning message is generated and the program continues using the DMIN value in the input05.dat file. In
this example we set DMIN to be 0.5, the program therefore begins with a D value of 4.0
78 ABIC(4.0000E+00)=132.95 ALSQE=-5.87259E+02 ALNDN=1.28587E+03 ALNDTD= 9.27765E+02
79ABIC(5.6569E+00)=197.58 ALSQE=-4.44761E+02 ALNDN=1.48399E+03 ALNDTD=1.16482E+03
80 ABIC(2.8284E+00)= 88.02 ALSQE=-7.25021E+02 ALNDN=1.09523E+03 ALNDTD=6.90709E+02
81 ABIC(2.0000E+00)= 59.18 ALSQE=-8.64761E+02 ALNDN=9.13621E+02 ALNDTD=4.53652E+02
82 ABIC(1.4142E+00)= 45.02 ALSQE=-1.01195E+03 ALNDN=7.43084E+02 ALNDTD=2.16596E+02
83 ABIC(1.0000E+00)=46.77 ALSQE=-1.17073E+03 ALNDN=5.86288E+02 ALNDTD=-2.04605E+01
84
85 MINIMUM ABIC= 45.02 ATTAINED AT VMIN = 1.4142E+00 SD = 4.7724E-01
8
The program iterates six times before finding that a DMIN of 1.4142 gives the best ABIC value of 45.02.
There is some trial and error here in choosing an initial DMIN value and making sure that you have set the
number of iterations, MAXITR, large enough.
The station information, data window information and tidal values are printed between lines 105 and 136.
For each tidal group the print out shows the tidal group name, a tidal factor and error, the phase with
respect to the local potential and error and the amplitude and error. The amplitude is in the same units as
the input.
105
106
107
108
109
110
111
112
113
114
115
116
117
118
119
120
121
122
123
124
125
126
127
128
129
130
131
132
133
134
135
136
STATION
Pinyon Flat
LON.=
-116.455 E
LAT.=
33.610 N
H =
0.00 M
INSTRUMENT GTSM
AMPLITUDE COUNTS
PERIOD
1990 1 3 8.8 - 1990 3 29 17.8
AVAILABLE / BLOCK LEN.
684 / 684
ANALYZED BY BAYTAP-G VERSION 99-11-15
POTENTIAL : TAMURA, Y., 1987, BIM, 99. (WITH P4)
CALCULATION : NATIONAL ASTRONOMICAL OBSERVATORY, MIZUSAWA
GROUP
1
2
3
4
5
6
SYMBOL
( 1-143 : Q1)
(144-201 : O1)
(202-249 : M1)
(250-305 : P1S1K1)
(306-345 : J1)
(346-450 : OO1)
7 (451-549 : 2N2)
8 (550-599 : N2)
9 (600-655 : M2)
10 (656-681 : L2)
11 (682-827 : S2K2)
12 (828-909 : M3
FACTOR (RMSE)
PHASE (RMSE) AMPLITUDE (RMSE)
(LOCAL, LAG:NEGATIVE)
0.57317 ( 0.01601) -19.688 ( 1.603) 1.597 ( 0.045 )
0.58692 ( 0.00267) -16.203 ( 0.261) 8.542 ( 0.039 )
0.61817 ( 0.03463) -19.629 ( 3.209) 0.708 ( 0.040 )
0.54246 ( 0.00188) -14.220 ( 0.199) 11.104 ( 0.039 )
0.62440 ( 0.03325) 3.852 ( 3.051) 0.715 ( 0.038 )
0.68638 ( 0.03416) -10.333 ( 2.850) 0.430 ( 0.021 )
0.85911 ( 0.04293) 25.371 ( 2.869) 0.578 ( 0.029 )
0.74344 ( 0.00625) 7.941 ( 0.481) 3.782 ( 0.032 )
0.63454 ( 0.00107) 6.027 ( 0.097) 16.860 ( 0.028 )
0.75694 ( 0.04889) -13.121 ( 3.696) 0.568 ( 0.037 )
0.59756 ( 0.00186) -7.220 ( 0.179) 7.387 ( 0.023 )
)
0.21205 ( 0.08853) 38.428 ( 23.930)
0.061 ( 0.026 )
Since the data set is 3 months long and we instructed the program to automatically select the number of
tidal groups 12 groups are solved for. The M2 and O1 tides are those usually used to calibrate strainmeters,
as they are the largest tides with periods sufficiently different from 24 hours so as not to be contaminated
by thermal or other diurnal non-tidal signals. The phase of the M2 tide is 6.027±0.097 degrees and the
amplitude is 16.860±0.028 counts. The factor column contain the relative amplitudes that would be input to
Tamura’s tidal prediction program
BAYTAP-G also prints out a useful plot of the power spectrum of the trend. We expect that if the tides
have been properly estimated then there will be no energy above the background noise at the tidal
frequencies. This plot provides a quick visual guide as to how well the tides have been determined.
9
Time series output file.
If FILOUT=1 was specified in the input05.dat file then an output16.dat will be written. The output is
decomposed into four parts; the tidal component, the trend, the response (if there is associated data) and a
noise part, ORIGINAL DATA = TIDAL COMP + TREND + RESPONSE + NOISE. In this example the
response part is zero, as we have no associated data. Plot_baytap.sh is a simple GMT script that can be used
to plot the data. It reads the results from the output16.dat file and the start times and titles from the
input12.dat file.
The process of estimating the amplitude and phase of the M2 and O1 tides is repeated for each gauge. The
final results are a set of 12 observations, the phase and amplitude of the M2 and O1 tides for three gauges.
The results from this analysis are summarized in Table 1.
Table 1. Phase (degrees) and amplitude (counts) of the M2 and O1 tides on each of the PFO tensor
strainmeter.
M2 phase
M2 amp
O1 phase
O1 amp
Gage1
69.633 ( 0.440) 5.209 ( 0.040 ) 8.464 ( 0.889)
8.045 ( 0.125 )
Gage2
-1.443 ( 0.258) 26.449 ( 0.119 ) 14.189 ( 3.432)
5.754 ( 0.345 )
Gage3
6.027 ( 0.095) 16.860 ( 0.028 ) -16.203 ( 0.270)
8.542 ( 0.040 )
When we use these parameters for calibration it is often more useful if they are described as real and
imaginary numbers rather than the amplitudes and phases. If a signal is expressed in terms of amplitude R,
and phase theta then the real component is computed using R*cos(theta) and the imaginary component
computed using R*sin(theta).
Estimating the relation between atmospheric pressure and strain change
BAYTAP-G can be used to estimate the linear relation between strain change and changes in pressure. In
this example we will look at how to estimate a linear relation between atmospheric pressure and volumetric
strainmeters using BAYTAP-G. Volumetric dilatometers consist of fluid-filled chambers that are several
feet long and thus are much more sensitive to changes in vertical strain than Gladwin Tensor Strainmeters
where each cell is ~17 cm tall. As for the above example we should begin with a cleaned strain and
pressure data set.
We will look at the strain data from the volumetric dilatometer at Donna Lee from August to October 2004.
The data have been cleaned, low pass filtered and decimated to 1-hour samples using the methods outlined
in Viewing and Editing data. The data are then reformatted into BAYTAP-G files. The BAYATAP-G files
for Donnalee are in /home/data/baytap_example and called input05.dat.donnalee, input12.dat.donnalee and
input14.dat.donnalee.
Parameter Input File.
The input05.dat file is similar to the above example. This time we include information on an associated
data set, in this case atmospheric pressure.
1
2
3
4
5
6
7
&PARAM
KIND=7,
SPAN=2171,
SHIFT=2171,
DMIN=0.01,
LPOUT=0,
FILOUT=1,
10
8
9
10
11
12
13
14
15
16
17
18
19
20
21
22
23
24
IAUG=1,
LAGP=0,
TIMSYS=0.0D0
MAXITR = 50,
&END
2004 08 1 19.0 2171 1.0
0
GROUPING ( 0:AUTO; -2,-1,1--6:MANUAL )
12 1 0
I/O UNIT, FORMAT, STEP ( TIDAL DATASET )
14 1 0
I/O UNIT, FORMAT, STEP ( ATM DATASET )
9999
TITLE
VOLUMETRIC STRAIN
9999
DONNALEE PARKFIELD
STATION NAME
SINGLE CHAMBER VOL DILATOMETER
INSTRUMENT NAME
9999
COUNTS
UNIT OF TIDAL DATA
ATMOSPHERIC PRESSURE
TITLE OF ASSOSIATED DATASET
We have set the shift and span to the same value which means the data will be analyzed in one window.
The IAUG states there is one associated data set (atmospheric pressure). LAGP sets the allowable time lag
between pressure change and strain change to be zero hours. A response coefficient will be calculated for
each allowable lag; if we allow a lag of up to 3 hours BAYTAP-G will calculate the response coefficient at
0, 1, 2 and 3 hours. The input file has 2171 observation points and the time series begins on 19:00, 1
August, 2004 UTC (line 13). We specify that the associated data will be in unit 14 (line 16). The units of
the tidal data set and title of the atmospheric pressure data are stated on lines 23 and 24 respectively. The
strain input file (input12.dat) and the pressure input file (input14.dat) have exactly the same data formats as
described in first example. The strain data is in units of counts and the pressure data in units of millibars.
The header lines of the input12.dat and input14.dat files have similar information,
1
2
3
4
5
DONNALEE PARKFIELD VOL DILATOMETER
35.94 -120.42
568.0 980.122
2004 8 1 19.0
2171 1.0 99990.D0
(1F9.1,4F13.1)
On line 4 the missing data flag is set to 999990.0, any data point with a value greater than this will not be
used in the analysis.
The output files.
An output06.dat and an output16.dat file are created. Looking at the ouput06.dat file we should check that
the dates and correct number of samples have been read correctly. The following line numbers correspond
to the numbers of the lines in the output06.dat file.
48
49
50
51
52
DATE OF THE FIRST DATA
YEAR
MONTH
DAY
2004
8
1
HOUR DATA COUNT SAMPLING
19.00 2171
1.00
*** SPAN = 2171
***
SHIFT = 2171
The program stepped through the minimizing algorithm six times. Our initial value of DMIN is set to 0.05
in the input05.dat file so the program begins with a D value of 0.2. It reached a minimum value at D=
7.0711E-02 and an ABIC value of 3736.17.
11
89 ABIC(2.0000E-1)= 3741.65 ALSQE=-3.75324E+3 ALNDN=2.30894E+2 ALNDTD=-3.51455E+03
90 ABIC(2.8284E-1)= 3757.68 ALSQE=-2.56940E+3 ALNDN=3.99404E+2 ALNDTD=-2.76214E+03
91 ABIC(1.4142E-1)= 3738.07 ALSQE=-5.04583E+3 ALNDN=1.22986E+2 ALNDTD=-4.26696E+03
92 ABIC(1.0000E-1)= 3736.94 ALSQE=-6.42014E+3 ALNDN=5.71691E+1 ALNDTD=-5.01937E+03
93 ABIC(7.0711E-2)= 3736.17 ALSQE=-7.84571E+3 ALNDN=1.71553E+1 ALNDTD= -5.77178E+03
94 ABIC(5.0000E-2)= 3737.14 ALSQE=-9.29865E+3 ALNDN=-8.30084E+0 ALNDTD=-6.52420E+03
95
96 MINIMUM ABIC = 3736.17 ATTAINED AT VMIN = 7.0711E-02 SD = 1.6197E-01
This output06.dat file contains information on the pressure response coefficient.
106 RESPONSE WEIGHTS
ASSOCIATED DATASET NO. = 1
107 LAG
=
0
108 RESPC
= 2.57748E+01
109 ERROR
= 2.24831E-01
This means that at zero lag interval one millibar of pressure change induces a change of
2.57748E+01±2.24831E-01 counts of strain. The phase and amplitudes of the tidal groups and the
associated uncertainty follow.
137
138
139
140
141
142
143
144
145
146
147
148
149
150
151
152
GROUP
1
2
3
4
5
6
SYMBOL
( 1-143 : Q1)
(144-201 : O1)
(202-249 : M1)
(250-305 : P1S1K1)
(306-345 : J1)
(346-450 : OO1)
7 (451-549 : 2N2)
8 (550-599 : N2)
9 (600-655 : M2)
10 (656-681 : L2)
11 (682-827 : S2K2)
FACTOR (RMSE)
PHASE (RMSE) AMPLITUDE (RMSE)
(LOCAL, LAG:NEGATIVE)
1.43024 ( 0.16271) 171.591 ( 6.519) 4.118 ( 0.468 )
1.40260 ( 0.06474) 171.581 ( 2.646) 21.093 ( 0.974 )
1.23411 ( 0.12193) 169.672 ( 5.660) 1.460 ( 0.144 )
1.05665 ( 0.05042) 166.463 ( 2.720) 22.348 ( 1.066 )
1.10994 ( 0.16200) 167.842 ( 8.360) 1.313 ( 0.192 )
1.12289 ( 0.22124) 169.405 ( 11.289) 0.727 ( 0.143 )
1.40348 ( 0.16807)
1.42390 ( 0.06628)
1.57712 ( 0.01138)
1.60321 ( 0.10609)
1.57998 ( 0.01844)
-161.674 (
-160.402 (
-163.686 (
-169.593 (
-171.276 (
12 (828-909 : M3) 0.63920 ( 0.46740) -176.189 ( 41.911)
6.861)
2.666)
0.414)
3.792)
0.738)
0.895 ( 0.107 )
6.862 ( 0.319 )
39.696 ( 0.286 )
1.141 ( 0.075 )
18.502 ( 0.216 )
0.171 ( 0.125 )
The frequency response of the associated data, the power spectrum of the trend and a summary of potential
outliers follow. Most of the data points listed in the summary correspond to missing data points where the
trend or response could not be evaluated. We can examine the results by plotting the file output16.dat using
plot_baytap_dates.sh (figure 3) .
There is a small step in the trend on the 30 August. This offset corresponds to an instrument reset and an
offset correction that was applied during editing. A small step still remains in the data set but is only visible
once the tides have been removed. For this reason the editing process is often an iterative one where one
edits the data and estimates the tides. The raw data should be re-edited with the tides removed. Once
removed better offset corrections are achieved and other smaller offsets may become more easily identified.
We can examine the effect of increasing the lag time for which we allow an atmospheric pressure response
by running BAYTAP-G several times, each time increasing the LAGP value (Table 2). Each time we
examine the ABIC value to look for an improvement in fit.
12
LAGP
0
ABIC
3736.17
1
3609.77
2
3603.08
3
3598.50
RESP0
2.5775E+01
±2.248E-01
2.5416E+01
±2.203E-01
2.5727E+01
±2.3874E-01
2.5763E+01
±2.3837E-01
RESP1
RESP2
RESP3
-2.5734E+00
±2.2039E-01
-2.41325E+00
±2.24581E-01
-2.73869E+00
±2.42023E-01
8.12720E-01
±2.39591E-01
6.63186E-01
±2.42658E-01
-8.52815E-01
±2.39259E-01
Letting the lag interval be up to 3 hours (LAGP=3) gives the lowest ABIC value indicating that allowing a
3-hour lag response gives a better fit to the data. Increasing LAGP to 4 results in a larger ABIC value. The
response coefficient is largest at zero lag and becomes less significant as the lag increases. The phase and
amplitude of the M2 and O1 tides are not changed outside the RMS error listed in the output. The response
coefficients, although above the stated error are two orders of magnitude less than the response coefficients
at zero and 1-hour lags.
Figure 4 shows the original data minus the tides and the pressure response from the output16.dat file from
the 16th to the 30th September, 2004. You can see that while the shorter-term variations in strain caused by
the pressure changes are removed from the data there is still a change in trend from the 20 to 22 of
September that may be correlated with pressure changes. Estimating the pressure response using crossspectral analysis is another way to try and remove this longer-term pressure signal.
13
DONNALEE PARKFIELD VOL DILATOMETER
7000
ORIGINAL
6500
6000
8
15
22
29
5
August
50
12
19
26
3
10
September
17
24
October
TIDE
0
-50
-100
8
15
22
29
5
August
12
19
26
3
10
September
17
24
October
200
100
RESPONSE
0
-100
-200
-300
8
15
22
29
5
August
7000
12
19
26
3
10
September
17
24
October
TREND
6500
6000
8
15
22
29
5
August
5
4
3
2
1
0
-1
-2
-3
-4
-5
12
19
26
3
10
September
17
24
October
IRREGULAR
8
15
August
22
29
5
12
19
September
26
3
10
17
24
October
Figure
3.Jul
Three
months
of data from1Donnalee
Parkfield.
Atm lag is zero.
Figure
X.
Output
from BAYTAP-G,
August tovolumetric
1 October,dilatometer,
2004. Lag interval
is zero.
2005
3 14:09:09
14
9000
ORIGINAL
COUNTS
8500
8000
ORIGINAL - TIDES
7500
ORIGINAL - TIDES - ATM PRESSURE RESP
7000
2004/9/16
2004/9/18
2004/9/20
2004/9/22
2004/9/24
2004/9/26
2004/9/28
2004/9/30
2004/9/22
2004/9/24
2004/9/26
2004/9/28
2004/9/30
165
ATM Pressure (mbars)
Atmospheric pressure
160
155
150
145
2004/9/16
2004/9/18
2004/9/20
Figure 4. Strain data from Donnalee with tides and atmospheric pressure response removed. The atm
response lag is three hours. The lower figure shows the atmospheric pressure measured at Donnalee.
Once the amplitude and phase of the M2 and O1 tides are known a time series correction can be generated
using those parameters for any time period and sample interval using the program hartid from the SPOTL
package (Agnew, 1996). Although BAYTAP-G solves for at least 12 tidal groups it is best to input just the
M2, O1 and N2 parameters if the analysis is based on 3 to 6 months of data. If the data set is longer than 6
months then the K1 tide could be included. The program then uses spline interpolation to estimate the
amplitudes of an additional 116 individual tides; 18 long- period, 51 diurnal, and 50 semidiurnal
constituents are used in the prediction.
15
In theory if the tidal amplitudes and phases have been found for one window of data then they should not
change over the lifetime of the instrument. A set of M2 and O1 parameters determined from three months
of data should be sufficient to predict the tides at a time many years later. For laser strainmeters this is the
case but it has been found that for some dilatometers and GTSMs the tidal parameters are not constant with
time. Figure 5 shows the change in M2 amplitude at the Coyote dilatometer in the Bay Area. The entire
data set from the instrument was analyzed in 2-month windows using BAYTAP-G and the amplitude and
phases plotted. There is a clear drift in M2 amplitude with time; the reason may be a result of aging cables
or electronic drift. The implication is that the scale factors at this site will change with time. Figure 6 shows
that change in phase of the M2 tide as measured by the PFO GTSM. While the phases for gages 2 and 3
remain constant with time the gage 1 M2 phase changes by ~12° again, the implication is that the scale
factor will change with time.
16
Figure 5. Amplitude and phase of the M2 tide at the Coyote Hills volumetric dilatometer,
Bay area.
17
Pinyon Flat GTSM
5
0
Degrees
-5
-10
M2 Phase
-15
G1_phase_change
G3_phase_change
G2_phase_change
-20
1984
1988
1992
1996
2000
2004
Year
Figure 6. Change in M2 phase with time at the PFO GTSM.
References
Agnew, D.C., 1996: SPOTL: Some Programs for Ocean-Tide Loading, SIO Reference Series 96-8, p.34.
Pawlowicz, R., Beardsley, B., and Lentz, S., 2002. Classical tidal harmonic analysis including error
estimates in MATLAB using T_TIDE. Computers and Geosciences, 28(8): 929-937.
Van Camp, M., and Vauterin, P., Tsoft: graphical and interactive software for the analysis of time series
and Earth tides, Computers & Geosciences, 31(5) 631-640, 2005.
Wenzel, H. G. 1996, The nanogal software; Earth tide data processing package ETERNA 3.30, Marees
Terrestres. Bulletin d'Informations, 124 (1996): 9425-9439.
18
Tamura, Y., T.Sato, M.Ooe and M.Ishiguro, 1991: A Procedure for Tidal Analysis with a Bayesian
Information Criterion, Geophysical Journal International, 104, 507-516.