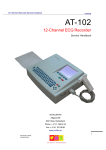
1
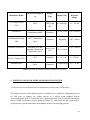
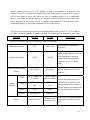
 The City College of New York
The City University of New York (CUNY)
Biomedical Engineering Senior Design I
Wireless ECG Monitoring System Project Report
Coordinators:
Prof. Marom Bikson
Prof. Luis Cardoso
Teaching Assistant:
Gaurav Agarwal
Sponsor:
National Aeronautics and Space Administration
Project Team Members:
Mohamed Osman
Ndongo Khouma
Sadia Abbasi
Atia Syed
Mizanur Rahman
Neranjan Da Silva
TABLE OF CONTENTS
1
INTRODUCTION .......................................................Error! Bookmark not defined.
2
PRIOR ART .............................................................................................................. 7
2.1
2.2
2.3
2.4
2.5
2.6
2.7
2.8
3
SPECIFICATIONS FOR WIRELESS BIOMONITOR SYSTEM ................... 13
3.1
3.2
4
The Lifeguard Crew Physiological Observation Device (CPOD) ....................... 7
UltraView Telemetry ........................................................................................... 8
The Myomonitor Wireless EMG System............................................................. 9
Crystal Monitor 20-B ........................................................................................... 9
Ambulatory Data Acquisition System ............................................................... 10
Biomedical Wireless and Ambulatory Telemetry for Crew Health (BioWatch)11
LifeSync Wireless ECG System ........................................................................ 11
Hospital bedside monitors.................................................................................. 12
Specifications for Wireless Electrode Module (Required and Desired) ............ 13
Specifications for the Receiver Unit (Required and Desired)............................ 16
DESIGN CONCEPTS ............................................................................................ 18
4.1 General Design Concept .....................................Error! Bookmark not defined.
4.2 Specific Concepts................................................Error! Bookmark not defined.
4.2.1 Concept 1 .....................................................Error! Bookmark not defined.
4.2.2 Concept 2:....................................................Error! Bookmark not defined.
4.2.3 Concept 3:....................................................Error! Bookmark not defined.
4.2.4 Wireless transmission options .....................Error! Bookmark not defined.
5
DESIGN SELECTION................................................Error! Bookmark not defined.
6
BUDGET…………………………………………………………………………..20
7
REFERENCES.............................................................Error! Bookmark not defined.
2
LIST OF ILLUSTRATIONS
FIGURES
Figure 1- Representative Schematic of Normal ECG wavefom..................................................... 6
Figure 2- The Lifeguard Crew Physiological Observation Device (CPOD) and components [5]. 8
Figure 3- UltraView Telemetry [22]............................................................................................... 8
Figure 4- The Myomonitor wireless EMG module connected to the input module [7]. ............... 9
Figure 5- Patient unit and the wireless receiver connected to a PC [6]. ....................................... 10
Figure 6- The base recorder of ADAS [2]. ................................................................................... 11
Figure 7- Components of the Biomedical Wireless and Ambulatory Telemetry for Crew Health
[2].......................................................................................................................................... 11
Figure 8- The patient transceiver (sensor unit) and monitor transceiver (receiver unit) of the
LifeSync Wireless ECG System [11]. .................................................................................. 12
Figure 10- (a). Indicates the final prototype of the circuit, major active components include INA
126p, a microcontroller MSP430 (Taxes Instrument Inc., ), the Bluetooth® module,
numeric LCD, D/A converter, serial port (RS232) and a 3.7V battery. (b). Indicates the
final case design for the Wireless ECG system. Input includes three electrodes (negative,
positive and ground) where as the outputs include RS232 and analog line out. A USB port
allows battery recharging. The front panel also features on/off switches for the device and
Bluetooth® as well as indicative LEDs for power and Bluetooth®. .................................... 22
Figure 14- Graphical User Interface for Wireless ECG Monitoring System................................ 28
Figure 15- Cost of Wireless ECG Monitoring System Vs Other Currently Marketed ECG
Systems. ................................................................................................................................ 29
TABLES
Table 1- Specifications of bedside monitors commonly used in hospitals................................... 13
Table 2- Specifications Table for Sensor Unit.............................................................................. 16
Table 4- Specifications Table for Sensor Unit.............................................................................. 18
Table 5- Comparative Cost Table For Commonly used ECG Monitoring Systems..................... 29
3
1
ABSTRACT
2
INTRODUCTION
The monitoring of vital physiological signals has proven to be one of the most efficient ways for
continuous and remote tracking of the health status of patients. Electrocardiogram monitors are
often used in many medical service centers and hospitals to diagnose and monitor a person’s
health status by measuring their cardiac activity. An ECG is a noninvasive monitor, which can be
utilized to evaluate the heart electrical activity, measure the rate and regularity of heartbeats, the
position of the chambers, identify any damage to the heart and investigate the effect of drugs and
devices used to regulate the heart. This procedure is very useful for monitoring people with (or
susceptible to) impairments in their cardiac activity. In addition, during surgical procedures, the
electroencephalogram (EEG) is measured along with his/her ECG to track the consciousness
level of a patient during anesthesia [7]. Other physiological parameters such as oxygen saturation
in hemoglobin, electromyography and blood pressure similarly provide vital information about
the health of a given person when continuously monitored.
One of the invariable risks associated with space missions are the threats posed by the very harsh
spatial environments to the physical and mental health of the astronauts. Being exposed to these
types of environment for long periods of time has adverse impact on cardiac, muscular, and
neurological functions on astronauts [3] (example of reduced gravity, high temperatures, planet
dust particles, solar rays, etc). Fortunately, the continuous monitoring of physiological
parameters such as electrocardiography, electromyography, electroencephalography, oxygen
saturation in hemoglobin and variability of cardiac frequency may provide crucial information
for a rapid diagnosis of medical conditions in astronauts; preventing the growth of any health
condition to proportions susceptible to cause mission failure or even death of a crew member.
To provide a means to continuously monitor several physiological parameters using just one
device, a variety of multi-parameter monitors (or biomonitor) systems have been introduced in
the past few years, with many of them currently used by hospitals, researchers, and NASA.
Although, these devices are commonly used to detect, process and record several physiological
signals simultaneously, the conventional telemetry system they employ limits the freedom of
movement of the subjects whose biopotentials are being measured. First of all, most of these
systems receive power from an electrical outlet and are heavy enough to require wheeling to be
displaced; making casual movements or urgent transportation of patients from one location to
another very difficult [24], thus resulting in patients being mostly confined to their beds while in
a hospital. Moreover, besides limiting the freedom of mobility of the subjects, the wires (used to
connect electrodes and the recorder) often constitute a source of noise to the acquisition system.
4
And, although such stationary conditions might be acceptable in the case of a bed-ridden patient,
it cannot be used for astronauts who are required to constantly move by their activities during
space flights. The alternative commercially available biomonitoring devices which can be used
under severe non-stationary conditions such as athletic scientific studies are very limited and
prove to be costly. These devices are also usually uncomfortable due to their heavy weight,
vigorous structure and network of lead cables running from subject to monitor.
The goal of our project is to design and fabricate a wireless biomonitor to help eliminate the
restrictions caused by lead wires in conventional systems used in hospitals or by NASA by
permitting the acquisition and wireless transmission of a signal from sensor to recorder. In
hospitals, our device would readily be adaptable to any system used to monitor physiological
parameters, notably bedside ECG monitors, wireless capable computers and portable ECG
monitors, thus allowing a patient’s vital signs to be kept track of at all times despite his/her
proximity to a bedside monitor. This device will also be designed to be used by NASA as an
adaptor for their physiological monitoring systems that make use of telemetry to acquire
biopotentials. This allows the continuous monitoring of the patient’s vital signs despite his/her
proximity to a bedside monitor.
Together with its wireless capabilities, this biomonitor system will have to meet several design
specifications including NASA’s technical standards for portable bioinstrumentation to ensure
safety and functionality. Hence, this device will be battery powered, double insulated and
isolated from the ground to keep it from constituting an electrical hazard to the astronaut or the
spacecraft. The device susceptibility to electromagnetic interference will be minimized to
produce more accurate signals. Audio and visual alarms will be also be implemented into the
device (recorder/receiver unit) in order to warn the user when a measured parameter reaches a
critical level. Furthermore the extruded plastic casing will also make this device robust enough to
be worn during physical activities such as exercise or research tasks.
This project primarily pertains to the development of a wireless monitoring system for ECG.
However, the techniques and design concepts used in the development of this system can be used
for the development of a multi-parameter (ECG, EEG, EMG, oxygen saturation, etc) wireless
biomonitor system.
3
BACKGROUND
Electrocardiography is a medical diagnostic procedure used to record the electrical activity of the
heart and display it as a waveform. An electrocardiogram (ECG) is obtained by measuring
5
electrical potential between various points of the body using an instrumentation amplifier linked
to the body via leads attached to electrodes (electrical contacts). Electrodes are placed on
different sides of the heart to measure the activity of various parts of the heart muscle and the
voltage between pairs of these electrodes is what is returned as ECG in the form of a graph.
A typical ECG tracing of a normal heartbeat (or cardiac cycle) consists of a P wave, a QRS
complex and a T wave (Figure 1). The baseline voltage of the electrocardiogram is known as the
isoelectric line. Typically the isoelectric line is measured as the portion of the tracing following
the T wave and preceding the next P wave.
The waveform and the relationship between the different sections composing it can be used to
determine heart rate as well as distinguish various cardiac arrhythmias including tachycardia
(abnormally high cardiac rhythm >100 bpm, bradycardia (an abnormally slow cardiac rhythm <
60 bpm).
Figure 1- Representative Schematic of Normal ECG wavefom.
Currently, there are two different types of ECG systems that are used. The first one is the
standard ECG which generally involves twelve or fifteen leads that are connected to the patient’s
chest, arms and right legs through electrodes. The device records the ECG signal for almost
thirty seconds [2]. Possible ailments can be discovered from reading the ECG signal. However,
due to the short time for sampling, sporadic abnormalities which mostly occur in the intensive
care unit (ICU) patients may not be discovered.
6
In order to address the problem mentioned above, continuous electrocardiogram telemetry is
used by many hospitals to monitor patients in the ICU. This device has three electrodes that
acquire ECG signal for an extended period and then the signal is displayed on a screen or printed
on an ECG graph paper. The Wireless ECG Monitoring System proposed here falls in this
second category of ECG devices as it will be used to monitor the cardiac activity of subjects.
Many ECG machines, both standard and continuous, are marketed as “portable”, but are not
necessarily small and lightweight. In addition, most such appliances receive power from an
electrical outlet and are sufficiently heavy that they must be mounted on a cart and wheeled from
one location to the next. Wireless devices have the potential to significantly improve this
situation by reducing the weight and size of such devices and eliminating the need for power or
lead cables.
The purpose of this project is to design a working prototype of an ECG that acquires the
electrocardiograph from astronauts or patients and sends it wirelessly via Bluetooth to a receiver
unit such as computers and hospital monitors. This device will save time and effort for the nurses
who are constantly following the patients’ conditions and help them to operate more efficiently.
At the same time, the goal of this project is to minimize the cost of the device so hospitals can
afford one for every patient, especially the ones that are in the ICU. In the next section, previous
ECG devices are introduced, as well as their shortcomings.
3
PRIOR ART
3.1 THE LIFEGUARD CREW PHYSIOLOGICAL OBSERVATION DEVICE (CPOD)
One of the biomonitors that is used for monitoring astronauts’ health is Crew Physiological
Observation Device (CPOD) which is composed of 3 units (Fig.1). Unit 1 is “a small wearable
computer” which is the central unit. This unit analyzes the physiological signals; acquired from
unit 2 (the external sensors). Unit 2 is composed of an ECG, respiration, blood oxygenation
(SpO2) and blood pressure sensor. All physiological signals are sent wirelessly using Bluetooth
from unit1 to unit 3 (Tablet PC). Unit 3 is used to display the physiological signals and store
them. Unit 3 doesn’t only serve as a receiver, but it also calculates heart rate and breath rate
from the received signals. Another feature in unit 3 is that the received and calculated data can be
stored on a removable media [5].
Despite the device can be connected to Accutracker II [5], its blood pressure sensor has high
motion sensitivity. Because signals from the sensors are transmitted to the wearable computer via
lead wires, the latter can easily constitute an obstacle during motion or can be accidentally
disconnected at any time. Moreover, weak wire connections may cause artifacts or signal
acquisition failure.
7
Figure 2- The Lifeguard Crew Physiological Observation Device (CPOD) and components [5].
3.2 ULTRAVIEW TELEMETRY
The UltraView Telemetry unit (Fig. 2) monitors the physiological signals of heart and SpO2
through a multi-parameter patient worn transmitter. The signals are transmitted wirelessly and
displayed on any Spacelab monitor [21]. One of the advantages of this device is that it allows the
monitoring of more than one person at the same time. However, the UltraView Telemetry lacks
other crucial sensors that are vital for monitoring astronauts’ health such as EEG and EMG.
Moreover, the devices’ sensors also are connected to multi-parameter patient worn transmitter
via wires which may obstruct its users from certain motions.
Figure 3- UltraView Telemetry [22].
8
3.3 THE MYOMONITOR WIRELESS EMG SYSTEM
This is another device used to specifically monitor muscle activity using a wireless EMG sensor.
The device is composed of two units with the first one consisting of the wireless EMG sensor
module (Fig. 3), which acquires the signals from the input module connected to the EMG
electrodes via lead wires and transmits them to the second unit, the Myomonitor Datalogger.
This second unit is used for the display and storage of measured data [6]. The Myomonitor
detects EMG signals optimally at the skin surface, thus reducing the introduction of noise and
artifacts in the EMG signals.
Figure 4- The Myomonitor wireless EMG module connected to the input module [7].
3.4 CRYSTAL MONITOR 20-B
This device is designed primarily to monitor patients for any sleep disorder breathing (SDB).
The patient unit is a small hand-held device worn or carried by the patient (Fig.4). This unit
contains channels for up to ten sensing modules: EKG, EEG, chin and leg EMG, pulse
Oxymeter, airflow, snore, thoracic and abdominal effort, and body position sensors. It transmits
the data wirelessly to a receiver that displays and stores the data on a PC (Schmidt).
The patient unit does not have any external antenna, which decreases its size. An SD memory
card is used to store patient’s data. It functions as a mediator between the receiver and the
sensors, which adds more weight, devices and wires to the subject.
9
Figure 5- Patient unit and the wireless receiver connected to a PC [6].
.
3.4 AMBULATORY DATA ACQUISITION SYSTEM
The Ambulatory Data Acquisition System (ADAS) is composed of the recorder base (Fig.5) and
the signal input module. The recorder base acquires signals from twelve sensors through the
signal input module. These twelve sensors are EKG, EEG, EMG, EOG, EGG, body position,
limb position, heart rate, blood pressure, skin temperature, respiration and skin conductance
level. After the sensors pick physiological signals, they are processed, displayed, saved and
transmitted to a HRF portable computer (PC), which allow the users to setup the recorder base
and view the signals [8].
The ADAS has a 32 bit processor. It has the ability to record signals with very small amplitudes
(0-125 mV) and differentiated analog signals from -62.5mV to 62.5 mV (Delsys Inc., 2004). In
order to have a continuous monitoring of the astronaut’s health, the astronaut has to wear the
base recorder the whole time that weights approximately 1 Kg (Delsys Inc., 2004). Also, the base
recorder will be connected to the electrodes via wires that may reduce the astronaut’s freedom of
motion.
10
Figure 6- The base recorder of ADAS [2].
3.5 BIOMEDICAL WIRELESS AND AMBULATORY TELEMETRY FOR CREW HEALTH
Zin Medical’s Biomedical Wireless and Ambulatory telemetry for Crew Health (BioWatch) is a
light weight (155 to 190g depending on number of channels in use) device used to monitor the
health status of a subject. It can measure EKG, EMG, EEG, EOG, blood pressure, blood glucose,
heart rate, joint angle, oxygen level in blood, temperature and acceleration. Data acquired by
BioWatch is transmitted wirelessly to a PC [9]. The BioWatch also uses lead wires to connect
electrodes thus the device has to be worn by the subject at all times during physiological
monitoring.
Figure 7- Components of the Biomedical Wireless and Ambulatory Telemetry for Crew
Health [2]
3.6 LIFESYNC WIRELESS ECG SYSTEM
The LifeSync Wireless ECG System is an innovative method for monitoring a patients ECG
without the attachment of any data cable between the electrodes and the monitor. This device
(Fig.9) is composed of a patient transceiver, which acquires the biopotential via leads attached to
3 or 12 electrodes placed on the subject’s skin. This unit is usually worn on the arm. Once, the
11
signals are acquired, they are amplified and wirelessly transmitted using a Bluetooth module
embedded in this first nit to a secondary unit, the monitor transceiver. The monitor transceiver is
connected via input cables to a conventional monitor which then processes the signal as usual:
numerical display of heart rate, graphical display of waveform, etc [12].
The two units together make up for a small very low weight system (i.e. patient transceiver has
dimensions of 8 x 12.5 x 3 cm and weight of 240 g) that allows its users more freedom of
movement without jeopardizing continuity of ECG monitoring. It also, eliminates the need for
detaching and reattaching lead wires when a patient needs to be transported [11]. The absence of
heavy obstructing cables also reduces the amount of noise that interferes with the signal
displayed on the monitor as a waveform.
Figure 8- The patient transceiver (sensor unit) and monitor transceiver (receiver unit) of the
LifeSync Wireless ECG System [11].
3.7 HOSPITAL BEDSIDE MONITORS
In addition to these biomonitors used for acquisition and processing of several different
physiological parameters, there exist a variety of other monitors most often used in hospitals to
monitor the health status of patients. One of the distinct features of these monitors is their usually
bulky sizes, making them bedside appliances rather than portable ones as they are sometimes
marketed to be. These monitors offer a range of different options for parameters measured and
their specifications. Table 1 below presents a sample of bedside monitors used to measure
different physiological parameters. The specifications must be thoroughly considered and
constitute one of the basis for the minimum required specifications for the system proposed here.
12
Measured Parameter
(s)
Display
Type
Display Size
Frequency
Response
Range
AT-33 Single Channel
EMG
EMG
Numerical
LED, Light
Bar
0.5 inch high
25 – 425 Hz
LifePAK 10
ECG, Heart Rate,
Temperature and BP
Numerical &
Graphical
7.25 x 4.35 cm2
0.05 – 100 Hz
GE Marquette® Eagle
3000
ECG, Temperature,
SpO2
Graphical
Criticare® Scholar EL
Heart Rate, ECG,BP,
Impedance Respiration,
Temperature, SpO2
Active Color
LCD
121 x 91 mm
ECG
Graphical
7.6 x 5.7 cm2
0 – 150 Hz
6.4 inches high
0.5 – 40 Hz
Biomonitor Model
Schiller Cardiovit
AT101 3-Channel ECG
MiniMax 4000
ECG,BP,ETCO2,Temp, Numerical &
SpO2
Graphical
9 inches
diagonally
0.05 – 100 Hz
0.05 - 100 Hz
Table 1- Specifications of bedside monitors commonly used in hospitals.
4
SPECIFICATIONS FOR WIRELESS BIOMONITOR SYSTEM
4.1 SPECIFICATIONS FOR WIRELESS ELECTRODE MODULE (REQUIRED AND DESIRED)
The primary objective of this design project is to build a device capable of eliminating the need
for lead wires to monitor the cardiac activity of a subject using standard bedside
electrocardiographs such as General Electric’s Marquette® Eagle 3000 or portable biomonitors
such as NASA’s Ambulatory Data Acquisition System [2]. This means that the system will be
required to have specifications that can encompass such ECG monitoring systems.
13
The integrity of the signal while it is wirelessly transmitted to the receiver or relayed to an
electrocardiograph via input cables is a very important aspect of this system. It is important that a
physician or astronaut using continuous ECG monitoring be able to objectively notice variations
in a subject health status based on the trends of the waveform of the signal. Moreover, a distorted
signal can cause erroneous medical diagnostic or inaccuracy of measured values (e.g. heart rate).
For this reason, the wireless biomonitoring system must have a signal to noise ratio (SNR)
deemed acceptable for ECG signals and possibly for other types of signals. Since the voltage
amplitude of non-amplified ECG can be approximated to 5mV [12], we require that the
maximum amplitude of any noise present in the filtered signal to be 5 μV or less (gain is not
incorporated here). Hence, the required SNR for the sensor node is given as:
SNR = 20*log (Asignal/ Anoise) = 65 dB
SNR = 20*log (5000 μV / 5 μV) = 60 dB
Equation 1
In order to optimize the performance of the signal acquisition system, the desired SNR will be
set at 100 dB. This will allow our system to also accommodate the needs of other biopotentials as
far as the strength of the desired signals compared to the undesired ones.
The dimensions and weight requirements of our proposed system should demonstrate added
value on the dimensions and weight of the LifeSync Wireless ECG System. As such, our sensor
node is required to weight less than 240 g and have length, width and thickness such that the
devices dimensions are < 8 x 12.5 x 3 cm. We will strive to render this unit as small as possible
(weight of < 100 g and dimensions < 5 x 10 x 2 cm are desired goals).
Other required and desired design specifications include requirements for power supply, battery
life for continuous operation of the wireless electrode module (input unit), operating temperature,
current discharge rate, maximum allowable leakage current (As specified by NASA standards for
portable biomonitors), etc. The design requirements for these specifications are listed in Table 2.
14
Parameter
Required
Desired
Remarks
Measured Parameters
ECG
EMG, EEG
Most common biopotentials measured by
biomonitors
100 dB
The voltage amplitude of ECG signal is
approximately 5mV; the max. amplitude
of any noise present in the filtered signal
is required to be ≤5 μV (before gain).
Sensor and receiver units are not
expected to be distant (>10m) from one
another in a hospital setup. When patient
is mobile portable receiver will serve as
continuous monitoring system for
biopotentials.
Signal to noise Ratio
60 dB
Wireless
Transmission Range
10 m
100 m
Battery Life
(continuous)
≥ 8 Hrs
≥ 12 Hrs
Long battery life will reduce need to
interrupt patient monitoring
< 100 g
This unit is required to be lighter than the
Patient Transceiver unit of the LifeSync
Wireless ECG System.
< 8 x 12.5 x 3 cm
< 5 x 10 x 2 cm
This unit is required to have dimensions
less than the patient transceiver unit of
the LifeSync Wireless ECG System.
Power Supply
Battery with less
than 30V capacity
Rechargeable
Battery with less
than 5V capacity
NASA technical standards requires the
use of batteries with potential less than
30 V DC for bioinstrumentations (NASA
STD 3000, Vol I Section 6.4.3.13)
Max. Leakage
Current
0.070 mA
≤ 0.070 mA
Values as required by NASA technical
standards (NASA STD 3000, Vol. I)
-20 to 75º C
Range must include both expected room
temperature and skin temperature. Also
takes into account burn hazard (NASA
STD 3000, Vol. I))
None Specified
Depends on wireless transmission
method used (e.g. Bluetooth = 2.4 GHz)
Weight
Dimensions (antenna,
wires & electrodes
not included)
Operating
Temperature
Wireless
Transmission Freq.
< 240 g
20 to 42º C
15
Bandwidth
Length of Electrode
Wires
None Specified
<1m
< 0.20 m
Electrode wires can have different
lengths but the longest one should be
shorter than the average distance from
the left to the right forearms.
Electrode Usage
(continuous)
≥ 8 Hrs
≥ 12 Hrs
Electrode patches should be fully
functional for as long as (or more) the
power source can last.
Electrode Reusability
Not Required
Reusable
electrodes
Reusable electrodes will optimize device
cost effectiveness.
Table 2- Specifications Table for Sensor Unit.
4.1 SPECIFICATIONS FOR THE RECEIVER UNIT (REQUIRED AND DESIRED)
The basic concept of this project is to make a portable wireless device that causes the minimum
discomfort to the patient/astronaut and allows maximum mobility. The receiver unit will be
designed to be portable and considerably lighter than most of the commercial devices. In
particular, the weight of this unit is required to be less than 960 g (less than 4 times the weight of
the sensor node). It is also required to have dimensions less than 32 x 50 x 12 cm. The desired
values for weight and size of the receiver are, respectively, < 400g and 8 x 12.5 x 3 cm.
One of the principal features of the receiver unit is the flexibility it offers as a device which can
be used as a portable biomonitor system or as a wireless adapter that links a wireless sensor unit
to other physiological monitoring systems such as bedside monitors, other biomonitors, or even a
computer. If the user is stationary and is close to a monitor, the signal transmitted by the sensor
can be transferred physically to the monitor via output ports. Because they are at least three
different types of monitors (biomonitor, standard ECG monitor, PC) which can be used to
process the transmitted signal and display its waveform, the receiver should be equipped with at
least three different types of output ports. The first output port will accommodate standard
bedside monitors, thus it is required to be a BNC port or similar. A USB port is also required to
16
directly connect the receiver to a PC. Finally, in order to be attached to biomonitors with
standard 3 lead ECG systems, three round female UHF ports (positive, negative and reference)
will be used. However in the case where the user is constantly mobile or at a considerable
distance away from any bedside monitor or computer, numerical measured values (heart rate)
can be displayed on the receiver’s LCD. A graphical and numerical LCD is desired to allow
simultaneous display of waveforms and numerical data on the receiver
The receiver unit will be powered using a rechargeable battery with a voltage of < 30 V to adhere
to NASA’s technical standard for battery selection. This battery will be expected to power the
Parameter
Required
Desired
Justification
receiver for at least 8 hrs (12 hrs desired) of continuous operation.
Measured Parameters
Signal to noise Ratio
Wireless Transmission
Range
60 dB
EMG, EEG
100 dB
Not required
10 to 100 m
1xBNC output port
(or similar)
3xBNC output
ports (or similar)
Leads
3 x UHF female
port
9 x UHF female
port
Serial
USB
USB
Wireless
Not Required
Bluetooth
Numerical LCD
Graphical and
Numerical LCD
Cable
Output
Interface
Display
ECG
Most common biopotentials
measured
The voltage amplitude of ECG
signal is approximately 5mV; the
max. amplitude of any noise
present in the filtered signal is
required to be ≤5 μV (before
gain).
Bluetooth transmission is a
desired feature for PC wireless
interface
At least three different types of
interfaces are required to allow
analog transmission of output to
bedside monitor, biomonitor and
PC, simultaneously as needed.
The receiver is required to display
measured values such as heart
rate.
17
Power Supply
Rechargeable
battery with less
than 30V capacity
Rechargeable
battery with less
than 5V capacity
NASA technical standards
requires the use of batteries with
potential less than 30 V DC for
bioinstrumentations (NASA STD
3000, Vol I Section 6.4.3.13)
Battery Life
≥ 8 Hrs
≥ 12 Hrs
Long battery life to reduce need
to interrupt patient monitoring
Battery Charging Method
USB OTG
Solar Cells
Multiple options for recharging to
increase functionality
Weight of the receiver is required
to be less than four times (4x) the
weight of the sensor unit
Weight
< 960 g
< 400 g
Dimensions (Antenna &
wires not included)
< 32 x 50 x 12 cm
< 8 x 12.5 x 3 cm
Receiver is required to be less
than four times (4x) bigger than
sensor unit.
Values as required by NASA
technical standards (NASA STD
3000, Vol. I)
Max. Leakage Current
0.070 mA
0.070 mA
Wireless Transmission
Freq. Bandwidth
None Specified
2.4 GHz
Operating Temperature
20 to 42º C
- 20 to75º C
Wireless transmission from
receiver is optional
Range must include both
expected room temperature and
skin temperature.
Table 3- Specifications Table for Sensor Unit.
In addition to the aforementioned specifications, some other design considerations such as safety
issues, ergonomics and the performance under anticipated environment are also important for
both the sensor and the receiver unit. Since the main users of this device are astronauts, NASA
safety standards will serve as foundation for the safety considerations for our device. According
to these standards require a maximum leakage current of 0.070 mA in bioinstruments.
Furthermore, in order to ensure patient safety the device should be double insulated and
separated from ground. Hence, in the worst case scenario of total device failure, no electrical
18
threat will be posed to the user. In addition to this, the ECG Monitoring System should be
resistant to electromagnetic interference and produce minimum electromagnetic interference on
its own. A simple user interface will make sure that a single person can operate the system
without any help, thus adding to the device’s user friendliness and. Finally, our device should be
robust enough to withstand and perform well under harsh spatial environments.
5
PRINCIPLE OF OPERATION
In this design project, we fabricated a wireless ECG system. This device is designed to
serve both as a stand alone heart rate monitor and as a wireless adapter for the already existing
bedside or diagnostic ECG monitors and NASA biomonitors. The aim of the wireless adapter
feature is for this ECG system to eliminate the need of lead wires and cables to transmit acquired
ECG signals to biomonitors and other ECG (also EMG and EEG) monitors. This system takes
the input from the patient, convert it in digital form, filters it, convert it back to analog and the
output of this converter is inputted in a class II Bluetooth® module which, then wirelessly
transmits the data to a computer, NASA biomonitors or other wireless capable bedside ECG
monitors. The designed Wireless ECG Monitoring System incorporates the following features:
•
•
•
•
•
•
•
•
Bluetooth® transmission
On/Off switch with indicative LED
Numerical LCD (optional)
Rechargeable battery
Analog output
Digital output (RS232)
Separate switch for Bluetooth® unit
Battery life indicator
The operating principles of the device can be summarized as follows:
5.1 INPUT:
The input consists of three electrodes attached to a patient’s chest (or arms) as indicated
in figure 9. These electrodes detect electrical waves generated by the heart tissues such as the
sinoatrial node while causing the heart to pump.
5.2 ANALOG FRONT-END AMPLIFICATION
The acquired electrical waves are then differentiated and amplified using a traditional
instrumentation amplifier like the INA126p from Texas Instruments, Inc that is used here
(Figure 9, step 1). A fixed gain of approximately 5x is applied to the signal using the INA. The
19
signal will be further amplified to render it usable for heart rate detection during signal
processing as the electrical waves derived from the electrodes have a typical peak to peak
amplitude of 1mV or less.
5.3 SIGNAL PROCESSING:
The differentiated and amplified signal is conditioned using a microcontroller
(MSP430FG439 from Taxes Instruments, Inc.). The basic functions of the microcontroller are to
further amplify, digitize and filter the acquired ECG signal. The MSP430 digitizes the electrical
waves using a 12 bit microprocessor. The resulting signal is then filtered to eliminate noise and
artifacts. The microcontroller incorporates a 17 taps highpass FIR filter with a 2 Hz cutoff, a 17
taps lowpass FIR filter with a 30 Hz cutoff and bandstop FIR filter to cut out the s60 Hz AC line.
Clean signals are then used to calculate the corresponding heart rate of the patient. MSP430 is
programmed using “C” and “Assembly” programming languages to calculate the heart rate and
display it on a numeric LCD.
5.4 TRANSMISSION:
To add further value and increase applications, the designed system incorporates three
different modes of signal transmission (Figure 9, step 3). The digitally processed signal (output
of MSP430) can directly be transferred to the monitoring computer using a serial port interface
RS232 however a voltage level shift is required to do so. The digital signal is converted back to
its analog equivalent using a D/A converter to be wirelessly transmitted to a PC using a class II
Bluetooth® module. To make the system readily adoptable by the bedside hospital monitors,
traditional telemetry method is also incorporated in the design. Thus an analog line out allows to
directly transmit data from the device to the PC using a DAQ card.
Step 3: Transmission using Class II
Bluetooth® , traditional telemetry
options include serial port (RS232) and
analog line output
PCB LCD
Display
Numeric Heart Rate Display
Op‐Amps LCD Controller
Acquisition Circuit Digital Line Out (RS232) Level
Digital
Filtration
Cabl
e Bluetooth® Processor
Step 2:
Analog Output Clock
USB Controller Lithium Polymer
Digital Signal Processing using
Power (TI, Inc), amplification
MSP430
Lithium Management and
filtration
Power Indicating LED Polymer
Analog Line Out (12 bit) DAQ Step 4: Signal is further analyzed (plotted
and recorded) using MATLAB®
Step 1: Analog Signal Acquisition and Amplification
Figure 9-Block diagram highlights the major principles of operations. Step 1 includes the analog acquisition of the ECG biopotential
which is differentiated and amplified. The output of the instrumentation amplifier INA 126 is then used as an input for the
microcontroller
MSP430 which digitizes the signal using 12 bit microprocessor. The digital signal is filtered and transmitted
20 to PCs via
serial port (RS232) after a level shift. A D/A converts the filtered signal back to analog which is then wirelessly transmitted using a
class II Bluetooth® module.
5.5 OUTPUT:
The output from this system is the data transmitted to the computer, bedside monitors or
NASA biomonitors via different interfaces (Bluetooth®, RS232, analog line out). The
electrocardiograph display of the system would use a Graphical User Interface to show the name
of the patient (or patient ID) alongside his/her heart rate. It will also incorporate an alarm that
can be triggered in cases of abnormal heart rates (below 60 bpm or above 100 bpm).
5.6 USER INTERFACE:
MATLAB® is used to further analyze the acquired ECG biopotentials on a PC, by
decoding the digital signal received from Bluetooth®. Real time ECG signals can be acquired in
MATLAB® using 3 different interfaces, serial port (RS232), wireless (Bluetooth®) or DAQ card
(analog line). Every time the MATLAB® program is debugged, two .dat files are created for the
patient: one that stores the ECG data and another that stores the heart rate.
The graphical user interface (GUI) allows the users to identify patient ID and select
bandpass filters as required. GUI is also programmed to warn users if the heart rate rises above or
drops to critical levels.. The graphical user is implemented to start or stop data acquisition
without unplugging the device, the corresponding .dat files are updated accordingly while
keeping the record of previous acquisitions. Therefore, the cardiac activity of a subject can be
recalled by uploading previously recorded ECG data.
21
D/A
MSP430
(a)
Battery
LCD
Bluetooth®
Input from Electrodes
RS232
Analog Output
USB Port
Power LED
Power Switch
Bluethooth® LED
(b)
Figure 10- (a). Indicates the final prototype of the circuit, major active components include INA 126p, a
microcontroller MSP430 (Taxes Instrument Inc., ), the Bluetooth® module, numeric LCD, D/A converter, serial
port (RS232) and a 3.7V battery. (b). Indicates the final case design for the Wireless ECG system. Input includes
three electrodes (negative, positive and ground) where as the outputs include RS232 and analog line out. A USB
port allows battery recharging. The front panel also features on/off switches for the device and Bluetooth® as well
as indicative LEDs for power and Bluetooth®.
6
SYSTEM PERFORMANCE EVALUATION
Different aspects of the device must be evaluated for performance and concurrence with the
aforementioned system specifications. The most significant device performance considerations
22
are filtering, transmission, weight and dimensions, battery performance and durability, user
friendliness as well as cost effectiveness. The cost analysis of the device will be done further in
this report.
6.1 FILTERING
The most common settings for modern ECG systems for filtering are monitor mode and
diagnostic mode. For the monitor mode, the bandpass for allowed frequencies ranges from 0.5
or 1 Hz to 40 Hz (www.wikipedia.org). Filters in diagnostic mode Eg systems have a broader
bandpass to avoid filtering out vital parts of the signal that could be used to diagnose cardiac
abnormalities. Since the main purpose of our system is to simply monitor the cardiac activity of
astronauts (or hospital patients) , an even narrower bandpass of 2 to 30 Hz is used to limit the
possibility of getting artifacts in the waveforms during routine cardiac rhythm monitoring.
As mentioned above, digital FIR low-pass, high-pass amd notch filters are used to rid the ECG
of unwanted signals. The effectiveness of these filters can be readily verified through the real
time plotting and comparison of unfiltered signals (Figure 1a) measured directly from the output
of the INA and ignals outputed by the digital to analog converter of the microcontroller
following filtering (Figure 1b). The two waveforms visibly differ in amplitude as the unfiltered
signal is only amplified by the instrumentation amplifier while an extra gain of 200x is applied
to the signal by the internal opamps of the MSP430. Furthermore, we can see that the filtered
ECG signal is rid of most of the artifacts that can be seen in the other signal.
(a)
(b)
Figure 11- ECG waveforms: (a) Unfiltered ECG acquired from the acquisition circuit (INA-126); (b) Analog output
after digital filtration using MSP430.
23
The system’s digital filters have for goal to clean up the signal such that the required signal to
noise ratio 65dB for the wirelessly transmitted signal is achieved. Figure 1a is a plot of the
waveform of an ECG signal transmitted to the computer and plotted real time using
MATLAB®. We can see that even the wirelessly transmitted ECG is of good monitoring quality.
Moreover, the Power Spectral Density (PSD) of this signal, used here to analyze the frequency
content of the signal, shows that signals below 2Hz and above 30 Hz have very small
magnitudes, hence proving that these frquencies are nearly absent in the signal. In fact, as shown
in figure 2b, the maximal magnitude signals in the desired range of frequencies is 0.0003288 V
at 2 Hz frequency (marker 1 in figure 12a), whereas the maximum amplitude of signal in the
spectrum of frequencies considered noise to our system is 6.044e-09 V),occuring at 30Hz
(marker 2 in figure 12b). These maxima can be used to estimate the signal to noise ratio of our
system using equation (1).
SNR= 20*log(Asignal/Anoise)
SNR=20*log(0.0003288 V/6.044e-09 V)
SNR = 94.7 dB
This signal to noise ratio therefore satisfies our requirement of 65dB. Hence we can confidently
assert that the system satisfies its primary goal of aquiring and wirelessly transmitting clean
monitoring mode quality ECG signals.
Figure 12- (a) Waveform plot of ECG signal transmitted via Bluetooth®; (b) Power Spectral Density (PSD) of
wirelessly transmitted signals showing frequency content of those signals generated using SPTool Spectrum Viewer in
MATLAB®.
24
6.2 TRANSMISSION
As we compare ECG signals (Figure 3) wireless transmitted via Blluetooth® from two different
distances (8 m and 12 m), we can see that the effectiveness of the system in acquiring and
transmitting clean signals is not jeopardized even at a distance above 10 m. Thus, the
transmission performance of our device satisfies well our required specifications. Naturally, we
can only expect the device to effectively transmit monitoring quality signals within a reasonable
range above the treshold of 10m. By contrast, we can also see that the signal sent to the computer
via conventional telemetry (RS232 or USB port) of the latter is also well filtered. However, the
waveform displayed through telemetry contains some artifacts resulting mainly from
undersampling of the signal (Figure 13c).
(a)
(b)
(c)
Figure 13- Plots of filtered ECG signal digitally transmitted to PC via Bluetooth from (a) 8 m and (b) 12m.; (c) is
the plot of an ECG waveform transmitted to PC via digital telemetry (RS232 port).
6.3 WEIGHT AND DIMENSIONS
The Wireless ECG Monitoring System designed in this project satisfies very well our projected
size and weight requirements. In fact, our unit surpasses the dimensions of the LifeSync system
with dimensions 2.5” X 1.75 X 0.75” and a weight of 0.5 lb. This adds to the device’s user
friendliness by making it easier to carry and handle. It also, reduces the chances of injury related
to falling of device.
6.4
BATTERY
In addition to its small size, lightweight and easiness to carry, its built-in power unit lasts over
8hrs. This power unit consists of a 3.7 V lithium ion battery that is recharged with a USB cable,
hence eliminating the need for connecting the device to in-wall electrical outlets.
25
7
DEVIATIONS FROM SPECIFICATIONS
During the course of our project, we have had to deviate from the originally proposed device
specifications to improve performance in the system and also make it much easier to
manufacture. For instance, it was eventually decided that the use of a separate receiver unit was
redundant, hence our efforts were focused on minimizing the size of the device, saving more
power and adding more channels to our acquisition unit which is time and cost effective. Some
of the features planned for the receiver unit, such as a numerical LCD for heart rate display, were
then incorporated in the sensor unit.
Our modified sensor unit sends ECG data to the PC wirelessly and also incorporates the
important features of the receiver unit. For instance, the modified sensor unit can be recharged
via USB OTG and has a battery indicator. Furthermore, the sensor unit has optional numeric
LCD display to show the instantaneous heart rate of the user. Sensor unit has digital as well as
analog output. Digital data is transferred wirelessly or through RS232 port which directly
connects to the computer and the analog data can be transfer through the leads.
8
SYSTEM SET-UP
8.1 HARDWARE:
The key hardware requirements for the ECG circuit are:
-
The circuit must be capable of operating from a supply of +2.7v to +3.7V. The circuit will be
powered by a 3.7V Li-ion battery. Circuit also contains rechargeable circuit, which will allow
user to recharge the battery through mini USB port.
-
Bluetooth circuit will share power from the sensor circuit which will minimize the size of
device by avoiding having two batteries one for each parts.
-
Cardiac tissue is not capable of generating signals which are grater then 5mv in magnitude.
As a result, circuit must provide adequate amplification of signals which are in range of 5.0mv to 5.0mv.
-
Signal acquired from the electrode passes through an instrumentation amplifier (INA126p) to
amplify the signal in a factor of 5. The ECG signal at the output of INA126p is further
amplified by on of the three integrated operational amplifier in the MSP430FG439. This
operational amplifier contain 1Mohm feedback resistor in parallel with a 4.7nF capacitor
which provides a high-frequency roll-off at about 250 Hz and serves as an anti-aliasing filter.
-
Because of the large amplification factor, the output is sensitive to the variation in electrode
to skin contact resistance. This result in a variation of the dc content of the amplified
26
-
differential signal and manifests itself as a drift in the baseline of the ECG which often
causes wavy traces on EKG signal. This issue is managed by using an analog integrator
scheme designed with OA1 in MSP430FG439. The integrator integrates the dc content of the
5X amplified ECG and feeds it back to the INA126p. The feedback allows the INA126P to
maintain a constant DC level at the output, regardless of the change in skin contact
resistance.
When sensor unit is fabricated, four expansion connector should be made available, three for
electrode input and one for Rs232 output. In addition no component should extend out from
sensor units.
Computer or other monitors with Bluetooth compatibility is required to display the ECG
waveform.
8.2 SOFTWARE
Hardware of the device requires appropriate software to digitize the resulting ECG signal at
sufficiently high rate, filter and transmit it via Bluetooth to the receiver unit in our case it is
computer. Software to program microcontroller MSP430FG439 and to apply digital filtering was
written in C using IAR Embedded Workbench Kickstart® edition. All the essential source code
files are provided in the appendix.
Signal must be sampled at a rate no lesser than 512Hz. Since, the fastest deflection in the ECG is
in the 20-ms range and happens at the QRS complex. It is important to capture the entire QRS
complex for useful medical evaluation of the ECG waveform. Having a sampling frequency of
512 Hz, or sampling period of approximately 2 ms, captures at least 10 samples at the QRS
complex and ensures that the QRS complex is fully digitized. In addition, MATLAB® is
another software required to display the Bluetooth transmitted signal in the monitors. This
software is computable to read the signal from the serial port and soundcard of the computer. In
order to avoid any possible destruction caused by other wireless device around area of use, this
device should be paired with desired display monitor. Transmission of each data packet should
occur regularly and no more frequently than once every 0.5 second.
A graphical user interface (GUI) is created using this software which will allow the user to
choose desired filter for the signal and acquire the patents’ history through the patient id system.
A block diagram of the GUI is shown below in figure.
27
Figure 14- Graphical User Interface for Wireless ECG Monitoring System.
9
COST ANALYSIS AND MAINTENANCE
9.1 DESIGN AND FABRICATION COST OF PROTOTYPE
The main focus of this project was to manufacture a cost effective and portable biomonitor
which would be used on astronauts to measure their physiological parameters throughout their
perilous and long journey to outer space. The project was fully funded by the sponsors National
Aeronautics and Space Administration (NASA) and a total amount of $2000 was allocated for
the duration of the project.
Deviating from the initial objective of creating a lightweight and cost effective Biomonitor that
functioned both efficiently and accurately in comparison to the biomonitors available out in the
market, the NASA biomonitor team was successful in creating a lightweight wireless ECG unit
28
that can be used as a substitute to the popular biomonitor for approximately $1,061.11 (refer to
excel sheet), close to half of the projected price.
DEVICE
AVERAGE COSTS
1
Biomedical Wireless and Ambulatory Telemetry
$3,500
2
The LifeSync Wireless ECG system
$4,000
3
Ambulatory Data Acquisition System
$3,000
4
Crystal monitor
$1,850
5
LifeGuard (CPOD)
$1,200
6
CCNY-NASA Wireless ECG Monitor
$1,062
Table 4- Comparative Cost Table For Commonly used ECG Monitoring Systems.
Projected Average Cost
$4,500
$4,000
$3,500
Cost
$3,000
$2,500
$2,000
$1,500
$1,000
$500
$0
1
2
3
4
5
6
Device
Projected Average Cost
Figure 15- Cost of Wireless ECG Monitoring System Vs Other Currently Marketed ECG Systems.
29
9.2
BULK PRODUCTION COST ANALYSIS
Several orders were placed over the period of the project from different venders (clearly shown
in the Excel sheet). Due to the ambiguity of the project at hand, several components were
ordered multiple times and others were replaced due to defects, this is reflected in a much higher
total expenditure than anticipated. The Bluetooth evaluation kit from DIGIKEY was noted to be
the most expensive component in the device. This can be significantly reduced by replacing
Bluetooth with technologies such as ZigBee, AM-FM Transmission. Given the miniature nature
of the device and its long lasting battery capacity, the Bluetooth was utilized despite its high
price.
9.3 MAINTENANCE
Having little maintenance requirements can be seen as one of the key benefits of this device. The
device can be recharged via the mini-usb eliminating the need for any additional battery usage in
the future.
10 CONCLUSION
The Wireless ECG Monitoring System effectively acquires and wirelessly transmits
diagnostic quality ECG signals to a monitoring unit (PC, bedside monitor) even at ranges
over 10 m. Signals are digitally process with the MSP430FG439 (Texas Instruments, Inc)
without compromising their quality (Fig 3a and 3b). The device also features a numeric LCD
for heart rate and thus can be used as a stand alone heart rate monitor. For improved user
friendliness and adaptability to other applications two output ports were added: a digital port
for serial transmission, and an analog one for analog acquisition of ECG signals.
Not only is the device small (2.5” X 1.75 X 0.75”), lightweight (1.2 lbs) and easy to carry, its
built-in power unit lasts over 8hrs. This power unit consists of a 3.7V lithium ion battery that
30
is recharged with a USB cable, hence eliminating the need for connecting the device to inwall electrical outlets.
This project primarily pertained to the development of a wireless monitoring system for
ECG. However, the concepts, techniques and design approach used for the development of
our wireless ECG system will be further modified to encompass several different
biopotentials such as EMG, EEG and oxygen saturation in hemoglobin. Hence, the Wireless
ECG Monitoring System is a stepping stone for the development of a Multi-parameter
Wireless Biomonitor.
11 REFERENCES
12 AD instruments EOG. http://www.adinstruments.com/applications/research/EOG/,
(Retrieved on November 27th 2007, 10:00 pm)
13 Ambulatory Data Acquisition System (ADAS) https://hrf.jsc.nasa.gov/hardware/adas.asp
(Retrieved on November 22nd, 1:33 pm)
BioWatch. http://www.nasa.gov/centers/glenn/research/med_topic_biowatch.html
(Retrieved on December 2nd 2007, 12:22 am)
14 Carsten W., Kevin M., Usen U., ValerieB., Guillaume T.,Arnaud T., Robert R., Robert B.,
Yvonne C., Nathalie C., Stephen R., Judith S., John H., Gregory K. (2005)A Multiparameter
Wearable Physiologic Monitoring System for Space and Terrestrial Applications. Institute of
Electrical and Electronic Engineers. 9: 382-391
15 Clancy E.A., Morin E.L., Merletti R. (2002) Sampling, noise-reduction and amplitude
estimation issues in surface electromyography. Journal of Electromyography and
Kinesiology. 12: 1–16
16 Compact Wireless Biometric Real Time Processing System, ZIN MEDICAL.
CPOD. http://www.nasa.gov/images/content/57585main_lifeguard1_portal.jpg
(Retrieved on November 17th 2007, 11:02 am)
17 Crystal monitor B-2
http://www.clevemed.com/pdfs/Mobile_Sleep_Diagnostic_Devices%20Intl.pdf
31
18 Delsys Inc. (2004). Myomonitor III User Manual.
EKG Monitoring System.
http://instruct1.cit.cornell.edu/courses/ee476/FinalProjects/s2001/jl175/EE476.htm
(Retrieved on November 27th 2007, 7:30 pm)
19 Fulford-Jones, T.R.F., Wei, G.Y., Welsh, M. A portable, low-power, wireless two-lead EKG
system, Engineering in Medicine and Biology Society, 2004. Volume 1, Issue1-5, Page(s):
2141 - 2144 Vol.3
20 IMEC realizes wireless, flexible and stretchable ECG patch for comfortable cardiac
monitoring. http://www.imec.be/wwwinter/mediacenter/en/ARRM2007_ECGpatch.shtml
(Retrieved on November 11th 2007, 9:42 pm)
21 Kamen G, Caldwell GE. (1996) Physiology and interpretation of the electromyogram.
Journal of Clinical Neurophysiology. 13: 366–84.
22 LifeSync Wireless EKG System. http://www.lifesynccorp.com/products/wirelesssystem.html (Retrieved on November 30th 2007, 11:20 am)
23 Measuring the ECG signal with a mixed analog-digital application-specific IC - integrated
circuit, HP Component Monitoring System – technical.
http://findarticles.com/p/articles/mi_m0HPJ/is_n4_v42/ai_11398513/print (Retrieved on
December 2nd 2007, 6:00 pm)
24 Montgomery K., Mundt C., Thonier G., Tellier A., Udoh U., Barker V., Ricks R.,
Giovangrandi L., DaviesP., Cagle Y., Swain J., Hines J., Kovacs G. Lifeguard- A Personal
Physiological Monitor For Extreme Environments. Institute of Electrical and Electronic
Engineers. 26: 2192-2195
25 Narayanaswamy S. (2002) High Resolution EKG. Indian Pacing and Electrophysiology
Journal. 22: 51-56
26 Nauwer M., Comi G., Emerson R., Fuglsang-Frederiksen A., Guerit J., Hinrichs H., Ikeda A.,
Luccas J., Rappellsburger P. (1998) IFCN standards for digital recordings of clinical EEG.
Electroencephalography and clinical Neurophysiology. 106: 259-261.
27 NASA STD 3000, Vol. I
28 Redfern M., Hughes R., Chaffin D. (1993) High-pass filtering to remove
electrocardiographic interference from torso EMG recordings. Journal of Clinical
Biomechanics. 8: 44–8.
29 Schmidt N. R. Mobile Sleep Diagnostic Devices for Testing Around the World. Cleveland
Medical Devices, INC., Cleveland.
30 Shubhodeep R. C., Harshal B. N, Sahambi J.S. (2005) Design and Development of a Novel
EOG Biopotential Amplifier. International Journal of bioelectromagnetism. 7: 271-274
32
31 The design and improvement of eye controlled interface.
http://cs.sunysb.edu/~vislab/projects/eye/Reports/report/index.html (Retrieved on November
13th 2007, 5:33 pm)
32 Though Technology Ltd. (2003). FlexInfiniti Hardware Manual
33 UltraView Telemetry, www.spacelab.com (Retrieved on December 20th 2007, 9:45 pm)
34 Wireless Sensor Networks for Medical Care.
http://www.eecs.harvard.edu/~mdw/proj/codeblue (Retrieved on November 1st 2007, 11:45
am)
35 APPENDIX
Attachments:
-
GANTT CHART OF TIMELINE
-
TABLE OF ACTIVITIES
-
BUDGET
-
C AND ASSEMBLY CODE FILES FOR MICROCONTROLLER
-
MATLAB® CODE FILES FOR GUI AND SYSTEM SETUP
33