1
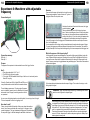
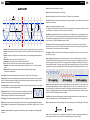
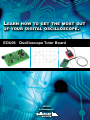
Learn
how to get the most out
of your digital oscilloscope.
EDU06 Oscilloscope Tutor Board
HEDU06
By Velleman n.v.
Getting started
The purpose of this board is to learn how to perform basic measurements with an
oscilloscope. Most experiments can be performed with any digital storage scope. Some
experiments can be performed with an analog scope.
Experiments in this project are performed using the Velleman HPS140 Handheld Pocket
Scope. All experiments require basic knowledge of terms such as AC and DC voltage, current, resistance, etc…
Make sure to check You Tube as well, it features a short movie for each experiment.
Contents
Getting started...................................................................................................................................................... 2
Oscilloscope basics............................................................................................................................................. 4
Analog versus digital:........................................................................................................................................................... 4
Waveforms:.......................................................................................................................................................................... 4
Measuring probe:................................................................................................................................................................. 5
Connecting the probe:.......................................................................................................................................................... 5
Setting up the board:............................................................................................................................................................ 5
Experiment 1: Measuring AC voltage................................................................................................................. 6
Connection layout:............................................................................................................................................................... 6
Connection summary:.......................................................................................................................................................... 6
Purpose: .............................................................................................................................................................................. 6
How?:................................................................................................................................................................................... 6
What we see:....................................................................................................................................................................... 6
Experiment 2: Adjustable AC voltage ................................................................................................................ 7
UK See the product page on our website for the latest available translated manual.
NL Download de laatst beschikbare vertaalde handleiding op de product-pagina van
onze website.
FR Consultez la fiche technique sur notre site web pour la toute dernière version de
la traduction du mode d'emploi.
D
Eine aktuelle Version der deutschen Bedienungsanleitung finden Sie auf der
Produktseite unserer Website
ES Para descargarse el manual del usuario en español más recientes, consulte la
página del producto en nuestra web.
WARRANTY :
This product is guaranteed against defects in components and construction from the moment it is purchased and for a period of TWO YEAR starting from the date of
sale. This guarantee is only valid if the unit is submitted together with the original purchase invoice. VELLEMAN Ltd limits its responsibility to the reparation of defects
or, as VELLEMAN components Ltd deems necessary, to the replacement or reparation of defective components. Costs and risks connected to the transport, removal or
placement of the product, or any other costs directly or indirectly connected to the repair, will not be reimbursed by VELLEMAN components Ltd. VELLEMAN components Ltd will not be held responsible for any damages caused by the malfunctioning of a unit.
GARANTIE:
Ce produit est garanti contre les défauts des composantes et de fabrication au moment de l’achat, et ce pour une période de deux ans à partir de la date d’achat. Cette
garantie est uniquement valable si le produit est accompagné de la preuve d’achat originale. Les obligations de VELLEMAN S.A. se limitent à la réparation des défauts
ou, sur seule décision de VELLEMAN S.A., au remplacement ou à la réparation des pièces défectueuses. Les frais et les risques de transport, l’enlèvement et le renvoi
du produit, ainsi que tous autres frais liés directement ou indirectement à la réparation, ne sont pas pris en charge par VELLEMAN S.A. VELLEMAN S.A. n’est pas
responsable des dégâts, quels qu’ils soient, provoqués par le mauvais fonctionnement d’un produit.
WAARBORG:
Dit produkt is gewaarborgd wat betreft gebreken in materialen en vakmanschap op het ogenblik van de aankoop en dit gedurende een periode van TWEE JAAR vanaf
de aankoop. De waarborg geldt enkel indien het produkt voorgelegd wordt samen met het origineel aankoop bewijs. De verplichtingen van VELLEMAN N.V. beperken
zich tot het herstellen van defecten of, naar vrije keuze van VELLEMAN N.V., tot het vervangen of herstellen van defecte onderdelen. Kosten en risico’s van transport;
het wegnemen en terugplaatsen van het produkt, evenals om het even welke andere kosten die rechtstreeks of onrechtstreeks verband houden met de herstelling,
worden niet door VELLEMAN N.V. vergoed. VELLEMAN N.V. is niet verantwoordelijk voor schade van gelijk welke aard, veroorzaakt door het falen van een product.
GARANTIE:
Dieses Produkt trägt eine Garantie für fehlerhaftes Material oder Verarbeitungsschäden im Moment des Ankaufs. Sie ist ZWEI JAHRE gültig ab Ankaufsdatum. Die
Garantie kann nur beansprucht werden, wenn das Produtk mit der Originalrechnung abgegeben wird. Die Verpflichtungen der VELLEMAN AG beschränken sich auf die
Aufhebung der Fehler, oder, nach freier Wahl der VELLEMAN AG, auf den Austausch oder die Reparation der fehlerhaften Teile. Kosten und Risiken des Transports;
das Entfernen und Wiedereinsetzen des Produkts, sowie alle anderen Kosten die direkt oder indirekt mit der Reparation in Verbindung gebracht werden können, werden
durch die VELLEMAN AG nicht zurückerstattet. VELLEMAN AG ist nicht für Schäden gleich welcher Art, entstanden aus der fehlerhaften Funktion des Produkt, haftbar.
GARANTÍA:
El producto está garantizado durante un período limitado de DOS AÑO a partir de la fecha original de compra. La garantía sólo tendrá validez cuando se presente el
producto con la factura de compra original. VELLEMAN S.A. se limitará a reparar defectos pero es libre de reparar o reemplazar partes defectuosas. VELLEMAN S.A.
no reembolsará los gastos de transporte o riesgos, ni los gastos para trasladar y reinstalar el producto así como todo otro gasto directamente o indirectamente relacionado con la reparación. VELLEMAN S.A. no asumirá ninguna responsabilidad por daños de cualquier naturaleza causados por un producto defectuoso.
Connection layout:............................................................................................................................................................... 7
Connection summary:.......................................................................................................................................................... 7
Purpose: .............................................................................................................................................................................. 7
How?:................................................................................................................................................................................... 7
Experiment 3: Measuring AC grid frequency and period ................................................................................ 9
Connection layout:............................................................................................................................................................... 9
Connection summary:.......................................................................................................................................................... 9
Purpose: .............................................................................................................................................................................. 9
How?:................................................................................................................................................................................... 9
Experiment 4: Rectified AC, single phase ......................................................................................................... 11
Connection layout:............................................................................................................................................................... 11
Connection summary:.......................................................................................................................................................... 11
Purpose: .............................................................................................................................................................................. 11
How?:................................................................................................................................................................................... 11
A little theory: .................................................................................................................................................. 11
Experiment 5: Rectified AC, dual phase ........................................................................................................... 12
Connection layout:............................................................................................................................................................... 12
Connection summary:.......................................................................................................................................................... 12
Purpose: .............................................................................................................................................................................. 12
How?:................................................................................................................................................................................... 12
A little theory: ....................................................................................................................................................................... 13
Exercise: ............................................................................................................................................................................. 13
Experiment 6: Smoothed versus unsmoothed DC (ripple) ............................................................................ 14
Connection layout:............................................................................................................................................................... 14
Connection summary:.......................................................................................................................................................... 14
Purpose: .............................................................................................................................................................................. 14
A little theory: ....................................................................................................................................................................... 14
How?:................................................................................................................................................................................... 14
Experiment 7: DC measurement ........................................................................................................................ 16
Connection layout:............................................................................................................................................................... 16
Connection summary:.......................................................................................................................................................... 16
Purpose: .............................................................................................................................................................................. 16
How?:................................................................................................................................................................................... 16
Exercise:.............................................................................................................................................................................. 17
Experiment 8: Waveform with adjustable frequency ....................................................................................... 18
Connection layout:............................................................................................................................................................... 18
Connection summary:.......................................................................................................................................................... 18
Purpose: .............................................................................................................................................................................. 18
How?:................................................................................................................................................................................... 18
How does it work? .............................................................................................................................................................. 19
Exercise:.............................................................................................................................................................................. 19
What is the purpose of the ‘slope’-symbol? ....................................................................................................................... 19
Glossary................................................................................................................................................................ 20
Diagram................................................................................................................................................................. 22
4
Oscilloscope basics
Oscilloscope basics
Oscilloscope basics
Measuring probe:
While a multimeter shows an instant voltage level or an average voltage level, an oscilloscope is
capable of displaying voltage levels over a period of time. Voltage is displayed vertically (X-axis)
versus time (Y-axis).
To be able to display waveforms, we need to connect the signal to the input of the oscilloscope.
Similar to a multimeter, the oscilloscope uses a measurement lead, but here it is called a ‘probe’.
1 Probe tip: The (+) of your probe. It is
Oscilloscopes can be used to for applications such as:
•Looking at the shape of a signal.
•Measuring the amplitude and frequency of a signal.
•Measuring the time between to events.
•Looking for anomalies such as clipping, noise, distortion,
spikes, ripple, etc…
needle-shaped to ensure a good electrical
contact with your measuring point.
3
2 BNC connector: Connects to the
input of your oscilloscope.
3 Ground lead with alligator clip:
The (-) of your probe. Connect the alligator
clip to the ground or (-) of the circuit you
wish to examine.
5
4
1
2
Analog versus digital:
There are two basic types of oscilloscopes: analog and digital scopes.
Connecting the probe:
1
Digital oscilloscope
analog oscilloscope
Each type has its typical applications, advantages and disadvantages. The advantage of digital
scopes is that they are able to capture and store events for further study. They are also more user
friendly, as they require less setup in order to show a picture of your signal. For our experiments, we
will use a digital scope.
2
Waveforms:
An oscilloscope will mainly display and measure waveforms. A wave is a pattern that repeats over
time, e.g. the waves of the sea. One cycle or period of a wave is the part of the wave that repeats
itself. When shown on the screen of an oscilloscope, it is called a waveform. There are many different waveforms. A couple of them will be used in our experiments:
Setting up the board:
-11.
2.
3.
4.
5.
6.
-2-
-3-
5
-4-
-5-
-6-
Sine waves: A typical example: The AC power grid
Full-wave rectified AC: The output of a full wave diode rectifier
Half-wave rectified AC: The output of a half-wave diode rectifier
DC voltage: Yes, oscilloscopes can also measure DC
Sawtooth waveform: In this case: ripple
Square wave: The board features a simple two-transistor oscillator which produces a square wave
The board requires a 9VAC (Alternating Current) adaptor (e.g. Velleman
PS905AC (230VAC)). A DC adaptor
instead of an AC adaptor will not damage
the board, but most experiments will not work
correctly. Connect the adaptor at the left hand
side of the board and plug-in the adaptor.
Once powered, the LEDs (LD2 & LD3) should blink
alternately. The board is now ready to perform experiments.
4 Probe clip: Clips onto the probe tip
and allows you to connect the probe to
the measuring point in a permanent way,
so you have your hands free.
5 x1/x10 switch: When set to ‘x1’, the
signal is passed on to the scope without
attenuation. When set to ‘x10’, the signal
is divided by 10, so the signal that is seen
by the scope is ten times smaller than it
acuatally is. This allows you to measure
higher voltages without damaging your
scope.
6
Exp.1: measuring AC voltage
Exp.2: Adjustable AC voltage
Experiment 1: Measuring AC voltage
Connection layout:
NOTES:
Connection summary:
(advantages of the auto-setup function)
7
Experiment 2: Adjustable AC voltage
(advantages of the auto-setup function)
Connection layout:
NOTES:
Connection summary:
GND clip : 2
Probe tip : 1
GND clip : 2
Probe tip : 3
Purpose:
The purpose of this experiment is to display and measure AC voltage. In this particular case, we will
measure the AC voltage supplied to the board.
Purpose:
The purpose of this experiment is to show the advantages of the auto-setup function to measure AC
voltage.
How?:
How?:
The unit always starts up in ‘auto-setup’ mode. You can tell that
it is in auto-setup mode, because the readouts for Volts/div and
Time/div are displayed in ‘reverse video’ (white characters on
dark background). Thanks to the auto-setup mode, the unit takes care of V/div and time/div for you,
you do not have to do anything. In the lower right-hand corner, the RMS value of the supplied AC
voltage is displayed. More about auto-setup in the next experiment.
Trimmer RV1 allows us to adjust the output voltage on test
point 3 between 0V and the full input voltage. Turn RV1 fully
anti-clockwise (0V output). The trace on our oscilloscope
screen remains a flat line, as there is no input voltage.
1. Turn on the HPS140 Handheld Pocket Scope (see HPS140 manual for How-To instructions).
2. Place the probe switch “x1/x10” to ‘x1’.
What we see:
1. Turn on the HPS140 Handheld Pocket Scope (see HPS140 manual for How-To instructions).
2. Place the probe switch “x1/x10” to ‘x1’.
Next, set V/div to 50mV/div (see HPS140 manual for How-To instructions).
• Select ‘AC coupling’ (see HPS140 manual for How-To instructions)
• Set time/div to 5ms/div
• Set volts/div: to 10V/div
Note: the readout in the bottom right hand corner displays the RMS value of the measured AC voltage.
Different readouts are available (see HPS140 manual for How-To instructions).
Note: If you live in an area where the AC grid frequency is 60Hz instead of 50Hz (e.g. US), the image may
slightly vary.
Slightly turn RV1 clockwise until a sine wave is displayed on
the screen. You only need to turn it slightly before the signal
appears. If the signal goes ‘off-screen’, turn RV1 anti-clockwise until the signal is correctly displayed. In the lower right
hand corner, you can read the current RMS value of the AC
voltage measured, e.g. 100mV (0.1V)
8
Exp.2: Adjustable AC voltage
Measuring AC grid frequency and period
(advantages of the auto-setup function)
Turn RV1 a little further clockwise. The signal goes offscreen and the Vrms readout displays ?????mV, because
the unit is no longer capable of calculating the correct Vrms.
9
Experiment 3: Measuring AC grid frequency
and period
Connection layout:
NOTES:
How can we display the current signal correctly again?
Increase the V/div setting to 0.1V/div. As you will see, the signal fits the screen again.
If you turn RV1 clockwise again, the signal will go off screen again.
Changing V/div to 0.2V/div once again restores the display.
Connection summary:
GND clip : 2
Probe tip : 3
Purpose:
The purpose of this experiment is to demonstrate the use of the markers to perform on-screen
measurement of frequency and period.
How?:
1. Turn on the HPS140 Handheld Pocket Scope (see HPS140 manual for How-To instructions).
2. Place the probe switch “x1/x10” to ‘x1’.
You can continue this process until RV1 is turned fully clockwise. In that case, we will measure the
full input voltage, which we also measured in experiment 1.
Is there a better way of measuring unknown voltages?
Yes there is, by using the ‘auto-setup’-function.
Keep pressing any of the arrow keys until V/div and time/div are displayed in reverse
video. The trace immediately adjusts for optimal viewing.
Now you can adjust the voltage from 0 to max. by turning RV1. At any time, the trace
will be displayed correctly and it will not go off-screen. At the lower right-hand corner,
the current Vrms will be correctly displayed.
Press the lower right button, this will freeze the screen and
turn-on the markers. The upper right button allows us to toggle
between the different markers.
There are 4 markers, two horizontal and two vertical. The horizontal markers allow us to measure the
amplitude of a displayed signal, i.e. it measures how many volts there are between both markers. The
vertical markers allow us to measure time between the two markers. In order to measure the frequency
of a periodic signal, we can use the vertical markers and isolate one period of the signal.
Press the upper right button repeatedly, to select
vertical marker 1. Next, use the arrow keys to
position marker 1 on the sine wave as shown.
10
Measuring AC grid frequency and period
Press the upper right button again to select vertical marker 2. Use the arrow keys to position
this marker at the exact same location but further to the right of the screen.
Rectified AC, single phase
11
Experiment 4: Rectified AC, single phase
Connection layout:
NOTES:
You have now selected one period or cycle of the
displayed waveform. In the lower right corner, the unit displays
the time between the two markers. In most cases, this will be
20ms (16.66ms). The value displayed is called the period of a
waveform, i.e. the time before it repeats itself.
Now for the frequency (=the number of periods per second).
Press and hold the upper right hand button until the menu appears.
When the menu appears, release the button and press it
again a number of times, until ‘time mark’ is displayed in
reverse video. Next, press any arrow key once to change the
mode from ‘time mark’ to ‘freq mark’. Release all buttons and
wait until the unit exits the menu.
Connection summary:
GND clip : 4
Probe tip : 5
Purpose:
The purpose of this experiment is to show what single phase rectified AC looks like on a scope screen.
How?:
Look in the lower right corner. The readout now displays
frequency. In most cases this will be 50Hz (60Hz).
1. Turn on the HPS140 Handheld Pocket Scope (see HPS140 manual for How-To instructions).
2. Place the probe switch “x1/x10” to ‘x1’.
3. Make sure to flip SW1 to the correct position
Select 5ms/div and 4V/div.
The display will show a signal similar to this one:
A little theory:
With a single diode, we can convert an AC voltage to a DC voltage. As a diode only conducts the
current in one way, only one half of the waveform can pass. The other half, with inverted polarity, is
blocked. As you can see on the screen, the trace shows ‘interruptions’ where the voltage is 0. This is
the part of the AC voltage that is blocked by the diode. If you move the probe clip from test point 5 and
to test point 1, you remove the diode from the circuit and the display shows the complete waveform
again.
Good to know: The AC power grid frequency in most parts of the world is 50Hz.
The US, Japan and some parts of Central and South America have 60Hz power
Good to know: Should the rectifier diode be defective, then you will see either the
complete waveform (if the diode is shorted) or no waveform at all (if the diode is opencircuit).
12
Rectified AC, dual phase
Rectified AC, dual phase
Experiment 5: Rectified AC, dual phase
13
Now, check what happens when you flip the switch from single phase to dual phase rectification.
Connection layout:
NOTES:
Flip the switch back and forward, to clearly see the difference between both settings.
A little theory:
As you can see, the ‘interruptions’ we have noticed with single phase rectification are gone. As opposed
to single phase rectification, both halves of the sine wave are used. Instead of a single diode, we use 4
diodes to make a ‘diode bridge’
Single diode
U
U
Connection summary:
GND clip : 4
Probe tip : 5
t
t
Purpose:
The purpose of this experiment is to show what dual phase rectified AC looks like on a scope screen
and to show the difference with single phase rectified AC.
Diode bridge
U
How?:
U
1. Turn on the HPS140 Handheld Pocket Scope (see HPS140 manual for How-To instructions).
2. Place the probe switch “x1/x10” to ‘x1’.
t
t
Select 5ms/div and 4V/div.
As the switch is still set to single phase rectification , the display will show the same trace as
with experiment 4.
Exercise:
In experiment 3, we have learned how to measure the frequency of a repeating waveform.
Can you measure the period and frequency of both the single phase and dual phase rectified signal?
(Answer: 10ms/100Hz or 8.33ms/120Hz)
Now, check what happens when you flip the switch from single phase to dual phase rectification.
Flip the switch back and forward, to clearly see the difference between both settings.
14
Smoothed versus unsmoothed DC (ripple)
Smoothed versus unsmoothed DC (ripple)
Experiment 6: Smoothed versus unsmoothed
DC (ripple)
Connection layout:
NOTES:
15
Can we measure this amount of ripple?
Yes we can, a scope is the ideal tool for ripple measurement.
Flip SW1 back to single phase rectification.
Default, your scope starts up with ‘DC-coupling’ selected.
Change that to ‘AC-coupling’ (see manual for how-to instructions).
Now, the scope will only show the AC part of the signal, the DC
part will be blocked. Make sure it is still in ‘auto-setup’ mode.
Connection summary:
GND clip : 4
Probe tip : 6
Purpose:
The purpose of this experiment is to show what smoothed and unsmoothed DC looks like on a scope
screen and how a scope can help you to determine the quality of your DC supply.
A little theory:
In the previous experiments, we have used one or more diodes to convert an AC voltage into a DC voltage. The result was OK, but far from perfect.
Why? Because it was still far from the flat line one would expect when measuring a perfect DC voltage. It is clear that our rectified AC voltage needs ‘smoothing’. This can be done with an electrolytic capacitor
(see diagram of this board)
If you look at the screen below and your scope screen, you
will see a kind of ‘sawtooth’ waveform, this is the ‘ripple’ voltage that rides on top of your DC voltage. During the rising
edge the power supply charges the capacitor, during the
falling edge the capacitor supplies current to the circuit.
If more current is drawn from the supply the ripple will be higher, as the capacitor will be drained
more, so it will not be able to keep the output as steady as it would with a small load.
How can we reduce the ripple?
Try flipping SW1 for single phase to dual phase rectification
and watch the screen. Check the lower right hand corner.
It displays the rms ripple voltage.
Flip the switch back and forward. It is clear that ripple is
reduced when dual phase rectification is used.
How?:
1. Place the probe switch “x1/x10” to ‘x1’.
2. Make sure to flip SW1 to the correct position.
3. Turn on the HPS140 Handheld Pocket Scope, It will start-up in auto setup mode as always.
Watch the screen closely. You will notice that the trace is almost flat, so the capacitor is doing a
good job at smoothing our rectified AC voltage. Yet, it still wobbles a bit. If you flip the switch from single phase to dual phase rectification,
the wobbling will be reduced.
Why is this?
Basically, the capacitor acts as a temporary storage device.
It provides power to the rest of the circuit during the ‘interruption’ of the waveform (remember, single
phase rectification?). With dual phase rectification this interruption is not present, so the capacitor has
less work to do. The remaining ‘wobble’ of the waveform is called ‘ripple’. One of the key features of a
good DC supply is low ripple.
Good to know: Use 1000µF per ampère, so e.g. if you design a 2A power supply,
you need a smoothing capacitor of at least 2000µF (2200µF is the closest value that
is suited for your purpose).
16
DC measurement
DC measurement
Experiment 7: DC measurement
17
Set the DC reference:
Connection layout:
To set the DC reference, set the input coupling to GND and
wait a couple of seconds, until the DC readout in the lower right
hand corner displays ‘0.0mV’.
NOTES:
If the settings have been performed correctly, your scope will
now show a flat trace above the centre of the screen and the
readout in the bottom right hand corner will show the measured
DC voltage.
Connection summary:
GND clip : 4
Probe tip : 6
Don’t forget to switch it back to ‘DC coupling’ again.
Purpose:
The purpose of this experiment is to show that a scope is also suited to measure DC voltages.
In general, scopes are used to measure AC voltages. For DC voltages, a multimeter is fine. However, if
you don’t have a multimeter at hand, you can still perform DC measurements with a scope.
Make
sure the scope is set up correctly for
DC
measurements
How?:
Exercise:
If you move the probe clip to test point 7 or test point 8, you will notice that the scope will automatically adapt the V/div setting and the measured DC voltage will drop to 2/3 or 1/3 of the original value,
because of the resistor divider R2/R3/R6.
1. Place the probe switch “x1/x10” to ‘x1’.
2. Turn on the HPS140 Handheld Pocket Scope, it will turn on in ‘auto-set’ mode.
‘Auto setup’ will also work for DC measurements.
There are 3 important settings that need to be performed for correct DC measurement:
• DC input coupling
• DC readout
• DC reference
DC input coupling:
Input coupling needs to be set to DC (=). When set to AC, the scope will block any DC signal, so we
won’t be able to perform DC measurements. At start-up, the unit is automatically set to DC coupling.
Next, we will set the readout in the bottom right hand corner to DC.
Press and hold the upper right hand button until the menu appears.
Release the button and press it again a number of times until the
‘readout’ setting is highlighted (123 appears in the lower left hand corner).
Next, press any of the arrow keys repeatedly until Vdc is displayed.
Wait for the unit to return to scope screen.
It now displays the measured DC voltage in the lower right hand
corner.
Testpoint 7
Testpoint 8
What happens if you swap the probe tip and ground clip?
Probe tip to test point 4,
ground clip to test point 6
The trace jumps from above the centre of the screen to below
centre, and the readout shows the same value, but negative.
This is logical, as the ground clip is the ground or (-) and the
probe clip is the positive of our instrument. Test point 4 is at
ground level while test point 6 is positive, so we get a negative
readout.
18
Waveform with adjustable frequency
Waveform with adjustable frequency
Experiment 8: Waveform with adjustable
frequency
Connection layout:
NOTES:
19
Exercise:
Press and hold the upper right hand button, to enter the menu.
Release and press again a number of times until ‘Trg Level’ is
highlighted. Wait until unit quits the menu.
Now look at the bottom left hand side of the screen, the trigger
symbol is displayed.
The arrow buttons allow you to shift the trigger level up or
down. Check out what happens if you move it al the way down.
At a certain point, the waveform becomes unstable and starts
scrolling from right to left. If you look closely, this happens when
the trigger point is shifted below the bottom of the waveform.
If you shift it up again, so that the trigger point is located between the bottom and the top of the waveform, it will be stable again.
It is even possible to use the trigger setting to exactly determine the point where the scope will trigger.
Try moving the trigger gap up and down between the top and bottom of the waveform. The waveform
will shift horizontally in such a way that that the beginning of the trace corresponds with the trigger level.
Connection summary:
GND clip : 4
Probe tip : 9
Purpose:
What is the purpose of the ‘slope’-symbol?
Let’s change the slope and see what happens. Press and hold the upper right button to enter the
menu. Release the button and press it a number of times until ‘Slope’ is highlighted. Wait for the
unit to exit he menu. Now look at the bottom left hand side of the screen, the slope symbol is displayed. Press any arrow key to toggle between rising and falling slope. Take a look at the waveform
and see what happens.
The purpose of this experiment is to demonstrate the use of the ‘trigger’-function.
How?:
1. Place the probe switch “x1/x10” to ‘x1’.
2. Flip SW1 into the ‘full wave’-position.
3. Turn on the HPS140 Handheld Pocket Scope, it will turn on in ‘auto-setup’ mode.
Select DC coupling.
Set unit to 10ms/div and 2V/div. Adjust RV2 and RV3 in such
a way that the waveform looks like the the screenshot below.
The unit displays a square wave. The rising edge of the square
wave is not perfectly ‘square’, due to the limitations of this simple
two-transistor circuit. Anyway, the resulting waveform is fine for
our experiment.
As you can see, the displayed waveform is perfectly stable, it does not jump from left to right.
The circuit responsible for this is the triggering circuit.
How does it work?
Take a close look at the left hand side of the screen, where the waveform
starts. You will see a vertical line with a small ‘gap’. In this gap, a ‘slope’symbol is displayed. This ‘gap’ determines the trigger point, the place where
the scope will ‘trigger’ or will start drawing the waveform on the screen.
rising slope
falling slope
So the slope setting also determines where the scope will trigger. This can be on the rising or on the
falling slope of the signal.
Conclusion: Trigger- and slope settings allow us to get a stable signal and make it
easier for us to study parts of a complex signal.
We encourage you to further experiment with your oscilloscope. Try looking at various signals from all kinds of sources. Just make sure that you respect the maximum
input voltage of your scope (100Vp with probe set to x1). If in doubt, begin by setting
the probe to x10. We do not encourage you perform measurements on ‘live’ equipment, i.e. equipment that is connected to the power grid, without a transformer.
These circuits are unsafe. Examples of unsafe circuits are: some household appliances, old TV sets, dimmer circuits, switch mode power supplies, etc. Battery operated equipment is usually safe.
20
Glossary
Glossary
GLOSSARY
21
Noise: Undesired random addition to a signal.
Ripple: Unwanted periodic variation of a DC voltage.
Signal: Voltage applied to the input of the oscilloscope. The subject of your measurement.
3
Sine wave: Mathematical function that represents a smooth repetitive oscillation. The waveform shown at the start of
this glossary is a sine wave.
6
4
8
7
Spikes: Fast, short duration transients in a signal.
AC voltage: (AC: Alternating Current) With AC, the flow of the current periodically reverses, as opposed to DC, where
the current flows in one direction. An AC source does not have a polarity.
Bandwidth: Usually expressed in MHz. It is the frequency at which an applied sine wave will be displayed at an amplitude of around 70% of its original amplitude. More expensive scopes feature a higher bandwidth. Rule of thumb:
the bandwidth of an oscilloscope needs to be at least 5 times higher than the frequency of the signal applied to the
input of the scope. The HPS140 bandwidth goes up to 10MHz.
1. Volts/div: Determines how many volts the signal at the input must swing for the trace to move one division.
2. Time/div: Determines the time the trace needs to scan from the the left hand side to the right hand side of a
division.
3. Division: Imaginary or visible grid on the oscilloscope screen. It helps estimating signal amplitude and
period.
4. Period (T): Duration of one cycle of the AC waveform (= 1/f)
5. Frequency (f): The number cycles of the AC waveform per second
6. Trace: ‘line’ that is drawn on the screen, which represents the signal at the input
7. Amplitude: How far does the signal ‘swing’in a direction. Expressed in mV or V. For repetitive signals:
Vpeak.
8. Peak-to-peak: Difference between most positive and most negative swing of the signal.
2xVpeak for sinusoidal signals.
DC reference: DC measurement is always performed with respect to a ground level, so we need to define this
ground level. If you do not set the DC reference, the readout might not be correct. In most cases, this ground level
will be the center of the screen, however this is not mandatory.
DC voltage: (DC:Direct Current) With DC, the current flows in a single direction, it does not reverse. A DC source
has a polarity, (+) and (-).
Input coupling: The drawing shows typical oscilloscope input circuit. There are 3 possible settings: AC-coupling, DC
coupling and GND. With AC-coupling, a capacitor is put in series with the input signal. This capacitor blocks any DC component of the signal and passes only AC. With DC coupling, the capacitor is bypassed and both the AC and DC component of the signal are passed. Low frequency signals (<20Hz) should always be displayed using DC coupling. Should AC
coupling be used, the internal coupling capacitor will interfere with the signal and the displayed signal will not be correct.
AC coupling: The oscilloscope only displays the AC component of a signal, any DC level is ignored.
Analog: Analog scopes use the incoming signal to deflect an electron beam, which scans from left to right on the
screen. The electron beam leaves an image on the screen which represents the signal you’ve applied. Analog
signals are continuously variable. See also ‘Digital’.
‘Auto-setup’ mode: The oscilloscope automatically selects a setting for Volts/div and Time/div in such a way that
one or more periods of signal are displayed correctly.
Clipping: When the ‘top’ or ‘bottom’ or both extremes of a signal are cut-off (‘clipped’),
e.g. because the signal cannot swing any further due to power supply limitations. An
undesired property of amplifiers that are driven beyond their specs.
DC coupling: The oscilloscope displays both the AC and the DC component of a signal.
Digital: Digital scopes perform an analog to digital conversion on the incoming signal and handle all the calculations and displaying in the digital domain. Digital signals feature only two fixed levels, usually 0V and +5V. See also
‘Analog’.
Distortion: Undesired alteration of a signal due to external causes such as overloaded circuits, badly designed
circuits, etc…
DC coupling
AC coupling
GND coupling
Sample rate: Usually expressed in samples or megasamples/second, sometimes in MHz. It is the number of times
per second the digital oscilloscope ‘looks’ at the signal at the input. The more it ‘looks’, the better it is able to recreate a faithful image of the waveform on the screen. Theoretically the sample rate needs to be twice the max.
frequency of the applied signal, however, for best results a sample rate of 5 times the max. frequency is recommended. The HPS140 samplerate is 40Ms/s or 40MHz.
Sensitivity: Indicates the smallest change of the input signal that makes the trace move up or down on the
screen. Usually expressed in mV. The HPS140 sensitivity is 0.1mV.
Slope: It determines where the scope will trigger. This can be on the rising or on the falling slope of the signal.
rising slope
falling slope
Vrms: The rms voltage of an AC source represents the required DC voltage to generate the same amount of
heat in a resistor as the AC source would do. For sinusoidal signals, Vrms = Vpeak / sqrt(2)
1µ
R5
10K
PCSU200: USB PC Oscilloscope
and Signal Generator
Do not let its size fool you! This
Oscilloscope packs a lot of power in
a tiny box. Now you can really take a
powerful oscilloscope everywhere.
HPS50: HANDHELD
PERSONAL SCOPE
WITH USB
Powerful, compact and USB
connectivity, this sums up the
features of this oscilloscope.
The large keyboard and bright
LCD makes this unit a breeze
to use, combine this with
great specifications and you
wonder how you ever managed
without it!
A complete function generator in pocket
format! Now you can take test signals on the
move, 3 waveforms can be selected.
Set the output voltage or frequency and
select signal waveform using the on the
screen menu. A powerful sweep function is
also included.
1N4007
1N4007
PCGU1000: 2MHz USB PC FUNCTION GENERATOR
The PCGU1000 is a digital function generator which can be connected with a PC via USB.
Standard signal waves like e.g. sine, triangle and rectangle are available; other sine waves
can be easily created.
1N4007
D4
SW1
D2
HPS140: HANDHELD
POCKET SCOPE
40MS/s
HPG1: 1MHz Pocket
Function Generator
SK7
C1
100µ/25V
R6
10K
R3
10K
SK8
SK5
SK9
T1
BC547
R7
2K2
LD2
LED3RL
R2
10K
SK4
D5
SK3
1N4007
1N4007
D3
D1
1N4007
D6
Pocket size PC oscilloscope and function
generator. This small box contains a world
of measuring tools! From generating
signals to a powerful 2 channel oscilloscope and a handy bode plot function. No
need for a power supply since the unit is
powered over USB
1µ
C2
R4
10K
RV2
100K
RV3
100K
C3
LD3
LED3RL
R8
2K2
SK10
T2
BC547
Diagram
PCSGU250: USB-PC SCOPE + GENERATOR
Two channel oscilloscope, spectrum analyser, recorder, function generator and bode plotter. With
the generator, you can create your own waveforms using the integrated signal wave editor
PCSGU250
PCSU1000
LAB2: THREE IN ONE LAB UNIT
LD1
SK6
PCGU1000
The PCSU1000 digital storage oscilloscope uses the power of your PC to visualize electrical
signals. Its high sensitive display resolution, down to 0.15mV, combined with a high bandwidth
and a sampling frequency of up to 1GHz are giving this unit all the power you need.
DCJACK
SK11
SW
+
R1
10K
RV1
100K
SK2
PCSU1000: 2 CH. USB PC OSCILLOSCOPE
SK1
22
This unique unit includes a digital oscilloscope (40MS/s), a
digital function generator (1Mhz) and a simple but easy-touse power supply (up to 12VDC). The 3 units are electrically
separated for ease of measurement.
APS230: ADVANCED PERSONAL
SCOPE 240MS/s
Feature-packed 2-channel
2x30MHz oscilloscope.
Full auto-setup, numerous
readouts, several display
modes and serial interface.
Comes complete with power
adaptor, battery pack and
probes.
.
13+
The board generates a number of safe ‘real-world’ signals, which we will use to perform
measurements. Get familiarized with AC, DC and frequency measurements, sine and
square waves, power supply ripple, full and half wave rectifiers, oscillators etc…
Learn what terms such as V/div, Time/div, trigger level, auto-setup etc… mean. All experiments featured in this project are performed with the
Velleman. Most experiments can be done with any digital storage scope. Some experiments can be performed with an analog scope.
Signals
◊
◊
◊
◊
◊
◊
alternating current (AC)
adjustable AC
full- and half wave rectified AC
smoothed direct current (DC)
ripple
astable oscillator
Velleman NV • Legen Heirweg 33
B-9890 Gavere • Belgium
HEDU06’1
5 410329 449704