1
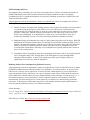
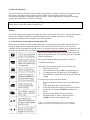
York University
Faculty of Environmental Studies
ENVS 3520 3.0
GEOGRAPHIC INFORMATION SYSTEMS IN ENVIRONMENTAL STUDIES
Lab Exercise #2 - Static GPS Surveying and Positional Error Assessment:
(Due Oct. 4th 2006 – 12.5% of Final Grade)
Problem Statement
Your task in this lab will be to assess the positional accuracy of static GPS survey points from a Garmin™
GPS 12XL receiver. Positional accuracy will be described using the following descriptive spatial statistics:
mean-centre (a centroid), coordinate range (bounding rectangle), and standard distance (SD circle). Students
will need to be familiar with these simple spatial statistics.
Deliverables
At the end of two (2) weeks, the student will produce a map displaying the feature point data collected with the
Garmin™ GPS receivers and a drawn marker indicating the target Survey point as it appears on the York
University campus aerial photo. A short report that assesses the overall positional accuracy of the data
collected and a brief explanation of the possible contributing factors to error should be included.
Background
The global positioning system is a satellite-based navigation system consisting of a network of 24 orbiting
satellites that are eleven thousand nautical miles in space and in six different orbital paths. The satellites are
constantly moving at a rate of 1.8 miles per second making two complete orbits around the Earth in less than
24 hours. The orbital paths of these satellites take them between roughly 60 degrees North and 60 degrees
South latitudes. Satellite signals can be acquired anywhere on the Earth’s surface, at any time and in all
weather conditions.
So what information does a GPS satellite transmit? The GPS signal contains a 'pseudo-random code',
ephemeris (pronounced: ee-fem-er-is) and almanac data. The pseudo-random code identifies which satellite is
transmitting—in other words, an I.D. code. Satellites are generally referred to by their PRN (pseudo-random
number), from 1 through 32, and this is the number displayed on a GPS receiver to indicate which satellite(s) is
being received.
Ephemeris data is constantly transmitted by each satellite and contains important information such as status of
the satellite (healthy or unhealthy), current date, and time. To determine your position, the GPS receiver
compares the time a signal was transmitted by a satellite with the time it was received by the GPS receiver.
The time differential allow for the calculation of distance between receiver and that particular satellite. If at
least two more distance measurements are used, a triangulated position on the Earth’s can be calculated. This is
exactly what a GPS receiver does. With a minimum of three or more satellites, a GPS receiver can determine a
coordinate position—what's called a 2D position fix. With four or more satellites, a GPS receiver can
determine a 3D position which includes an Easting (x), Northing (y), and Elevation (z). By continuously
updating position, a GPS receiver can also accurately provide speed and direction of travel (referred to as
'ground speed' and 'ground track').
GPS Positioning and Error
Everything has to be somewhere. So every object can potential have a reference of location associated to it.
Global Positioning Systems (GPS) calculate absolute positioning coordinates in either a Geographic
Coordinate System (i.e., latitude and longitude) or in projected coordinate systems like a regional Universal
Transverse Mercator (UTM).
All geographically referenced information is subject to positional error. Below is a summary list of factors
affecting GPS accuracy:
1) Satellite Geometry: In simple terms, satellite geometry refers to where the satellites are located relative
to each other (from the perspective of the GPS receiver). If a GPS receiver is locked onto four
satellites and all four of these satellites are in the sky to the north and west of the receiver, satellite
geometry is rather poor. Satellite geometry also becomes an issue when using a GPS receiver in a
vehicle, near tall buildings, or in mountainous or canyon areas. As more and more of the sky is
obstructed by buildings or terrain, it becomes increasingly difficult to determine a position.
2) Multipath: Simply put, multipath is the result of a radio signal being reflected off an object. With GPS,
multipath occurs when the signal bounces off a building or terrain before reaching the GPS receiver's
antenna. The signal takes longer to reach the receiver than if it traveled a direct path. This added time
makes the GPS receiver think the satellite is farther away than it really is, which adds error to the
overall position determination. When they occur, multipath errors typically add less than 3 meters of
error to your overall position.
3) Atmospheric Effects: Propagation delay due to atmospheric effects that result in very small positional
errors. Propagation delay is the 'slowing down' of the GPS signal as it passes through Earth's
ionosphere and troposphere. In space, radio signals travel at the speed of light, but they are
significantly slower once they enter the atmosphere.
Reducing Position Error and Improving Positional Accuracy
All geographically referenced information is subject to positional error. Expect a field GPS receiver to display
positional coordinates that are different from the “true coordinates” of a terrestrial object. A typical civilian
GPS receiver's accuracy can be improved to 2-5 meters or better. Although there are several approaches to
improving position accuracy, differential correction is common to most of them. Differential correction can
remove most of the common sources of error in GPS positioning. In this technique, a second receiver (i.e., a
base station located on a surveyed position) is used to compute corrections to the roaming or field GPS
measurements. This base station receiver is then coupled to your GPS receiver data and relays positional
corrections. In the absence of differential correction, we can manually calculate simple spatial statistics to
assess the general positional accuracy of our GPS measurements.
Further Readings:
Lo, C.P., Yeung, K.W., 2002 Concepts and Techniques of Geographic Information Systems. Prentice Hall, New
Jersey. (pp.52-54; and, 313-314)
GPS Glossary of Terms: http://www.rbf.com/cgcc/glossary.htm
ENVS3520 3.0 – Lab Assignment 2.0
2
Lab Exercise Objectives:
This exercise has been designed to allow students an opportunity to engage in field activities to generate static
point feature data, integrate point feature data into ArcGIS, assess the positional accuracy of GPS
measurements and produce cartographic output in ArcGIS. A better appreciation of coordinate referencing
systems and positional error will also be developed.
New Procedures: Using Garmin™ GPS 12XL, Waypoint Finder software, assessing positional error, simple
spatial statistics, and using ArcMap Drawing Tools.
WEEK 1
You will be working with a partner to complete this week’s portion of the lab exercise. Your lab demonstrator
will provide a Garmin™ GPS 12XL unit and demonstrate how to calibrate and operate it. Waypoint
(destination coordinates) will be assigned to you and your partner.
a) Learn the basics of operating the Garmin GPS 12XL
Before going out on the field and recording spatial data, you must become comfortable with the GPS unit by
setting the proper position format and datum and remove previous track and waypoints. The use of the
equipment will be demonstrated in the lab, however you can also refer to the summary sheet of functions, and
the on-line user manual on the web address http://celia.mehaffey.com/dale/wgarmin.html. Furthermore, you
should become familiar with the type of words and expressions
required for this lab exercise. You will find a glossary at the back
of this lab assignment.
Once outside follow the following procedure for start-up.
1. Global Erase Function
Erase all previous waypoint records, routes and track logs:
i.
ii.
iii.
iv.
Ensure the unit is OFF.
While holding down the MARK key, turn the unit ON.
A warning message will appear with YES highlighted
Press ENTER to confirm and erase all previous data and
settings.
2. Set the proper position and datum format
i.
ii.
iii.
iv.
v.
vi.
Press the Page button until you arrive at the Main Menu
page
Select Setup Menu, then select Navigation
Scroll until the Position Format is active and press Enter
Scroll to set the format to UTM/UPS and then press
Enter
Scroll to the Map Datum area and press Enter
The Map Datum we will be using for this lab is
NAD 83 (North American Datum 1983)
Figure 1.0 – keypad on the GPS unit. This is your interface to
manage menu selections and make quick operation commands.
ENVS3520 3.0 – Lab Assignment 2.0
3
b) Entering the first of two provided UTM Coordinate pair values
You and your partner will be assigned one pair values. Record the coordinates here.
Waypoint _____
E ___________________ , N __________________________
You will be entering these coordinates into the GPS unit as waypoints. You will use the Compass Screen to
find the location on campus. To enter the first of your two pair values, following these instructions:
i.
Go to the main menu and select waypoint.
ii.
Select New from the 'on page' menu located at the bottom of the screen. (Remember that you can
use the up arrow key to reach the bottom of the screen.)
iii.
Enter the new Waypoint name (e.g., A, B, C…) and the UTM values.
iv.
Select done when you are finished.
Take the GPS unit out on campus and find your Waypoint coordinates!
*** YOU MAY BE CROSSING ROADS TO FIND YOUR COORDINATES! YOU WILL BE CONCENTRATING ON
THE GPS UNIT BUT ALWAYS BE AWARE OF YOUR SUROUNDINGS! ***
c) Finding your assigned UTM coordinate Pair Values
The GPS unit provides several pages which you can access through the keypad. The first one you will come
across is the Satellite Page. It shows you how many satellites your unit is receiving and the strength of
reception. Ensure you are at least 40 meters from any large structures that may block reception satellites in
your horizon (i.e., angles of possible reception). You should have at least SIX (6) satellite signals acquired
before you begin.
Figure 2.0 – The Satellite and Compass Page on the Garmin 12 XL unit.
ENVS3520 3.0 – Lab Assignment 2.0
4
The next important page is the Compass Page. This page will be the one to use when tracking to your
waypoints. It will provide you with a bearing (from North), a directional arrow to your waypoint and an
estimate of distance. The GPS unit will alert you once you are approximately 40 metres from your survey
destination point. Keep moving until the distance to the waypoint is 0.00, or you have located the orange
marker on the ground. Once there, you are ready to capture static waypoint samples.
Find your waypoint location now.
d) Capturing Waypoints
Storing your present location is the usual way to record a waypoint. You will be capturing 30 waypoints, with
at least 20 seconds between readings. To record a waypoint:
i.
ii.
iii.
iv.
v.
Hit the MARK key, the waypoint entry form will appear.
A unique default name is assigned automatically – e.g. 001.
No unique symbols or references are required for your waypoints.
Press ENTER.
Wait for 20 seconds and repeat until you have 30 waypoint samples.
(note: the Position Page has a clock for timing your intervals).
When finished, TURN OFF the GPS unit and return to the lab to complete the final step for this week’s portion
of the exercise.
e) Download the waypoints from the GPS unit
Turn on the unit. You will now download the waypoints from the GPS unit using the Waypoint+ software.
i.
ii.
iii.
iv.
v.
vi.
vii.
viii.
ix.
x.
xi.
xii.
xiii.
Carefully connect the GPS unit to the serial port of a PC in the GIS Lab (watch the security cables!)
Turn on the GPS Unit.
Double click the Waypoint + icon (located in H:Teaching\Courses\ENVS 3520\Lab 2\Waypoint) to
run the program. Or, download the program from www.tapr.org/~kh2z/Waypoint
Ensure that the correct serial port is set by selecting GPS > Port > COMx (normally COM1 or COM2).
The items in the GPS menu will become selectable.
Set the datum to the appropriate value under /File/ Datum in the Waypoint+ software.
Set the configuration to UTM, and meters under /File /Configuration in the Waypoint+ software.
From the GPS menu in the Waypoint+ software select Download from GPS > All.
Downloading should now proceed – your GPS unit will give a message alert – press PAGE to see the
message – it should read “Transfer has been completed”
In the Waypoint+ software, select Waypoint/List waypoints/ to see what you’ve downloaded and
confirm it’s the correct data. You can also plot your waypoints for a quick visualization
From the /File/ menu select /Save/Waypoint.
Make sure that you are saving this to your network drive, and Save As/ “Comma Delimited Text File”
Exit Waypoint +.
Double check that the “Comma Delimited Text File” waypoint file has been saved in your network
folder with a .txt file extension (e.g., sorrellwp.txt). Make a note of which columns are easting and
northing.
END WEEK 1
ENVS3520 3.0 – Lab Assignment 2.0
5
Week 2 - Determine the Positional Accuracy of the GPS Sample Records
Data Sources:
Roads.shp – Desktop Mapping Technologies Inc. (DMTI) CanMap Series 2002
Ortho image – Triathlon Ltd., 1999.
f) Editing your text data files
i.
ii.
iii.
Open MS-Excel and selected File/Open from the main menu. The File type you want is *.txt .
Locate your waypoint data file from last week’s activities. Using the Text Import Wizard, open the
file into Excel. Remember it is comma delimited text file.
Now you need to edit all of the records. First, make a note of which columns contain the easting
and northing values. Remove the header (first) row that contains the GPS configuration settings as
well as any other Waypoints that are not needed. Make sure the columns are expanded and
highlight the part of the table containing data.
Save the worksheet in your student network folder using the /FILE/SAVE AS/ command as a
Dbase IV *.dbf file. Provide a copy of the file to your data collection partner.
[Individual lab work for submission].
g) Integrating and visualizing your waypoint data in ArcGIS
Copy all of the files in the ENVS3520/Lab2/ folder to your student network folder.
Double click on Lab2.mdx – this will open ArcMap.
Add the aerial photo of York campus. To add the aerial photo into your map view use the add data
toolbar button. Navigate back to the Course Lab 2 folder and into the /Ortho Folder. Select the 45621a.tif file
to add to your project. Add “Pyramids” if prompted. The Pyramids option will create a lower resolution
version of the aerial photo for faster display. For more information, use the ArcMap Help/Index and search
under “Raster” and then scroll down “pyramids.” You can also add the roads.shp file and compare it with the
aerial photo.
Import the waypoints into ArcMap using “Add Data”. If you are having problems open up Arc
) and find the *.dbf file and drag it over to ArcMap’s Table of Content (TOC). Once the table
Catalogue (
is in the TOC (make sure the Source tab is selected), right-click on it and scroll down to the Display Data
XY…. Set the X coordinates to the column that contains Easting values and the Y to the one that contains the
Northing values. You should now see the scattering of point on the map. Zoom to the cluster of sampling
points.
ENVS3520 3.0 – Lab Assignment 2.0
6
h) Assessing Positional Accuracy of the data
i.
ii.
iii.
iv.
v.
Open the attribute table of the point feature you just added to the data frame.
Right click on the Easting column and scroll down to /Statistics on the pop-up menu. This is a fast
way to get descriptive statistic for attribute information in ArcMap tables. Here the statistic required
creating a centroid, bounding rectangle, and a standard distance circle/ellipsoid are presented. Refer to
your Sept 30th, 2003 lecture notes for details on these simple spatial statistics. You will need to record
statistic from both he Easting and Northing field in the table.
Return to the map and create centroid using the point Drawing Tool located on the bottom of the
ArcMap screen. What values do you use for the centroid? Coordinates of your mouse are shown att
the bottom right in ArcMap. Adjust the properties of the circle (e.g., colours and coordinates) so that it
is appropriately presented and positioned.
Now you will create a Standard Distance OVAL around the centroid. Assuming the positional error of
your sample points are distributed normally, approximately 68% of the survey points should be
contained within the diameter of the oval/circle. Click on the OVAL shape on the Drawing Tool and
place it over the mean centroid. Double click on it and change the size. Easting and Northing values
equate to width and height when configuring the positional properties of the oval. The radius is 1
standard deviation. Adjust the line and fill properties to view the sampling points
Finally, create a Bounding Rectangle using the easting and northing ranges. Use the rectangle
Drawing Tool.
Now, visualize the results using the aerial orthophoto as the background image. Set the scale of the map to
1:1000 or a scale suitable to display the features appropriately. Activate the features and draw tool graphics
and move to the layout view. Annotate the spatial statistics on the map with all of the appropriate cartographic
elements to produce an informative map.
i) Lab Report
Your submission must address all of the items listed in the problem statement and in the description of the
deliverables. Your understanding of the problem statement, the data you worked with, and the interpretation of
the results, will account for the majority of your overall mark.
Specifically, the lab report should include:
i.
Discusses the positional accuracy assessment of the Garmin™ GPS 12XL unit. You should draw on
the values calculated in the simple spatial statistics;
ii.
Based on your experience, the pattern of dispersion of any positional error (around the absolute
reference point that was surveyed), and discuss possible factors contributing to error in your waypoint
samples;
iii.
A table with all of the raw waypoint records with the calculated spatial statistics; and,
iv.
A final map clearly displaying your sample waypoints, all graphic representation of the spatial
statistics calculated, text annotations and all cartographic elements. Other screen captures may also be
included in the report as the student deems necessary.
Please ensure your report format is consistent with the Lab Submission Guidelines distributed earlier in the
term. Marking scheme is Intro (2), Materials (2), Methods (2), Results (2), Discussion (4), Map (4), Overall
writing quality (clarity, grammar, and conciseness).
ENVS3520 3.0 – Lab Assignment 2.0
7
ENVS3520 3.0 – Lab Assignment 2.0
8