1
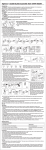
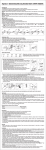
Diabetes Management Software
Software de gestión de la diabetes
V1.2
USA Service Center/Centro de Servicio: BIONIME USA CORPORATION
10865 Rancho Bernardo Rd., Ste. 100, San Diego, CA 92127
Tel: +1 888 481 8485
Fax: +1 858 481 8472
(Monday through Friday 8:00 AM to 5:00 PM PST)
(Lunes a viernes de 8:00 AM a 5:00 PM PST)
101-3GP200-01X
EN+ES(US)
Manufacturer/Fabricante: BIONIME CORPORATION
No.694, Renhua Road, Dali Dist., Taichung City 412, Taiwan
http: //www.bionime.com
E-mail: [email protected]
Made in Taiwan/ Fabricado en Taiwan
USER’S MANUAL
MANUAL DEL USUARIO
Introduction
2
PC System Requirements
3
Installation
4
Language Setting
6
8
Creating User Profiles
Connecting to PC
11
Main Features
12
Importing Data
14
Viewing Your Data
16
Data Analysis (Blood Glucose Readings)
Advanced Data Analysis
20
Printing Reports
24
Changing User Settings
25
Backup and Recovery
26
To-Do List
28
Un-installation
29
Customer Service
30
18
Introduction
PC System Requirements
The Rightest ® Diabetes Management System is designed to help its users manage, view, and analyze blood glucose
readings. It is intended for use by healthcare professionals as well as patients with diabetes.
Before installing the Rightest ® Diabetes Management Software, please make sure your system meets the following
requirements:
The software included in the Rightest ® Diabetes Management System features multiple user profiles. Each user must
create a profile to login. Once logged in, users can import data from a Rightest ® Blood Glucose Meter, view and analyze
these blood glucose readings, and print blood glucose reports directly from the PC. Additionally, users can backup and
recover profiles.
- Microsoft Windows PC
- CPU: 550 MHz Intel Pentium 3 or above
- DRAM: 512 MB or more
- HD: 600 MB or more
- OS: Windows XP (SP3 or above), Windows Vista, or Windows 7
- Internet Explorer 7.0 or above
- USB 2.0 or above
- LCD screen with resolution of 1024*768 or above, and 65536 colors or more
- CD-ROM or DVD-ROM Drive
- Mouse and Keyboard
- Printer
The Rightest ® Diabetes Management Software is designed to help you pick out patterns in your blood glucose values. It
will not provide a diagnosis or suggest treatment. Your healthcare provider may help you to find patterns and will help you
make decisions about therapy based upon your blood glucose values. You should not make decisions about therapy
without their help and approval. Changing your medicines without medical supervision may be dangerous.
Contents included in the Rightest ® Diabetes Management System Kit:
1. Installation CD - Setup files for the Rightest ® Diabetes Management Software and Rightest ® PC Link Adapter Driver
(PL2303).
2. Rightest ® Diabetes Management Software User's Manual.
3. Rightest ® PC Link Device.
4. Rightest ® PC Link Instruction.
2
3
Installation
Installation
To install the Rightest ® Diabetes Management Software, please complete the following steps.
1. Turn on your PC.
2. Insert the Rightest ® Diabetes Management Software Installation CD.
3. Double-click on ‘My Computer’.
4. Find and double-click on your CD-Drive. By default, it should be labeled (D:) drive.
5. Double click on the " Rightest ® DMS CD v1.2 ", and then double click on the " Rightest ® DMS Setup v1.2.msi ". This will
run Rightest ® Diabetes Management Software Setup Wizard (shown on page 5). Follow the prompts to complete the
installation. Once installation is complete, a shortcut named “Rightest ® Diabetes Management Software” will appear
on your desktop.
6. Apply the following steps ONLY when your PC Link Device which is a wired adapter, but NOT if the device uses Bluetooth
technology: Go back to "My Computer" - CD-Drive (D). Double click on "PL2303_Prolific_DriverInstaller_v1417.exe" setup
file. This will install the Rightest ® PC Link Adapter Driver (PL2303). Follow the prompts to complete the installation. No
shortcut will appear on your desktop for "PL2303".
7. Find the “Rightest ® Diabetes Management Software” shortcut created on your desktop, and double-click it each time
you wish to use the Rightest ® Diabetes Management Software.
NOTE
The screenshots in this User’s Manual were taken from a PC using Windows 7. Appearance may vary slightly
depending on the operating system of your PC.
4
5
Language Setting
After installation, when you launch the Rightest ® Diabetes Management Software for the first time, you will be asked to
select between two different language settings: English and Spanish. Select the language you need and click on "OK" to
finish the setting.
Language Setting
If you clicked on "OK" without selecting any language, a pop-up screen will appear that says "Please Select Language".
Click on "Yes" to return to the Language Setting.
NOTE
If you have chosen an unfamiliar language and wish to select another, please uninstall the software
(refer to "Un-installation" instructions on Page 29) and reinstall the software.
6
7
Creating User Profiles
Creating User Profiles
The Rightest ® Diabetes Management Software can be used by one or more users. To create a user profile, please
complete the following steps.
1. After double-clicking on the Rightest ® Diabetes Management Software shortcut, a welcome screen will appear.
2. Click on ”Add user”
to create your user profile. Enter your personal information, meal time schedule, and
blood glucose information.
3. User Profile Settings: Enter your last name, first name, date of birth, and sex.
4. Daily Meal Time Setting: You can choose from different daily meal time slots. Make sure to set the Meal Times based
on your normal daily eating schedule. This allows the data analysis to accurately track the blood glucose variation
between each of your meals.
Before Bfast.: BEFORE BREAKFAST
After Bfast.: AFTER BREAKFAST
MEAL TIME KEY:
Before L.: BEFORE LUNCH
After L.: AFTER LUNCH
Before Din.: BEFORE DINNER
After Din.: AFTER DINNER
5. Blood Glucose Limits and Ranges Setting:
The choice of values for hyperglycemia and hypoglycemia is personal and you may want to consult your health care
provider to help you decide. Many people with diabetes consider hyperglycemia to be values above 180 mg/dL. For
tight blood glucose control, some consider a value of 140 or even lower. Hypoglycemia is generally values less than 70,
but if you do not feel symptoms of hypoglycemia, you may want to select a higher value.
6. Click on “Next”
to finish and exit the profile setup.
7. Click on “Login”
next to your user name to login.
8
9
Creating User Profiles (continued)
NOTE
1. When entering your information, DO NOT leave any fields blank. You will not be able to proceed to the next
step if a field is blank.
2. To ensure that all of your blood glucose readings from the meter appear in their respective meal time slots, it is
extremely important that the meal schedule you entered matches your actual daily meal schedule.
3. According to the AACC (The American Association for Clinical Chemistry):
- Hyperglycemia is any value higher than 126mg/dL.
- The normal range for those without diabetes should have a blood glucose reading within 70~99 mg/dL.
4 Please discuss with a healthcare professional or physician on what values to enter for your blood glucose
ranges and limits. For more information please visit :
http://www.labtestsonline.org/understanding/analytes/glucose/test.html
Connecting to PC
To connect the Rightest ® Blood Glucose Meter to your PC, please refer to the attached " Rightest ® PC Link Instruction ".
NOTE
If your PC link device is a wired adapter, before connecting the meter to your PC, please make sure the Rightest ®
PC link adapter driver (PL2303) is installed. If not, please refer to the "instructions" (on Page 4) to install the driver.
If the device is a Bluetooth PC Link, please make sure the connection between the Bluetooth PC Link and PC is
established.
10
11
Main Features
Main Features
Once you log in, the “Home Page” (pictured below) will appear on your screen. The home page will display your 10 latest
blood glucose readings and your To-Do List (with the 5 most recent “To-Dos”). It will also display icons for all of the main
features. The following are descriptions of each main feature.
Home Page: Allows you to return to the Home
Page.
View Data: Allows you to view your blood glucose
readings.
Import Data: Uploads your blood glucose
readings from your meter.
To-Do List: Allows you to input important
reminders with date, times, and alerts.
Data Analysis (Blood Glucose Readings): Provides an extensive review of your blood glucose readings.
Advanced Data Analysis: This is an extensive review of the trend chart and distribution of your blood glucose.
Print Report: Allows you to print your blood glucose analysis report and user information.
User Settings: Allows you to change your profile information.
NOTE
: This allows you to access BIONIME’s services via the web or email.
Help: This goes directly to the online user manual.
12
13
Importing Data
Importing Data
All blood glucose readings from your meter, including the date and time of the readings, will be transferred to your PC.
During or after the data transfer, your readings cannot be altered or deleted. To import data, please complete the following
steps.
1. Click on “Import Data”
to start transferring the data.
2. While data transfer is in progress, you should see its percentage of completion.
3. Once transfer is complete (shown on page 15), a pop-up screen will appear that says “Import success. Total (# of data)” .
Click “OK” to close the pop-up screen.
4. Click on “Close”
to finish and exit.
NOTE
To import your data successfully, the symbol "PcL" needs to appear on the meter's screen BEFORE you click
"Import Data". If " PcL" is not showing up on the screen, please refer to the attached “ Rightest ® PC Link
Instruction".
14
15
Viewing Your Data
Viewing Your Data
The Rightest ® Diabetes Management Software allows you to review your blood glucose readings for the previous 90 days.
The data table and trend chart will be displayed on the Home Page.
The data table will provide measurement dates, time stamps, and meal times. You can choose from six different preset time
periods to view your data.
On the trend chart, there will be two lines that represent the hyperglycemia and hypoglycemia limits. The normal blood
glucose range lies between these two values. The limits and range can help you better understand your blood glucose
readings. To view your data, please complete the following steps.
1. Click on “View Data”
. The software will automatically display blood glucose readings from the 30-day time period.
2. You may select a different preset time period, located to the left of the data table.
1. Click on
to enlarge the trend chart. To exit zoom view, simply close the window.
2. Make sure to consult with a healthcare professional or your physician before entering the hyperglycemia and
hypoglycemia limits, as well as the normal blood glucose range.
3. On the Trend Chart:
- The gray area in between the limits indicates the normal blood glucose range.
- The purple line is the hyperglycemia value.
- The blue line is the hypoglycemia value.
If you move your mouse cursor over the Trending Line, you can see your Blood Glucose Readings.
16
17
Data Analysis (Blood Glucose Readings)
Click on the “Blood Glucose Readings”
Data Analysis
icon to view and analyze your blood glucose readings.
Instructions for Data Analysis:
1. You can choose from seven different time periods: 1 day, 7 days, 14 days , 21 days, 30 days, 60 days, or 90 days. You may
also enter a customized time period.
2. You can choose from nine different meal times: Before/After Breakfast, Before/After Lunch, Before/After Dinner,
Before/After Meal, or View All Data.
3. Your blood glucose readings will be represented by different colors:
[Red] This blood glucose reading is higher than the hyperglycemia value
[Orange] This blood glucose reading is considered to be a high outlier
[Green] This blood glucose reading is within the normal range
[Blue] This blood glucose reading is considered to be a low outlier
[Indigo] This blood glucose reading is lower than the hypoglycemia value
[White] An ERROR has occurred in the data
4. The software has five different methods to view your data with statistical analysis: View All Data, Total Analysis Data,
Average Value, Standard Deviation, and Coefficient of Variation. In the table, you can view the percentage of each blood
glucose reading.
5. When analyzing your data, you can select particular readings to view. Keep in mind that unselected readings will be
excluded from ALL calculations and reports in Data Analysis and Advanced Data Analysis.
NOTE
Data in the meter with an ERROR will be transferred to the database, but will be excluded from all
calculations and analysis.
18
19
Advanced Data Analysis
Click on the “Advanced Data Analysis” icon
“Distribution of Blood Glucose Readings”.
Advanced Data Analysis
to view the Advanced Data Analysis Report. Select either “Trend Chart” or
Instructions for Blood Glucose Trend Chart:
1. You can view data based on different time periods: 1 day, 7 days, 14 days, 21 days, 30 days, 60 days, and 90 days. You can
also input a customized time period.
2. You can view data based on different meal times: Before/After Breakfast, Before/After Lunch, Before/After Dinner,
Before/After Meal, or View All Data.
3. The trend chart can display either a regression curve or a move average line. The regression curve lets you see the longterm patterns of the selected time period. The move average line allows you to view short-term changes within the
selected time period.
NOTE
1. You can uncheck “Point Value” from your readings if you do not wish them to be displayed. If so, only the
minimum and maximum point values will be shown. When you move your mouse cursor along the trend line, it
will show the date, time, and point value of that particular reading.
2. If you only select one day to view your readings, then the regression curve and moving average line will NOT be
displayed.
3. Click on
to enlarge the trend chart. To exit zoom view, simply close the window.
4. On the trend chart:
- The gray area in between the limits indicates the normal blood glucose range.
- The purple line is the hyperglycemia value.
- The blue line is hypoglycemia value.
20
21
Advanced Data Analysis (continued)
Advanced Data Analysis (continued)
The Rightest ® Diabetes Management Software allows you to view your blood glucose readings in different formats,
including pie chart. However, the percentage of each blood glucose reading is not available in the pie chart.
Instructions for Pie Chart:
1. You can display certain blood glucose readings by selecting the different time periods: 1 day, 7 days, 14 days, 21 days,
30 days, 60 days, or 90 days. You may also input a customized time period.
2. In the pie chart, your blood glucose readings will be represented by different colors. The following is a COLOR KEY for the
values.
[Red] The blood glucose reading is higher than the hyperglycemia value.
[Orange] The blood glucose reading is considered to be a high outlier.
[Green] The blood glucose reading is within the normal range.
[Blue] The blood glucose reading is considered to be a low outlier.
[Indigo] The blood glucose reading is lower than the hypoglycemia value.
NOTE
Any errors within the data will NOT be included in the pie chart.
22
23
Printing Reports
The Rightest ® Diabetes Management Software allows you to print your blood glucose readings and reports.
Printing Steps:
1. Click on “Print Report”
to enter the printing settings.
2. Select the desired time period for the readings and reports you wish to print.
3. You can click on ‘Advanced Print’ for more options.
NOTE
1. If you wish to print the regression curve and the moving average line, use the “Advanced Print” function.
2. If you select data from one specific day, the regression curve and the moving average line in the trend chart will
NOT be available for printing.
24
Changing User Settings
After you log in, you can update or change your user profile information using the following step:
1. Click on “User Settings”
to access your user profile.
2. You can modify your personal information (except name), meal time schedules, and blood glucose limits and ranges.
3. Click on “Save and Close”
to save your settings.
NOTE
1. It is important that the meal time schedule you set up in the Rightest ® Diabetes Management Software is the
same as your daily meal schedules.
2. If any fields are left blank or entered incorrectly, the software will not allow you to continue. If you are unsure,
click “Recommended Setting”.
3. According to the AACC (The American Association for Clinical Chemistry), the suggested hyperglycemia
maximum is any reading higher than 126mg/dL, and the normal blood glucose range is any reading within
70~99 mg/dL.
4. Be sure to consult with a healthcare professional or your physician BEFORE entering in your blood glucose limits
and ranges. For more information please visit:
http://www.labtestsonline.org/understanding/analytes/glucose/test.htm
25
Backup and Recovery
Backup and Recovery
You can back up one or more user profiles at the welcome screen before you login. To backup and recover, please
complete the following steps.
Backup Steps:
1. Click on “Backup”
to backup your individual user profile, or click on “Backup All”
user profiles.
2. Select the folder you wish to save the backup in.
3. Click on “OK”
to finish backing up.
to backup all
Recovery Steps:
1. Click on “Recover”
to retrieve
your previously saved data.
2. Select the file you wish to recover.
3. Click on “Open”
to finish the
recovery.
NOTE
Once you recover data, your current profile will be replaced with the backup profile you selected.
26
27
To-Do List
Un-installation
With the Rightest ® Diabetes Management Software, you can set up reminders of upcoming events, medicine dosage or
important comments and alerts. To create a To-Do list, please complete the following steps.
1. Click on “To-Do List”
.
2. Click on “Add new To-Do”
to create a
new event.
3. Input the time, select the category of the reminder, and
enter in any notes about the event.
4. Click on “Save and Close”
to finish and save.
28
To un-install the Rightest ® Diabetes Management Software, please complete the following steps.
1. Go to the “Control Panel” and select “Uninstall a program”.
2. Find and select “Rightest ® Diabetes Management Software”.
3. Click on “Uninstall” , then confirm by clicking “Yes” to un-install the program.
NOTE
1. In each event, the maximum number of
characters in a note is 255. If you exceed this
amount, an ERROR message will pop up.
2. All reminder messages will alert you at their
appointed time.
29
Customer Service
Please be sure to read and review ALL instructions of this User’s Manual prior to using the Rightest ® Diabetes
Management System.
At BIONIME, our number one goal is to provide our customers with complete and high quality service. We will do everything
we can to provide you with satisfactory customer service.
If you have any questions or concerns, please call the BIONIME Technical Service Department at 1-(888) 481-8485, toll free.
Or, you may contact us via email at [email protected]. Alternatively, click on the internet icon at the home
page of the Rightest ® Diabetes Management Software. It will link you to the User’s Manual providing all the latest
information.
If you have any health-related questions or concerns, be sure to contact a healthcare professional or physician.
30
This page has been intentionally left blank.