1
AS300
CAPTURE
&
PC
ANALYSIS
AS300 ALARM SYSTEM
SOFTWARE MANUAL
ALARM
MONITORING
DATA LOGGING
© Doc No 1305-AS300SW-001
Leaflet No AS300 SW Manual
AS300 ALARM SYSTEM
Page 2
Table of Contents
IMPORTANT : THE LICENCE AGREEMENT SECTION 3 ON PAGE 7 MUST BE READ BEFORE INSTALLING OR USING SOFTWARE
1.0
Overview Capture Software
Page 3
1.1
Connecting a Computer to AS300
Page 3
1.2
Installing Capture Software
Page 3
1.3
Connecting to the AS300
Page 3
1.4
Main Screen
Page 3
1.5
Data Folders
Page 4
1.6
Descriptions
Page 4
1.7
Alarms
Page 4
2.0
Overview Data Analysis Software
Page 4
2.1
Installing Data Analysis Software
Page 4
2.2
Opening a Data File
Page 4
2.3
Using a Data File
Page 4
2.4
Top Screen Displayed Information
Page 4
2.5
Column Data
Page 4
2.6
Alarm Highlighted Column Data
Page 5
2.7
Filtering Data
Page 5
2.8
Displaying Graphs
Page 5
2.9
Graph Scale Break for Temperature
Page 5
2.10
X Axis Zooming
Page 5
2.11
Alarm Highlighting Graph Data
Page 6
2.12
Reporting
Page 6
2.13
Report Output Format
Page 6
2.14
Clipboard Export
Page 6
3.0
Licence Agreement
Page 7
© Doc No 1305-AS300SW-001
AS300 ALARM SYSTEM
Page 3
Section 1 ► Monitoring & Data Capture Software
1.0 Overview
• Display and logging of all the information sent from the transmitters.
• Data is updated every 15 minutes from each transmitter, increasing to every 5 minutes when in an alarm condi•
•
•
•
•
tion.
Information sent from each transmitter (If Enabled) includes the following :- transmitter number, transmitter serial
number, Tx Signal Strength, value I/P1, value I/P2, value I/P3, high alarm set-point, low alarm set-point, delay
time and time of last update.
Alarm status of input 1, input 2, input 3, AC power and low battery are displayed.
Data is recorded in a CSV and PSA file. The PSA file is encrypted and can only be decoded and read by our
analysis software. The CSV file can be read in our analysis software or excel. A set of new CSV and PSA files are
generated every day to make record archiving simple.
Standard 25 inputs can be expanded in blocks of 25 up to 100 inputs.
Input I/P1, I/P2 and I/P3 descriptions can be added by customer.
1.1 Connecting a Computer to AS300RX
Connect the supplied AS300 cable from the computer USB to the AS300. If drivers are required on your PC they can
be downloaded from our web site at http://www.asper.co.uk/Downloads.htm AS300 DRIVERS, they are also supplied on the AS300 software pen drive stick with your Capture software.
1.2 Installing Capture Software
Double click on the Install file, prompts will guide you through the installation. Once installed the program can be accessed
from the program bar under the heading Asper or screen icon.
1.3 Connecting to the AS300RX
The program is required to be run in the “administrator condition”, to do this right click the mouse and click Run as administrator. Once the program has opened click on Settings > Comm port. Click the box Automatically Find USB Dongle, if the
comm port is known this can be selected in Manually Select Comm Port. If more than 20 transmitter are on the system
please Select Disconnected Detect Time to 30 mins or greater. Once this has been done go to the Settings > Connect to
connect the AS300 to the PC. When connected the relevant Comm port will be displayed at the bottom RHS of the screen,
on the LHS of the screen Asper Device Connected will be displayed. This procedure only needs to be done on the first start
up of the Capture Software or if a different USB port is selected. With future restarts the capture software will connect automatically to the AS300
The Capture Software must be continually run to capture and store data .
If the program is not run in the Administrator Mode it may have problems with disconnections from the PC to the AS300.
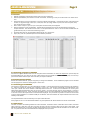
1.4 Main Screen
The data will collect the following details from each transmitter, transmitter number, transmitter serial number, transmitter
signal, value I/P1, value I/P2, value I/P3, high alarm set-point, low alarm set-point, delay time and time of last update. This
data will be collected every 15 minutes, this interval will increase to every 5 minutes when the transmitter is in an alarm condition. If a probe is broken at a transmitter PB will be displayed at the input value.
© Doc No 1305-AS300SW-001
AS300 ALARM SYSTEM
Page 4
1.5 Data Folders
The user can enter the path of two data folders where the collected data will be stored. File > Data Folders > Data Folder1 +
Data Folder 2.
1.6 Descriptions
The user can enter descriptions for I/P1, I/P2 and I/P3 for each transmitter. Most transmitters purchased only use
I/P1 and a typical description would be type of equipment or ID or location. E.g. –80 Freezer No 05.
1.7 Alarms
Alarms are indicated on the screen by the colour off the transmitter monitoring box, changing from green to red.
Items monitored are I/P1, I/P2, I/P3, AC connected and battery low.
Section 2 ► DATA ANALYSIS SOFTWARE
2.0 Data Analysis Software Overview
• CSV and encoded PSA files can be read.
• Numerical & Graph information easily displayed for any transmitter.
• Easy print facility for data required.
• Filtering of data is possible between specific dates and times.
• Statistical Information of the following is recorded : First Reading; Date and Time, Last Reading; Date and Time,
•
Number of Readings, Maximum Temperature, Minimum Temperature, Average Temperature, Time in High Alarm
and Time in Low Alarm.
The Data Capture software and Data Analysis software come as a package. Each licence allows one capture
software and up to 5 data analysis software programs.
2.1 Installing Data Analysis Software
Double click on the AS300 Alarm and Monitoring Data Analysis file, prompts will guide the installation. Once installed the program can be accessed from the program bar under the heading Asper.
2.2 Opening a Data File
To open a data file go to File > Open. The files are automatically saved in a date form e.g. 12_05_2013 is data collected on the 12th May 2013. Two files are made for each date a csv and psa. The psa file is encrypted and can only
be viewed in the analysis software.
2.3 Using a Data File
Once the required date or dates are opened for analysis, select the transmitter unit number required to be viewed.
This is done by using the mouse to move the “Transmitter Unit” column numbers up or down. Once the required
transmitter unit is selected data for this unit is displayed.
2.4 Top Screen Displayed Information
Information at the top of the screen is displayed for the selected transmitter. The information is Serial Number, Descriptions if entered into the capture screen, First Reading, Last Reading, Number of Readings, Max Temp, Min Temp
and Average Temp for I/P1 (Probe 1) and I/P2 (Probe 2)
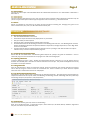
2.5 Column Data
The data in the columns gives easy access to the following :Date, Time, Temperature input 1, Temperature Input 2, Door Switch I/P3, AC Power, Battery Condition, High Alarm
Set-point, Low Alarm Set-point and Delay Time.
© Doc No 1305-AS300SW-001
Page 5
AS300 ALARM SYSTEM
2.6 Alarm Highlighting Column Data
If an alarm occurs it will be highlighted in red for a
high alarm and blue for a low alarm in the column
data.
2.7 Filtering Data
Data can be filtered by ticking the filter box and selecting a start date and time and end date and time. Once this has
been done click on the filter button.
2.8 Displaying Graphs
A graph of the current data can be displayed by clicking on the Graph Tab. To return to the column data, click on the
Data Tab.
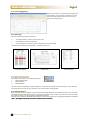
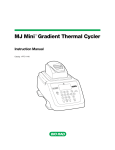
2.9 Graph Scale Break for Temperature
When the graph is displayed, if there is a relatively large difference between the High Alarm, Low Alarm and I/P1, I/P2
measurements, the I/P1 and I/P2 variations can be hard to distinguish. To make this clearer, the “Axis Scale Break”
feature collapses the gap between the highest data line and lowest data line. This allows the variations between the
data lines to become more visible.
Scale Break Off
Scale Break On
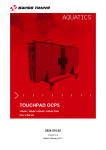
2.10 X Axis Zooming
As well as the existing “Filter” functionality of the analysis application, which allows the user to filter a subset of the
transmitter readings using a smaller time span, there is also the “Graph Zoom” function. This allows the user to zoom
into a specific X-axis range of the graph. This is achieved by clicking on the start of the range required and then drag-
Highlighted Area to be Zoomed
ging the mouse to the end of the range the zoomed data is then displayed.
© Doc No 1305-AS300SW-001
Zoomed Graph
AS300 ALARM SYSTEM
Page 6
2.11 Alarm Highlighliting
If either I/P1 (Temp1) or I/P2 (Temp2) value goes into
the high alarm, the graph line is coloured red. If the
input value goes below the low alarm set-point, the
graph line is coloured blue.
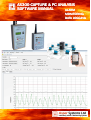
2.12 Reporting
Print out of data can be done in three ways.
•
•
•
“Transmitter Report” prints the data column view.
“Graph Report” prints the graph view.
“Summary Report” prints the “header” information for each transmitter.
To access these functions go to Reporting > Transmitter Report etc.
Transmitter Report
Graph Report
Summery Report
2.13 Report Output Format
The reports can be output in the following formats: •
Adobe Acrobat (PDF)
•
Microsoft Excel
•
Microsoft Word
This can be done by selecting the “Exporting Report” button from the top left of the report window. Then select the
report type from the “Save as type” selection in the “Export Report” dialog window.
2.14 Clipboard Export
Data in the data column and graph can be copied to the windows clipboard. In the data column the user can select
the appropriate data cells using the mouse. The user then select the “Edit / Copy” menu item from the main window.
For graphs the Graph’s image is copied to the Windows Clipboard
Once the data is copied to the Windows Clipboard, this can then be pasted into any appropriate Windows application
(Note :-:- By clicking the top left cell, all the cells in the data column are selected)
.
© Doc No 1305-AS300SW-001
AS300 ALARM SYSTEM
Page 7
Section 3 ► CAPTURE AND ANALYSIS SOFTWARE COPYRIGHT
Asper Capture and Analysis Software Copyright © 2013 by Asper Systems Ltd
All rights Reserved
This license applies to the standard-licenced version of Asper Capture and Analysis Software.
Asper System Ltd Software Licence
Your Agreement to this Licence
You should carefully read the following terms and conditions before using, installing, copying, or distributing this software. Unless you have a different license agreement signed by Asper Systems Ltd, your use, installation, copying, or
distribution of the Capture and Analysis Software indicates your acceptance of this agreement ("Licence").
If you do not agree to all of the terms and conditions of this Licence, then: (a) do not use, install, copy, or distribute
any copy of the “Licence” Software with which this Licence is included.
Scope of Licence
The terms and conditions of this Licence describe the permitted use and user's) of each Licenced Copy of Asper Capture and Analysis Software. Each licence allows the organization or user to one installation of the Capture Software
and up to five installations of the Analysis Software.
All rights of any kind in the “Licenced” software which are not expressly granted in this Licence are entirely and exclusively reserved to and by Asper Systems Ltd. This software is protected by copyright laws and other applicable laws
and treaties. You may use, install and distribute the “Licenced” software solely as expressly provided in this Licence.
You may not rent, lease, loan, sublicense, modify, translate, reverse engineer, decompile, disassemble, or create
derivative works based on, the Capture and Analysis software, nor permit anyone else to do so.
Warranty Disclaimers and Liability Limitations
Asper Capture and Analysis Software, and any and all accompanying software, files, data and materials, are distributed and provided "AS IS" and with no warranties of any kind, whether express or implied, including, without limitation, any warranty of merchantability or fitness for a particular purpose. Asper does not warrant, guarantee, or make
any representations regarding the use of, or the results of the use of, The Capture and Analyst Software. Asper Systems Ltd does not warrant that the operation of the Capture or Analysis software will be uninterrupted or errorerror-free,
or that the use of any passwords and /or encryption features will be effective in preventing the unintentional disclosure of information contained in any file. Further, there is no warranty for the optional virus scanning feature. (The
Capture and analysis software does not scan for viruses; it simply runs external programs that claim to perform this
function.) You acknowledge that good data processing procedure dictates that any program, including the Capture
and Analysis Software, must be thoroughly tested with non-critical data before there is any reliance on it. This disclaimer of warranty constitutes an essential part of this License.
Except to the extent expressly prohibited by applicable statutes, Asper Systems Ltd shall not be liable for any damage or financial loss arising out of the use of, or inability to use, the Capture and Analysis Software. Any liability of
Asper Systems Ltd will be limited exclusively to refund of the licence fee paid to Asper Systems Ltd. Except to the
extent expressly prohibited by applicable statutes, in no event shall Asper Systems Ltd, or its principals, shareholders, officers, employees, affiliates, contractors, subsidiaries, or parent organisations, be liable for any indirect, incidental, consequential, special, or punitive damages whatsoever relating to the use of the Capture or Analysis software, or to your relationship with Asper Systems Ltd, (including, without limitation, loss or disclosure of data or information, loss of profit, revenue, business opportunity or business advantage, or business interruption), whether
based upon a claim or action of contract, warranty, negligence, strict liability, contribution, indemnity, or any other
legal theory or cause of action, even if advised of the possibility of such damages.
In addition, in no event does Asper Systems Ltd authorise you or anyone else to use the Capture and Analysis Software in applications or systems where the failure to perform can reasonably be expected to result in a significant
physical injury, or in loss of property, or in loss of life. Any such use is entirely at your own risk, and you agree to hold
Asper Systems Ltd harmless from any and all claims or losses relating to such unauthorized use.
General
This Licence is the complete statement of the agreement between the parties on the subject matter, and merges and
supersedes all other or prior understandings, purchase orders, agreements, and arrangements. This Licence shall be
governed by the laws of Scotland. Exclusive jurisdiction and venue for all matters relating to this Licence shall be in
courts and for a located in Scotland, and you consent to such jurisdiction and venue. There are no third-party beneficiaries of any promises, obligations, or representations made by Asper Systems Ltd herein. Any waiver by Asper Systems Ltd of any violation of this Licence by you shall not constitute, nor contribute to, a waiver by Asper Systems Ltd
of any other or future violation by you of the same provision, or any other provision, of this Licence. If any part of this
Licence or the application thereof to any person or circumstance is for any reason held invalid or unenforceable, it
shall be deemed severable, and the validity of the remainder of this Licence, or the applications of such provision to
© Doc No 1305-AS300SW-001