1
Digital Power Meter
IM 760101-01E
4th Edition
Product Registration
Thank you for purchasing YOKOGAWA products.
YOKOGAWA provides registered users with a variety of information and
services.
Please allow us to serve you best by completing the product registration
form accessible from our homepage.
http://www.yokogawa.com/tm/
PIM 103-01E
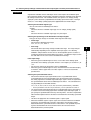
Thank you for purchasing the YOKOGAWA WT1600 Digital Power Meter.
This user’s manual contains useful information about the functions, operating
procedures, and handling precautions of the instrument. To ensure correct use, please
read this manual thoroughly before beginning operation.
After reading the manual, keep it in a convenient location for quick reference whenever a
question arises during operation.
The following two manuals, including this one, are provided as manuals for the WT1600.
Read them along with this manual.
Manual Title
Manual No.
Description
WT1600 Digital Power Meter
User’s Manual
IM 760101-01E
This manual. Explains all functions and
procedures of the WT1600 excluding
the communication functions.
WT1600 Digital Power Meter
Communication Interface
User’s Manual
IM 760101-11E
Explains the communication functions
of the GP-IB, RS-232, and Ethernet
interfaces.
Notes
• The contents of this manual are subject to change without prior notice as a result of
continuing improvements to the instrument’s performance and functions. The figures
given in this manual may differ from the actual screen.
• Every effort has been made in the preparation of this manual to ensure the accuracy
of its contents. However, should you have any questions or find any errors, please
contact your nearest YOKOGAWA dealer.
• Copying or reproducing all or any part of the contents of this manual without the
permission of Yokogawa Electric Corporation is strictly prohibited.
• The TCP/IP software of this product and the document concerning the TCP/IP
software have been developed/created by YOKOGAWA based on the BSD
Networking Software, Release 1 that has been licensed from California University.
Trademarks
• MS-DOS is either a registered trademark or trademark of Microsoft Corporation in the
United States and/or other countries.
• Adobe, Adobe Acrobat, and PostScript are registered trademarks or trademarks of
Adobe Systems Incorporated.
• Zip is either a registered trademark or trademark of Iomega Corporation in the United
States and/or other countries.
• For purposes of this manual, the TM and ® symbols do not accompany their
respective trademark names or registered trademark names.
• Other company and product names are trademarks or registered trademarks of their
respective companies.
Revisions
•
•
•
•
First edition: June 2001
Second edition: August 2001
Third edition: December 2002
Fouth edition: April 2004
4th Edition : April 2004 (YK)
All Rights Reserved, Copyright © 2001 Yokogawa Electric Corporation
IM 760101-01E
i
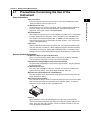
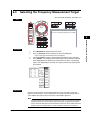
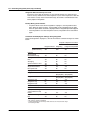
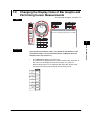
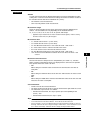
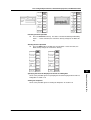
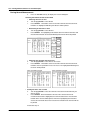
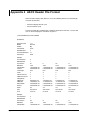
Checking the Contents of the Package
Unpack the box and check the contents before operating the instrument. If some of the
contents are not correct or missing or if there is physical damage, contact the dealer
from which you purchased them.
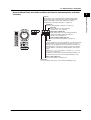
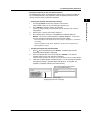
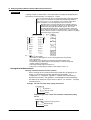
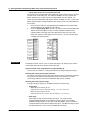
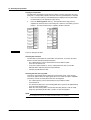
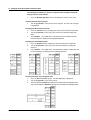
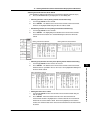
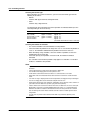
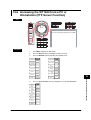
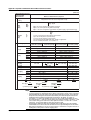
WT1600
Check that the model name and suffix code given on the name plate on the side panel
match those on the order.
MODEL
SUFFIX
MODEL
SUFFIX
NO.
NO.
Made in Japan
Made in Japan
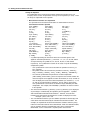
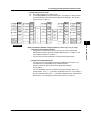
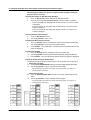
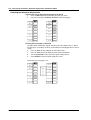
MODEL and SUFFIX Codes
Model
Suffix Code
760101
Current input terminal
Construction
Element
1
2
3
4
5
6
-01
-02
-03
-04
-05
-06
50 A
50 A
50 A
50 A
50 A
50 A
–
50 A
50 A
50 A
50 A
50 A
–
–
50 A
50 A
50 A
50 A
–
–
–
50 A
50 A
50 A
–
–
–
–
50 A
50 A
–
–
–
–
–
50 A
-10
-11
-12
-13
-14
-15
5A
5A
5A
5A
5A
5A
–
50 A
50 A
50 A
50 A
50 A
–
–
50 A
50 A
50 A
50 A
–
–
–
50 A
50 A
50 A
–
–
–
–
50 A
50 A
–
–
–
–
–
50 A
-20
-21
-22
-23
-24
5A
5A
5A
5A
5A
5A
5A
5A
5A
5A
–
50 A
50 A
50 A
50 A
–
–
50 A
50 A
50 A
–
–
–
50 A
50 A
–
–
–
–
50 A
-30
-31
-32
-33
5A
5A
5A
5A
5A
5A
5A
5A
5A
5A
5A
5A
–
50 A
50 A
50 A
–
–
50 A
50 A
–
–
–
50 A
-40
-41
-42
5A
5A
5A
5A
5A
5A
5A
5A
5A
5A
5A
5A
–
50 A
50 A
–
–
50 A
-50
-51
5A
5A
5A
5A
5A
5A
5A
5A
5A
5A
–
50 A
-60
5A
5A
5A
5A
5A
5A
Communication interface -C1
(Either one is built in.)
-C2
ii
Description
100-120 / 200-240 VAC
For details on the construction of the current input
terminal that is equipped on the instrument, see the
next section.
GP-IB Interface
Serial (RS-232) interface
IM 760101-01E
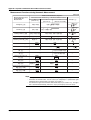
Checking the Contents of the Package
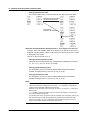
Power cord
Suffix Code
Description
-D
UL/CSA Standard power cord (Part No.: A1006WD)
[Maximum rated voltage: 125 V; Maximum rated current: 7 A]
VDE Standard Power Cord (Part No.: A1009WD)
[Maximum rated voltage: 250 V; Maximum rated current: 10 A]
BS Standard Power Cord (Part No.: A1054WD)
[Maximum rated voltage: 250 V; Maximum rated current: 10 A]
AS Standard Power Cord (Part No.: A1024WD)
[Maximum rated voltage: 240 V; Maximum rated current: 10 A]
-F
-Q
-R
Options
/B5
Built-in printer
/C7
SCSI
/C10
SCSI, Ethernet interface, and internal hard disk.
/DA
D/A output (30 channels)
/MTR
Motor evaluation function
(Either /C7 or /C10 can be added)
Example of specifications and suffix code
Ex: 5-A input terminals in elements 1 through 3, 50-A input terminals in elements 4 through 6,
GP-IB interface, UL/CSA standard power cord, built-in printer, and SCSI → 760101-33-C1-D/
B5/C7
NO. (Instrument No.)
When contacting the dealer from which you purchased the instrument, please quote
the instrument No.
IM 760101-01E
iii
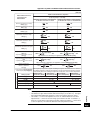
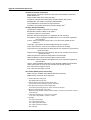
Checking the Contents of the Package
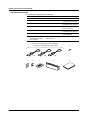
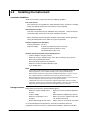
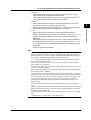
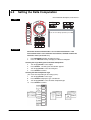
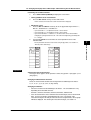
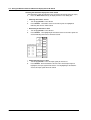
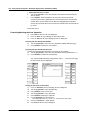
Standard Accessories
The following are supplied with the instrument.
Part Name
Part Number
1. Power cord
See the previous table. 1
Q’ty Notes
–
2. Spare power fuse
A1354EF
1
250 V, 6.3 A, time lag
(attached to the fuse holder)
3. Printer roll paper
B9316FX
2
For the built-in printer
Provided only with option /B5
4. Rubber feet
A9088ZM
2
Two pieces in one set.
Two sets provided.
5. 36-pin connector
A1005JD
1
For D/A output
Provided only with option /DA
6. Current input protective cover
B9316BX
1
With 4 attachment screws, part
number B9946GZ.
7. • User’s Manual
• Communication Interface
User’s Manual
IM760101-01E
IM760101-11E
1
1
This manual
–
1. (One of the following power cords is supplied
according to the instrument's suffix codes.)
F
3.
iv
4.
Q
5.
2.
R
6.
7.
IM 760101-01E
Checking the Contents of the Package
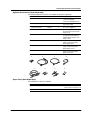
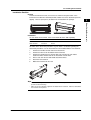
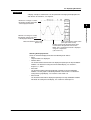
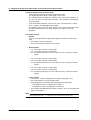
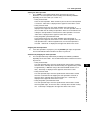
Optional Accessories (Sold Separately)
The following optional accessories are available for purchase separately.
Part Name
Part Number
Q’ty
Notes
1. Serial port adapter
366971
1
9 pin*1-25 pin*2adapter
*1 EIA-574 Standard
*2 EIA-232 Standard (RS-232)
2. BNC-alligator clip
366926
1
42 V or less, length 1 m
measurement lead
3. BNC-BNC
measurement lead
366924
366925
1
1
42 V or less, length 1 m
42 V or less, length 2 m
4. External sensor cable
B9284LK
1
For connecting the current sensor
input connector of the WT1600
Length 0.5 m
5. Measurement lead
758917
1
Two leads in one set, used with
the separately sold 758922 or
758929 adapter, length 0.75 m,
ratings 1000 V
6. Alligator clip adapter set
758922
1
Two pieces in one set, for the
758917 measurement lead.
Rated voltage 300 V
7. Alligator clip adapter set
758929
1
Two pieces in one set, for the
758917 measurement lead.
Rated voltage 1000 V
8. Fork terminal adapter set
758921
1
Two pieces in one set, for the
758917 measurement lead.
Rated current 25 A
2.
1.
5.
4.
3.
7.
6.
8.
Spare Parts (Sold Separately)
The following spare parts are available.
IM 760101-01E
Part Name
Part Number
Q’ty
Notes
1. Printer roll paper
B9316FX
10
One roll is one set, thermalsensitive paper, total length 10 m
2. Power fuse
A1354EF
2
250 V, 6.3 A, time lag
v
Safety Precautions
This instrument is an IEC safety class I instrument (provided with terminal for protective
earth grounding).
The general safety precautions described herein must be observed during all phases of
operation. If the instrument is used in a manner not specified in this manual, the
protection provided by the instrument may be impaired. Yokogawa Electric Corporation
assumes no liability for the customer’s failure to comply with these requirements.
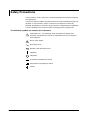
The following symbols are used on this instrument.
“Handle with care.” (To avoid injury, death of personnel or damage to the
instrument, the operator must refer to the explanation in the User’s Manual or
Service Manual.)
Electric shock, danger
Alternating current
Both direct and alternating current
ON(power)
OFF(power)
In-position of a bistable push control
Out-position of a bistable push control
Ground
vi
IM 760101-01E
Safety Precautions
Make sure to comply with the precautions below. Not complying might result in injury
or death.
WARNING
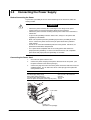
Power Supply
Ensure that the source voltage matches the voltage of the power supply before
turning ON the power.
Power Cord and Plug
To prevent the possibility of electric shock or fire, be sure to use the power cord
supplied by YOKOGAWA. The main power plug must be plugged into an outlet
with a protective earth terminal. Do not invalidate this protection by using an
extension cord without protective earth grounding.
Protective Grounding
Make sure to connect the protective earth to prevent electric shock before
turning ON the power.
Necessity of Protective Grounding
Never cut off the internal or external protective earth wire or disconnect the
wiring of the protective earth terminal. Doing so poses a potential shock hazard.
Defect of Protective Grounding
Do not operate the instrument if the protective earth or fuse might be defective.
Also, make sure to check them before operation.
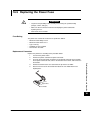
Fuse
To avoid the possibility of fire, only use a fuse that has a rating (voltage, current,
and type) that is specified by the instrument. When replacing a fuse, turn OFF
the power switch and unplug the power cord. Never short the fuse holder.
Do Not Operate in an Explosive Atmosphere
Do not operate the instrument in the presence of flammable liquids or vapors.
Operation in such environments constitutes a safety hazard.
Do Not Remove Covers
The cover should be removed by YOKOGAWA’s qualified personnel only.
Opening the cover is dangerous, because some areas inside the instrument
have high voltages.
External Connection
Securely connect the protective grounding before connecting to the item under
measurement or an external control unit.
IM 760101-01E
vii
How to Use This Manual
Structure of the Manual
This user’s manual consists of the following sections.
Chapter 1 Explanation of Functions
Describes the functions of the instrument. Operating procedures are not given in this chapter.
However, reading this chapter will help you understand the operating procedures given in the
chapters that follow.
Chapter 2 Names and Uses of Parts
Describes the names and uses of each part of the instrument.
Chapter 3 Before Starting Measurements
Describes precautions for the use of the instrument, how to install the instrument, how to
connect to the power supply, how to wire measurement circuits, how to turn ON/OFF the
power switch, and other preparations before starting measurements.
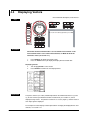
Chapter 4 Screen Display Format
Describes how to display numerical data, waveforms, bar graphs, vectors, and trends, the
mixed display, and the meaning of each displayed item.
Chapter 5 Measurement Conditions
Describes how to set the input conditions for the measured voltage/current signal and the
handling of the input signal such as the wiring system, the measurement range, the filter,
averaging, data update rate, and the crest factor.
Chapter 6 Normal Measurement and Integration
Describes how to set the displayed items of numerical data during normal measurement, how
to set the computing equation, and how to set integration.
Chapter 7 Harmonic Measurement
Describes how to set the displayed item of numerical data, the PLL source, the order of analysis,
the computing equation, the bar graph, and the vector display during harmonic measurement.
Chapter 8 Motor Evaluation (Option)
Describes how to set the instrument in order to determine the motor characteristics by
inputting signals from revolution sensors and torque meters.
Chapter 9 Waveform Display
Describes how to display the waveforms of the voltage and current signals.
Chapter 10 Trend Display
Describes how to display the trend.
Chapter 11 Storing and Recalling Data and Saving the Stored Data
Describes how to store and recall the data and how to save the stored data.
Chapter 12 Saving and Loading the Data
Describes how to save setup parameters, waveform display data, numerical data, and screen
image data and how to load the saved data to the instrument.
Chapter 13 Ethernet Communications (Option)
Describes how to mutually transfer files containing setup parameters, waveform display data, and
numerical data with PCs and workstations that are on the network using the Ethernet interface.
Chapter 14 Built-in Printer (Option)
Describes how to output numerical data and screen image to the built-in printer.
Chapter 15 D/A Output and Other Functions
Describes how to set the D/A output and other functions.
Chapter 16 Troubleshooting, Maintenance, and Inspection
Describes the possible causes of problems and their appropriate corrective measures.
Describes the messages that are displayed on the screen. Describes maintenance and
inspection issues such as how to perform self-tests and replace power fuses.
Chapter 17 Specifications
Summarizes the specifications of the instrument in tables.
Appendix
Describes how to determine the measurement function and delta computation. Gives a list of
initial settings. Describes the ASCII header file format.
Index
Alphabetic and symbol index of contents.
viii
IM 760101-01E
How to Use This Manual
Conventions Used in This Manual
Unit
k: Denotes 1000. Example: 15 kg, 100 kHz
K: Denotes 1024. Example: 640 KB (Storage capacity of floppy disks)
Displayed Characters
Bold characters used in the procedural explanations indicate characters that are
displayed on the panel keys for the respective procedure or the characters on the
screen.
SHIFT+key means you will press SHIFT to turn ON the indicator that is located above
and to the left of SHIFT followed by the operation key. The menu written below the
pressed key appears on the screen.
Symbols
The following symbols are used in this manual.
Improper handling or use can lead to injury to the user or damage
to the instrument. This symbol appears on the instrument to
indicate that the user must refer to the user’s manual for special
instructions. The same symbol appears in the corresponding place
in the user’s manual to identify those instructions. In the manual,
the symbol is used in conjunction with the word “WARNING” or
“CAUTION.”
WARNING
Describes precautions that should be observed to prevent injury or
death to the user.
CAUTION
Describes precautions that should be observed to prevent minor or
moderate injury, or damage to the instrument.
Note
Provides important information for the proper operation of the
instrument.
Symbols Used on Pages Describing Operating Procedures
On pages that describe the operating procedures in Chapter 3 through 16, the
following symbols are used to distinguish the procedures from their explanations.
Keys
Procedure
Indicates the key related to the operation.
Follow the steps indicated with numbers. The procedures are
given with the premise that the user is carrying out the steps for the
first time. Depending on the operation, not all steps need to be
taken.
Explanation
This section describes the setup parameters and the limitations
regarding the procedures. It does not give a detailed explanation of
the function. For details on the function, see chapter 1.
IM 760101-01E
ix
Contents
Checking the Contents of the Package ........................................................................................... ii
Safety Precautions .........................................................................................................................vi
How to Use This Manual .............................................................................................................. viii
Chapter 1 Explanation of Functions
1.1
1.2
1.3
1.4
1.5
1.6
1.7
1.8
1.9
System Configuration and Block Diagram ....................................................................... 1-1
Measurement Function and Measurement Period ........................................................... 1-3
Measurement Conditions ................................................................................................. 1-9
Numeric Display ............................................................................................................. 1-14
Computation ................................................................................................................... 1-18
Integration ...................................................................................................................... 1-20
Waveform Display .......................................................................................................... 1-23
Bar Graphs, Vectors, and Trend Displays ...................................................................... 1-29
Saving and Loading Data and Other Functions ............................................................. 1-32
Chapter 2 Names and Uses of Parts
2.1
2.2
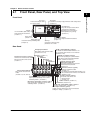
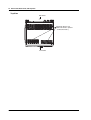
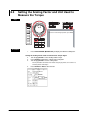
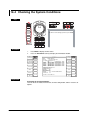
Front Panel, Rear Panel, and Top View ........................................................................... 2-1
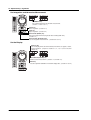
Operation Keys, Jog Shuttle ............................................................................................ 2-3
Chapter 3 Before Starting Measurements
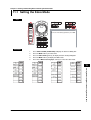
3.1
3.2
3.3
3.4
3.5
3.6
3.7
3.8
3.9
3.10
3.11
3.12
Precautions Concerning the Use of the Instrument ......................................................... 3-1
Installing the Instrument ................................................................................................... 3-2
Wiring Precautions ........................................................................................................... 3-4
For Making Accurate Measurements ............................................................................... 3-6
Connecting the Power Supply .......................................................................................... 3-8
Directly Wiring the Circuit under Measurement ............................................................... 3-9
Using an External Current Sensor to Wire the Circuit under Measurement .................. 3-12
Using an External PT or CT to Wire the Circuit under Measurement ............................ 3-16
Wiring a Circuit with Voltage Input Exceeding 600 V ..................................................... 3-19
Turning ON/OFF the Power Switch ................................................................................ 3-20
Setting the Date and Time ............................................................................................. 3-22
Entering Values and Strings ........................................................................................... 3-24
Chapter 4 Screen Display Format
4.1
4.2
4.3
4.4
4.5
4.6
Displaying the Data (Numerical Data) of Measurement Functions .................................. 4-1
Displaying Waveforms ................................................................................................... 4-10
Displaying Bar Graphs ................................................................................................... 4-12
Displaying Vectors ......................................................................................................... 4-14
Displaying Trends .......................................................................................................... 4-15
Listing the Setup Parameters ......................................................................................... 4-17
Chapter 5 Measurement Conditions
5.1
5.2
5.3
5.4
5.5
5.6
5.7
x
Selecting the Wiring System ............................................................................................ 5-1
Setting the Measurement Range during Direct Input ....................................................... 5-4
Setting the Measurement Range When Using an External Current Sensor .................. 5-10
Setting the Scaling Function When Using an External PT or CT ................................... 5-14
Selecting the Input Filter ................................................................................................ 5-17
Averaging ....................................................................................................................... 5-19
Changing the Data Update Rate .................................................................................... 5-22
IM 760101-01E
Contents
5.8
5.9
5.10
5.11
Holding the Display and Performing Single Measurements ........................................... 5-24
Holding the Numerical Data Display at the Maximum .................................................... 5-25
Performing Master/Slave Synchronized Measurements ................................................ 5-26
Selecting the Crest Factor ............................................................................................. 5-29
6.10
6.11
Changing the Displayed Item of Numerical Data ............................................................. 6-1
Setting the Measurement Period ..................................................................................... 6-4
Selecting the Frequency Measurement Target ................................................................ 6-7
Setting the User-Defined Function ................................................................................... 6-8
Setting the Delta Computation ....................................................................................... 6-12
Setting the Equations for Apparent Power and Corrected Power .................................. 6-15
Selecting the Display Format of the Phase Difference .................................................. 6-18
Setting the Normal Integration Mode and the Integration Timer .................................... 6-20
Setting the Real-time Integration Mode, the Integration Timer, and the
Reservation Time ........................................................................................................... 6-23
Selecting the Current Mode for Current Integration and ON/OFF of Integration Auto
Calibration ...................................................................................................................... 6-29
Performing Integration (Start, Stop, and Reset) ............................................................. 6-31
Setting the Harmonic Measurement Mode ...................................................................... 7-1
Changing the Displayed Item of Numerical Data ............................................................. 7-2
Selecting the Measurement Target .................................................................................. 7-7
Selecting the PLL Source ................................................................................................. 7-8
Setting the Harmonic Order to Be Analyzed .................................................................. 7-11
Selecting the Equation for the Distortion Factor ............................................................ 7-13
Changing the Data Length ............................................................................................. 7-14
Setting the User-Defined Function ................................................................................. 7-15
Changing the Display Items of Bar Graphs and Performing Cursor Measurements ..... 7-19
Changing the Vector Display .......................................................................................... 7-23
8.3
8.4
8.5
8.6
8.7
8.8
5
6
7
9
10
11
12
Chapter 8 Motor Evaluation (Option)
8.1
8.2
4
8
Chapter 7 Harmonic Measurement
7.1
7.2
7.3
7.4
7.5
7.6
7.7
7.8
7.9
7.10
2
3
Chapter 6 Normal Measurement and Integration
6.1
6.2
6.3
6.4
6.5
6.6
6.7
6.8
6.9
1
Inputting Signals of Rotating Speed and Torque .............................................................. 8-1
Selecting the Input Range of the Revolution and Torque Signals and the Synchronization
Source .............................................................................................................................. 8-3
Selecting the Line Filter ................................................................................................... 8-6
Setting the Scaling Factor, the Pulse Count, and Unit Used to Measure the Rotating
Speed ............................................................................................................................... 8-7
Setting the Scaling Factor and Unit Used to Measure the Torque ................................. 8-10
Setting the Motor’s Number of Poles Used to Compute the Synchronous Speed and the
Slip ................................................................................................................................. 8-12
Setting the Scaling Factor and Unit Used to Compute the Motor Output ...................... 8-14
Computing the Motor Efficiency and Total Efficiency ..................................................... 8-16
13
14
15
16
Chapter 9 Waveform Display
9.1
9.2
9.3
9.4
9.5
9.6
IM 760101-01E
Retrieving Waveform Display Data .................................................................................. 9-1
Setting the Time Axis ....................................................................................................... 9-2
Setting the Trigger ............................................................................................................ 9-4
Zooming Vertically and Moving the Vertical Position ....................................................... 9-8
Turning ON/OFF the Waveform Display ........................................................................ 9-11
Splitting the Screen and Displaying Waveforms ............................................................ 9-13
xi
17
App
Index
Contents
9.7
9.8
9.9
Interpolating the Display and Changing the Graticule .................................................... 9-16
Turning ON/OFF the Scale Value and Waveform Label ................................................ 9-19
Performing Cursor Measurements ................................................................................. 9-21
Chapter 10 Trend Display
10.1
10.2
10.3
10.4
10.5
10.6
10.7
10.8
Retrieving Trend Display Data ....................................................................................... 10-1
Selecting the Trend Display Target ................................................................................ 10-2
Turning ON/OFF the Trend Display ............................................................................... 10-6
Splitting the Screen and Displaying Trends ................................................................... 10-8
Setting the Time Axis ................................................................................................... 10-10
Setting the Scale .......................................................................................................... 10-12
Performing Cursor Measurements ............................................................................... 10-14
Restarting the Trend .................................................................................................... 10-18
Chapter 11 Storing and Recalling Data and Saving the Stored Data
11.1
11.2
11.3
11.4
11.5
11.6
Setting the Store Mode .................................................................................................. 11-1
Setting the Store Count, the Store Interval, and the Store Reservation Time ................ 11-3
Setting the Numerical Data and Waveform Display Data to Be Stored ......................... 11-6
Storing the Data ........................................................................................................... 11-10
Saving the Stored Data ................................................................................................ 11-13
Recalling the Stored Data ............................................................................................ 11-20
Chapter 12 Saving and Loading the Data
12.1
12.2
12.3
12.4
12.5
12.6
12.7
12.8
12.9
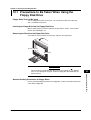
Precautions to Be Taken When Using the Floppy Disk Drive ........................................ 12-1
Built-in Hard Disk (Option) ............................................................................................. 12-2
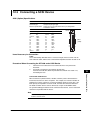
Connecting a SCSI Device ............................................................................................ 12-3
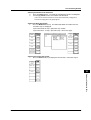
Changing the SCSI ID Number ...................................................................................... 12-4
Formatting the Disk ........................................................................................................ 12-6
Saving Setup Parameters, Waveform Display Data, and Numerical Data ................... 12-11
Saving Screen Image Data .......................................................................................... 12-20
Loading Setup Parameters .......................................................................................... 12-23
Specifying the File to Be Displayed, Viewing File Properties, and Changing the File
Attribute ........................................................................................................................ 12-26
12.10 Deleting Files ............................................................................................................... 12-29
12.11 Copying Files ............................................................................................................... 12-32
12.12 Renaming Directories and Files and Creating Directories ........................................... 12-36
Chapter 13 Ethernet Communications (Option)
13.1
13.2
13.3
13.4
13.5
13.6
13.7
13.8
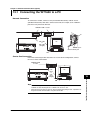
Connecting the WT1600 to a PC ................................................................................... 13-1
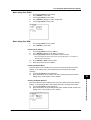
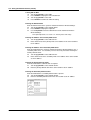
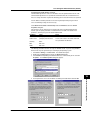
Setting the Ethernet Interface (TCP/IP) ......................................................................... 13-2
Saving Setup, Waveform Display, Numerical, and Image Data to the FTP Server
(FTP Client Function) ..................................................................................................... 13-8
Outputting the Screen Image to a Network Printer ...................................................... 13-11
Sending E-mail Messages ........................................................................................... 13-15
Accessing the WT1600 from a PC or Workstation (FTP Server Function) .................. 13-19
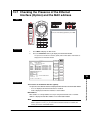
Checking the Presence of the Ethernet Interface (Option) and the MAC address ...... 13-23
Setting the FTP Passive Mode and LPR/SMTP Timeout ............................................. 13-24
Chapter 14 Built-in Printer (Option)
14.1
14.2
14.3
xii
Installing the Paper Roll and Paper Feeding ................................................................. 14-1
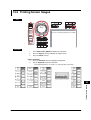
Printing Screen Images .................................................................................................. 14-5
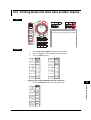
Printing Numerical Data Lists and Bar Graphs .............................................................. 14-7
IM 760101-01E
Contents
1
Setting the D/A Output (Option) ..................................................................................... 15-1
RGB Video Signal (VGA) Output ................................................................................... 15-9
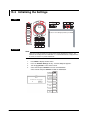
Initializing the Settings ................................................................................................. 15-10
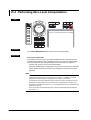
Performing Zero-Level Compensation ......................................................................... 15-12
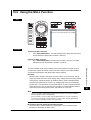
Using the NULL Function ............................................................................................. 15-13
Selecting the Message Language and the Screen Brightness .................................... 15-14
Setting the Display Color of the Screen ....................................................................... 15-16
Setting Key Lock .......................................................................................................... 15-19
2
Chapter 15 D/A Output and Other Functions
15.1
15.2
15.3
15.4
15.5
15.6
15.7
15.8
Chapter 16 Troubleshooting, Maintenance, and Inspection
16.1
16.2
16.3
16.4
16.5
16.6
Troubleshooting ............................................................................................................. 16-1
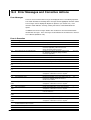
Error Messages and Corrective Actions ......................................................................... 16-2
Performing a Self-Test ................................................................................................... 16-6
Checking the System Conditions ................................................................................... 16-8
Replacing the Power Fuse ............................................................................................. 16-9
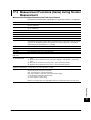
Recommended Replacement Parts ............................................................................. 16-10
3
4
5
6
7
Chapter 17 Specifications
17.1
17.2
17.3
17.4
17.5
17.6
17.7
17.8
17.9
17.10
17.11
17.12
17.13
17.14
17.15
17.16
17.17
17.18
Input ............................................................................................................................... 17-1
Display ........................................................................................................................... 17-2
Measurement Functions (Items) during Normal Measurement ...................................... 17-3
Measurement Functions (Items) during Harmonic Measurement .................................. 17-5
Accuracy ........................................................................................................................ 17-7
Functions ..................................................................................................................... 17-10
Input/Output of the Master/Slave Synchronization Signal ............................................ 17-16
External Clock Input ..................................................................................................... 17-16
RGB Video Signal (VGA) Output ................................................................................. 17-17
Built-in Floppy Disk ...................................................................................................... 17-17
Built-in Hard Disk (Option) ........................................................................................... 17-17
SCSI (Option) ............................................................................................................... 17-17
Ethernet Interface (Option) .......................................................................................... 17-18
Built-in Printer (Option) ................................................................................................ 17-18
GP-IB Interface ............................................................................................................ 17-18
Serial (RS-232) Interface ............................................................................................. 17-19
General Specifications ................................................................................................. 17-19
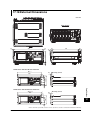
External Dimensions .................................................................................................... 17-21
8
9
10
11
12
13
14
Appendix
Appendix 1
Appendix 2
Appendix 3
Appendix 4
Appendix 5
Symbols and Determination of Measurement Functions .................................. App-1
Determination of Delta Computation ................................................................. App-6
List of Initial Settings and Display Order of Numerical Data ............................. App-8
ASCII Header File Format ............................................................................... App-14
Power Basics
(Power/Harmonics/Three Constants Related to the AC Circuit) ..................... App-17
15
16
Index
17
App
IM 760101-01E
xiii
Index
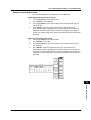
Chapter 1
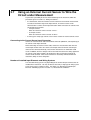
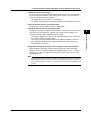
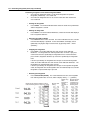
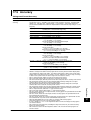
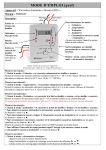
System Configuration and Block Diagram
Explanation of Functions
1.1
1
Explanation of Functions
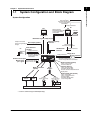
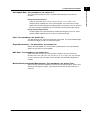
System Configuration
Numerical data
Waveform display data
Screen image data
Stored data
Setup parameters
CRT
Numerical data
Waveform display data
Screen image data
Stored data
PC
Printer
Setup parameters
Image signal
RGB video signal (VGA) output
Outputs measured
values using analog
voltage
Ethernet (option)
interface
D/A output (option)
SCSI interface
(option)
PC
External
SCSI
device
Numerical data
Waveform display data
GP-IB/serial*
interface
Setup parameters
Numerical data
Waveform display data
Screen image data
Stored data
Setup parameters
Setup parameters
Floppy disk
Numerical data
Waveform display data
Screen image data and stored data
External clock input
Master/slave Measurement start
sync signal Measurement stop
Built-in printer (option)
Prints screen image/
numerical data list
Motor evaluation
(option)
Internal memory
Input
element
Stores numerical data/
waveform display data
Recalls numerical data/waveform
display data
Built-in hard disk (option)
Revolution
sensor
Torque
meter
Voltage
(Input either one)
PT
Current
(Input any one)
Saves stored data,
Saves setup parameters/
numerical data/
waveform display data/
screen image data
CT Current
sensor
Item under measurement
* Conforms to EIA-574 (9-pin EIA-232(RS-232)).
IM 760101-01E
1-1
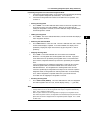
1.1 System Configuration and Block Diagram
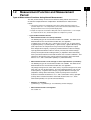
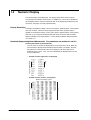
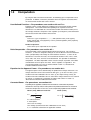
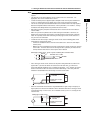
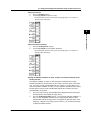
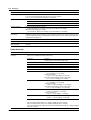
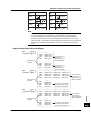
Block Diagram
ELEMENT2~6
ELEMENT1
CPU
U
±
A/D
Line
Filter
I
±
Zero
Cross
Filter
ZERO
DET.
DSP
CPU
G.A
PEAK
DET.
EXT
Zero
Cross
Filter
ZERO
DET.
PEAK
DET.
A/D
Line
Filter
DRAM
PRINTER
(option)
SRAM
SCSI
(option)
RTC
HDD
(option)
DSP
PEAK
DET.
SPEED
A/D
Line
Filter
ZERO
DET.
PEAK
DET.
PHOTO
ISO.
COUNTER
KEY&
LED
ROM
MOTOR(option)
TORQUE
6.4”
LCD
GP-IB
or
Serial
A/D
Line
Filter
Display
G.A.
I/O
DSP
PLL
D/A
(option)
10BASE-T
(option)
FDD
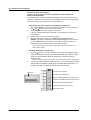
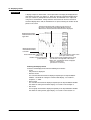
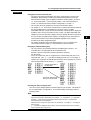
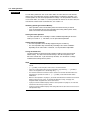
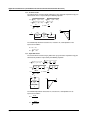
Signal Flow and Process
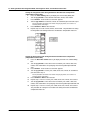
The input circuits, Elements 1 through 6, consist of a voltage input circuit and a current
input circuit. The input circuits are mutually isolated. They are also isolated from the case.
The voltage signal that is applied to the voltage input terminal (U, ± ) is normalized using the
voltage divider of the voltage input circuit and an operational amplifier (OP AMP). It is then
isolated by the transformer and input to a voltage A/D converter.
The current input circuit is equipped with two types of input terminals, a current input terminal
(I, ± ) and a current sensor input connector (EXT). Either one can be used at any given time.
The voltage signal from the current sensor that received the signal at the current sensor input
connector is normalized using the voltage divider and an operational amplifier (OP AMP). It is
then isolated by the transformer and input to a current A/D converter. The current signal that is
applied to the current input terminal is converted to a voltage by a current divider. Then, it is input
to the current A/D converter in the same fashion as the voltage signal from the current sensor.
During normal measurement, the voltage signal that is input to the voltage A/D converter or
current A/D converter is converted to digital values at an interval of approximately 5 µs.
The measured value is derived using a DSP based on the converted digital values.
During harmonic measurement, the applied voltage signal is converted to digital values at
an interval that is an integer multiple of the PLL source signal (cycle of the clock generated
by the PLL circuit). The measured value of each item of harmonic measurement is derived
by performing an FFT based on the converted digital values using a DSP.
The measured value is transmitted to the CPU. Various computed values are
determined from the measured values. These measured values and computed values
are displayed, output through a D/A output, or output through communications.
When waveform display data is not being retrieved during normal measurement, the DSP
and CPU processes are pipelined, and the DSP process is executed in real-time.
Therefore, measurements with few data dropouts can be achieved against the input signal.
1-2
IM 760101-01E
1
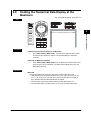
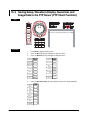
Measurement Function and Measurement
Period
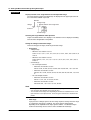
Types of Measurement Functions during Normal Measurement
The data (numerical data) of measurement functions during normal measurement is
measured or computed from the sampled data*1 described later in “Measurement
Period.”
*1 The WT1600 samples the instantaneous values of the voltage and current signals at a
specified sample rate*2. The sampled data is processed as numerical data or data used to
display waveforms on the screen (waveform display data).
*2 Sample rate represents the number of data points that are sampled within 1 s. For example,
at a sample rate of 200 kS/s, 200000 data points are sampled every second.
• Types of Measurement Functions
• Measurement functions on each input element
The following 29 types of measurement functions are available. For details on the
determination of each measurement function data, see appendix 1.
U (voltage Urms, Umn, Udc, Uac), I (current Irms, Imn, Idc, Iac), P (active power),
S (apparent power), Q (reactive power), λ (power factor), φ (phase difference), fU/fI
(also expressed as fU: FreqU and fI: FreqI, measures the frequencies of up to
three voltage/current signals), U+pk/U-pk (maximum/minimum values of voltage),
I+pk/I-pk(maximum/minimum values of current), CfU/CfI(crest factor of voltage/
current), FfU/FfI (form factor of voltage/current), Z (impedance of the load circuit),
Rs/Xs (resistance/reactance of the load circuit that has a resistor R, inductor L, and
capacitor C connected in series), Rp/Xp (resistance/reactance of the load circuit
that has a R, L, and C connected in parallel), Pc (Corrected Power)
• Measurement functions of the average or sum of input elements (Σ functions)
The following 19 types of measurement functions are available. For details on the
determination of each measurement function data, see appendix 1.
UΣ (voltage average UrmsΣ, UmnΣ, UdcΣ, UacΣ), IΣ (current average IrmsΣ, ImnΣ,
IdcΣ, IacΣ), PΣ (sum of active powers), SΣ (sum of apparent powers), QΣ (sum of
reactive powers), λΣ (power factor average), φΣ (phase difference average), ZΣ
(impedance average of the load circuit), RsΣ/XsΣ (average of the resistance/
reactance of the load circuit that has a R, L, and C connected in series), RpΣ/XpΣ
(average of the resistance/reactance of the load circuit that has a R, L, and C
connected in parallel), PcΣ (sum of Corrected Powers)
• Efficiency (Σ functions)
η (Efficiency 1), 1/η (Efficiency 2). See “Efficiency” on the next page.
• Measurement functions of integration
See section 1.6.
IM 760101-01E
1-3
Explanation of Functions
1.2
1.2 Measurement Function and Measurement Period
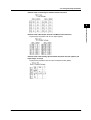
Determining the Voltage and Current
There are four types of measurement functions for voltage (U) and current (I).
• Urms, Irms (true rms value)
These values are the true rms values of the voltage and current. The
instantaneous values over one period are squared and averaged. Then, the
square root of the value is determined. f(t) and T represent the input signal as a
function of time and the period of the input signal, respectively.
T
1
f(t)2 dt
T 0
• Umn, Imn (rectified mean value calibrated to the rms value)
This function rectifies one period of the voltage or current signal, determines the average,
and multiplies the result by a coefficient. The coefficient is a value that when applied to a
sinusoidal input signal, gives the true rms value. When the input signal is a distorted or is a
DC waveform, these values will differ from the true rms values. f(t) and T represent the
input signal as a function of time and the period of the input signal, respectively.
Urms or Irms =
T
π
Umn or Imn =
1
f(t) dt
•
T 0
2 2
• Udc, Idc (simple average)
These are the average values over one period of the voltage and current signal.
This function is useful when determining the average value of a DC input signal or
a DC component that is superimposed on an AC input signal.
T
1
Udc or Idc =
f(t) dt
T 0
• Uac, Iac (AC component)
These are the AC components of the voltage and current. They are the square
root values of the difference of the square of the true rms values of the input signal
and the square of the DC component.
Uac =
2
2
Urms – Udc
or Iac =
2
Irms – Idc
2
Element
Element refers to a set of input terminals that can input a single phase of voltage and
current to be measured. The WT1600 can contain up to six elements, which are
numbered from 1 to 6. The element number is appended to the symbols that were
defined in the earlier section, “Measurement functions on each input element” so that
the correspondence between the numerical data and the element can be seen. For
example, “Urms1” represents the true rms value of the voltage of element 1.
Wiring System
The selectable patterns of wiring systems vary depending on the number of input elements
that are installed in the instrument. You may be able to select only a single type of wiring
system or two or three types of wiring systems. When two or more types of wiring systems
are selected, “A”, “B”, or “C” is appended to the symbols that were defined in the earlier
section “Measurement functions of the average or sum of input elements (Σ functions)” so
that the correspondence between the numerical data and the wiring unit can be seen.
For example, “UrmsΣA” represents the true rms value of the average of the voltage of
the input elements that are assigned to wiring unit ΣA
Efficiency
η (efficiency 1) is determined by the equation (PΣB)/(PΣA) × 100; 1/η (efficiency 2) is
determined by the equation (PΣA)/(PΣB) × 100. You can create an equation using
user-defined functions to determine efficiencies other than the above two. In addition,
on models with the motor evaluation function (option), ηmA((Pm)/(PΣA) × 100) and
ηmB((Pm)/(PΣB) × 100) can be determined.
1-4
IM 760101-01E
1.2 Measurement Function and Measurement Period
The data (numerical data) of measurement functions during harmonic measurement is
measured or computed from the sampled data*1 described later in “Measurement Period.”
*
See the description of the sampled data in the earlier section “Types of Measurement
Functions during Normal Measurement.”
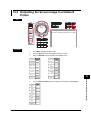
Types of Harmonic Measurement Functions
• Harmonic measurement functions on each input element
The following 28 types of harmonic measurement functions are available. For
details on the determination of each measurement function data, see appendix 1.
Measurement
Function
U( )
I( )
P( )
S( )
Q( )
λ( )
φ( )
φU( )
φI( )
Z( )
Rs( )
Xs( )
Rp( )
Xp( )
Uhdf( )
Ihdf( )
Phdf( )
Uthd
Ithd
Pthd
Uthf
Ithf
Utif
Itif
hvf
hcf
fU
fI
Chars and Numbers inside ( )
All
dc
1
k
(No ( ))
Yes
Yes
Yes
Yes
Yes: Numerical data exists
Yes
Yes
Yes
Yes
No: Numerical data does
Yes
Yes
Yes
Yes
Yes
Yes
Yes
Yes
Always 0
Yes
Yes
Yes
Yes
Yes
Yes
Yes
No
Yes
Yes
Yes
No
No
Yes
No
No
No
Yes
No
Yes
Yes
Yes
No
Yes
Yes
Yes
No
Yes
Yes
Yes
No
Yes
Yes
Yes
No
Yes
Yes
Yes
No
Yes
Yes
Yes
No
Yes
Yes
Yes
No
Yes
Yes
Yes
No
No
No
No
Yes
No
No
No
Yes
No
No
No
Yes
No
No
No
Yes
No
No
No
Yes
No
No
No
Yes
No
No
No
Yes
No
No
No
Yes
No
No
No
Yes
No
No
No
Yes
No
No
No
Yes
not exist
• The meaning of measurement functions with parentheses varies depending on
the characters or numbers that are inside the parentheses as follows:
• dc: Indicates numerical data of the DC component.
• 1: Indicates numerical data of the fundamental signal.
• k: Indicates numerical data from 2nd to Nth order harmonics. N is the upper limit of
harmonic order under analysis (see section 17.6). The upper limit is determined
automatically (maximum is 100) by the frequency of the PLL source.
• All: No parentheses are appended after the measurement function. Indicates
numerical data related to all waveforms including the fundamental and harmonics.
• Uhdf to hcf are measurement functions that indicate characteristics specific to
the harmonics. For details on the determination of the measurement functions,
see appendix 1.
• The frequency of up to three signals including the signals selected for the PLL source
as fU (FreqU: voltage frequency) or fI (FreqI: current frequency) can be measured.
IM 760101-01E
1-5
Explanation of Functions
Types of Measurement Functions during Harmonic Measurement
1
1.2 Measurement Function and Measurement Period
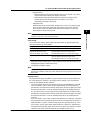
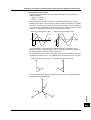
• Harmonic measurement function that indicates the phase difference (φ) of the
voltage and current between the input elements
There are five harmonic measurement functions that express the phase difference
(φ).
Explanation is given below for the case when the number of installed input
elements is 5, the wiring system pattern is three-phase, four-wire for ΣA and threephase, three-wire for ΣB.
When the target of the harmonic measurement is set to wiring unit ΣA, the target
elements are 1, 2, and 3. The numerical data of the harmonic measurement
functions of phase difference concerning elements 1, 2, and 3 can be determined
as shown below.
When the target of the harmonic measurement is set to wiring unit ΣB, the target
elements are 4 and 5. The numerical data of the harmonic measurement functions
of phase difference concerning elements 4 and 5 (φU4-U5, φU4-I4 and φU4-I5) can
be determined. The phase difference φU4-U-6 and φU4-I6 cannot be determined.
• φU1-U2
Phase difference of the fundamental voltage U2(1) of element 2 with respect to
the fundamental voltage U1(1) of element 1.
• φU1-U3
Phase difference of the fundamental voltage U3(1) of element 3 with respect to
the fundamental voltage U1(1) of element 1.
• φU1-I1
Phase difference of the fundamental current I1(1) of element 1 with respect to
the fundamental voltage U1(1) of element 1.
• φU1-I2
Phase difference of the fundamental current I2(1) of element 2 with respect to
the fundamental voltage U1(1) of element 1.
• φU1-I3
Phase difference of the fundamental current I3(1) of element 3 with respect to
the fundamental voltage U1(1) of element 1.
• Harmonic measurement function of the average or of the sum of the input
elements (Σ functions)
The following 6 types of harmonic measurement functions are available. For
details on the determination of each measurement function, see appendix 1.
Measurement
Function
UΣ( )
IΣ( )
PΣ( )
SΣ( )
QΣ( )
λΣ( )
Chars and Numbers
inside ( )
All
1
(No ( ))
Yes
Yes
Yes
Yes
Yes
Yes
Yes
Yes
Yes
Yes
Yes
Yes
Yes: Numerical data exists
• For measurement functions with parentheses, the value “1” is entered in the
parentheses. This represents the numerical data of the fundamental signal.
• All: No parentheses are appended after the measurement function. Indicates
numerical data related to all waveforms including the fundamental and
harmonics.
1-6
IM 760101-01E
1.2 Measurement Function and Measurement Period
1
Element
Element refers to a set of input terminals that can input a single phase of voltage and
current to be measured. The WT1600 can contain up to six elements, which are
numbered from 1 to 6. The element number is appended to the symbols that were
defined in the earlier section, “Harmonic measurement functions on each input
element” so that the correspondence between the numerical data and the element
can be seen. For example, “U1(2)” represents the voltage of the 2nd order harmonic
of element 1.
Explanation of Functions
Wiring System
The selectable patterns of wiring systems vary depending on the number of input
elements that are installed in the instrument. You may be able to select only a single
type of wiring system or two or three types of wiring systems. When two or more
types of wiring systems are selected, “A”, “B”, or “C” is appended to the symbols that
were defined in the earlier section “Harmonic measurement functions of the average
or sum of input elements (Σ functions)” so that the correspondence between the
numerical data and the wiring unit can be seen.
For example, “UΣA(1)” represents the average of the voltage of the fundamental
signal of the input elements that are assigned to wiring unit ΣA.
PLL Source «For procedures, see section 7.4»
When measuring harmonics, the fundamental period (period of the fundamental
signal) must be determined in order to analyze the higher orders. The PLL (phase
locked loop) source is the signal that is used to determine the fundamental period.
Selecting a signal with little distortion or fluctuation for the PLL source will result in a
stable harmonic measurement. An ideal signal would be a rectangular wave with
amplitude that is greater than or equal to 50% or 100% of the measurement range
(see section 1.3) when the crest factor (see section 5.11) is set to 3 or 6, respectively.
In addition, a sampling clock signal (Smp Clk) with a frequency that is 2048 times the
fundamental frequency of the waveform on which to perform harmonic measurements
can be input to the external clock input connector. Stable harmonic measurement is
achieved by using this sampling clock to sample data from the target waveform.
Stable harmonic measurement can also be achieved by applying a clock signal (Ext
Clk) that has the same period as the waveform on which to perform harmonic
measurements.
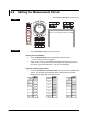
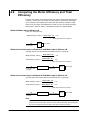
Types of Measurement Functions of the Motor Evaluation Function (Option)
By using the motor evaluation function (option), the rotating speed, torque, and output of
a motor can be determined from the DC voltage (analog signal) or pulse count signal
received from a revolution sensor, which is proportional to the rotating speed of the
motor, and the DC voltage (analog signal) received from a torque meter, which is
proportional to the motor’s torque. In addition, the synchronous speed and slip of a
motor can be determined by setting the motor’s number of poles. Furthermore, the
active power and frequency that are measured by the WT1600 and the motor output can
be used to compute the motor efficiency and the total efficiency.
Types of Measurement Functions
Speed (rotating speed), Torque, Pm (motor output or mechanical power),
synchronous speed (Sync), Slip, motor efficiency (ηmA), and total efficiency (ηmB).
For details on the determination of the measurement functions, see appendix 1.
IM 760101-01E
1-7
1.2 Measurement Function and Measurement Period
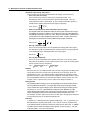
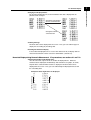
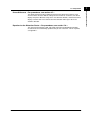
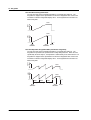
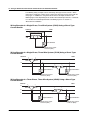
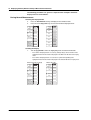
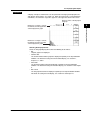
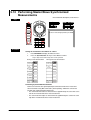
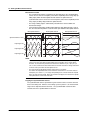
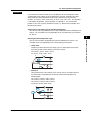
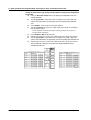
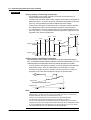
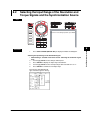
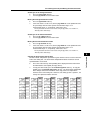
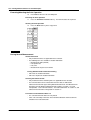
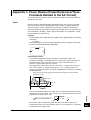
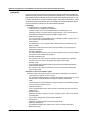
Measurement Period
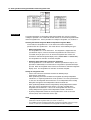
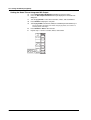
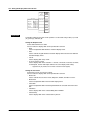
During Normal Measurement
The numerical data is measured or computed using the sampled data*1 in the
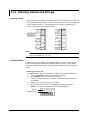
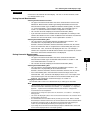
measurement period that is determined according to the following principle*2.
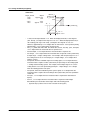
• The measurement period is set between the first point where the reference input
signal (synchronization source) crosses the level zero point (center of the
amplitude) on the rising slope (or falling slope)*3 within the data update interval*4
and the last point where the synchronization source crosses the level zero point
(center of the amplitude) on the rising slope (or falling slope) within the data update
interval.
• The rising or falling edge is automatically selected for the one that allows the
interval to be longer.
• If the number of rising slope or falling slope is zero or one within the data update
interval, the measurement period is set to the entire span within the data update
interval.
• You can select which input signal will be the synchronization source (synchronized
to the zero crossing point of the input signal) for each element. You can select the
voltage, current, or external clock that is input to the element to be the
synchronization source signal.
*1 For details on the sampled data, see the description of the sampled data in the earlier
section “Types of Measurement Functions during Normal Measurement.”
*2 The measurement period for determining the numerical data of the peak voltage or peak
current is the entire span within the data update interval. Therefore, the measurement
period for the measurement functions U+pk, U-pk, I+pk, I-pk, CfU, CfI, FfU, and FfI that
are determined from the maximum value of the voltage and current is also the entire span
within the data update interval.
*3 Slope refers to the movement of the signal from a low level to a high level (rising edge) or
from a high level to a low level (falling edge).
*4 The data update interval is the interval by which the data is sampled for determining the
measurement functions. This is equivalent to the value you can specify in “Data Update
Rate” of section 1.3.
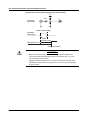
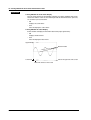
Data update interval
Data update interval
Data update interval
Measurement period
Measurement period
Measurement period
Synchronization source
Input signal U1
Input signal U2
Input signal U3
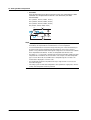
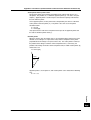
During Harmonic Measurement
The data length (the number of sampled data) to be used in harmonic measurement is
set to 8192, 4096, or 2048 points. The selected data length is the measurement
period. When the waveform is displayed, the measurement period corresponds to
one screen of the waveform.
1-8
IM 760101-01E
1
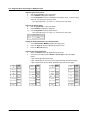
Measurement Conditions
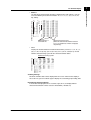
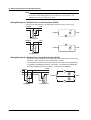
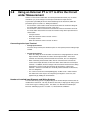
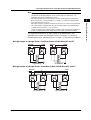
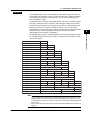
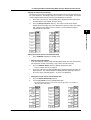
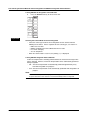
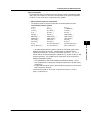
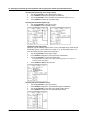
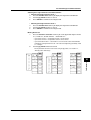
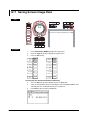
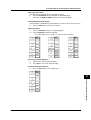
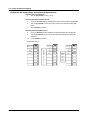
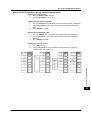
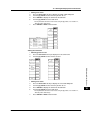
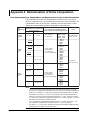
Number of Installed Input Elements and Wiring Systems «For procedures, see section 5.1.»
• The selectable patterns of wiring systems vary depending on the number of input
elements that are installed in the instrument. You may be able to select only a single
type of wiring system or two or three types of wiring systems. You can select the
wiring system from the following five types.
1P2W (single-phase, two-wire), 1P3W (single-phase, three-wire), 3P3W (three-phase,
three-wire), 3P4W (three-phase, four-wire), and 3V3A (three-voltage, three-current)
• The input element assignment to wiring units ΣA, ΣB, and ΣC is determined from the
wiring system pattern. This allows Σ functions of voltage, current, active power,
apparent power, reactive power, power factor, phase difference, and other parameters
to be determined. For the relationship between the wiring system and the
determination of the Σ function, see appendix 1.
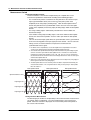
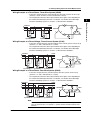
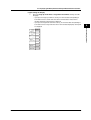
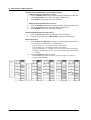
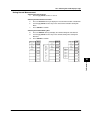
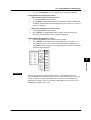
• The following table shows the relationship between the number of installed elements,
the selectable wiring system patterns, and the assignment of input elements to wiring
units ΣA, ΣB, and ΣC.
Installed input elements
1
Wiring system pattern 1
1P2W
Installed input elements
1
2
Wiring system pattern 1
1P2W
1P2W
Wiring system pattern 2
1P3W or 3P3W(ΣA)
Installed input elements
1
2
Wiring system pattern 1
1P2W
1P2W
Wiring system pattern 2
1P3W or 3P3W(ΣA)
Wiring system pattern 3
1P2W(ΣA)
Wiring system pattern 4
1P2W
1P2W(ΣB)
1P3W or 3P3W(ΣB)
3P4W or 3V3A(ΣA)
Installed input elements
1
2
3
4
Wiring system pattern 1
1P2W
1P2W
1P2W
1P2W
Wiring system pattern 2
1P3W or 3P3W(ΣA)
Wiring system pattern 3
Wiring system pattern 4
1P2W(ΣA)
Installed input elements
1
2
Wiring system pattern 1
1P2W
1P2W
Wiring system pattern 2
1P3W or 3P3W(ΣA)
Wiring system pattern 3
1P3W or 3P3W(ΣA)
1P2W(ΣB)
3P4W or 3V3A(ΣB)
3
4
1P2W
1P2W
2
Wiring system pattern 1
1P2W
1P2W
Wiring system pattern 2
1P3W or 3P3W(ΣA)
Wiring system pattern 3
1P3W or 3P3W(ΣA)
5
1P2W
1P3W or 3P3W(ΣB)
1P2W(ΣC)
3P4W or 3V3A(ΣB)
3P4W or 3V3A(ΣA)
1
Installed input elements
1P3W or 3P3W(ΣB)
3P4W or 3V3A(ΣA)
Wiring system pattern 4
IM 760101-01E
3
1P3W or 3P3W(ΣB)
3
4
1P2W
1P2W
1P3W or 3P3W(ΣB)
Wiring system pattern 4
3P4W or 3V3A(ΣA)
Wiring system pattern 5
3P4W or 3V3A(ΣA)
5
6
1P2W
1P2W
1P3W or 3P3W(ΣC)
3P4W or 3V3A(ΣB)
1P3W or 3P3W(ΣB)
1P2W(ΣC)
1P2W(ΣC)
3P4W or 3V3A(ΣB)
1-9
Explanation of Functions
1.3
1.3 Measurement Conditions
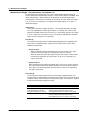
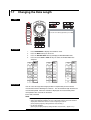
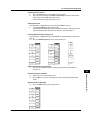
Measurement Range «For procedures, see section 5.2.»
Set the measurement range using an rms level. When directly inputting voltage or
current signals to the input element, two types of measurement ranges is available, fixed
range and auto range. When waveforms are displayed, the vertical display range
corresponds to 3 or 6 times the measurement range when the crest factor (see section
5.11) is set to 3 or 6, respectively. For details on waveform display, see section 1.7,
“Waveform Display.”
Fixed Range
Select each range from a number of choices. The selected range does not switch
even if the amplitude of the input signal changes. For voltage, the maximum and
minimum selectable ranges are 1000 V and 1.5 V, respectively, when the crest factor
is set to 3. When the crest factor is set to 6, the maximum and minimum selectable
ranges are 500 V and 750 mV, respectively.
Auto Range
The measurement range switches automatically depending on the amplitude of the
input signal. The different ranges used in the auto range are the same as those
available for fixed range.
• Range increase
• When the data of measurement function Urms or Irms exceeds 110% of the
current measurement range, the measurement range is increased.
• When the peak value of the input signal exceeds 330% or 660% of the current
measurement range when the crest factor is set to 3 or 6, respectively, the
range is increased.
• Range decrease
When the data of the measurement function Urms or Irms is less than or equal to
30% of the measurement range and Upk and Ipk is less than or equal to 300% or
600% of the next lower range when the crest factor is set to 3 or 6, respectively,
the range is decreased.
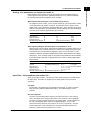
Power Range
The measurement ranges (power ranges) of active power, apparent power, and
reactive power are determined by the wiring system, voltage range, and current range
as follows. For the actual values of the measurement range, see section 5.2, “Setting
the Measurement Range during Direct Input.”
1-10
Wiring System
Power Range
1P2W (single-phase, two-wire)
voltage range × current range
1P3W (single-phase, three-wire)
3P3W (three-phase, three-wire)
3V3A (three-voltage, three-current)
voltage range × current range × 2
(when the voltage and current ranges on the
corresponding elements are set to the same range)
3P4W (three-phase four-wire)
voltage range × current range × 3
(when the voltage and current ranges on the
corresponding elements are set to the same range)
IM 760101-01E
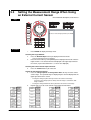
1.3 Measurement Conditions
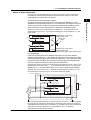
When inputting current signals via an external current sensor or inputting voltage or
current signals via the external PT (potential transformer) or CT (current transformer),
the transformation ratio and coefficient can be specified.
When Inputting Current Signals via an External Current Sensor
The output of current sensors, such as shunts and clamps, can be input to the current
sensor connector (EXT) and be measured. Set how many mV the current sensor
outputs when 1 A of current flows (transformation ratio). Then, the input signal can be
made to correspond to the numerical data or waveform display data that are obtained
when the current is directly applied to the input terminals.
Measurement Function
Transformation Ratio Data before Conversion
Conversion Result
Current I
Active power P
Apparent power S
Reactive power Q
Max./Min. current value Ipk
E
E
E
E
E
IS/E
PS/E
SS/E
QS/E
IpkS/E
IS(current sensor output)
PS
SS
QS
IpkS(current sensor output)
When Inputting Voltage or Current Signals via an External PT or CT
Measurements can be made by connecting the output of the secondary side of the PT
and the output of the secondary side of the CT to the same voltage and current input
terminals that are used when directly inputting a signal. Set the PT ratio, CT ratio,
and power coefficient (coefficient multiplied to the power determined from the voltage
and current). Then, the input signal can be made to correspond to the numerical data
or waveform display data that are obtained when the current is directly applied to the
input terminals.
Measurement Function
Data before Conversion
Conversion Result
Voltage U
Current I
Active power P
Apparent power S
Reactive power Q
Max./Min. current value Ipk
U2(secondary output of PT)
I2(secondary output of CT)
P2
S2
Q2
Ipk2(secondary output of CT)
U2 × P
P: PT ratio
II2 × C
C: CT ratio
P2 × P × C × SF SF: Power coefficient
S2 × P × C × SF
Q2 × P × C × SF
Ipk2 × C
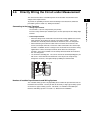
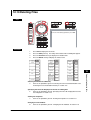
Input Filter «For procedures, see section 5.5.»
There are two types of filters. This WT1600 makes measurements by synchronizing to
the input signal. Therefore, the frequency of the input signal must be measured
accurately.
Line Filter
The line filter is inserted into the circuit under measurement. It removes the noise
from the inverter and from distorted waveforms. The cutoff frequency can be
selected.
Zero Crossing Filter
This filter is inserted only into the frequency measurement circuit. Zero crossing
refers to the point where the input signal crosses the center level of the amplitude.
This filter is used to accurately detect the zero crossing point. The WT1600 detects
the zero crossing point with a hysteresis of approximately 5% or 10% of the
measurement range when the crest factor is set to 3 or 6, respectively. The zero
crossing detection is used to determine the measurement period, measure the
frequency, and determine the period of a PLL source.
IM 760101-01E
1-11
Explanation of Functions
Scaling «For procedures, see sections 5.3 and 5.4.»
1
1.3 Measurement Conditions
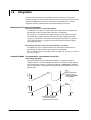
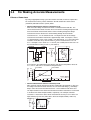
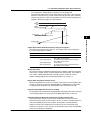
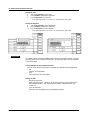
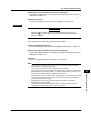
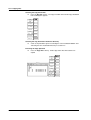
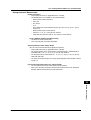
Averaging «For procedures, see section 5.6.»
The averaging function is effective when reading of the numerical display is difficult due
to fluctuations. This occurs when the fluctuation of the power supply or the load is large
or when the input signal frequency is low.
During Normal Measurement
Two types, exponential average and moving average, are available.
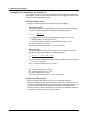
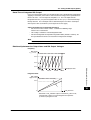
• Exponential average
The numerical data can be exponentially averaged using a specified attenuation
constant. Averaging is performed according to the following equation.
Dn = Dn – 1 +
(Mn – Dn – 1)
K
Dn: Displayed value that has been exponentially averaged nth times. (The
displayed value D1 on the first time is M1.)
Dn–1: Displayed value that has been exponentially averaged n-1th times.
Mn: Measured data on the nth time.
K: Attenuation constant (select from 2, 4, 8, 16, 32, and 64)
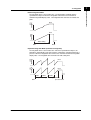
• Moving average
The numerical data can be linearly averaged using a specified average count.
Averaging is performed according to the following equation.
Dn =
Mn – (m – 1) + • • • Mn – 2 + Mn – 1 + Mn
m
Dn: Displayed value obtained by linearly averaging m points of numerical data from
the n–(m–1)th to nth time
Mn–(m–1): Measured data on the n–(m–1)th time.
..............................
..............................
Mn–2: Measured data on the n–2th time.
Mn–1: Measured data on the n–1th time.
Mn: Measured data on the nth time.
m: Average count (select from 8, 16, 32, 64, 128, and 256)
During Harmonic Measurement
When the fundamental frequency is 50/60 Hz, the attenuation constant is
automatically adjusted so that a first-order low-pass filter with a time constant of 1.5 s
is achieved. Exponential averaging is performed using this attenuation constant. For
example, if the data length for the analysis is 8192 points and the fundamental
frequency of the PLL source is between 55 Hz and 75 Hz, the attenuation constant is
set to 5.625. For other frequencies, it is set to 4.6875.
1-12
IM 760101-01E
1.3 Measurement Conditions
This is the period by which the data is sampled for determining the measurement
functions.
During Normal Measurement
Select the value from 50 ms, 100 ms, 200 ms, 500 ms, 1 s, 2 s, and 5 s. The
numerical data is updated once at the selected period. You can increase the data
update rate to acquire relatively fast load fluctuations in the power system or decrease
the rate to acquire sampled data for several periods even for relatively long signals.
During Harmonic Measurement
The data update rate is determined by the fundamental frequency of the PLL source
and the number of periods of the PLL source used for the analysis.
Hold «For procedures, see section 5.8.»
The data display of each measurement function can be held. The communication output
data while the display is held is the held numeric data.
Single Measurement «For procedures, see section 5.8.»
While in the held condition, the measurement is performed once at the specified data
update rate and enters the held condition.
MAX Hold «For procedures, see section 5.9.»
Holds the maximum value of the numerical data. Holds the data of measurement
functions Urms, Umn, Udc, Uac, Irms, Imn, Idc, Iac, P, S, Q, U+pk, U-pk, I+pk, and I-pk
as well as the data of the Σ function of these functions while the MAX hold function is
enabled.
Master/Slave Synchronized Measurement «For procedures, see section 5.10.»
With the master instrument outputting measurement start and stop signals and the slave
instrument receiving those signals, synchronized measurement on two instruments is
achieved.
IM 760101-01E
1-13
Explanation of Functions
Data Update Rate «For procedures, see section 5.7.»
1
1.4
Numeric Display
The numerical data can be displayed. The display format differs between normal
measurement and harmonic measurement. In addition, the screen can be divided into
top and bottom halves so that the numerical data can be displayed simultaneously with
waveforms, bar graphs, or trends (explained later).
Display Resolution
The display resolution for voltage, current, active power, apparent power, reactive power,
and so on is 60000. When the range rating (rated value of the specified range) is
applied, the Σ function of voltage, current, active power, apparent power, reactive power,
and so on is set to the decimal point position and unit of the element with the lowest
display resolution of the target elements. For the display resolution during integration,
see section 6.11.
Numerical Display during Normal Measurement «For procedures, see sections 4.1 and 6.1.»
Selecting the Number of Displayed Items
You can select the number of displayed items in the range from 4 to all. When the
numerical data is displayed simultaneously with waveforms, bar graphs, or trends,
only half of the selected number of items is displayed. Not all the data can be
displayed on one screen. Thus, you can scroll through the displayed items to view
the succeeding data.
• Example in which eight items are displayed
Data
Measurement function
• Example in which all items are displayed
Element and wiring system
Data
Measurement function
1-14
IM 760101-01E
1.4 Numeric Display
Explanation of Functions
Changing the Displayed Items
By selecting a displayed item, the numerical data value that is displayed at the
position can be changed.
Change the measurement
function of the third item
Change the element
of the third item
Scrolling the Page
Not all the data can be displayed on one screen. Thus, you can scroll the page to
display the succeeding (or preceding) data.
Resetting the Numerical Display
If the number of displayed items is set to a value other than All, the display order of
measurement functions can be reset to the default order (1 default set).
Numerical Display during Harmonic Measurement «For procedures, see sections 4.1 and 7.2.»
Selecting the Number of Displayed Items
You can select four, eight or 16 for the number of displayed items. When the
numerical data is displayed simultaneously with waveforms, bar graphs, or trends,
only half of the selected number of items is displayed. Not all the data can be
displayed on one screen. Thus, you can scroll through the displayed items to view
the succeeding data.
Example in which eight items are displayed
Data
Measurement function
IM 760101-01E
1
1-15
1.4 Numeric Display
Changing the Displayed Items When Four, Eight, or 16 Items Are Displayed
By selecting a displayed item, the numerical data value that is displayed at the
position can be changed.
Change the measurement
function of the third item
Change the element
of the third item
Change the harmonic
order
List Display
For each measurement function, the numerical data of the fundamental and all
harmonics can be displayed in two columns. When the numerical data is displayed
simultaneously with waveforms, bar graphs, or trends, approximately half of the data
is displayed.
• Single list
The data of a single measurement function is displayed by separating the even and
odd harmonics in each column. You can select the following measurement
functions: U, I, P, S, Q, λ, φ, φU, φI, Z, Rs, Xs, Rp, and Xp.
Harmonic order
Data related to all harmonic signals
1-16
Numerical data of
each harmonic
Harmonic distortion factor
(When the selected measurement function
is U, I, or P, Uhdf, Ihdf, or Phdf is displayed,
respectively.)
IM 760101-01E
1.4 Numeric Display
Harmonic order
Data related to all harmonic signals
Numerical data of
each harmonic
Harmonic distortion factor
(When the selected measurement function
is U, I, or P, Uhdf, Ihdf, or Phdf is displayed,
respectively.)
• Σ list
Displays the numerical data of measurement functions (such as U, I, P, S, Q, λ, φ,
φU, φI, Z, Rs, Xs, Rp, Xp, φU1-U2, φU1-U3, φU1-I1, φU1-I2, and φU1-I3) of each
element and each wiring system for the selected harmonic orders.
Element and wiring system
Measurement function
Scrolling the Page
Not all the harmonic data can be displayed on one screen. When the list display is
not set to Σ list, you can scroll the page to display the succeeding (or preceding) data.
Resetting the Numerical Display
If the number of displayed items is set to four, eight, or 16, the display order of
measurement functions can be reset to a default order (1 default set).
IM 760101-01E
1-17
Explanation of Functions
• Dual list
The data of two measurement functions is displayed in its own column. You can
select the following measurement functions: U, I, P, S, Q, λ, φ, φU, φI, Z, Rs, Xs,
Rp, and Xp.
1
1.5
Computation
By using the data of measurement functions, the following types of computation can be
performed. In addition, a function is provided in which the equation used to determine
the measurement function data can be selected.
User-Defined Functions «For procedures, see sections 6.4 and 7.8.»
Equations can be created (defined) by combining the measurement function symbols
and operators. The numerical data corresponding to the equation can then be
determined. The combination of a measurement function and element number (Urms1,
for example) constitutes an operand. Four equations (F1 through F4) can be defined for
normal measurement and harmonic measurement.
Operators
There are 11 types of operators: +, –, ∗, /, ABS (absolute value), SQR (square),
SQRT (square root), LOG (logarithm), LOG10 (common logarithm), EXP (exponent),
and NEG (negation).
Number of Operands
There can be up to 16 operands in one equation.
Delta Computation «For procedures, see section 6.5.»
Delta computation can be performed during normal measurement. For example, if
elements 1, 2, and 3 are assigned to wiring A, the sum or difference of the instantaneous
values (sampled data) of the voltage or current between elements 1, 2, and 3 can be
determined. Then, from the results, the measurement functions ∆Urms, ∆Irms, ∆Umn,
∆Imn, ∆Udc, ∆Idc, ∆Uac, and ∆Iac can be determined. This operation is called delta
computation. The delta computation can be used, for example, to perform star-to-delta
transformation of a three-phase AC circuit. For the equation, see appendix 2. The
measurement period is the same as that described in section 1.2, “Measurement
Function and Measurement Period.”
Equation for the Apparent Power «For procedures, see section 6.6.»
The apparent power can be determined by the product of the voltage and current. The
voltage and current can be selected from the four types, (1) the true rms value, (2) the
rectified mean value calibrated to the rms value, (3) the simple average, and (4) the
rectified mean value calibrated to the rms value for the voltage and the true rms value for
the current, as explained in “Determining the Voltage and Current” in section 1.2,
“Measurement Function and Measurement Period.”
Corrected Power «For procedures, see section 6.6.»
Depending on the applicable standard, when the load that is connected to the potential
transformer is extremely small, the active power of the potential transformer that is measured
needs to be compensated. In such case, set the compensating equation and the coefficient.
IEC76-1(1976), IEEE C57.12.90-1993
Pc =
P
Urms
P1 + P2
Umn
2
IEC76-1(1993)
Pc = P 1 +
Umn – Urms
Umn
Pc: Corrected Power
P: Active power
Urms: True rms voltage
Umn: Voltage (rectified mean value calibrated to the rms value)
P1, P2: Coefficient as defined in the applicable standard
1-18
IM 760101-01E
1.5 Computation
The display format of the phase difference between the voltage and current of each
element can be selected. With the voltage of each element as a reference, one format
displays the phase difference using 360° in the clockwise direction, and the other format
displays a lead of 180° in the counter-clock wise direction and a lag of 180° in the
clockwise direction.
Equation for the Distortion Factor «For procedures, see section 7.6.»
The measurement functions, Uhdf, Ihdf, Phdf, Uthd, Ithd, and Pthd during harmonic
measurement have two defining equations that you can select from. For the equations,
see appendix 1.
IM 760101-01E
1-19
Explanation of Functions
Phase Difference «For procedures, see section 6.7.»
1
1.6
Integration
The WT1600 can integrate the active power (watt hour) and current (current hour).
During integration, the measured and computed values of normal measurements can be
displayed in addition to the watt hour, current hour, and integration time. However,
integration cannot be performed when the waveform display is turned ON.
Measurement Functions of Integration
Measurement Functions on Each Input Element
The following seven types of numerical data can be determined. For details on the
determination of each measurement function data, see appendix 1.
Wp (watt hour, sum of positive and negative watt hours), Wp+ (positive watt hour
consumed), Wp- (negative watt hour returned to the power supply (regenerated
energy)), q (current hour, sum of positive and negative current hours), q+ (positive
current hour consumed), q- (negative current hour returned to the power supply),
Time (integration time)
Measurement functions of the sum of input elements (Σ functions)
The following six types of numerical data can be determined. For details on the
determination of each measurement function data, see appendix 1.
WpΣ (sum of Wp), Wp+Σ (sum of Wp+), Wp-Σ (sum Wp-), qΣ (sum of q), q+Σ (sum of
q+), q-Σ (sum of q-)
Integration Mode «For procedures, see sections 6.8 and 6.9.»
Manual Integration Mode
Integration continues from the point when integration is started to the point it is
stopped. However, when the integration time reaches its maximum (10000 hours) or
the integration value reaches its maximum or minimum (±999999 MWh or ±999999
MAh), the integration is stopped and the integration time and integration value at that
point are held.
Hold
Hold
Integrated
value
Hold
When the maximum
integration time is
reached (999999 MWh
or 999999 MAh)
Hold
Integration
time
Start
1-20
Stop
Reset Start
When STOP is pressed
or when the maximum
integration time is reached
Reset
IM 760101-01E
1.6 Integration
Integrated
value
Hold
Hold
Integration
time
Timer setting
Start
Reset
Repetitive Integration Mode (Continuous Integration)
The integration time is set in relative time. When the specified time elapses, the
operation is automatically reset and restarted. Integration is repeated until STOP is
pressed. When the integration value reaches the maximum or minimum integration
display value. The integration time and value are held at that point.
Integrated
value
Hold
Integration
time
Hold
Timer
setting
Start
IM 760101-01E
Timer
setting
Timer
setting
STOP is
pressed Reset
1-21
Explanation of Functions
Normal Integration Mode
The integration time is set in relative time. The integration is stopped after the
specified time elapses or when the integration value reaches the maximum or
minimum integration display value. The integration time and value are held at that
point.
1
1.6 Integration
Real-time Normal Integration Mode
The start and stop of the integration operation is set through date and time. The
integration is stopped at the specified time or when the integration value reaches the
maximum or minimum integration display value. The integration time and value are
held at that point.
Hold
Integrated
value
Hold
Integration
time
Start
date/time
Stop
date/time
Reset
Real-time Repetitive Integration Mode (Continuous Integration)
The start and stop of the integration operation is set through date and time. The
integration is repeated at the specified timer setting during that time. When the time
specified by the timer elapses, the operation is automatically reset and restarted. The
integration is stopped at the specified time or when the integration value reaches the
maximum or minimum integration display value. The integration time and value are
held at that point.
Integrated
value
Hold
Integration
time
Hold
Timer
setting
Start
date/time
1-22
Timer
setting
Timer
setting
Stop
date/time
Reset
IM 760101-01E
1
Waveform Display
The WT1600 displays waveforms based on the data sampled within the data update rate.
Vertical (Amplitude) Axis
The vertical display range is determined based on the specified measurement range.
For example, if the crest factor is set to 3 and the voltage measurement range is set to
“100 Vrms,” then the display range is set so that the top of the screen is 300 Vpk (100
Vrms × 3) and the bottom is –300 Vpk (–100 Vrms × 3) with the zero input line at the
center. If the crest factor is set to 6 and the voltage measurement range is set to “50
Vrms,” then the display range is set so that the top of the screen is 300 Vpk (100 Vrms ×
6) and the bottom is –300 Vpk (–100 Vrms × 6) with the zero input line at the center.
However, the display range for a measurement range of 1000 V or 500 V when the crest
factor is set to 3 or 6, respectively, is within ±2000 V. The waveform clips if this range is
exceeded.
When the measurement range
is set to “100 Vrms”
300 Vpk
900 Vpk
When the same signal is measured
with the measurement range set to
“300 Vrms”
Zero input line
–300 Vpk
–900 Vpk
1 grid (1 div)
= 75 V
1 grid (1 div)
= 225 V
Horizontal (Time) Axis «For procedures, see section 9.2.»
Set the horizontal (time) axis by specifying the time per grid (1 division). The time axis
can be set in 1, 2, or 5 steps in the range up to the point in which the time
corresponding to one screen is equal to the data update rate. For example, if the data
update rate is 500 ms, the time per division can be changed in the order, 0.5 ms, 1
ms, 2 ms, 5 ms, 10 ms, 20 ms, and 50 ms.
1 grid (1 div) = 10 ms
100 ms
(Observation time)
1 grid (1 div) = 20 ms
200 ms
(Observation time)
During Normal Measurement
The time axis can be set in 1, 2, or 5 steps in the range up to the data update rate
according to the horizontal (time) axis setting described earlier. For example,
changing the time per division in the order 0.5 ms, 1 ms, 2 ms, 5 ms, 10 ms, 20 ms,
and 50 ms changes the time corresponding to one screen in the order 5 ms, 10 ms,
50 ms, 100 ms, 200 ms, and 500 ms.
IM 760101-01E
1-23
Explanation of Functions
1.7
1.7 Waveform Display
During Harmonic Measurement
The time corresponding to one screen in harmonic measurement is automatically
determined from the sample rate, which can be derived from the fundamental
frequency of the PLL source (see page 1-7), and the window width (time width over
which FFT analysis is performed when determining harmonics).
Note
Number of displayed points on the screen
When waveforms are displayed, the data points (waveform display data) are displayed in
segments called rasters. There are 501 rasters in the time axis direction on one screen.
On the other hand, data is sampled according to the sample rate, and one screen of the
sampled data becomes the data that is displayed on the screen as a waveform.
Because the number of display segments (number of displayed points) on the screen is
constant at 501 rasters while the number of sampled data points varies according to the time
corresponding to one screen, the following process is performed.
P-P compression is performed over a certain period along the time axis, the waveform display
data is determined, and the data is displayed. P-P compression refers to the determination of
the maximum and minimum values for each certain period. One raster will display these two
points.
Sampled data
Sampled data
P-P compression
Vertical axis
0
501 rasters
500
On the screen
Time axis
Aliasing
When the sample rate is comparatively low with respect to the input signal frequency, the
harmonics contained in the signal are lost. In this case, some of the harmonics will appear at
low frequencies due to the effects described by the Nyquist sampling theorem. This
phenomenon is called aliasing.
Aliased signal
Input signal
Sampling point
Retrieval of Waveform Display Data
The WT1600 retrieves waveform display data to the memory at a sample rate of
approximately 200 kS/s. The frequency that allows displaying of waveforms that are close to
the input signal is up to approximately 10 kHz.
1-24
IM 760101-01E
1.7 Waveform Display
Trigger is a cue used to display the waveform on the screen. The trigger is activated
when the specified trigger condition is met. At this point, the waveform is ready to be
displayed on the screen.
Trigger Source
Trigger source refers to the signal that is used in checking the trigger condition.
Trigger Slope
Slope refers to the movement of the signal from a low level to a high level (rising
edge) or from a high level to a low level (falling edge). When the slope is used as one
of the trigger conditions, it is called a trigger slope.
Trigger Level
Trigger level refers to the level through which the trigger slope passes.
When the slope of the trigger source passes through the specified trigger level on a
rising or falling edge, a trigger occurs. You can select the input signal of each
element or external clock input signal as a trigger source.
Trigger level
Trigger source
A trigger occurs at this point if rising
edge ( ) is selected (trigger point).
Trigger Mode
Trigger mode specifies the conditions for updating the screen display.
• Auto mode
If a trigger occurs within a specified amount of time (about 100 ms, referred to as
the timeout period), the waveform display is updated. If a trigger does not occur
within the timeout time, the display is automatically updated when the timeout time
elapses.
• Normal mode
The display is updated only when the trigger occurs. The display is not updated if
the trigger does not occur.
Trigger Point
Trigger point refers to the point at which a trigger occurred. The trigger point is
always at the left end of the screen. The waveform after the trigger point is displayed
from the left to the right of the screen as the time progresses.
Trigger point
Time
IM 760101-01E
1-25
Explanation of Functions
Trigger «For procedures, see section 9.3.»
1
1.7 Waveform Display
Zooming on the Waveform «For procedures, see section 9.4.»
Each displayed waveform can be expanded or reduced vertically by the zoom factor in
the range of 0.1 to 100. The waveform is zoomed around the zero input line.
300 Vpk
300 Vpk
When the zoom factor is set to ×2
150 Vpk
Range displayed
on the screen
Input zero line
–300 Vpk
–150 Vpk
–300 Vpk
Vertical Position of the Waveform «For procedures, see section 9.4.»
The displayed position of the waveform can be moved vertically to the desired position
such as when you wish to view the mutual relationship between the voltage and current
waveforms or when the section of the waveform you wish to view goes out of the display
frame.
100%
Move the
position by
50%
Move the
position by
–50%
–100%
Turning ON/OFF of the Waveform Display «For procedures, see section 9.5.»
The voltage and current waveforms corresponding to the element that has input modules
installed can be turned ON/OFF. This feature enables easy viewing of waveforms as
only the required waveforms can be displayed.
1-26
IM 760101-01E
1.7 Waveform Display
The screen can be evenly divided and the waveforms can be mapped to the divided
windows. The screen can be divided into up to four windows. This function is useful
when there are many waveforms on the screen. You can select the method of mapping
from the following list of choices:
• Auto
The waveforms that are turned ON are mapped in order according to the element
number to the divided windows, voltage first and then current.
• Fixed
The waveforms are mapped in order by element number in the order voltage and
current to the divided windows regardless of whether or not the display is turned ON.
• User
The waveforms can be mapped arbitrarily to the divided windows regardless of
whether or not the display is turned ON.
Display Interpolation of the Waveform «For procedures, see section 9.7.»
The waveform display data can be connected linearly to display the waveform smoothly.
Linear Interpolation
Linearly interpolates between two points.
Interpolation OFF
No interpolation is performed. Only the data points are displayed.
Graticule «For procedures, see section 9.7.»
A grid or cross scale can be displayed on the screen. You can also select not to display
the grid or cross scale.
Displaying Scale Values «For procedures, see section 9.8.»
The upper and lower limits of the vertical axis and the values at the left and right ends of
the horizontal axis (time axis) of each waveform can be turned ON or OFF.
IM 760101-01E
1-27
Explanation of Functions
Split Screen of the Waveform and Waveform Mapping
«For procedures, see section 9.6»
1
1.7 Waveform Display
Displaying Waveform Labels «For procedures, see section 9.8.»
Waveform labels can be turn ON or OFF.
Upper limit
Waveform label
Lower limit
Time at the right
end of the screen
Time at the left end of the screen
Cursor Measurement «For procedures, see sections 7.9, 9.9, and 10.7.»
The value at the crossing point of the waveform and cursor can be measured and
displayed. It can be used to measure the voltage and current of various sections of the
waveform and the data on the horizontal axis (X-axis). Cursor measurements are
performed on the data that is displayed on the screen.
Cursors are the “+” and “×” marks that are displayed on the screen. The vertical value
and the X-axis value from the left end of the screen for each cursor can be measured. In
addition, the difference in the vertical values and in the X-axis values between the
cursors can be measured.
Cursor +
Cursor x
Measured values
1-28
IM 760101-01E
1
Bar Graphs, Vectors, and Trend Displays
Bar graphs of harmonics of each order, vectors of the fundamental signal of each
element (during harmonic measurement), and trends of each measurement function can
be displayed.
Bar Graph Display of Harmonic Data «For procedures, see section 7.9.»
The amplitude of each harmonic can be displayed on the bar graph. The horizontal axis
represents harmonic order, and the vertical axis represents the amplitude of each
harmonic. The harmonic measurement functions, elements, and order to be displayed can
be specified. You can select the following harmonic measurement functions: U, I, P, S, Q,
λ, φU, φI, Z, Rs, Xs, Rp, and Xp. The screen can be divided into top and bottom halves
so that the bar graph can be displayed simultaneously with the numerical data.
Bar graph display of harmonic data
Cursor +
Cursor x
Measured values of
cursor + and x of
bar graph 1
Measured values of
cursor + and x of
bar graph 2
Harmonic order indicating
the cursor position.
Cursor + is at 1st order and
Cursor x is at 13th order.
Vector Display of Harmonics «For procedures, see section 7.10.»
During harmonic measurement, vectors can be displayed to show the relationship
between the phase difference and amplitude (rms value) of the fundamental signals U(1)
and I(1) of each element that is assigned to the selected wiring unit. The positive vertical
axis is set to 0 (angle 0), and the vector of each input signal is displayed. In addition,
you can zoom in on the vector or display the values of the amplitude and the phase
difference between the signals simultaneously.
The vector display is shown on the next page.
The elements that are to be displayed as vectors vary depending on the number of
installed input elements and the selected wiring pattern.
Explanation is given below for the case when the number of installed input elements is 5,
the wiring system pattern is three-phase, four-wire for ΣA and three-phase, three-wire for
ΣB.
When the target of the harmonic measurement is set to wiring unit ΣA, the target
elements are 1, 2, and 3. Vectors 1, 2, and 3 correspond to elements 1, 2, and 3,
respectively. The relationship between the phase difference and amplitude of U1(1),
U2(1), U3(1), I1(1), I2(1), and I3(1) is displayed as vectors.
When the target of the harmonic measurement is set to wiring unit ΣB, the target
elements are 4 and 5. Vectors 4 and 5 correspond to elements 4 and 5, respectively.
The relationship between the phase difference and amplitude of U4(1), U5(1), I4(1), and
I5(1) is displayed as vectors. The vectors for U6(1) and I6(1) are computed and
displayed.
IM 760101-01E
1-29
Explanation of Functions
1.8
1.8 Bar Graphs, Vectors, and Trend Displays
Vector display when the wiring system is 3P4W (three-phase, four-wire)
U1(1), U2(1), and U3(1) are common mode voltages. I1(1), I2(1), and I3(1) are line currents.
I1(1)
U1(1)
φ1(1),
φU1-I1
φU1-I2
φU1-I3
I3(1)
U2(1)
φ3(1)
U3(1)
φU1-U2
φ2(1)
φU1-U3
I2(1)
Vector display when the wiring system is 3V3A (three-voltage, three-current)
U1(1), U2(1), and U3(1) are line voltages. I1(1), I2(1), and I3(1) are line currents.
By moving the vectors, U1(1), U2(1),
and U3(1), (without changing their
orientations) so that the starting points
of vectors are all at the origin, the phase
relationship can be observed in the same
φU3-U1 fashion as the three-phase, four-wire system.
(The WT1600 does not provide a function for
moving the vectors.)
U3(1)
I1(1)
I1(1)
U1(1)
φU1-U2
I3(1)
U3(1)
U1(1)
φU1-U3
φ1(1),
φU1-I1
O
φU1-U2
φU1-I2
φU1-I3
U2(1)
I3(1)
φU2-U3
φ3(1)
I2(1)
The phase difference between the line voltages can
be determined from the phase difference measurement
functions φU1-U2 and φU1-U3.
φU1-U2 = This is the measurement function φU1-U2.
φU2-U3 = (φU1-U3) – (φU1-U2) – 180°
φU3-U1 = –(φU1-U3)
U2(1)
φ2(1)
I2(1)
Vector display when the wiring system is 3P3W (three-phase, three-wire)
U1(1), U2(1), and U3(1) are line voltages. I1(1), I2(1), and I3(1) are line currents.
However, U3(1) and I3(1) are not actually measured for the three-phase, three-wire
system. The vectors are displayed through computation.
I1(1)
U1(1)
U3(1)
O
I3(1)
U2(1)
I2(1)
1-30
IM 760101-01E
1.8 Bar Graphs, Vectors, and Trend Displays
The trends of all measurement functions that are measured during normal measurement
and harmonic measurement are displayed.
Trend Display Data
When the retrieval of waveform display data is OFF during normal measurement, the
numerical data of measurement functions that is determined for each data update rate
is P-P compressed* for each display segment (raster) and made into trend display
data.
When the retrieval of waveform display data is ON during normal measurement, the
numerical data of measurement functions that is determined each time a trigger
occurs is P-P compressed* for each display segment (raster) and made into trend
display data.
During harmonic measurement, the numerical data of the measurement function that
is automatically determined from the sample rate, which can be derived from the
fundamental frequency of the PLL source (see page 1-7), and the window width (time
width over which FFT analysis is performed when determining harmonics) is P-P
compressed* for each display segment (raster) and made into trend display data.
*
In some cases, P-P compression is not performed.
Split Screen Display and Assignments «For procedures, see section 10.4.»
Up to 16 lines (T1 through T16) of trends can be displayed. You can select the
measurement function of any element to be assigned to T1 through T16. During
harmonic measurement, you can also specify the harmonic order.
The screen is divided up to 4 windows and the trends that are turned ON are mapped
to the divided windows in order from T1 through T16.
Horizontal (Time) Axis «For procedures, see section 10.5.»
When the retrieval of waveform display data is OFF during normal measurement, the
time per division can be set in the range of 3 s to 1 day. When the retrieval of
waveform display data is ON during normal measurement or during harmonic
measurement, the value can be set in terms of the number of measurements per
division.
Setting the Scale «For procedures, see section 10.6.»
Auto scaling is provided in which the upper and lower limits of the screen are
determined automatically from the maximum and minimum values of the trend display
data. Manual scaling is also available in which the upper and lower limits can be set
arbitrarily as necessary.
Display Interpolation, Graticule, and Label Display
«For procedures, see sections 9.7 and 9.8.»
The settings specified for waveform display are used.
IM 760101-01E
1-31
Explanation of Functions
Trend Display
1
1.9
Saving and Loading Data and Other Functions
Storing and Recalling «For procedures, see chapter 11.»
The numerical data and waveform display data can be stored to the internal memory
(approximately 12 MB, or approximately 11 MB when using a WT1600 with ROM version
2.01 or later). The data is stored to the internal memory at the data update rate or the
specified time interval. In addition, the stored data can be saved to a floppy disk or builtin hard disk. The data that is saved to the built-in hard disk or floppy disk cannot be
recalled.
Saving and Loading to the Floppy Disk, Built-in Hard Disk, and External SCSI Device
«For procedures, see chapter 12.»
A floppy disk (FD) drive comes standard with the instrument. Additionally, a built-in hard
disk or SCSI can be installed as an option. The numerical data, waveform display data,
screen image data, and setup parameters can be saved to these media. The saved
setup parameters can be loaded as necessary. The screen image data can be pasted to
documents on a word-processing application.
SCSI
Built-in hard disk
WT1600
PC
SCSI device
Floppy disk
Printing on the Built-in Printer «For procedures, see chapter 14.»
The screen image, numerical data list, and bar graphs can be printed on the built-in
printer (option).
WT1600
Built-in printer
(option)
Ethernet Communications (Option) «For procedures, see chapter 13.»
The numerical data, waveform display data, screen image data, and setup parameters
can be saved to a device connected via the Ethernet interface or information about the
WT1600 can be transmitted.
Saving and Loading from an FTP Server on the Network (FTP Client Function)
The numerical data, waveform display data, screen image data, and setup parameters
can be saved to an FTP server* on the network in the same fashion as with the floppy
disk or external SCSI device. The saved setup parameters can also be loaded as
necessary.
*
PC or workstation on which the FTP server function is running.
File
WT1600
PC
1-32
IM 760101-01E
1.9 Saving and Loading Data and Other Functions
*
PC or workstation on which the FTP client function is running.
File
WT1600
PC
Outputting to a Network Printer (LPR Client Function)
The screen image can be printed to a network printer in the same fashion as with the
built-in printer.
WT1600
Printer
Sending Mail (SMTP Client Function)
The information of the WT1600 can be transmitted periodically to a specified mail
address.
WT1600
Mail
PC
GP-IB/Serial Communication «See the Communication Interface User’s Manual
IM760101-11E.»
Either a GP-IB interface or a serial interface (conforming to EIA-574 (9-pin EIA-232 (RS232)) comes standard with the WT1600 (specified at the time of purchase). The
measured data can be transferred to a PC for analysis or an external controller can be
used to control the instrument for making measurements.
PC
WT1600
Communication
interface
D/A Output (Option) «For procedures, see section 15.1.»
The numerical data can be output using a ±5 V FS DC analog voltage. Up to 30 items
can be specified for normal measurement and harmonic measurement, separately.
RGB Video Signal (VGA) Output «For procedures, see section 15.2.»
The RGB video signal (VGA, Video Graphics Array) can be output to an external
monitor. This allows values and waveforms to be displayed on a large screen.
Initialization «For procedures, see section 15.3.»
The settings entered using keys and soft keys can be initialized to factory default
condition. For details on the initial settings, see appendix 3, “List of Initial Settings and
Display Order of Numerical Data.”
IM 760101-01E
1-33
Explanation of Functions
Accessing the WT1600 from an FTP Client on the Network (FTP Server Function)
The WT1600 can be accessed from an FTP client* on the network, and files on the
floppy disk, built-in hard disk, and external SCSI device connected to the WT1600 can
be retrieved.
1
1.9 Saving and Loading Data and Other Functions
Zero-Level Compensation «For procedures, see section 15.4.»
Zero-level compensation refers to creating a zero input condition inside the WT1600 and
setting the level at that point as the zero level. Zero-level compensation must be
performed in order to satisfy the specifications of this instrument (see chapter 17). Zerolevel compensation is automatically performed when harmonic measurement is turned
ON/OFF or the measurement range or input filter is changed. However, if the harmonic
measurement ON/OFF setting, measurement range, and input filter are not changed
over an extended time, the zero level may change due to the changes in the
environment surrounding the instrument. In such case, you can manually perform zerolevel compensation. There is also a function that performs zero-level compensation
during integration.
NULL Function «For procedures, see section 15.5.»
When the NULL function is turned ON, Udc and Idc (numerical data of the simple
average of the voltage and current during normal measurement) are set as NULL values.
The NULL value is subtracted from the sampled data of voltage and current. Hence, all
measurement functions are affected by the NULL values.
Selecting the Message Language «For procedures, see section 15.6.»
The language of the error messages displayed on the screen during operation can be set
to English or Japanese.
Setting the Brightness of the Screen «For procedures, see section 15.6.»
The brightness of the LCD monitor can be adjusted.
Setting the Display Colors «For procedures, see section 15.7.»
The colors for graphical elements such as the waveform, background, scale, and cursor
and text elements such as the menu and the menu background can be selected. Set the
color using a ratio of red (R), green (G), and blue (B).
Self-Test Function «For procedures, see section 16.3.»
A self-test can be performed to check whether the instrument is operating properly.
Components such as the internal memory (ROM and RAM), the operation keys, the
floppy disk drive, and the built-in printer (option) can be tested.
Confirming the System Condition of the Instrument «For procedures, see section 16.4.»
The system condition of the instrument such as the model, ROM version (firmware
version), input element configuration, and existence of options can be confirmed.
1-34
IM 760101-01E
Chapter 2
2.1
Names and Uses of Parts
Front Panel, Rear Panel, and Top View
2
ESC key
Clears and escapes from
the current menu.
Jog shuttle
Used when selecting setup parameters and setting values.
(Section 2.2)
DIGITAL POWER METER
SELE
CT
SET
RE
DISPLAY
UPDATE
RATE
HOLD
FILE
SINGLE
ESC
STORE
STORE SET
TRIG'D
WAVE
COPY
MENU
REMOTE
HARMONICS
CURSOR
LOCAL
MISC
MAX HOLD
NULL
SHIFT
PUSH
LCD
Handle
Use the handles (both sides)
when moving the instrument.
(Section 3.1)
INPUT
RANGE
SCALING
WIRING
AVG
MEASURE
MOTOR SET
FILTER
CAL
INTEGRATOR
START
STOP
INTEG SET
RESET
SYNC
SRC
POWER
Power switch
(Section 3.10)
Floppy disk drive
Used when saving or loading data.
(Chapter 12)
Operation keys
Keys that are pressed first when
carrying out an operation.
Displays the first menu of the
corresponding key (setting).
(Section 2.2)
Built-in printer (option)
Prints screen images and numeric data list.
(Chapter 14)
Soft keys
Used when selecting setup
parameters in a menu.
Rear Panel
Voltage input terminal
Wire voltage measurement cables.
(Sections 3.6 to 3.9)
GP-IB or Serial (RS-232) connector
For details on communication functions, see
the Communication Interface User's Manual
(IM760101-11E).
Element 1 (Section 1.3)
Element 2
Element 3
Element 4
Element 5
Element 6
External clock input connector
Used when inputting the synchronization
signal of the measurement/computation
period. (Sections 6.2 and 7.4)
External start/stop signal
input/output connector
Used when performing master/slave
synchronized measurement.
(Section 5.10)
Ethernet connector (option)
Connect an Ethernet cable.
Current input terminal
(Section 13.1)
Wire current measurement
For details on communication functions, see
cables.
the Communication Interface User's Manual
(Sections 3.6, 3.8, and 3.9)
(IM760101-11E).
SCSI connector (option)
Torque signal input connector (option)
External SCSI devices are
Input signals from torque meters when
connected here.
evaluating motors. (Section 8.1)
(Section 12.3)
Power connector (Section 3.5)
Revolution signal input connector (option)
Input signals from revolution sensors when
Power fuse (Section 16.5)
evaluating motors. (Section 8.1)
RGB video signal (VGA) output connector
Outputs image signals. (Section 15.2)
D/A output connector (option).
Outputs numeric data that has been converted to
analog DC voltage. (Section 15.1)
Current sensor input connector
Connect the external sensor cable
from the external current sensor.
(Section 3.7)
1
U
2
U
3
U
4
U
5
U
6
U
START
D/A OUTPUT
TORQUE
STOP
EXT
EXT
EXT
EXT
EXT
EXT
TXD
LINK
SPEED
I
I
I
I
I
I
10Base-T
GP-IB or SERIAL
(IEEE488) (RS-232)
SCSI
VIDEO-OUT
(VGA)
IM 760101-01E
2-1
Names and Uses of Parts
Front Panel
2.1 Front Panel, Rear Panel, and Top View
Top View
Rear Panel
.........
Vent holes (Section 3.2)
(Vent holes are also present
on the bottom side.)
Front Panel
2-2
IM 760101-01E
2.2
Operation Keys, Jog Shuttle
2
Names and Uses of Parts
Common to All Functions
ESC key
Clears and escapes from the current menu.
RESET key
Press this key to reset the value to default.
SELECT key
Confirms the selection made using the jog shuttle or the set value.
SELE
CT
SET
RE
DISPLAY
HOLD UPDATE
RATE
FILE
TRIG'D
WAVE
HARMONICS
INPUT
MOTOR SET
AVG
START
STOP
INTEG SET
RESET
LOCAL MISC
MAX HOLD NULL
SHIFT
SHIFT key
After pressing SHIFT to light the indicator
above and to the left of SHIFT,
press an operation key to display the menu
corresponding to the item indicated below
the operation key.
Jog shuttle
Rotate the jog shuttle to select setup parameters or to set values.
It is also used to move the cursor.
The step size increases as the rotation angle of the shuttle ring increases.
(Shuttle ring)
RANGE SCALING WIRING
INTEGRATOR
MENU
REMOTE
CURSOR
FILTER
STORE COPY
STORE SET
SINGLE
ESC
MEASURE
CAL
SYNC
SRC
Arrow (< and >) keys
Moves along the digits of the value that is set by the jog shuttle or moves
the input position of the character string.
Soft keys
Press these keys to select the setup parameter on the displayed menu.
Set Measurement Conditions and Normal Measurement Mode
SHIFT+RANGE (MOTOR SET) key (option)
Sets items that are required in the motor evaluation such as torque,
number of rotations, and motor output. (Sections 8.2 to 8.7)
RANGE key
Sets the measurement range of voltage and current. (Sections 5.2 and 5.3)
HOLD key
Puts the instrument in a held condition. (Section 5.8)
SHIFT+HOLD (SINGLE) key
Performs a single measurement. (Section 5.8)
UPDATE RATE key
SELE
SET
CT
Sets the data update rate. (Section 5.7)
RE
DISPLAY HOLD UPDATE
FILE STORE COPY
RATE
STORE SET
SINGLE
ESC
TRIG'D
WAVE
CURSOR
MENU
REMOTE
HARMONICS
LOCAL MISC
MAX HOLD NULL
SHIFT
SHIFT+MISC (NULL) key
Activates the NULL function. (Section 15.5)
SHIFT+LOCAL (MAX HOLD) key
Holds the maximum value of the numeric data. (Section 5.9)
INPUT
RANGE SCALING WIRING
MOTOR SET
FILTER
AVG
INTEGRATOR
START
STOP
INTEG SET
RESET
MEASURE
CAL
SYNC
SRC
FILTER key
Set the input filter.
(Section 5.5)
SCALING key
Sets the transformation ratio, PT ratio, CT ratio, and power coefficient
of the current sensor. (Sections 5.3 and 5.4)
WIRING key
Sets the wiring system. (Section 5.1)
MEASURE key
Sets the target frequency to be measured, user-defined functions,
delta computation, the equation for apparent power and corrected power,
the display format of the phase difference, master/slave synchronized
measurement and other settings. (Sections 5.10 and 6.3 to 6.7)
SHIFT+MEASURE (CAL) key
Performs zero-level compensation. (Section 15.4)
AVG key
Sets the averaging function. (Section 5.6)
SYNC SRC key
Sets the synchronization source used to determine the measurement period.
(Section 6.2)
IM 760101-01E
2-3
2.2 Operation Keys, Jog Shuttle
Set Integration and Harmonics Measurement
SELE
CT
SET
RE
DISPLAY
HOLD UPDATE
RATE
FILE
TRIG'D
STORE COPY
STORE SET
SINGLE
ESC
MENU
REMOTE
WAVE
HARMONICS
LOCAL MISC
MAX HOLD NULL
CURSOR
SHIFT
HARMONICS key
Sets various parameters for harmonic measurement.
(Sections 7.1 and 7.3 to 7.7)
INPUT
RANGE SCALING WIRING
MOTOR SET
FILTER
AVG
MEASURE
CAL
INTEGRATOR
START
STOP
INTEG SET
RESET
SYNC
SRC
START key
Starts integration. (Section 6.11)
STOP key
Stops integration. (Section 6.11)
SHIFT+STOP (RESET) key
Resets the integrated result (integrated value and integration time).
(Section 6.11)
SHIFT+START (INTEG SET) key
Sets the integration mode and timer. (Sections 6.8 to 6.10)
Set the Display
DISPLAY key
Sets the display format for numerical data, waveforms, bar graphs, vectors,
trends, and others. (Chapter 4, sections 6.1, 7.2, 7.9, 7.10, 9.5 to 9.8, and
chapter 10)
SELE
CT
SET
RE
DISPLAY
HOLD UPDATE
RATE
FILE
TRIG'D
WAVE
CURSOR
STORE COPY
STORE SET
SINGLE
ESC
MENU
REMOTE
HARMONICS
LOCAL MISC
MAX HOLD NULL
SHIFT
SHIFT+WAVE (CURSOR) key
Performs cursor measurement. (Sections 7.9, 9.9 and 10.7)
INPUT
RANGE SCALING WIRING
WAVE key
Sets the acquisition conditions of waveform display data. (Sections 9.1 to 9.4)
MOTOR SET
FILTER
AVG
INTEGRATOR
2-4
START
STOP
INTEG SET
RESET
MEASURE
CAL
SYNC
SRC
IM 760101-01E
2.2 Operation Keys, Jog Shuttle
Store and Recall Data, Save and Load Data, Set Ethernet Communications and Other
Functions
Names and Uses of Parts
FILE key
Formats disks, saves setup parameters, waveform display data,
numerical data, and screen image data, loads setup parameters,
changes file attributes, deletes files, copies files, renames
directories/files, and creates directories. (Chapter 12)
STORE key
Executes store operation. (Sections 11.4 and 11.6)
SELE
CT
SET
RE
DISPLAY
HOLD UPDATE
RATE
FILE
TRIG'D
WAVE
CURSOR
STORE COPY
STORE SET
SINGLE
ESC
MENU
REMOTE
HARMONICS
LOCAL MISC
MAX HOLD NULL
SHIFT
COPY key
Saves and prints screen image data.
(Sections 12.7, 13.3, and 14.2)
SHIFT+COPY (MENU) key
Feeds printer paper, sets the saving or printing of
screen image data and numerical data list.
(Section 12.6 and chapter 14)
SHIFT+STORE (STORE SET) key
Sets store and recall operations. (Chapter 11)
INPUT
RANGE SCALING WIRING
MOTOR SET
FILTER
AVG
INTEGRATOR
START
STOP
INTEG SET
RESET
MEASURE
CAL
SYNC
SRC
MISC key
Confirms or initializes the system conditions, sets GP-IB and serial
communications, sets the date and time, selects the message
language, sets the brightness of screen, performs self-tests, sets
displayed colors, selects the crest factor, sets key lock, changes
SCSI ID numbers, sets Ethernet communications, and sets D/A
output.
(Sections 3.11, 5.11, 12.4, chapter 13, sections 15.1, 15.3, 15.6,
15.7, 15.8, 16.3, and 16.4)
For details on setting the GP-IB and serial communications, see
the Communication Interface User's Manual (IM760101-11E).
SHIFT + MISC (NULL) key
Sets the NULL function. (Section 15.5)
LOCAL key
See the Communication Interface User's Manual (IM760101-11E).
IM 760101-01E
2
2-5
Chapter 3
3.1
Before Starting Measurements
Precautions Concerning the Use of the
Instrument
Safety Precautions
General Handling Precautions
Do Not Place Objects on Top of the Instrument
Never stack the instruments or place other instruments or any objects containing
water on top of the instrument. Such act can lead to malfunction.
Keep Electrically Charged Objects Away from the Instrument
Keep electrically charged objects away from the input terminals. They may damage
the internal circuitry.
Do Not Damage the LCD
The LCD is very vulnerable to scratches. Therefore, be careful not to damage the
surface with sharp objects. Also, do not apply vibration or shock to it.
When Not Using the Instrument for a Extended Time
Turn OFF the power to the measurement circuit and the instrument and remove the
power cord from the outlet.
When Carrying the Instrument
First, turn OFF the devices under measurement and remove the measurement cables.
Then, turn OFF the instrument and remove power and other cables. To carry the
instrument, use the handle or carry it using both hands.
Cleaning
When cleaning the case or the operation panel, first turn OFF the circuit under
measurement and the instrument and remove the instrument’s power cord from the
outlet. Then, wipe with a dry, soft cloth. Do not use volatile chemicals as this may
cause discoloring and deformation.
IM 760101-01E
3-1
3
Before Starting Measurements
Safety Precautions
If you are using this instrument for the first time, make sure to thoroughly read the
“Safety Precautions” given on pages vi to vii.
Do Not Remove the Case
Do not remove the case from the instrument. Some sections inside the instrument
have high voltages that are extremely dangerous. For internal inspection or
adjustment, contact your nearest YOKOGAWA dealer.
Abnormal Behavior
Stop using the instrument if there are any symptoms of trouble such as strange odors
or smoke coming from the instrument. If these symptoms occur, immediately turn
OFF the power and unplug the power cord. In addition, turn OFF the power to the
measurement circuits that are connected to the input terminals. Then, contact your
nearest YOKOGAWA dealer.
Power Cord
Nothing should be placed on top of the power cord. The power cord should also be
kept away from any heat sources. When unplugging the power cord from the outlet,
never pull by the cord itself. Always hold and pull by the plug. If the power cord is
damaged, check the part number indicated on page iii and purchase a replacement.
3.2
Installing the Instrument
Installation Conditions
Install the instrument in a place that meets the following conditions.
Flat, Even Surface
If the instrument is not installed on a stable horizontal surface, the printer’s recording
quality may degrade and precise measurements may be impeded.
Well-Ventilated Location
Vent holes are located on the top and bottom of the instrument. To prevent internal
overheating, allow at least 20 mm of space around the vent holes.
When connecting measurement wires and other various cables or when opening or
closing the built-in printer cover, allow extra space for operation.
Ambient Temperature and Humidity
Ambient temperature: 5 to 40°C
Ambient humidity:
20 to 80%RH (when the printer is not used)
35 to 80%RH (when the printer is used)
No condensation in either case.
Do Not Install the Instrument in the Following Places:
• In direct sunlight or near heat sources.
• Where an excessive amount of soot, steam, dust, or corrosive gas is present.
• Near strong magnetic field sources.
• Near high voltage equipment or power lines.
• Where the level of mechanical vibration is high.
• In an unstable place.
Note
•
•
•
For the most accurate measurements, use the instrument in the following environment.
Ambient temperature: 23±3°C Ambient humidity: 30 to 75%RH (no condensation)
When using the instrument in a place where the ambient temperature is 5 to 20°C or 26 to
40°C, add the temperature coefficient to the accuracy as specified in chapter 17.
When installing the instrument in a place where the ambient humidity is 30% or below, take
measures to prevent static electricity such as using an anti-static mat.
Condensation may occur if the instrument is moved to another place where the ambient
temperature is higher, or if the temperature changes rapidly. In this case, let the instrument
adjust to the new environment for at least an hour before using the instrument.
Storage Location
When storing the instrument, avoid the following places:
• Where the relative humidity is 80% • Where the level of mechanical vibration is
or more.
high.
• In direct sunlight.
• Where corrosive or explosive gas is present.
• Where the temperature is 60°C
• Where an excessive amount of soot, dust,
or higher.
salt, and iron are present.
• Near a high humidity or heat source. • Where water, oil, or chemicals may splash.
It is recommended that the instrument be stored in an environment where the
temperature is between 5 and 40°C and the relative humidity is between 20 and 80%.
3-2
IM 760101-01E
3.2 Installing the Instrument
Installation Position
Desktop
Place the instrument on a flat, even surface as shown in the figure below. If the
instrument is installed in a horizontal position, rubber feet can be attached to prevent
slipping. Two sets (four pieces) of rubber feet are included in the package.
Before Starting Measurements
Rack Mount
To rack mount the instrument, use the rack mount kit that is sold separately.
Name
Model
Notes
Rack mount kit
Rack mount kit
751535-E4
751535-J4
For EIA
For JIS
An outline of the attachment procedures is given below. For details regarding the
attachment procedures, see the instructions that are included with the rack mount kit.
1.
Remove the handles on both sides of the instrument.
2.
Remove the four feet on the bottom of the instrument.
3.
Remove the two plastic rivets and the four seals covering the rack mount
attachment holes on both sides of the instrument near the front.
4.
Places seals over the feet and handle attachment holes.
5.
Attach the rack mount kit.
6.
Mount the instrument on the rack.
Note
•
•
IM 760101-01E
3
When rack mounting the instrument, allow at least 20 mm of space around the vent holes to
prevent internal overheating.
Make sure to have adequate support for the bottom of the instrument. However, do not block
the vent holes in the process.
3-3
3.3
Wiring Precautions
To prevent the possibility of electric shock and damage to the instrument, follow the
warnings below.
WARNING
• Employ protective earth ground before connecting measurement cables.
• Turn OFF the power to the measurement circuit, when wiring the circuit. Connecting or
removing measurement cables while the power is turned ON is dangerous.
• Take special caution not to wire a current circuit to the voltage input terminal or
a voltage circuit to the current input terminal.
• Strip the insulation cover of the measurement cable so that when it is wired to
the input terminal, the conductive parts (bare wires) do not protrude from the
terminal. Also, make sure to fasten the input terminal screws securely so that
the cable does not come loose.
• Use cables with safety terminals that cover the conductive parts for connecting
to the voltage input terminals. Using a terminal with bare conductive parts (such
as a banana plug) is dangerous when the terminal comes loose.
• Use cables with safety terminals that cover the conductive parts for connecting
to the current sensor input terminals. Using a terminal with bare conductive
parts is dangerous when the terminal comes loose.
• When the voltage of the circuit under measurement is being applied to the current
input terminals, do not touch the current sensor input terminals. Since these
terminals are electrically connected inside the instrument, this act is dangerous.
• When connecting measurement cables from an external current sensor to the current
sensor input connector, remove the cables connected to the current input terminals. In
addition, when the voltage of the circuit under measurement is being applied to the
current sensor input terminal, do not touch the current input terminals. Since these
terminals are electrically connected inside the instrument, this act is dangerous.
• When using the external potential transformer (PT) or current transformer (CT), make
sure it has enough withstand voltage with respect to the voltage (U) being measured
(2U + 1000 V recommended). Also, make sure that the secondary side of the CT does
not become an open circuit while the power is being applied. Otherwise, high voltage
will appear at the secondary side of the CT, making it extremely dangerous.
• When using an external current sensor, make sure to use a sensor that comes in a
case. The conductive parts and the case should be insulated, and the sensor should
have enough withstand voltage with respect to the voltage being measured. Using a
bare sensor is dangerous, because you might accidentally come in contact with it.
• When using a shunt-type current sensor as an external current sensor, turn OFF
the circuit under measurement. Connecting or removing a sensor while the
power is ON is dangerous.
• When using a clamp-type current sensor as an external current sensor, have a
good understanding of the voltage of the circuit under measurement and the
specifications and handling of the clamp-type sensor. Then, confirm that there
are no shock hazards.
• For safety reasons, when using the instrument on a rack mount, furnish a switch
for turning OFF the circuit under measurement from the front side of the rack.
• After connecting the measurement cable, attach the current input protection
cover using the 4 screws provided for your safety. Make sure that the
conductive parts are not exposed from the protection cover.
3-4
IM 760101-01E
3.3 Wiring Precautions
• To make the protective functions effective, check the following items before
applying the voltage or current of the circuit under measurement.
• The power cable provided with the instrument is used to connect to the power
supply and the instrument is grounded.
• The power switch of the instrument is turned ON.
• The current input protective cover provided with the instrument is being used.
• When the power switch of the instrument is turned ON, do not apply a signal
that exceeds the following values to the voltage or current input terminals.
When the instrument is turned OFF, turn OFF the circuit under measurement.
For other input terminals, see the specifications of each module in chapter 17.
Instantaneous Maximum Allowable Input (1 cycle, for 20 ms)
3
Before Starting Measurements
Voltage Input
Peak value of 4000 V or RMS value of 1500 V, whichever is less.
Current Input
5-A input element
Peak value of 30 A or RMS value of 15 A, whichever is less.
50-A input element
Peak value of 450 A or RMS value of 300 A, whichever is less.
Continuous Maximum Allowable Input
Voltage Input
Peak value of 1500 V or RMS value of 1000 V, whichever is less.
Current Input
5-A input element
Peak value of 10 A or RMS value of 7 A, whichever is less.
50-A input element
Peak value of 150 A or RMS value of 50 A, whichever is less.
CAUTION
• Use measurement cables that have adequate margins of withstand voltage and
current capacity with respect to the voltage or current being measured. It should
also have proper ratings that are suited to the measurement.
Example: When making measurements on a current of 20 A, use copper wires
that have a conductive cross-sectional area of 4 mm2.
• When the measurement cable is connected, it may cause radio interference in
which case the user may be required to take adequate measures.
Note
•
•
•
•
•
•
•
IM 760101-01E
After wiring, the wiring system must be selected. See section 5.1, “Selecting the Wiring System.”
When measuring large currents or voltages or currents that contain high frequency
components, take special care in dealing with mutual interference and noise when wiring.
Keep the measurement cables as short as possible to minimize the loss between the circuit
under measurement and the instrument.
The thick lines on the wiring diagrams shown in sections 3.6 and 3.9 are the sections where
the current flows. Use appropriate wires that are suitable for the current.
In order to make accurate measurements of the voltage of the circuit under measurement,
connect the cable to the circuit as close as possible.
In order to make correct measurements, separate the measurement cables as far away from
the earth ground wires and the instrument’s case as possible to minimize the static
capacitance to earth ground.
To more accurately measure apparent power and power factor in three-phase unbalanced
circuits, we recommend the three-voltage three-current (3V3A) measurement method.
3-5
3.4
For Making Accurate Measurements
Effects of Power Loss
By using an appropriate wiring system that matches the load, the effects of power loss
on measurement accuracy can be minimized. We will consider the current source
(SOURCE) and load resistance (LOAD) below.
• When the Measurement Current Is Relatively Large
Wire so that the voltage measurement circuit is connected to the load side. The
current measurement circuit measures the sum of current iL flowing through the load
of the circuit under measurement and the current iV flowing through the voltage
measurement circuit. Because the current flowing through the circuit under
measurement is iL, iV is the amount of error. The input resistance of the voltage
measurement circuit of the instrument is approximately 2 MΩ. If the input is 1000 V,
iV is approximately 0.5 mA (1000 V/2 MΩ). If the load current, iL, is 5 A or more (load
resistance is 200 Ω or less), then the effect of iV on the measurement is 0.01% or
less. If the input is 100 V and 5 A, iV = 0.05 mA (100 V/2 MΩ) then the effect of iV on
the measurement accuracy is 0.001% (0.05 mA/5 A).
LOAD
SOURCE
SOURCE
U
iV
U
±
LOAD
±
I
±
iL
±
Input terminal
(ELEMENT)
I
WT1600
As a reference, the relationship of the voltages and currents that produce effects of
0.1%, 0.01%, and 0.001% are shown in the figure below.
0.1% Effect
0.01% Effect
Measured voltage (V)
1000
800
600
400
Smaller effect
0.001% Effect
200
0
0
1
2
3
4
5
6
7
8
9
10
Measured current (A)
0.5A
• When the Measurement Current Is Relatively Small
Wire so that the current measurement circuit is connected to the load side. In this case,
the voltage measurement circuit measures the sum of the load voltage eL and voltage
drop eI across the current measurement circuit. eI is the amount of error in this case.
The input resistance of the current measurement circuit of the instrument is 100 mΩ and
2 mΩ for the 5-A and 50-A input terminals, respectively. For example, if the load
resistance is 1 kΩ, then the effects on the measurement accuracy is 0.01% for the 5-A
input terminal (100 mΩ/1 kΩ) and 0.0002% for the 50-A input terminal (2 mΩ/1 kΩ).
SOURCE
LOAD
U
eL
±
±
I
eI
WT1600
3-6
IM 760101-01E
3.4 For Making Accurate Measurements
Effects of Stray Capacitance
The effects of stray capacitance on the measurement accuracy can be minimized by
connecting the current input terminal of the instrument to the side that is close to the
earth potential of the power source (SOURCE).
Shielded case of the voltage
measurement circuit
U
Cs
±
Outer case
Earth
I
Cs
±
Shielded case of the current
measurement circuit
For example, we will consider the case when one side of the power source and the outer
case are grounded.
In this case, two current flows can be considered, load current iL and the current that flows
through the stray capacitance iCs. iL flows through the current measurement circuit, then through
the load, and returns to the power source (shown with a dotted line). iCs flows through the current
measurement source, through the stray capacitance, and then through the earth ground of the
outer case, and returns to the power source (shown with a dot-dash line).
Therefore, the current measurement circuit ends up measuring the sum of iL and iCs even
though it wants to measure only iL. iCs is the amount of error in this case. If the voltage
applied to Cs is VCs (common mode voltage), then iCs can be found using the following
equation. Because the phase of iCs is ahead of the voltage by 90° the effects of iCs on
the measurement accuracy increases as the power factor gets smaller.
iCs = VCs × 2πf × Cs
iL
U
±
I
iCs
LOAD
Cs
iL
SOURCE
±
iL
iCs
IM 760101-01E
When measuring high frequencies as in this instrument, this error, iCs, cannot be ignored.
By connecting the current input terminal of the instrument to the side that is close to the
earth potential of the power source (SOURCE), the terminal of the current measurement
circuit of the instrument approaches the earth potential. Thus, VCs becomes
approximately zero and very little iCs flows.
3-7
3
Before Starting Measurements
The internal structure of the instrument is as follows.
The voltage and current measurement circuits are each enclosed in shielded cases. These
shielded cases are placed inside the outer case. The shielded case of the voltage measurement
circuit is connected to the ± terminal of the voltage input terminal and the shielded case of the
current measurement circuit is connected to the ± terminal of the current input terminal.
Because the outer case is insulated from the shielded case, stray capacitance Cs of
approximately 100 pF exists. The current generated by this stray capacitance, Cs, will
cause errors.
3.5
Connecting the Power Supply
Before Connecting the Power
To prevent the possibility of electric shock and damage to the instrument, follow the
warnings below.
WARNING
• Connect the power cord only after confirming that the voltage of the power
supply matches the rated electric power voltage for the instrument.
• Connect the power cord after checking that the power switch of the instrument is
turned OFF.
• To prevent the possibility of electric shock or fire, always use the power cord
supplied by YOKOGAWA.
• Make sure to perform protective grounding to prevent the possibility of electric
shock. Connect the power cord to a three-pin power outlet with a protective
earth terminal.
• Do not use an extension cord without protective earth ground. Otherwise, the
protection function will be compromised.
• Use a power outlet compatible with the accessory power cord and ensure
proper protective grounding. Do not use the instrument if no such compatible
power outlet and proper protective grounding are available.
Connecting the Power Cord
1.
2.
3.
Check that the power switch is OFF.
Connect the power cord plug to the power connector on the rear panel. (Use
the power cord that came with the package.)
Connect the plug on the other end of the power cord to the outlet that meets the
conditions below. The AC outlet must be of a three-pin type with a protective
earth ground terminal.
Item
Specification
Rated supply voltage
Permitted supply voltage range
Rated supply voltage frequency
Permitted supply voltage frequency range
Maximum power consumption (when using the printer)
100 to 120 VAC, 200 to 240 VAC
90 to 132 VAC, 180 to 264 VAC
50/60 Hz
48 to 63 Hz
150 VA
3-pin outlet
Power cord
(included in the package)
3-8
IM 760101-01E
3.6
Directly Wiring the Circuit under Measurement
The measurement cable is wired directly from the circuit under measurement to the
voltage/current input terminal.
To prevent the possibility of electric shock and damage to the instrument, follow the
precautions given in section 3.3, “Wiring Precautions.”
3
• Voltage Input Terminal
The terminal is a φ4-mm safety banana jack (female).
Insert the safety terminal (the conductive parts are not exposed) into the voltage input
terminal.
• Current Input Terminal
• When the voltage of the circuit under measurement is being applied to the current
input terminals, do not touch the current sensor input terminals. Since these
terminals are electrically connected inside the instrument, this act is dangerous.
• When connecting measurement cables from an external current sensor to the
current sensor input connector, remove the cables connected to the current input
terminals. In addition, when the voltage of the circuit under measurement is being
applied to the current sensor input terminal, do not touch the current input
terminals. Since these terminals are electrically connected inside the instrument,
this act is dangerous.
• The terminal is a binding post. The screws used on the terminal (binding post) are
M6 screws. Either wind the wire around the screw or pass the crimp-on lugs
through the screw axis, then tighten firmly by holding the terminal knob.
3.1
2.1
6
7
Unit: mm
Number of Installed Input Elements and Wiring Systems
The selectable wiring systems vary depending on the number of input elements that are
installed in the instrument. You may be able to select only a single type of wiring system
or two or three types of wiring systems. For details, see “Number of Installed Input
Elements and Wiring Systems” in section 1.3, “Measurement Conditions.”
IM 760101-01E
3-9
Before Starting Measurements
Connecting to the Input Terminal
3.6 Directly Wiring the Circuit under Measurement
Note
•
•
After wiring, the wiring system must be selected. See section 5.1, “Selecting the Wiring System.”
The thick lines on the wiring diagrams are the sections where the current flows. Use
appropriate wires that are suitable for the current.
Wiring Example of a Single-Phase, Two-Wire System (1P2W)
If there are six input elements, six single-phase, two-wire systems can be set up.
LOAD
SOURCE
U
U
±
SOURCE
U1
±
I
±
I1
±
LOAD
I
Input terminal
LOAD
SOURCE
I
U
±
I1
±
U
U1
SOURCE
±
LOAD
I
±
Input terminal
Wiring Example of a Single-Phase, Three-Wire System (1P3W)
• If there are six input elements, three single-phase, three-wire systems can be set up
(elements 1 and 2, elements 3 and 4, and elements 5 and 6).
• The assignment of elements to the input terminals in the figure varies depending on
the number of installed input elements. For details, see “Number of Installed Input
Elements and Wiring Systems” in section 1.3, “Measurement Conditions.”
LOAD
SOURCE
I
I1
±
N
U
U1
U
±
U
±
I
I
±
±
Input terminal 1
3-10
SOURCE
N
±
±
U2
LOAD
U
I2 ±
I
Input terminal 2
IM 760101-01E
3.6 Directly Wiring the Circuit under Measurement
Wiring Example of a Three-Phase, Three-Wire System (3P3W)
• If there are six input elements, three three-phase, three-wire systems can be set up
(elements 1 and 2, elements 3 and 4, and elements 5 and 6).
• The assignment of elements to the input terminals in the figure varies depending on
the number of installed input elements. For details, see “Number of Installed Input
Elements and Wiring Systems” in section 1.3, “Measurement Conditions.”
I
LOAD
SOURCE
±
I1
U
R
U1
SOURCE
U
±
U
±
I
I
T
LOAD
S
I
I2
±
U
U2
±
±
Input terminal 1
±
±
Input terminal 2
Wiring Example of a Three-Voltage, Three-Current System (3V3A)
• If there are six input elements, two three-voltage, three-current systems can be set up
(elements 1, 2, and 3 and elements 4, 5, and 6).
• The assignment of elements to the input terminals in the figure varies depending on
the number of installed input elements. For details, see “Number of Installed Input
Elements and Wiring Systems” in section 1.3, “Measurement Conditions.”
R
S
T
LOAD
SOURCE
I I1 ±
R
U
±
U
±
U
±
I
I
I
±
±
±
SOURCE
T
U
U
U3 U1
±
±
S
I
I2 ±
I
I3 ±
U2
LOAD
U
±
Input terminal 1 Input terminal 2 Input terminal 3
Wiring Example of a Three-Phase, Four-Wire System (3P4W)
• If there are six input elements, two three-phase, four-wire systems can be set up
(elements 1, 2, and 3 and elements 4, 5, and 6).
• The assignment of elements to the input terminals in the figure varies depending on
the number of installed input elements. For details, see “Number of Installed Input
Elements and Wiring Systems” in section 1.3, “Measurement Conditions.”
R
S
T
N
LOAD
SOURCE
I
U
±
U
±
U
±
I
I
I
±
±
±
I1
±
U
U1
SOURCE N
±
±
±
T
S
U3 U2
U
U
I2 ±
I
R
LOAD
I I3 ±
Input terminal 1 Input terminal 2 Input terminal 3
Note
For the relationship between the wiring systems and the method of determining the measured
values or computed values, see Appendix 1, “Symbols and Determination of Measurement
Functions.”
IM 760101-01E
3-11
Before Starting Measurements
R
S
T
3
3.7
Using an External Current Sensor to Wire the
Circuit under Measurement
To prevent the possibility of electric shock and damage to the instrument, follow the
precautions given in section 3.3, “Wiring Precautions.”
• As shown below, when the maximum current value of the circuit under measurement
exceeds the maximum range of the input element, an external sensor can be
connected to the current sensor input connector in order to measure the current of the
circuit under measurement.
• 5-A input element
When the maximum current exceeds “5 Arms.”
• 50-A input element
When the maximum current exceeds “50 Arms.”
• A shunt-type or clamp-type current sensor can be used for an external current sensor.
Connecting to the Current Sensor Input Connector
Connect an external sensor cable with the BNC connector (B9284LK, sold separately) to
the current sensor input connector.
When connecting the external sensor cable, remove the measurement cable from the
current input terminal. Since the current sensor input connector and the current input
connector are connected internally, measurement inaccuracies or malfunction could
result. In addition, when the voltage of the circuit under measurement is being applied to
the current sensor input terminals, do not touch the other current input terminals or
current sensor terminals. Since these terminals are electrically connected inside the
instrument, doing so can be dangerous.
Number of Installed Input Elements and Wiring Systems
The selectable wiring systems vary depending on the number of input elements that are
installed in the instrument. You may be able to select only a single type of wiring system
or two or three types of wiring systems. For details, see “Number of Installed Input
Elements and Wiring Systems” in section 1.3, “Measurement Conditions.”
3-12
IM 760101-01E
3.7 Using an External Current Sensor to Wire the Circuit under Measurement
Note
•
•
•
•
•
•
Shunt-type current sensor Area of space created by the connection wires
OUT H
External sensor cable
I
WT1600
±
OUT L
•
Shielded wire
For a shunt-type current sensor, connect it to the power earth ground side as shown in the
figure below. If you have to connect the sensor to the non-earth side, use a wire that is
thicker than AWG18 (conductive cross-sectional area of approx. 1 mm2) between the sensor
and the instrument to reduce the effects of common mode voltage. Take safety and error
reduction in consideration when constructing an external sensor cable.
V
Voltage input
± terminal
LOAD
Current sensor input
connector
Shunt-type current sensor
•
When the circuit under measurement is not grounded and the signal is high in frequency or
large in power, the effects of the inductance of the connection cable for the shunt-type current
sensor become large. In these cases, use an isolation sensor (CT, DC-CT, or clamp) for the
measurements.
Clamp-type current sensor
V
Voltage input
± terminal
LOAD
Current sensor input
connector
IM 760101-01E
3-13
3
Before Starting Measurements
•
After wiring, the wiring system must be selected. See section 5.1, “Selecting the Wiring
System.”
The thick lines on the wiring diagrams are the sections where the current flows. Use
appropriate wires that are suitable for the current.
To more accurately measure apparent power and power factor in three-phase unbalanced
circuits, we recommend the three-voltage three-current (3V3A) measurement method.
The current sensor input transformation function can be used to transform the input signal to
data that correspond to direct measurements. For the procedures, see section 5.3, “Setting
the Measurement Range When Using an External Current Sensor.”
Note that the frequency and phase characteristics of the external current sensor affect the
measured data.
Make sure you have the polarities correct when making the connections. Otherwise, the
polarity of the measurement current will be reversed and correct measurements cannot be
made. Be especially careful when connecting the clamp type current sensor, because it is
easy to reverse the connection.
To minimize error when using a shunt-type current sensor, note the following points when
connecting the external sensor cable.
• Connect the shielded wire of the external sensor cable to the L side of the shunt output
terminal (OUT).
• Minimize the area created between the wires connecting the current sensor to the external
sensor cable. The effects due to the line of magnetic force (caused by the measurement
current) and noise that enter this area of space can be reduced.
3.7 Using an External Current Sensor to Wire the Circuit under Measurement
The following wiring examples are for connecting shunt-type current sensors. When
connecting a clamp-type current sensor, replace the shunt-type current sensor with the
clamp-type. In addition, the assignment of elements to the input terminals in the
following figure varies depending on the number of installed input elements. For details,
see “Number of Installed Input Elements and Wiring Systems” in section 1.3,
“Measurement Conditions.”
Wiring Example of a Single-Phase, Two-Wire System (1P2W) Using a Shunt-Type
Current Sensor
LOAD
SOURCE
Shunt-type current sensor
±
I
Earth
side
OUT L
OUT H
U
±
Input terminal
Current sensor input
connector (EXT)
Wiring Example of a Single-Phase, Three-Wire System (1P3W) Using a Shunt-Type
Current Sensor
SOURCE
I
OUT H
LOAD
±
OUT L
N
I
OUT H
U
±
±
OUT L
U
±
Input terminal 1
Current sensor input
connector (EXT)
Input terminal 2
Current sensor input
connector (EXT)
Wiring Example of a Three-Phase, Three-Wire System (3P3W) Using a Shunt-Type
Current Sensor
SOURCE
I
LOAD
±
R
OUT H
OUT L
I
±
S
OUT H
OUT L
T
U
±
Input terminal 1
Current sensor input
connector (EXT)
3-14
U
±
Input terminal 2
Current sensor input
connector (EXT)
IM 760101-01E
3.7 Using an External Current Sensor to Wire the Circuit under Measurement
Wiring Example of a Three-Voltage, Three-Current System (3V3A) Using a Shunt-Type
Current Sensor
SOURCE
S
LOAD
±
I
R
3
±
I
T
I
±
OUT H
OUT L
OUT H OUT L
U
±
U
±
Input
terminal 1
Current sensor input
connector (EXT)
U
±
Input
terminal 2
Current sensor input
connector (EXT)
Input
terminal 3
Current sensor input
connector (EXT)
Wiring Example of a Three-Phase, Four-Wire System (3P4W) Using a Shunt-Type
Current Sensor
SOURCE I
R
OUT H
S
LOAD
±
OUT L
I
OUT H
±
OUT L
I
T
OUT H
±
OUT L
N
U
±
Input
terminal 1
Current sensor input
connector (EXT)
U
±
Input
terminal 2
Current sensor input
connector (EXT)
U
±
Input
terminal 3
Current sensor input
connector (EXT)
Note
For the relationship between the wiring systems and the method of determining the measured
values or computed values, see Appendix 1, “Symbols and Determination of Measurement
Functions.”
IM 760101-01E
3-15
Before Starting Measurements
OUT H OUT L
3.8
Using an External PT or CT to Wire the Circuit
under Measurement
Connect a measurement cable from an external potential transformer (PT) or current
transformer (CT) to the voltage or current input terminal of the input element.
To prevent the possibility of electric shock and damage to the instrument, follow the
precautions given in section 3.3, “Wiring Precautions.”
• An external PT can be used to make measurements when the maximum voltage of
the circuit under measurement exceeds “1000 Vrms.”
• An external CT can be used to make measurements when the maximum current of
the circuit under measurement exceeds the maximum range of the input element as
shown below.
• 5-A input element
When the maximum current exceeds “5 Arms.”
• 50-A input element
When the maximum current exceeds “50 Arms.”
Connecting to the Input Terminal
• Voltage input terminal
Insert the safety terminal (the conductive parts are not exposed) into the voltage input
terminal.
• Current input terminal
• When the voltage of the circuit under measurement is being applied to the current
input terminals, do not touch the current sensor input terminals. Since these
terminals are electrically connected inside the instrument, this act is dangerous.
• When connecting measurement cables from an external current sensor to the
current sensor input connector, remove the cables connected to the current input
terminals. In addition, when the voltage of the circuit under measurement is being
applied to the current sensor input terminal, do not touch the current input
terminals. Since these terminals are electrically connected inside the instrument,
this act is dangerous.
• The screws used on the terminal (binding post) are M6 screws. Either wind the
wire around the screw or pass the crimp-on lugs through the screw axis, then
tighten firmly by holding the terminal knob.
Number of Installed Input Elements and Wiring Systems
The selectable wiring systems vary depending on the number of input elements that are
installed in the instrument. You may be able to select only a single type of wiring system
or two or three types of wiring systems. For details, see “Number of Installed Input
Elements and Wiring Systems” in section 1.3, “Measurement Conditions.”
3-16
IM 760101-01E
3.8 Using an External PT or CT to Wire the Circuit under Measurement
Note
•
•
•
•
The assignment of elements to the input terminals in the following figure varies
depending on the number of installed input elements. For details, see “Number of
Installed Input Elements and Wiring Systems” in section 1.3, “Measurement Conditions.”
Wiring Example of a Single-Phase, Two-Wire System (1P2W) Using PT and CT
LOAD
SOURCE
LOAD
SOURCE
L CT
V PT
L CT
V PT
l
v
l
v
U
±
U
±
I
I
±
±
Input terminal
Input terminal
Wiring Example of a Single-Phase, Three-Wire System (1P3W) Using PT and CT
LOAD
SOURCE
N
L CT
V PT
L CT
V PT
l
v
l
v
U
±
I
I
±
±
Input terminal 1
IM 760101-01E
U
±
Input terminal 2
3-17
3
Before Starting Measurements
•
•
After wiring, the wiring system must be selected. See section 5.1, “Selecting the Wiring System.”
The thick lines on the wiring diagrams are the sections where the current flows. Use
appropriate wires that are suitable for the current.
The scaling function can be used to transform the input signal to data that correspond to
direct measurements. For the procedures, see section 5.4, “Setting the Scaling Function
when using an External PT or CT.”
Note that the frequency and phase characteristics of the PT or CT affect the measured data.
This section includes wiring diagrams that show, for safety purposes, the grounding of the
secondary common terminals (+/–) for PT and CT.
To more accurately measure apparent power and power factor in three-phase unbalanced
circuits, we recommend the three-voltage three-current (3V3A) measurement method.
3.8 Using an External PT or CT to Wire the Circuit under Measurement
Wiring Example of a Three-Phase, Three-Wire System (3P3W) Using PT and CT
R
S
T
LOAD
SOURCE
L CT
V PT
L CT
V PT
l
v
l
v
U
±
U
±
I
I
±
±
Input terminal 1
Input terminal 2
Wiring Example of a Three-Voltage, Three-Current System (3V3A) Using PT and CT
R
S
T
LOAD
SOURCE
L CT
V PT
L CT
V PT
L CT
V PT
l
v
l
v
l
v
U
±
U
±
U
±
I
I
I
±
±
±
Input terminal 1
Input terminal 2
Input terminal 3
Wiring Example of a Three-Phase, Four-Wire System (3P4W) Using PT and CT
R
LOAD
SOURCE
S
T
N
L CT
V PT
L CT
V PT
L CT
V PT
l
v
l
v
l
v
U
±
U
±
U
±
I
I
I
±
±
±
Input terminal 1
Input terminal 2
Input terminal 3
Note
For the relationship between the wiring systems and the method of determining the measured
values or computed values, see Appendix 1, “Symbols and Determination of Measurement
Functions.”
3-18
IM 760101-01E
3.9
Wiring a Circuit with Voltage Input Exceeding
600 V
When the voltage across the voltage input terminals exceeds 600 V, do not directly input
the current to the current input terminals. Connect the output of an isolation sensor (CT,
DT-CT, or clamp) to the current sensor input connector.
• The rated voltage between the input terminal (voltage input terminal, current
input terminal, and current sensor input connector) and earth ground is 600 V.
Do not apply a voltage exceeding 600 V.
• The rated voltage between the voltage and current input terminals, between the
voltage input terminal and current sensor input connector, and between the
current input terminal and current sensor input connector is 600 V. Do not apply
a voltage exceeding 600 V.
• The rated voltage between the U-voltage input terminal and the terminal of
voltage input terminal is 1000 V. Do not apply a voltage exceeding 1000 V.
• When the voltage across the voltage input terminals exceeds 600 V, do not
directly input the current to the current input terminals. Connect the output of an
isolation sensor (CT, DT-CT, or clamp) to the current sensor input connector.
• Follow the precautions given in section 3.3, “Wiring Precautions.”
• When the isolation sensor is current output
LOAD
SOURCE
U
±
Input terminal
I
±
• When the isolation sensor is voltage output
LOAD
SOURCE
U
±
Input terminal 1
Current sensor input
connector (EXT)
Note
For wiring precautions, see also sections 3.7 and 3.8.
IM 760101-01E
3-19
Before Starting Measurements
WARNING
3
3.10 Turning ON/OFF the Power Switch
Points to Check before Turning ON the Power
• Check that the instrument is installed properly (see section 3.2, “Installing the
Instrument”).
• Check that the power cord is connected properly (see section 3.5, “Connecting the
Power Supply”).
• Check that the circuit under measurement is wired properly (see sections 3.7 “Directly
Wiring the Circuit under Measurement,” 3.8 “Using an External Current Sensor to Wire
the Circuit under Measurement,” 3.9 “Using an External PT or CT to Wire the Circuit
under Measurement,” and 3.10 “Wiring a Circuit with Voltage Input Exceeding 600 V.”
Location of the Power Switch
The power switch is located in the lower left corner of the front panel.
Turning ON/OFF the Power Switch
The power switch is a push button. Press the button once to turn it “ON” and press it
again to turn it “OFF.”
OFF
ON
The Order in Turning ON/OFF the Power
When using the model with the SCSI option and you wish to save or load data using an
external SCSI device, turn ON the SCSI device first, then turn ON this instrument. When
turning OFF the instrument and SCSI device, reverse the order.
Power Up Operation
When the power switch is turned ON, the self-test starts automatically. When the selftest completes successfully, the display shows the screen that is displayed when the
power switch is turned OFF.
Note
If the instrument does not operate as described above when the power switch is turned ON,
turn OFF the power switch and check the following points.
• Check that the power cord is securely connected to the outlet.
• Check that the correct voltage is coming to the power outlet (see section 3.5, “Connecting
the Power Supply”).
• Check that the fuse is not blown (see section 16.5, “Replacing the Power Fuse”).
• If the power switch is turned ON while pressing RESET, the setup parameters are
initialized to their factory default values. For information on initialization, see section 15.3,
“Initializing the Settings.”
If the instrument still does not work after checking these points, contact your nearest
YOKOGAWA dealer for repairs.
3-20
IM 760101-01E
3.10 Turning ON/OFF the Power Switch
For Making Accurate Measurements
• Allow the instrument to warm up for at least an hour after turning ON the power
switch.
• Perform zero-level compensation after warm-up (see section 15.4, “Performing ZeroLevel Compensation”).
The setup parameters that exist immediately before the power switch is turned OFF are
stored in memory. The same is true when the power cord gets disconnected from the
outlet. The next time the power switch is turned ON, the instrument powers up using the
stored setup parameters.
Note
A lithium battery is used to retain the setup parameters. When the lithium battery voltage falls
below a certain level, a message is displayed on the screen (see section 16.2) when the
power switch is turned ON. When this message appears frequently, the battery must be
replaced quickly. The user cannot replace the battery. For battery replacement, contact your
nearest YOKOGAWA dealer. For information regarding battery life, see section 16.6.
IM 760101-01E
3-21
Before Starting Measurements
Shutdown Operation
3
3.11 Setting the Date and Time
Keys
SELE
CT
SET
RE
DISPLAY
HOLD
UP DATE
RATE
FILE
SINGLE
ESC
TRIG'D
WAVE
STORE
COPY
STORE SET
MENU
REMOTE
HARMONICS
CURSOR
LOCAL
MAX HOLD
MISC
NULL
SHIFT
To exit the menu during operation, press ESC.
INPUT
RANGE
SCALING
WIRING
AVG
MEASURE
MOTOR SET
FILTER
CAL
INTEGRATOR
START
STOP
INTEG SET
RESET
SYNC SRC
Procedure
1.
2.
Press MISC to display the Misc menu.
Press the Date/Time soft key to display the Date/Time dialog box.
• Turning ON/OFF the Date/Time Display
3.
Turn the jog shuttle to select Display.
4.
Press SELECT to select ON or OFF.
• Setting the Date and Time
5.
Turn the jog shuttle to select Date or Time.
6.
Press SELECT to display the keyboard.
7.
Use the keyboard to set the date or time.
For keyboard operations, see section 3.12, “Entering Values and Strings.”
• Confirming the New Settings
8.
Turn the jog shuttle to select Set.
9.
Press SELECT. If ON was selected in step 4, the new date and time are
displayed in the lower right corner of the screen. If the procedure is aborted
without pressing SELECT, the new settings are not reflected on the display.
ESC
Setting the date
Setting the time
3-22
IM 760101-01E
3.11 Setting the Date and Time
Explanation
• Turning ON/OFF the Date/Time display
You can select whether or not to display the date and time in the lower right corner of the
screen.
• OFF: Do not display the date and time.
• ON: Display the date and time.
• Setting the time
You can set the time in the form HH:MM:SS (hour:minute:second). The hour is set
using a 24-hour clock.
• Confirming the New Settings
When the date/time is turned ON/OFF, it is immediately reflected on the screen.
However, if you are changing the date and time, you must confirm the new settings. If
you do not (abort the operation), the new settings will not take effect.
Note
•
•
IM 760101-01E
The date and time information is backed up with the lithium battery when the power is turned OFF.
The instrument contains leap year information. The instrument determines the leap year
calendar when the new settings are confirmed. If you enter [2/29] on a non-leap year, an
error message will be displayed.
3-23
Before Starting Measurements
• Setting the Date and Time
• Setting the date
You can set the date in the form YY/MM/DD (year/month/day). Set the lower two
digits of the year. Set 00 to 99 for years 2000 to 2099.
3
3.12 Entering Values and Strings
Entering Values
After selecting the setup parameter with the SELECT key and soft keys, the value can
be changed using the jog shuttle. The outer shuttle ring can be used step through the
values in large increments. On some parameters, the arrow keys below the jog
shuttle can be used to move among the digits.
ESC
ESC
Note
Some of the parameters that can be changed using the jog shuttle are reset to their initial
values when the RESET key is pressed.
Entering Strings
The date/time, the equation for the user-defined function, a file name, and a comment
can be entered using the keyboard that is displayed on the screen. The jog shuttle,
arrow keys, and SELECT key are used to operate the keyboard to enter the character
strings.
• Entering the date or unit
The following figure shows the keyboard that appears when setting the date or unit.
1.
Turn the jog shuttle to select the character to be entered.
2.
Press SELECT to enter the string in the entry box.
If there are strings already in the entry box, use the arrow keys to select the
entry position.
3.
Repeat steps 1 and 2 to enter all the characters.
4.
After entering all the characters, select ENT on the keyboard and press
SELECT. The string is confirmed and the keyboard disappears.
Entry box
INSERT indicator
3-24
IM 760101-01E
3.12 Entering Values and Strings
• Entering the equation for the user-defined function
The following figure shows the keyboard that appears when setting the equation for
the user-defined function. Long equations can be temporarily held in the internal
memory so that it can be used in other equations.
•
•
When the equation is not correct and an error message is displayed, it is still stored in
the memory.
Up to five equations can be stored. Beyond five, for all successive equations, the
oldest equation is cleared.
• Recalling the temporarily stored equation
1.
Select
on the keyboard and press SELECT. A window opens and the
temporarily stored equation is displayed.
2.
Select the equation you wish to recall and press SELECT. The selected
equation appears in the entry box on the keyboard.
If there are strings already in the entry box, they are overwritten with the recalled equation.
3.
Correct the recalled equation according to steps 1 to 4 in “Entering the equation
and temporary storage” described above and confirm it. At this point, the
equation is temporarily stored in the internal memory.
The window displaying the equation
that is stored in the memory
The key that is selected when
displaying the window on the right
IM 760101-01E
3-25
3
Before Starting Measurements
• Entering the equation and temporarily storing it
1.
Turn the jog shuttle to select the character to be entered.
(Long function names can be selected by pressing one key.)
2.
Press SELECT to enter the string in the entry box.
If there are strings already in the entry box, use the arrow keys to select the
entry position.
3.
Repeat steps 1 and 2 to enter all the characters.
4.
After entering all the characters, select ENT on the keyboard and press
SELECT. The string is confirmed and the keyboard disappears. At the same
time, the equation is temporarily stored in the internal memory.
3.12 Entering Values and Strings
• Enter the file name and comment
(such as the server name, user name, password, and e-mail address for
Ethernet communication)
The following figure shows the keyboard that appears when setting the file name or
comment. File names and comments can be temporarily held in the internal memory
so that they can be used in other file names and comments.
• Enter the file name and comment and temporarily storing them
1.
Turn the jog shuttle to select the character to be entered. You can also press
the
and
soft keys to move the cursor vertically.
2.
Press SELECT to enter the string in the entry box.
If there are strings already in the entry box, use the arrow keys to select the
entry position.
3.
Repeat steps 1 and 2 to enter all the characters.
4.
After entering all the characters, select ENT on the keyboard and press
SELECT. The string is confirmed and the keyboard disappears (you can also
press the ENT soft key to achieve the same result). At the same time, the
confirmed string is temporarily stored in the internal memory.
Up to 8 sets of strings can be stored. Beyond eight, for all successive entries, the
oldest string is cleared.
• Recalling the temporary stored string
1.
Press the soft key. Each time the soft key is pressed the temporarily stored
strings are displayed in the entry box of the keyboard in order. When the eight
strings that are temporarily stored are displayed, the most recent string is
displayed again.
If there are strings already in the entry box, they are overwritten with the recalled string.
2.
Correct the recalled equation according to steps 1 to 4 in “Entering the file name
and comment and temporary storing them” described above and confirm it. At
this point, the string is temporarily stored in the internal memory.
ESC
Entry box
Moves the cursor upward.
Moves the cursor downward.
Switches between upper case and lower case.
Deletes the character before the entry position.
Switches the insert/overwrite mode.
Recalls the temporary stored string
Confirms the string.
3-26
IM 760101-01E
3.12 Entering Values and Strings
• Number of characters and types that can be used
Item
Number of Characters
Characters That Can Be Used
Date and time
Equation
Specified number
1 to 50 characters
Unit
1 to 8 characters
File Name
Comment
1 to 8 characters
0 to 25 characters
Server name
0 to 40 characters
User name
0 to 40 characters
Password
0 to 40 characters
E-mail address
0 to 40 characters
0 to 9 (/, :)
Characters that are displayed on the keyboard
and spaces
Characters that are displayed on the keyboard
and spaces
0-9, A-Z, %, _, ( ) (parenthesis), – (minus sign)
Characters that are displayed on the keyboard
and spaces
Characters that are displayed on the keyboard
and spaces
Characters that are displayed on the keyboard
and spaces
Characters that are displayed on the keyboard
and spaces
Characters that are displayed on the keyboard
and spaces
(the @ character cannot be entered
consecutively.)
Note
•
•
IM 760101-01E
Upper and lower case letters are not distinguished for file names. They are distinguished
in comments. In addition, the following five file names cannot be used due to limitations of
MS-DOS.
AUX, CON, PRN, NUL, and CLOCK
When using the GP-IB or serial interface commands to enter a file name, the following
symbols that do not exist on the keyboard of this instrument can be used.
{ }
3-27
3
Before Starting Measurements
• Keys other than the character keys
• BS: Deletes the character before the entry position.
• INS: Switches the insert/overwrite mode. During the insert mode, the INSERT
indicator on the keyboard lights. When a new character is entered in the insert
mode, the new character is placed at the entry position and all following characters
are moved backward. On the keyboard that appears when entering a file name or
comment, pressing “RESET” on the front panel achieves the same operation as
CLR.
• CLR: Clears all displayed characters.
• CAPS: Switches between upper case and lower case.
• SPACE: Enters a space.
• ENT: Confirms the displayed characters.
Chapter 4
Screen Display Format
4.1
Displaying the Data (Numerical Data) of
Measurement Functions
«For a functional description, see section 1.4.»
Keys
SELE
CT
SET
RE
DISPLAY
HOLD
UP DATE
RATE
FILE
SINGLE
ESC
TRIG'D
WAVE
CURSOR
STORE
COPY
STORE SET
MENU
REMOTE
HARMONICS
LOCAL
MAX HOLD
4
MISC
NULL
SHIFT
Screen Display Format
To exit the menu during operation, press ESC.
INPUT
RANGE
SCALING
WIRING
AVG
MEASURE
MOTOR SET
FILTER
CAL
INTEGRATOR
START
STOP
INTEG SET
RESET
SYNC SRC
Procedure
1.
2.
Press DISPLAY to display the Display menu.
Press the Format soft key to display the display format selection box.
Displaying Numerical Data
3.
Turn the jog shuttle to select Numeric, Numeric+Wave, Numeric+Bar (only
during harmonic measurement), or Numeric+Trend.
4.
Press SELECT to confirm the new display format.
ESC
IM 760101-01E
4-1
4.1 Displaying the Data (Numerical Data) of Measurement Functions
The following procedures are given for a representative example in which the
display format is set to Numeric.
During Normal Measurement
Selecting the Displayed Item
5.
Press the Item Amount soft key to display the Item Amount menu.
6.
Press one of the 4(2) to All keys to select the number of displayed items.
ESC
ESC
Scrolling the Display
7.
Turn the jog shuttle to move the highlighting of the measurement function.
•
•
If the number of displayed items is set to 4(2) through 78(39), the item number of the
highlighted measurement function is displayed in the Norm Item No. box of the Display
menu.
If the number of displayed items is set to All, the symbol corresponding to the
highlighted measurement function is displayed in the Function box of the Display menu.
When set to 4(2) to 78(39)
ESC
4-2
When set to All
ESC
IM 760101-01E
4.1 Displaying the Data (Numerical Data) of Measurement Functions
Page Scrolling the Display
7.
Press the Page Up Scroll Exec or Page Down Scroll Exec soft key to scroll
the page.
•
•
If you press the Page Up Scroll Exec soft key, the numerical data corresponding to
item numbers that are smaller than those of the numerical data of measurement
functions displayed up to that point are displayed.
If you press the Page Down Scroll Exec soft key, the numerical data corresponding to
item numbers that are larger than those of the numerical data displayed up to that point
are displayed.
Screen Display Format
ESC
IM 760101-01E
4
4-3
4.1 Displaying the Data (Numerical Data) of Measurement Functions
During Harmonic Measurement
Selecting the Number of Displayed Items or List Display
5.
Press the Item Amount soft key to display the Item Amount menu.
6.
Select one of the 4(2) to ΣList soft keys to select the number of displayed items
or list display.
ESC
ESC
Scrolling the Display
7.
Turn the jog shuttle to move the highlighting.
•
•
•
If the number of displayed items is set to 4(2) through 16(8), the item number of the
highlighted measurement function is displayed in the Harm Item No. box of the Display
menu.
If the number of displayed items is set to Single List or Dual List, the highlighted order
is displayed in the Order box of the Display menu.
If the number of displayed items is set to ΣList, the symbol of the highlighted
measurement function is displayed in the Function box in the Display menu and the
order in the Order box.
If the Function box is selected with the soft key, the measurement functions are
scrolled. If the Order box is selected, the order is scrolled. The corresponding
numerical data is displayed.
When set to 4(2) to 16(8)
ESC
4-4
When set to Single List
or Dual List
ESC
When set to ΣList
ESC
IM 760101-01E
4.1 Displaying the Data (Numerical Data) of Measurement Functions
Page Scrolling the Display
• When 4(2) through 16(8) is selected in step 6
7.
Press the Page Up Scroll Exec or Page Down Scroll Exec soft key to scroll
the page.
•
•
ESC
• When Single List or Dual List is selected in step 6
7.
Press the Page Up Scroll Exec or Page Down Scroll Exec soft key to scroll
the page.
•
•
If you press the Page Up Scroll Exec soft key, the numerical data corresponding to
orders that are smaller than those of the numerical data displayed up to that point are
displayed.
If you press the Page Down Scroll Exec soft key, the numerical data corresponding to
orders that are larger than those of the numerical data displayed up to that point are
displayed.
ESC
IM 760101-01E
4-5
4
Screen Display Format
If you press the Page Up Scroll Exec soft key, the numerical data corresponding to
item numbers that are smaller than those of the data (numerical data) of measurement
functions displayed up to that point are displayed.
If you press the Page Down Scroll Exec soft key, the numerical data corresponding to
item numbers that are larger than those of the numerical data displayed up to that point
are displayed.
4.1 Displaying the Data (Numerical Data) of Measurement Functions
Explanation
A display example is shown below. For the procedure in changing the displayed items
and contents of numerical data, see chapters 6, 7, and 8.
The color changes from green to red when the input signal level exceeds
approx. three or six times the specified measurement range when the
crest factor is set to 3 or 6, respectively. The conditions of the input
signals of elements 1 to 6 are displayed in order from the left.
Displayed only to products with the motor evaluation function
(option). The color changes from green to red when the analog
revolution/torque signal level exceeds approx. 180% of the
specified measurement range. For pulse revolution signal, the
color changes from green to red when approx. ±10 V is exceeded.
The first and second lines correspond to the conditions of rotating
speed and torque, respectively.
Data
Measurement functions
Number of data updates
• The number of data updates is shown in the Update line at the lower left
part of the screen.
• Press HOLD to stop the data from updating. The update number stops
incrementing. Press HOLD again to allow updating to continue. The update
number resumes incrementing.
• If the value exceedes 65535, it returns to 0.
• If the power is turned OFF, the number of data updates resets to 0.
During Normal Measurement
Meaning of the Measurement Function Symbols
• For the meanings of the measurement function symbols that are displayed, see
section 1.2, “Measurement Functions and Measurement Periods,” 1.5,
“Computation,” 1.6, “Integration,” appendix 1, “Symbols and Determination of
Measurement Functions,” and appendix 2, “Determination of Delta Computation.”
• For details on the wiring units expressed as ΣA, ΣB, ΣC, see section 5.1, “Selecting
the Wiring System.”
Example The true rms value of the voltage of element 1
Urms1
Element 1
True rms value
Voltage
Simple average of the current of the elements combined by wiring
unit ΣA
IdcΣA
Σ function of wiring unit ΣA
Simple average
Current
4-6
IM 760101-01E
4.1 Displaying the Data (Numerical Data) of Measurement Functions
Selecting the Display Format
Select the display format of the numerical data from the following list of choices.
[-------] (no data) is displayed in places where the measurement function is not
selected or where no numerical data is present.
• Numeric
Only the numerical data is displayed.
Selecting the Number of Displayed Items
Select the number of numerical data items that are displayed simultaneously from the
following list of choices.
• 4(2)
• When the display format is Numeric, 4 numerical data values are displayed in
one column.
• When the display format is other than Numeric, 2 numerical data values are
displayed.
• 8(4)
• When the display format is Numeric, 8 numerical data values are displayed in
one column.
• When the display format is other than Numeric, 4 numerical data values are
displayed.
• 16(8)
• When the display format is Numeric, 16 numerical data values are displayed in
two columns.
• When the display format is other than Numeric, 8 numerical data values are
displayed.
• 42(21)
• When the display format is Numeric, 42 numerical data values are displayed in
three columns.
• When the display format is other than Numeric, 21 numerical data values are
displayed.
• 78(39)
• When the display format is Numeric, 78 numerical data values are displayed in
three columns.
• When the display format is other than Numeric, 39 numerical data values are
displayed.
• All
A table is displayed indicating the numerical data of items with measurement
functions listed vertically and symbols indicating elements and wiring units listed
horizontally. The number of displayed items varies depending on the number of
installed elements.
IM 760101-01E
4-7
4
Screen Display Format
• Numeric+Wave
The numerical data and waveform are displayed separately in the top and bottom
windows. For details on setting the waveform display, see section 4.2 and chapter 9.
• Numeric+Trend
The numerical data and trend are displayed separately in the top and bottom
windows. For details on setting the trend display, see section 4.5 and chapter 10.
4.1 Displaying the Data (Numerical Data) of Measurement Functions
During Harmonic Measurement
Meaning of the Measurement Function Symbols
• For the meanings of the measurement function symbols that are displayed, see
section 1.2, “Measurement Functions and Measurement Periods,” 1.5, “Computation,”
and appendix 1, “Symbols and Determination of Measurement Functions.”
• For details on the wiring units expressed as ΣA, ΣB, ΣC, see section 5.1, “Selecting
the Wiring System.”
Example 20th harmonic voltage of element 2
U2(20)
20th order
Element 2
Voltage
Average of the 30th harmonic current of the elements combined by
wiring unit ΣB
IΣB(30)
30th order
Σ function of wiring unit ΣB
Current
Selecting the Display Format
Select the display format of the numerical data from the following list of choices.
[-------] (no data) is displayed in places where the measurement function is not
selected or where no numerical data is present.
• Numeric
Only the numerical data is displayed.
• Numeric+Wave
The numerical data and waveform are displayed separately in the top and bottom
windows. For details on setting the waveform display, see section 4.2 and chapter 9.
• Numeric+Bar
The numerical data and bar graph are displayed separately in the top and bottom
windows. For details on setting the bar graph display, see section 4.3 and section 7.9.
• Numeric+Trend
The numerical data and trend are displayed separately in the top and bottom
windows. For details on setting the trend display, see section 4.5 and chapter 10.
Selecting the Number of Displayed Items or List Display
Select the number of numerical data items that are displayed simultaneously or list
display from the following list of choices.
• 4(2)
• When the display format is Numeric, 4 numerical data values are displayed in
one column.
• When the display format is other than Numeric, 2 numerical data values are displayed.
• 8(4)
• When the display format is Numeric, 8 numerical data values are displayed in
one column.
• When the display format is other than Numeric, 4 numerical data values are displayed.
• 16(8)
• When the display format is Numeric, 16 numerical data values are displayed in
two columns.
• When the display format is other than Numeric, 8 numerical data values are displayed.
4-8
IM 760101-01E
4.1 Displaying the Data (Numerical Data) of Measurement Functions
Note
•
•
•
•
•
•
•
•
•
•
IM 760101-01E
All harmonic orders (Total) or from dc (0th order) up to 100th order can be displayed.
However, the numerical data up to the order corresponding to the upper limit of harmonic
order under analysis (see section 17.6) that is automatically determined by the frequency of
the PLL source is the data determined by the harmonic measurement.
[-------] (no data) is displayed in places where the measurement function is not selected or
where no numerical data is present.
If Urms, Umn, Uac, Udc, Irms, Imn, Iac, or Idc exceeds 140% of the measurement range,
over the range [-OL-] is displayed.
P shows over the range [-OL-] if the measured values of either the voltage or current exceeds
140% of the measurement range.
If the measured or computed result cannot be displayed using the specified decimal position
or unit, overflow [-OF-] is displayed.
If Urms, Uac, Irms, or Iac is less than or equal to 0.3% (when the crest factor is set to 3; less
than or equal to 0.6% when the crest factor is set to 6) or Umn or Imn is less than or equal to
1% (when the crest factor is set to 3; less than or equal to 2% when the crest factor is set to
6) of the measurement range, Urms, Umn, Uac, Irms, Imn, Iac, and the measurement
functions that are determined using these measurement functions display zeroes. λ or φ
displays an error.
If the measured value of frequency is outside the measurement range, fU or fI displays an
error.
If both the voltage and current are sinusoids and the ratio of the voltage and current inputs do
not differ greatly with respect to the measurement range, the phase difference φ of lead (D)
and lag (G) are detected correctly.
If the power factor λ is greater than 1 and less than or equal to 2, λ becomes [1]. φ displays
zero.
If the power factor λ is greater than 2, λ and φ display errors.
4-9
4
Screen Display Format
• Single List
• When the display format is Numeric, 48 numerical data values for a single
measurement function are displayed in two columns.
• When the display format is other than Numeric, 22 numerical data values for a
single measurement function are displayed in two columns.
• Dual List
• When the display format is Numeric, 24 numerical data values each for two
measurement functions are displayed in each column.
• When the display format is other than Numeric, 11 numerical data values each
for two measurement functions are displayed in each column.
• Σ List
• When the display format is Numeric, a table is displayed indicating the
numerical data of items with 19 measurement functions (such as U, I, P, S, Q, λ,
φ) listed vertically and symbols indicating elements and wiring units listed
horizontally.
• When the display format is other than Numeric, a table is displayed indicating
the numerical data of items with 11 measurement functions (such as U, I, P, S,
Q, λ, φ) listed vertically and symbols indicating elements and wiring units listed
horizontally.
• A table is displayed for each order.
4.2
Displaying Waveforms
«For a functional description, see section 1.7.»
Keys
SELE
CT
SET
RE
DISPLAY
HOLD
UP DATE
RATE
FILE
SINGLE
ESC
TRIG'D
WAVE
CURSOR
STORE
COPY
STORE SET
MENU
REMOTE
HARMONICS
LOCAL
MAX HOLD
MISC
NULL
SHIFT
To exit the menu during operation, press ESC.
INPUT
RANGE
SCALING
WIRING
AVG
MEASURE
MOTOR SET
FILTER
CAL
INTEGRATOR
START
STOP
INTEG SET
RESET
SYNC SRC
Procedure
The retrieval of waveform display data must be turned ON to display
waveforms. For the procedure, see section 9.1.
1.
2.
Press DISPLAY to display the Display menu.
Press the Format soft key to display the display format selection box.
Displaying Waveforms
3.
Turn the jog shuttle to select Wave, Numeric+Wave, Wave+Bar (only during
harmonic measurement), or Wave+Trend.
4.
Press SELECT to confirm the new display format.
ESC
4-10
IM 760101-01E
4.2 Displaying Waveforms
Explanation
A display example is shown below. For the procedure in changing the displayed items
and contents of waveforms, see chapter 9.
Distinction of voltage or current,
the element, and the upper limit
of the displayed waveform
4
Time at the left end of the screen
(fixed to 0 s)
Time at the right end of the screen
(time span of the screen)
• Number of data points displayed in the range
from the left to the right end of the screen
• When “P-P” is displayed, waveform is displayed
using P-P compression
(see section 1.7.)
Selecting the Display Format
Select the waveform display format from the following list of choices.
• Wave
Only waveforms are displayed.
• Numeric+Wave
The numerical data and waveform are displayed separately in the top and bottom
windows. For details on setting the numerical data display, see section 4.1,
chapters 6, 7, and 8.
• Wave+Bar
The waveform and bar graph are displayed separately in the top and bottom
windows. The bar graph is valid during harmonic measurement. For details on
setting the bar graph display, see section 4.3 and section 7.9.
• Wave+Trend
The waveform and trend are displayed separately in the top and bottom windows.
For details on setting the trend display, see section 4.5 and chapter 10.
IM 760101-01E
4-11
Screen Display Format
Distinction of voltage or current,
the element, and the lower limit
of the displayed waveform
4.3
Displaying Bar Graphs
«For a functional description, see section 1.8.»
Keys
SELE
CT
SET
RE
DISPLAY
HOLD
UP DATE
RATE
FILE
SINGLE
ESC
TRIG'D
WAVE
CURSOR
STORE
COPY
STORE SET
MENU
REMOTE
HARMONICS
LOCAL
MAX HOLD
MISC
NULL
SHIFT
To exit the menu during operation, press ESC.
INPUT
RANGE
SCALING
WIRING
AVG
MEASURE
MOTOR SET
FILTER
CAL
INTEGRATOR
START
STOP
INTEG SET
RESET
SYNC SRC
Procedure
Check that the measurement mode is set to harmonic measurement. If the
measurement mode is set to normal measurement, set Mode to ON in the
Harmonics menu (see section 7.1).
1.
2.
Press DISPLAY to display the Display menu.
Press the Format soft key to display the display format selection box.
Displaying Bar Graphs
3.
Turn the jog shuttle to select Wave, Bar, Numeric+Bar, Wave+Bar, or
Bar+Trend.
4.
Press SELECT to confirm the new display format.
ESC
4-12
IM 760101-01E
4.3 Displaying Bar Graphs
Explanation
A display example is shown below. For the procedure in changing the displayed items
and contents of bar graphs, see section 7.9. When the vertical axis is set to logarithmic
coordinates, the characters <log Scale> appears at the upper left corner of the screen.
Range of orders of the displayed
bar graph
4
Screen Display Format
Distinction of voltage or current,
the element, and the upper limit
of the displayed bar graph
Distinction of voltage or current,
the element, and the lower limit
of the displayed bar graph
Selecting the Display Format
Select the bar graph display format from the following list of choices.
• Bar
Only bar graphs are displayed.
• Numeric+Bar
The numerical data and bar graph are displayed separately in the top and bottom
windows. For details on setting the numerical data display, see section 4.1,
chapters 6, 7, and 8.
• Wave+Bar
The waveform and bar graph are displayed separately in the top and bottom
windows. For details on setting the waveform display, see section 4.2 and chapter
9.
• Bar+Trend
The bar graph and trend are displayed separately in the top and bottom windows.
For details on setting the trend display, see section 4.5 and chapter 10.
IM 760101-01E
4-13
4.4
Displaying Vectors
«For a functional description, see section 1.8.»
Keys
SELE
CT
SET
RE
DISPLAY
HOLD
UP DATE
RATE
FILE
SINGLE
ESC
TRIG'D
WAVE
STORE
COPY
STORE SET
MENU
REMOTE
HARMONICS
CURSOR
LOCAL
MAX HOLD
MISC
NULL
SHIFT
To exit the menu during operation, press ESC.
INPUT
RANGE
SCALING
WIRING
AVG
MEASURE
MOTOR SET
FILTER
CAL
INTEGRATOR
START
STOP
INTEG SET
RESET
SYNC SRC
Procedure
Check that the measurement mode is set to harmonic measurement. If the
measurement mode is set to normal measurement, set Mode to ON in the
Harmonics menu (see section 7.1).
1.
2.
Press DISPLAY to display the Display menu.
Press the Format soft key to display the display format selection box.
Displaying Vectors
3.
Turn the jog shuttle to select Vector.
4.
Press SELECT to confirm the new display format.
ESC
Explanation
The phase and size (rms value) relationship between the fundamental waves U(1) and
I(1) of each element specified for harmonic measurement (see section 7.3) can be
displayed using vectors. The positive vertical axis is set to 0 (angle 0), and the vector of
each input signal is displayed.
For examples of vector displays and the procedure in changing the displayed items and
contents, see section 7.10.
4-14
IM 760101-01E
4.5
Displaying Trends
«For a functional description, see section 1.8.»
Keys
SELE
CT
SET
RE
DISPLAY
HOLD
UP DATE
RATE
FILE
SINGLE
ESC
TRIG'D
WAVE
CURSOR
STORE
COPY
STORE SET
MENU
REMOTE
HARMONICS
LOCAL
MAX HOLD
4
MISC
NULL
SHIFT
Screen Display Format
To exit the menu during operation, press ESC.
INPUT
RANGE
SCALING
WIRING
AVG
MEASURE
MOTOR SET
FILTER
CAL
INTEGRATOR
START
STOP
INTEG SET
RESET
SYNC SRC
Procedure
The retrieval of trend display data must be turned ON to display trends. For the
procedure, see section 10.1.
1.
2.
Press DISPLAY to display the Display menu.
Press the Format soft key to display the display format selection box.
Displaying Trends
3.
Turn the jog shuttle to select Trend, Numeric+Trend, Wave+Trend, or
Bar+Trend.
4.
Press SELECT to confirm the new display format.
ESC
IM 760101-01E
4-15
4.5 Displaying Trends
Explanation
A display example is shown below. For the procedure in changing the displayed items
and contents of trends, see chapter 10. When the retrieval of waveform display data is
OFF (see section 9.1) during normal measurement, the horizontal axis is expressed
using time as shown below. During harmonic measurement or when the retrieval of
waveform display data is ON, the horizontal axis is expressed using the number of data
points on the screen.
The trend value in the held condition (see section 5.8) is
the same as the numerical data when HOLD is pressed.
When hold is released, the trend that was held is displayed.
Displayed trend target,
measurement function,
upper limit
Displayed trend target,
measurement function,
lower limit
Time at the left end of the screen
(fixed to 0 s)
Number of trend display data
points retrieved
Time at the right end of the screen
(time span of the screen)
• Number of data points displayed in the range
from the left to the right end of the screen
• When “P-P” is displayed, trend is displayed
using P-P compression
(see sections 1.7 and 1.8)
Selecting the Display Format
Select the trend display format from the following list of choices.
• Trend
Only trends are displayed.
• Numeric+Trend
The numerical data and trend are displayed separately in the top and bottom
windows. For details on setting the numerical data display, see section 4.1,
chapters 6, 7, and 8.
• Wave+Trend
The waveform and trend are displayed separately in the top and bottom windows.
For details on setting the waveform display, see section 4.2 and chapter 9.
• Bar+Trend
The bar graph and trend are displayed separately in the top and bottom windows.
For details on setting the bar graph display, see section 4.3 and section 7.9.
4-16
IM 760101-01E
4.6
Listing the Setup Parameters
Keys
SELE
CT
SET
RE
DISPLAY
HOLD
UP DATE
RATE
FILE
SINGLE
ESC
TRIG'D
WAVE
STORE
COPY
STORE SET
MENU
REMOTE
HARMONICS
CURSOR
LOCAL
MAX HOLD
4
MISC
NULL
SHIFT
Screen Display Format
To exit the menu during operation, press ESC.
INPUT
RANGE
SCALING
WIRING
AVG
MEASURE
MOTOR SET
FILTER
CAL
INTEGRATOR
START
STOP
INTEG SET
RESET
SYNC SRC
Procedure
1.
2.
Press DISPLAY to display the Display menu.
Press the Format soft key to display the display format selection box.
Selecting the List of Setup Parameters
3.
Turn the jog shuttle to select Information.
4.
Press SELECT to confirm the new display format.
ESC
IM 760101-01E
4-17
4.6 Listing the Setup Parameters
Displaying the Relation Table of Elements and Measurement Ranges
5.
Press the Power Element soft key. The relation table of measurement ranges,
input filters, transformation ratios, scaling factors, and other parameters are
displayed for each element.
Displaying the Relation Table of Trend Targets and Measurement Functions
5.
Press the Trend soft key to display the relation table of trend targets and
measurement functions.
Displaying the Relation Table of D/A Output Channels and Measurement
Functions*
5.
Press the D/A Output soft key to display the relation table of D/A output
channels and measurement functions.
*
Displayed only on products with the D/A output (option).
Displaying the Relation Table of Rotating Speeds and the Input Ranges of Torque*
5.
Press the Motor Element soft key. A relation table of the rotating speed and
the input range, filter, scaling factor, unit, and synchronization source of torque,
number of poles, frequency measurement source, and other parameters is
displayed.
*
Displayed only to products with the motor evaluation function (option).
ESC
Explanation
Relation Table of Elements and Measurement Ranges
If the menu is cleared using ESC, a relation table of up to 6 elements is displayed.
The following figure shows an example when the crest factor is set to 3.
4-18
IM 760101-01E
4.6 Listing the Setup Parameters
Relation Table of Trend Targets and Measurement Functions
4
Screen Display Format
Relation Table of D/A Output Channels and Measurement Functions
Displayed only on products with the D/A output (option).
Relation Table of the Rotating Speed of Motor Evaluation Function (Option) and
Input Ranges of Torque
Displayed only to products with the motor evaluation function (option).
IM 760101-01E
4-19
Chapter 5
Measurement Conditions
5.1
Selecting the Wiring System
«For a functional description, see section 1.3.»
Keys
SELE
CT
SET
RE
DISPLAY
HOLD
UP DATE
RATE
FILE
SINGLE
ESC
TRIG'D
WAVE
STORE
COPY
STORE SET
MENU
REMOTE
HARMONICS
CURSOR
LOCAL
MAX HOLD
MISC
NULL
SHIFT
5
To exit the menu during operation, press ESC.
Measurement Conditions
INPUT
RANGE
SCALING
WIRING
AVG
MEASURE
MOTOR SET
FILTER
CAL
INTEGRATOR
START
STOP
INTEG SET
RESET
SYNC SRC
Procedure
1.
Press WIRING to open the Wiring dialog box.
Selecting the Wiring System Pattern
2.
Turn the jog shuttle to select Pattern.
If the wiring system pattern on all elements is set to 1P2W (single-phase, two-wire) as
shown below, the cursor remains at Pattern even if you turn the jog shuttle.
Example in which six elements are installed
3.
4.
5.
Press SELECT to open the pattern selection window.
Turn the jog shuttle to select a pattern.
Press SELECT to confirm the new pattern.
Example in which six elements are installed
IM 760101-01E
5-1
5.1 Selecting the Wiring System
Selecting the Wiring System
• The procedure described here is not necessary, if the wiring system of all elements
was set to 1P2W (single-phase, two-wire) in the previous section “Selecting the
Wiring System Pattern.”
• Two types of wiring systems that use two elements are available: 1P3W (singlephase, three-wire) and 3P3W (three-phase, three-wire). You can select either type
through the procedure described here.
• Two types of wiring systems that use three elements are available: 3P4W (threephase, four-wire) and 3V3A (three-voltage, three-current). You can select either
type through the procedure described here.
6.
Turn the jog shuttle to select wiring unit ΣA, ΣB, or ΣC.
Some of the wiring units may not be selectable depending on the number of installed
elements.
7.
8.
Press SELECT to select the wiring system.
Repeat steps 6 and 7 to select the wiring system for all wiring units ΣA, ΣB, and
ΣC.
Example in which six elements are installed
5-2
IM 760101-01E
5.1 Selecting the Wiring System
Explanation
Installed input elements
1
Wiring system Pattern 1
1P2W
Installed input elements
1
2
Wiring system Pattern 1
1P2W
1P2W
Wiring system Pattern 2
1P3W or 3P3W(ΣA)
Installed input elements
1
2
3
Wiring system Pattern 1
1P2W
1P2W
1P2W
Wiring system Pattern 2
Wiring system Pattern 3
1P3W or 3P3W(ΣA)
1P2W(ΣA)
Wiring system Pattern 4
3P4W or 3V3A(ΣA)
1
2
Wiring system Pattern 1
1P2W
1P2W
Wiring system Pattern 2
1P3W or 3P3W(ΣA)
Installed input elements
Wiring system Pattern 3
Wiring system Pattern 4
1P2W(ΣB)
1P3W or 3P3W(ΣB)
3
4
1P2W
1P2W
1P3W or 3P3W(ΣB)
3P4W or 3V3A(ΣA)
1P2W(ΣA)
1P2W(ΣB)
3P4W or 3V3A(ΣB)
Installed input elements
1
2
3
4
5
Wiring system Pattern 1
1P2W
1P2W
1P2W
1P2W
1P2W
Wiring system Pattern 2
1P3W or 3P3W(ΣA)
Wiring system Pattern 3
1P3W or 3P3W(ΣA)
Wiring system Pattern 4
1P3W or 3P3W(ΣB)
1P2W(ΣC)
3P4W or 3V3A(ΣB)
3P4W or 3V3A(ΣA)
1P3W or 3P3W(ΣB)
Installed input elements
1
2
3
4
5
6
Wiring system Pattern 1
1P2W
1P2W
1P2W
1P2W
1P2W
1P2W
Wiring system Pattern 2
1P3W or 3P3W(ΣA)
Wiring system Pattern 3
1P3W or 3P3W(ΣA)
1P3W or 3P3W(ΣB)
Wiring system Pattern 4
3P4W or 3V3A(ΣA)
Wiring system Pattern 5
3P4W or 3V3A(ΣA)
1P3W or 3P3W(ΣC)
3P4W or 3V3A(ΣB)
1P3W or 3P3W(ΣB)
1P2W(ΣC)
1P2W(ΣC)
3P4W or 3V3A(ΣB)
Note
•
•
IM 760101-01E
Select the wiring system to match the circuit under measurement that is actually wired. The
method in which the Σ function is determined varies depending on the wiring system. If the
selected wiring system does not match the actual circuit, measurements and computation will
not be correct.
For the relationship concerning the wiring system and the determination of the Σ function, see
appendix 1.
5-3
5
Measurement Conditions
• The selectable wiring systems vary depending on the number of input elements that
are installed in the instrument. You may be able to select only a single type of wiring
system or two or three types of wiring systems. You can select the wiring system
from the following five types.
1P2W (single-phase, two-wire), 1P3W (single-phase, three-wire), 3P3W (three-phase,
three-wire), 3P4W (three-phase, four-wire), and 3V3A (three-voltage, three-current)
• The input element assignment to wiring units ΣA, ΣB, and ΣC is determined from the
wiring system pattern. This allows Σ functions of voltage, current, active power,
apparent power, reactive power, power factor, phase difference, and other parameters
to be determined. For the relationship concerning the wiring system and the
determination of the Σ function, see appendix 1.
• The following table shows the relationship between the number of installed elements,
the selectable wiring system patterns, and the assignment of input elements to wiring
units ΣA, ΣB, and ΣC.
5.2
Setting the Measurement Range during Direct
Input
«For a functional description, see section 1.3.»
Keys
SELE
CT
SET
RE
DISPLAY
HOLD
UP DATE
RATE
FILE
SINGLE
ESC
TRIG'D
WAVE
STORE
COPY
STORE SET
MENU
REMOTE
HARMONICS
CURSOR
LOCAL
MAX HOLD
MISC
NULL
SHIFT
To exit the menu during operation, press ESC.
INPUT
RANGE
SCALING
WIRING
AVG
MEASURE
MOTOR SET
FILTER
CAL
INTEGRATOR
START
STOP
INTEG SET
RESET
SYNC SRC
Procedure
1.
Press RANGE to display the Range menu.
Selecting the Target Element
2.
Press the Element Object soft key to display the Element menu.
Only the installed elements are displayed.
3.
Press one of the soft keys corresponding to the displayed element to select the
target element. The selected element is displayed at the upper right corner of
the screen (if you selected element 1, U1 and I1 are displayed).
Setting the Voltage Range
4.
Press the U Range Up Exec or U Range Down Exec soft key to set the voltage
range. The specified range is displayed by the element displayed at the upper
right corner of the screen.
•
•
Pressing the U Range Up Exec soft key increases the voltage range.
If you press the U Range Up Exec soft key when the range is at maximum, auto
range is enabled.
Pressing the U Range Down Exec soft key decreases the voltage range.
ESC
5-4
ESC
ESC
IM 760101-01E
5.2 Setting the Measurement Range during Direct Input
Setting the Current Range
• Selecting the current input terminal
5.
Press the Terminal soft key to select Direct.
• Setting the current range
6
Press the I Range Up Exec or I Range Down Exec soft key to set the current
range. The specified range is displayed by the element displayed at the upper
right corner of the screen.
•
•
Pressing the I Range Up Exec soft key increases the current range.
If you press the I Range Up Exec soft key when the range is at maximum, auto
range mode is enabled.
Pressing the I Range Down Exec soft key decreases the current range.
7.
Measurement Conditions
ESC
5
ESC
Repeat steps 2 to 6 to set the measurement range of all elements.
Copying the Range
The measurement range specified for a given element can be set to the elements of
the same wiring unit. The measurement range for other elements that were specified
before is not held.
3.
Press one of the soft keys corresponding to the displayed element from which
the range is to be copied (the copy source).
4.
Press the Range Copy Exec soft key. The measurement range of the copy
source is copied to the elements of the same wiring unit. However, if the wiring
system is pattern 1, the measurement range is copied to all other elements.
ESC
IM 760101-01E
5-5
5.2 Setting the Measurement Range during Direct Input
Explanation
Display Position of the Target Element and the Specified Range
The target element and the specified range are displayed at the upper right corner of
the screen when RANGE is pressed.
Element
Voltage
Voltage range
Appears when in auto range mode
Current
Current range
Selecting the Target Element to Be Specified
Only the installed elements are displayed. The Element menu is displayed according
to the element configuration of the product.
Setting the Voltage and Current Ranges
There are two types of ranges, fixed range and auto range.
• Fixed range
• Voltage range
• When the crest factor is set to 3
Select 1.5 V, 3 V, 6 V, 10 V, 15 V, 30 V, 60 V, 100 V, 150 V, 300 V, 600 V, or
1000 V.
• When the crest factor is set to 6
Select 750 mV, 1.5 V, 3 V, 5 V, 7.5 V, 15 V, 30 V, 50 V, 75 V, 150 V, 300 V,
or 500 V.
• Current range
• For a 5-A input element
• When the crest factor is set to 3
Select 10 mA, 20 mA, 50 mA, 100 mA, 200 mA, 500 mA, 1 A, 2 A, or 5A.
• When the crest factor is set to 6
Select 5 mA, 10 mA, 25 mA, 50 mA, 100 mA, 250 mA, 500 mA, 1 A, or 2.5
A.
• For a 50-A input element
• When the crest factor is set to 3
Select 1 A, 2 A, 5 A, 10 A, 20 A, or 50 A.
• When the crest factor is set to 6
Select 500 mA, 1 A, 2.5 A, 5 A, 10 A, or 25 A.
Note
•
•
The range is set in reference to the RMS value of the input signal. For example, if a 100Vrms sinusoid is to be applied, set the range to 100 V.
The selectable current range varies depending on whether the installed element is a 5-A
input element or a 50-A input element. Check the type of element that is installed in the
product.
• Auto range
If you press the U Range Up Exec or the I Range Up Exec soft key when the range
is at maximum, auto range is enabled. The range switches automatically
depending on the amplitude of the input signal as follows. The different ranges
used in the auto range are the same as those available for fixed range.
5-6
IM 760101-01E
5.2 Setting the Measurement Range during Direct Input
• Range increase
• When the data of measurement function Urms or Irms exceeds 110% of the
current measurement range, the range is increased.
• When the peak value of the input signal exceeds 330% or 660% of the
current measurement range when the crest factor is set to 3 or 6,
respectively, the range is increased.
• Range decrease
When the data of the measurement function Urms or Irms is less than or equal
to 30% of the measurement range and Upk and Ipk is less than or equal to
300% or 600% of the next lower range when the crest factor is set to 3 or 6,
respectively, the range is decreased.
When non-periodic pulse waveforms are applied during auto range, the range may not remain
constant. In this case, use the fixed range setting.
Power Range
The measurement ranges (power ranges) of active power (P), apparent power (S),
and reactive power (Q) are as follows.
Wiring System
Power Range
1P2W (single-phase, two-wire)
voltage range × current range
1P3W (single-phase three-wire)
3P3W (three-phase three-wire)
3V3A (three-voltage, three-current)
voltage range × current range × 2
(when the voltage and current ranges on the
corresponding elements are set to the same range)
3P4W (three-phase four-wire)
voltage range × current range × 3
(when the voltage and current ranges on the
corresponding elements are set to the same range)
• When the result of voltage range × current range exceeds 1000 W (VA or var), the
displayed unit changes to kW (kVA or kvar).
• The display resolution is 60000.
Note
Because the voltage and current ranges switch independently according to range increase
and decrease conditions in auto range mode, different power ranges may be set for the same
power value.
IM 760101-01E
Copying Ranges
The measurement range specified for a given element can be set to the elements of
the same wiring unit. However, if the wiring system is pattern 1, the measurement
range can be copied to all other elements.
• The measurement range for other elements that were specified before is not held.
• If the crest factor is set to 3 and a current range between 10 mA and 500 mA is
specified on a 5-A input element and the range of this element is copied, the range
for 50-A input elements is set to the minimum range for the 50-A input element (1
A). If the crest factor is set to 6 and a current range between 5 mA and 250 mA is
specified on a 5-A input element and the range of this element is copied, the range
for 50-A input elements is set to the minimum range for the 50-A input element
(500 mA).
• If the crest factor is set to 3 and a current range between 10 A and 50 A is specified
on a 50-A input element and the range of this element is copied, the range for 5-A
input elements is set to the maximum range for the 5-A input element (5 A). If the
crest factor is set to 6 and a current range between 5 A and 25 A is specified on a
50-A input element and the range of this element is copied, the range for 5-A input
elements is set to the maximum range for the 5-A input element (2.5 A).
5-7
5
Measurement Conditions
Note
5.2 Setting the Measurement Range during Direct Input
The combinations of the actual voltage and current ranges and the power range are
listed below according to the table on the previous page (when the voltage or current
range of each element is set to the same range). The table shows the active power
range (unit: W). The same ranges are set for apparent power (unit: VA) and reactive
power (unit: var). Just replace the unit with VA or var when looking at the tables.
• When the crest factor is set to 3
Effective Power Range of the Wiring Unit of Wiring System 1P2W or Each Element
Current
Range
[A]
Voltage Range [V]
100.00
150.00
300.00
600.00
1000.0
10.000m 15.000 mW 30.000 mW 60.000 mW 100.00 mW 150.00 mW 300.00 mW 600.00 mW
1.5000
3.0000
6.0000
10.000
1.0000 W
1.5000 W
3.0000 W
6.0000 W
10.000 W
20.000m 30.000 mW 60.000 mW 120.00 mW 200.00 mW 300.00 mW 600.00 mW
1.2000 W
2.0000 W
3.0000 W
6.0000 W
12.000 W
20.000 W
50.000m
75.00 mW 150.00 mW 300.00 mW 500.00 mW
15.000
30.000
60.000
750.0 mW
1.5000 W
3.0000 W
5.0000 W
7.500 W
15.000 W
30.000 W
50.000 W
100.00m 150.00 mW 300.00 mW 600.00 mW
1.0000 W
1.5000 W
3.0000 W
6.0000 W
10.000 W
15.000 W
30.000 W
60.000 W
100.00 W
200.00m 300.00 mW 600.00 mW
1.2000 W
2.0000 W
3.0000 W
6.0000 W
12.000 W
20.000 W
30.000 W
60.000 W
120.00 W
200.00 W
500.00m
750.0 mW
1.5000 W
3.0000 W
5.0000 W
7.500 W
15.000 W
30.000 W
50.000 W
75.00 W
150.00 W
300.00 W
500.00 W
1.0000
1.5000 W
3.0000 W
6.0000 W
10.000 W
15.000 W
30.000 W
60.000 W
100.00 W
150.00 W
300.00 W
600.00 W
1.0000 kW
2.0000
3.0000 W
6.0000 W
12.000 W
20.000 W
30.000 W
60.000 W
120.00 W
200.00 W
300.00 W
600.00 W
1.2000 kW
2.0000 kW
5.0000
7.500 W
15.000 W
30.000 W
50.000 W
75.00 W
150.00 W
300.00 W
500.00 W
750.0 W
1.5000 kW
3.0000 kW
5.0000 kW
10.000
15.000 W
30.000 W
60.000 W
100.00 W
150.00 W
300.00 W
600.00 W 1.0000 kW
1.5000 kW
3.0000 kW
6.0000 kW
10.000 kW
20.000
30.000 W
60.000 W
120.00 W
200.00 W
300.00 W
600.00 W
1.2000 kW 2.0000 kW
3.0000 kW
6.0000 kW
12.000 kW
20.000 kW
50.000
75.00 W
150.00 W
300.00 W
500.00 W
750.0 W
1.5000 kW
3.0000 kW 5.0000 kW
7.500 kW
15.000 kW
30.000 kW
50.000 kW
600.00
1000.0
Effective Power Range of the Wiring Unit of Wiring System 1P3W, 3P3W, and 3V3A
Current
Range
[A]
Voltage Range [V]
100.00
150.00
300.00
10.000m 30.000 mW 60.000 mW 120.000 mW 200.00 mW 300.00 mW 600.00 mW 1200.00 mW
1.5000
3.0000
2.0000 W
3.0000 W
6.0000 W 12.0000 W
20.000m 60.000 mW 120.000 mW 240.00 mW 400.00 mW 600.00 mW 1200.00 mW
2.4000 W
4.0000 W
6.0000 W 12.0000 W
24.000 W
50.000m 150.00 mW 300.00 mW 600.00 mW 1000.00 mW 1500.0 mW
3.0000 W
6.0000 W 10.0000 W
15.000 W
30.000 W
60.000 W 100.000 W
100.00m 300.00 mW 600.00 mW 1200.00 mW
2.0000 W
3.0000 W
6.0000 W 12.0000 W
20.000 W
30.000 W
60.000 W 120.000 W
200.00m 600.00 mW 1200.00 mW
2.4000 W
4.0000 W
6.0000 W 12.0000 W
24.000 W
40.000 W
60.000 W 120.000 W
240.00 W
500.00m 1500.0 mW
6.0000 W 10.0000 W
15.000 W
30.000 W
150.00 W
300.00 W
600.00 W 1000.00 W
60.000 W 120.000 W
200.00 W
300.00 W
600.00 W 1200.00 W 2.0000 kW
240.00 W
400.00 W
600.00 W 1200.00 W 2.4000 kW 4.0000 kW
3.0000 W
6.0000
10.000
15.000
30.000
60.000
60.000 W 100.000 W
1.0000
3.0000 W
6.0000 W 12.0000 W
20.000 W
30.000 W
2.0000
6.0000 W 12.0000 W
24.000 W
40.000 W
60.000 W 120.000 W
5.0000
15.000 W
30.000 W
60.000 W 100.000 W
150.00 W
300.00 W
10.000
30.000 W
60.000 W 120.000 W
200.00 W
300.00 W
600.00 W 1200.00 W
20.000
60.000 W 120.000 W
240.00 W
400.00 W
600.00 W 1200.00 W 2.4000 kW
50.000
150.00 W
600.00 W 1000.00 W
300.00 W
1500.0 W
600.00 W 1000.00 W
20.000 W
40.000 W
200.00 W
400.00 W
1500.0 W
3.0000 kW 6.0000 kW 10.0000 kW
2.0000 kW 3.0000 kW
6.0000 kW 12.0000 kW 20.000 kW
4.0000 kW 6.0000 kW 12.0000 kW 24.000 kW 40.000 kW
3.0000 kW 6.0000 kW 10.0000 kW 15.000 kW
30.000 kW 60.000 kW 100.000 kW
Effective Power Range of the Wiring Unit of Wiring System 3P4W
Current
Range
[A]
5-8
Voltage Range [V]
1.5000
3.0000
6.0000
10.000
15.000
30.000
60.000
100.00
150.00
300.00
10.000m 45.000 mW 90.000 mW 180.000 mW 300.00 mW 450.00 mW 900.00 mW 1800.00 mW
3.0000 W
4.5000 W
9.0000 W 18.0000 W
20.000m 90.000 mW 180.000 mW 360.00 mW 600.00 mW 900.00 mW 1800.00 mW
3.6000 W
6.0000 W
9.0000 W 18.0000 W
36.000 W
50.000m 225.00 mW 450.00 mW 900.00 mW 1500.00 mW 2250.0 mW
4.5000 W
9.0000 W 15.0000 W
22.500 W
45.000 W
90.000 W 150.000 W
100.00m 450.00 mW 900.00 mW 1800.00 mW
3.0000 W
4.5000 W
9.0000 W 18.0000 W
30.000 W
45.000 W
90.000 W 180.000 W
200.00m 900.00 mW 1800.00 mW
3.6000 W
6.0000 W
9.0000 W 18.0000 W
36.000 W
60.000 W
90.000 W 180.000 W
360.00 W
500.00m 2250.0 mW
9.0000 W 15.0000 W
22.500 W
45.000 W
225.00 W
450.00 W
900.00 W 1500.00 W
90.000 W 180.000 W
300.00 W
450.00 W
900.00 W 1800.00 W 3.0000 kW
360.00 W
600.00 W
900.00 W 1800.00 W
3.6000 kW 6.0000 kW
2250.0 W
9.0000 kW 15.0000 kW
4.5000 W
90.000 W 150.000 W
600.00
1000.0
30.000 W
60.000 W
300.00 W
600.00 W
1.0000
4.5000 W
9.0000 W 18.0000 W
30.000 W
45.000 W
2.0000
9.0000 W 18.0000 W
36.000 W
60.000 W
90.000 W 180.000 W
5.0000
22.500 W
45.000 W
90.000 W 150.000 W
225.00 W
450.00 W
10.000
45.000 W
90.000 W 180.000 W
300.00 W
450.00 W
900.00 W 1800.00 W 3.0000 kW 4.5000 kW
20.000
90.000 W 180.000 W
360.00 W
600.00 W
900.00 W 1800.00 W
3.6000 kW 6.0000 kW 9.0000 kW 18.0000 kW
36.000 kW 60.000 kW
50.000
225.00 W
900.00 W 1500.00 W
2250.0 W 4.5000 kW
9.0000 kW 15.0000 kW 22.500 kW
90.000 kW 150.000 kW
450.00 W
900.00 W 1500.00 W
4.5000 kW
9.0000 kW 18.0000 kW 30.000 kW
45.000 kW
IM 760101-01E
5.2 Setting the Measurement Range during Direct Input
• When the crest factor is set to 6
Effective Power Range of the Wiring Unit of Wiring System 1P2W or Each Element
Current
Range
[A]
Voltage Range [V]
750m
5.0000m 3.7500 mW
1.5000
3.0000
5.0000
150.00
300.00
500.00
75.00 mW 150.00 mW 250.00 mW 375.00 mW
750.0 mW
1.5000 W
2.5000 W
75.00 mW 150.00 mW 300.00 mW 500.00 mW
750.0 mW
1.5000 W
3.0000 W
5.0000 W
750.0 mW
1.2500 W
1.8750 W
3.7500 W
7.500 W
12.500 W
3.7500 W
7.500 W
15.000 W
25.000 W
7.500 mW 15.000 mW 25.000 mW 37.500 mW
10.000m 7.500 mW 15.000 mW 30.000 mW 50.000 mW
25.000m 18.750 mW 37.500 mW
50.000m 37.500 mW
7.5000
15.000
75.00 mW 125.00 mW 187.50 mW 375.00 mW
30.000
50.000
75.000
1.5000 W
2.5000 W
100.00m 75.00 mW 150.00 mW 300.00 mW 500.00 mW
750.0 mW
1.5000 W
3.0000 W
5.0000 W
7.500 W
15.000 W
30.000 W
50.000 W
250.00m 187.50 mW 375.00 mW
1.8750 W
3.7500 W
7.500 W
12.500 W
18.750 W
37.500 W
75.00 W
125.00 W
500.00m 375.00 mW
75.00 mW 150.00 mW 250.00 mW 375.00 mW
750.0 mW
750.0 mW
1.2500 W
750.0 mW
1.5000 W
2.5000 W
3.7500 W
7.500 W
15.000 W
25.000 W
37.500 W
75.00 W
150.00 W
250.00 W
3.0000 W
5.0000 W
7.500 W
15.000 W
30.000 W
50.000 W
75.00 W
150.00 W
300.00 W
500.00 W
750.0 mW
1.5000 W
2.5000
1.8750 W
3.7500 W
7.500 W
12.500 W
18.750 W
37.500 W
75.00 W
125.00 W
187.50 W
375.00 W
750.0 W
1.2500 kW
5.0000
3.7500 W
7.500 W
15.000 W
25.000 W
37.500 W
75.00 W
150.00 W
250.00 W
375.00 W
750.0 W
1.5000 kW
2.5000 kW
10.000
7.500 W
15.000 W
30.000 W
50.000 W
75.00 W
150.00 W
300.00 W
500.00 W
750.0 W
1.5000 kW
3.0000 kW
5.0000 kW
25.000
18.750 W
37.500 W
75.00 W
125.00 W
187.50 W
375.00 W
750.0 W 1.2500 kW
1.8750 kW
3.7500 kW
7.500 kW
12.500 kW
75.000
150.00
Effective Power Range of the Wiring Unit of Wiring System 1P3W, 3P3W, and 3V3A
Current
Range
[A]
Voltage Range [V]
300.00
500.00
5.0000m 7.5000 mW 15.000 mW 30.000 mW 50.000 mW 75.000 mW 150.00 mW 300.00 mW 500.00 mW 750.00 mW 1500.0 mW
7500m
1.5000
3.0000
3.0000 W
5.0000 W
10.000m 15.000 mW 30.000 mW 60.000 mW 100.000 mW 150.00 mW 300.00 mW 600.00 mW 1000.0 mW 1500.0 mW
3.0000 W
6.0000 W 10.0000 W
25.000m 37.500 mW 75.000 mW 150.00 mW 250.00 mW 375.00 mW 750.00 mW 1500.0 mW
2.5000 W
3.7500 W
7.5000 W
15.000 W
25.000 W
50.000m 75.000 mW 150.00 mW 300.00 mW 500.00 mW 750.00 mW 1500.0 mW
3.0000 W
5.0000 W
7.5000 W
15.000 W
30.000 W
50.000 W
100.00m 150.00 mW 300.00 mW 600.00 mW 1000.0 mW 1500.0 mW
3.0000 W
6.0000 W 10.0000 W
15.000 W
30.000 W
60.000 W 100.000 W
250.00m 375.00 mW 750.00 mW 1500.0 mW
2.5000 W
3.7500 W
7.5000 W
15.000 W
25.000 W
37.500 W
75.000 W
150.00 W
250.00 W
500.00m 750.00 mW 1500.0 mW
5.0000 W
7.5000 W
15.000 W
30.000 W
50.000 W
75.000 W
150.00 W
300.00 W
500.00 W
3.0000 W
5.0000
7.5000
15.000
30.000
50.000
1.0000
1500.0 mW
3.0000 W
6.0000 W 10.0000 W
15.000 W
30.000 W
60.000 W 100.000 W
150.00 W
300.00 W
600.00 W 1000.00 W
2.5000
3.7500 W
7.5000 W
15.000 W
25.000 W
37.500 W
75.000 W
150.00 W
250.00 W
375.00 W
750.00 W
1500.0 W 2.5000 kW
5.0000
7.5000 W
15.000 W
30.000 W
50.000 W
75.000 W
150.00 W
300.00 W
500.00 W
750.00 W
1500.0 W 3.0000 kW 5.0000 kW
10.000
15.000 W
30.000 W
60.000 W 100.000 W
150.00 W
300.00 W
600.00 W 1000.00 W
25.000
37.500 W
75.000 W
150.00 W
250.00 W
375.00 W
750.00 W
1500.0 W
1500.0 W
3.0000 kW 6.0000 kW 10.000 kW
2.5000 kW 3.7500 kW
7.5000 kW 15.000 kW 25.000 kW
50.000
150.00
Effective Power Range of the Wiring Unit of Wiring System 3P4W
Current
Range
[A]
Voltage Range [V]
300.00
500.00
5.0000m 11.2500 mW 22.500 mW 45.000 mW 75.000 mW 112.500 mW 225.00 mW 450.00 mW 750.00 mW 1125.00 mW 2250.0 mW
4.5000 W
7.5000 W
10.000m 22.500 mW 45.000 mW 90.000 mW 150.000 mW 225.00 mW 450.00 mW 900.00 mW 1500.0 mW 2250.0 mW
9.0000 W 15.0000 W
750m
1.5000
3.0000
5.0000
7.5000
15.000
30.000
25.000m 56.250 mW 112.500 mW 225.00 mW 375.00 mW 562.50 mW 1125.00 mW 2250.0 mW
3.7500 W
75.000
4.5000 W
5.6250 W 11.2500 W
22.500 W
37.500 W
22.500 W
45.000 W
75.000 W
45.000 W
90.000 W 150.000 W
50.000m 112.500 mW 225.000 mW 450.00 mW 750.00 mW 1125.00 mW 2250.0 mW
4.5000 W
100.00m 225.00 mW 450.00 mW 900.00 mW 1500.0 mW 2250.0 mW
4.5000 W
9.0000 W 15.0000 W
22.500 W
250.00m 562.50 mW 1125.00 mW 2250.0 mW
3.7500 W
11.250 W
22.500 W
37.500 W
56.250 W 112.500 W
500.00m 1125.00 mW 2250.0 mW
7.5000 W 11.2500 W 22.5000 W
45.000 W
75.000 W 112.500 W
1.0000
2250.0 mW
4.5000 W
4.5000 W
9.0000 W 15.0000 W
5.6250 W
22.500 W
45.000 W
7.5000 W 11.2500 W
37.500 W
56.250 W 112.500 W
225.00 W
375.00 W
45.000 W
75.000 W 112.500 W
225.00 W
450.00 W
750.00 W 1125.00 W
10.000
22.500 W
45.000 W
90.000 W 150.000 W
225.00 W
450.00 W
900.00 W 1500.00 kW
25.000
56.250 W 112.500 W
IM 760101-01E
375.00 W
562.50 W 1125.00 W
900.00 W 1500.00 W
562.50 W 1125.00 W
22.500 W
22.500 W
225.00 W
750.00 W
450.00 W
225.00 W
11.2500 W
5.6250 W 11.2500 W
375.00 W
450.00 W
90.000 W 150.000 W
5.0000
2.5000
225.00 W
225.00 W
2250.0 W 3.7500 kW
2250.0 W
4.5000 kW 7.5000 kW
4.5000 kW
9.0000 kW 15.0000 kW
2250.0 W 3.7500 kW 5.6250 kW 11.2500 kW
22.500 kW 37.500 kW
2250.0 W
5-9
5
Measurement Conditions
1.0000
5.3
Setting the Measurement Range When Using
an External Current Sensor
«For a functional description, see section 1.3.»
Keys
SELE
CT
SET
RE
DISPLAY
HOLD
UP DATE
RATE
FILE
SINGLE
ESC
TRIG'D
WAVE
STORE
COPY
STORE SET
MENU
REMOTE
LOCAL
HARMONICS
CURSOR
MAX HOLD
MISC
NULL
SHIFT
To exit the menu during operation, press ESC.
INPUT
RANGE
SCALING
WIRING
AVG
MEASURE
MOTOR SET
FILTER
CAL
INTEGRATOR
START
STOP
INTEG SET
RESET
SYNC SRC
Procedure
1.
Press RANGE to display the Range menu.
Selecting the Target Element
2.
Press the Element Object soft key to display the Element menu.
Only the installed elements are displayed.
3.
Press one of the soft keys corresponding to the displayed element to select the
target element. The selected element is displayed at the upper right corner of
the screen (if you selected element 1, U1 and I1 are displayed).
Selecting the Current Sensor Input Connector
4.
Press the Terminal soft key to select Sen.
Setting the Current Sensor Range
5.
Press the I Range Up Exec or I Range Down Exec soft key to set the current
sensor range. The specified range is displayed by the element displayed at the
upper right corner of the screen.
•
•
6.
ESC
5-10
Pressing the I Range Up Exec soft key increases the current sensor range.
If you press the I Range Up Exec soft key when the range is at maximum, auto
range is enabled.
Pressing the I Range Down Exec soft key decreases the current sensor range.
Repeat steps 2 to 5 to set the current sensor range of all elements.
ESC
ESC
ESC
IM 760101-01E
5.3 Setting the Measurement Range When Using an External Current Sensor
Copying the Current Sensor Range
The current sensor range specified for a given element can be set to the elements of
the same wiring unit. The voltage range (see section 5.1) is also copied. The current
sensor range for other elements that were specified before is not held.
3.
Press one of the soft keys corresponding to the displayed element from which
the information is to be copied (the copy source).
4.
Press the Range Copy Exec soft key. The current sensor range and the
voltage range of the copy source are copied to the elements of the same wiring
unit. However, if the wiring system is pattern 1, the measurement range is
copied to all other elements.
ESC
5
ESC
Measurement Conditions
Setting the Current Sensor Transformation Ratio
1.
Press SCALING to display the Scaling menu.
• Selecting the target element
If you are setting the current sensor transformation ratio on the same element that
you entered the current sensor range, steps 2 and 3 are not necessary.
2.
Press the Element Object soft key to display the Element menu.
Only the installed elements are displayed.
3.
Press one of the soft keys corresponding to the displayed element to select the
target element. The selected element is displayed at the upper right corner of
the screen (if you selected element 1, U1 and I1 are displayed).
• Setting the current sensor transformation ratio
4.
Press the Sensor Ratio(mV/A) soft key.
5.
Turn the jog shuttle to set the transformation ratio.
For the procedures on how to enter values using the jog shuttle, see section 3.12,
“Entering Values and Strings.”
ESC
IM 760101-01E
ESC
ESC
5-11
5.3 Setting the Measurement Range When Using an External Current Sensor
• Copying the current sensor transformation ratio
The current sensor transformation ratio specified for a given element can be set to the
elements of the same wiring unit. The ON/OFF condition, PT ratio, CT ratio, and
power coefficient (see section 5.4) of the scaling function area also copied. The
current sensor transformation ratio and the ON/OFF condition, PT ratio, CT ratio, and
power coefficient of the scaling function for other elements that were specified before
are not held.
3.
Press one of the soft keys corresponding to the displayed element from which
the information is to be copied (the copy source).
4.
Press the Scaling Copy Exec soft key. The current sensor transformation ratio
and the ON/OFF condition, PT ratio, CT ratio, and power coefficient of the
scaling function of the copy source are copied to the elements of the same
wiring unit. However, if the wiring system is pattern 1, the measurement range
is copied to all other elements.
ESC
ESC
Explanation
The output of current sensors, such as shunts and clamps, can be input to the current
sensor input connector of an element and be measured.
Display Position of the Target Element and Specified Range
It is the same as section 5.2, “Setting the Measurement Range during Direct Input.”
Selecting the Current Sensor Input Connector
To measure the current using the input signal from the current sensor input connector,
Sen must be selected for the Terminal in the Range menu and then the current
sensor range and current sensor transformation ratio must be specified.
Selecting the Current Sensor Range
Two types of range settings are available: fixed range and auto range.
• Fixed range
• When the crest factor is set to 3
Select 50 mV, 100 mV, 250 mV, 500 mV, 1 V, 2 V, 5 V, or 10 V.
• When the crest factor is set to 6
Select 25 mV, 50 mV, 125 mV, 250 mV, 500 mV, 1 V, 2.5 V, 5 V.
• Auto range
Select Auto for range setting to enable auto range. The range changes
automatically depending on the amplitude of the input signal. The switching
conditions and precautions are the same as the descriptions given in section 5.2,
“Setting the Measurement Range during Direct Input. The different ranges used in
the auto mode are the same as those available for fixed range.
5-12
IM 760101-01E
5.3 Setting the Measurement Range When Using an External Current Sensor
Copying the Current Sensor Range
The current sensor range specified for a given element can be set to the elements of
the same wiring unit. However, if the wiring system is pattern 1, the measurement
range can be copied to all other elements.
• The voltage range (see section 5.2) is also copied.
• The current sensor range for other elements that were specified before is not held.
Setting the Current Sensor Transformation Ratio
The ratio can be set in the range of 0.0001 to 99999.9999.
Configuration Example of the Current Sensor Range and Transformation Ratio
When measuring a current with a maximum value of 100 A using a current sensor that
outputs 10 mV when 1 A of current is flowing, the equation becomes 10 mV/A × 100 A = 1 V.
Therefore, set 1 V for the current sensor range and 10 mV/A for the current sensor
transformation ratio.
Note
When attempting to directly read the current of the circuit under measurement by multiplying
the output of the external current sensor by the transformation ratio, turn OFF the external
PT/CT scaling function (see section 5.4). If it is turned ON, the value will be multiplied by the
CT ratio.
IM 760101-01E
5-13
5
Measurement Conditions
Copying the Current Sensor Transformation Ratio
The current sensor transformation ratio specified for a given element can be set to the
elements of the same wiring unit. However, if the wiring system is pattern 1, the
measurement range can be copied to all other elements.
• The ON/OFF condition, PT ratio, CT ratio, and power coefficient (see section 5.4)
of the scaling function area also copied.
• The current sensor transformation ratio and the ON/OFF condition, PT ratio, CT
ratio, and power coefficient of the scaling function for other elements that were
specified before are not held.
5.4
Setting the Scaling Function When Using an
External PT or CT
«For a functional description, see section 1.3.»
Keys
SELE
CT
SET
RE
DISPLAY
HOLD
UP DATE
RATE
FILE
SINGLE
ESC
TRIG'D
WAVE
STORE
COPY
STORE SET
MENU
REMOTE
LOCAL
HARMONICS
CURSOR
MAX HOLD
MISC
NULL
SHIFT
To exit the menu during operation, press ESC.
INPUT
RANGE
SCALING
WIRING
AVG
MEASURE
MOTOR SET
FILTER
CAL
INTEGRATOR
START
STOP
INTEG SET
RESET
SYNC SRC
Procedure
1.
Press SCALING to display the Scaling menu.
Selecting the Target Element
2.
Press the Element Object soft key to display the Element menu.
Only the installed elements are displayed.
3.
Press one the soft keys corresponding to the displayed element to select the
target element.
Turning ON/OFF the Scaling Function
4.
Press the Scaling soft key to select ON or OFF. If any of the target elements is
turned ON, the SCALING indicator above and to the left of the key illuminates.
Setting the PT Ratio
4.
Press the Pt Ratio soft key.
5.
Turn the jog shuttle to set the PT ratio.
For the procedures on how to enter values using the jog shuttle, see section 3.12,
“Entering Values and Strings.”
ESC
5-14
ESC
ESC
ESC
IM 760101-01E
5.4 Setting the Scaling Function When Using an External PT or CT
Setting the CT Ratio
4.
Press the Ct Ratio soft key.
5.
Turn the jog shuttle to set the CT ratio.
For the procedures on how to enter values using the jog shuttle, see section 3.12,
“Entering Values and Strings.”
ESC
5
Measurement Conditions
Setting the Power Coefficient
4.
Press the Scaling Factor soft key.
5.
Turn the jog shuttle to set the power coefficient.
For the procedures on how to enter values using the jog shuttle, see section 3.12,
“Entering Values and Strings.”
ESC
Copying the ON/OFF Condition, PT Ratio, CT Ratio, and Power Coefficient of the
Scaling Function
The ON/OFF condition, PT ratio, CT ratio, and power coefficient of the scaling
function specified for a given element can be set to the elements of the same wiring
unit. The current sensor transformation ratio (see section 5.3) is also copied. The
current the ON/OFF condition, PT ratio, CT ratio, and power coefficient of the scaling
function and the current sensor transformation ratio for other elements that were
specified before are not held.
3.
Press one of the soft keys corresponding to the displayed element from which
the information is to be copied (the copy source).
4.
Press the Scaling Copy Exec soft key. The current the ON/OFF condition, PT
ratio, CT ratio, and power coefficient of the scaling function and the sensor
transformation ratio of the copy source are copied to the elements of the same
wiring unit. However, if the wiring system is pattern 1, the measurement range
is copied to all other elements.
IM 760101-01E
5-15
5.4 Setting the Scaling Function When Using an External PT or CT
ESC
ESC
Explanation
Measurements can be made by connecting the output of the secondary side of the PT
and the output of the secondary side of the CT to the same voltage and current input
terminals that are used when directly inputting a signal.
Turning ON/OFF the Scaling Function
You can select whether to multiply the voltage U, current I, and power (P, S, and Q)
by the PT ratio, CT ratio, and power coefficient respectively. If any of the target
elements is turned ON, the SCALING indicator above and to the left of the key
illuminates.
• ON : The voltage U, current I, and power (P, S, and Q) are multiplied by the PT
ratio, CT ratio, and power coefficient.
• OFF : The voltage U, current I, and power (P, S, and Q) are not multiplied by the
PT ratio, CT ratio, and power coefficient. The output values of the external PT and
CT are read directly as numerical data in this case.
Setting the PT Ratio
The ratio can be set in the range of 0.0001 to 99999.9999.
Setting the CT Ratio
The ratio can be set in the range of 0.0001 to 99999.9999.
Setting the Power Coefficient
The ratio can be set in the range of 0.0001 to 99999.9999.
Note
If the result of multiplying the PT ratio, CT ratio, or power coefficient (scaling factor) to the
measurement range exceeds 99999M, the display frame of the numerical data will display [-OF-].
5-16
IM 760101-01E
5.5
Selecting the Input Filter
«For a functional description, see section 1.3.»
Keys
SELE
CT
SET
RE
DISPLAY
HOLD
UP DATE
RATE
FILE
SINGLE
ESC
TRIG'D
WAVE
STORE
COPY
STORE SET
MENU
REMOTE
HARMONICS
CURSOR
LOCAL
MAX HOLD
MISC
NULL
SHIFT
5
To exit the menu during operation, press ESC.
Measurement Conditions
INPUT
RANGE
SCALING
WIRING
AVG
MEASURE
MOTOR SET
FILTER
CAL
INTEGRATOR
START
STOP
INTEG SET
RESET
SYNC SRC
Procedure
1.
Press FILTER to display the Filter menu.
Selecting the Target Element
2.
Press the Element Object soft key to display the Element menu.
Only the installed elements are displayed.
3.
Press one the soft keys corresponding to the displayed element to select the
target element.
Selecting the Line Filter
4.
Press the Line Filter soft key to select the filter from OFF to 5.5k. If any of the
target elements is set to a setting other than OFF, the FILTER indicator above
and to the left of the key illuminates.
Selecting the Zero Crossing Filter
4.
Press the Zero Cross Filter soft key to select OFF or 500.
ESC
IM 760101-01E
ESC
ESC
5-17
5.5 Selecting the Input Filter
Copying the Input Filter
The input filter specified for a given element can be set to the elements of the same
wiring unit. The input filters for other elements that were specified before is not held.
3.
Press one of the soft keys corresponding to the displayed element from which
the information is to be copied (the copy source).
4.
Press the Filter Copy Exec soft key. The input filter of the copy source is
copied to the elements of the same wiring unit. However, if the wiring system is
pattern 1, the measurement range is copied to all other elements.
ESC
ESC
Explanation
There are two types of filters.
Selecting the Line Filter
The line filter is inserted into the circuit under measurement. It removes the noise
from the inverter and from distorted waveforms.
• The cutoff frequency can be selected from the list of choices below.
OFF, 500 Hz, and 5.5 kHz
• If any of the target elements is set to a setting other than OFF, the FILTER
indicator above and to the left of the key illuminates.
• Selecting OFF disables the filter.
Selecting the Zero Crossing Filter
This filter is inserted only into the frequency measurement circuit. Zero crossing
refers to the point at which the input signal crosses the center level of the amplitude.
This filter is used to accurately detect the zero crossing point.
• The cutoff frequency can be selected from the list of choices below.
OFF and 500 Hz
• This instrument detects the zero crossing point with a hysteresis of approximately
5% of the measurement range.
• When the zero crossing filter is OFF and the line filter (above) is ON, the cutoff
frequency specified by the line filter is used as a zero crossing filter.
Note
For selecting the line filter for the motor evaluation function, see section 8.3.
5-18
IM 760101-01E
5.6
Averaging
«For a functional description, see section 1.3.»
Keys
SELE
CT
SET
RE
DISPLAY
HOLD
UP DATE
RATE
FILE
SINGLE
ESC
TRIG'D
WAVE
STORE
COPY
STORE SET
MENU
REMOTE
HARMONICS
CURSOR
LOCAL
MAX HOLD
MISC
NULL
SHIFT
5
To exit the menu during operation, press ESC.
Measurement Conditions
INPUT
RANGE
SCALING
WIRING
AVG
MEASURE
MOTOR SET
FILTER
CAL
INTEGRATOR
START
STOP
INTEG SET
RESET
SYNC SRC
Procedure
During Normal Measurement
1.
Press AVG to display the Avg menu.
Turning ON/OFF the Averaging Function
2.
Press the Averaging soft key to select ON or OFF.
Selecting the Averaging Type
3.
Press the Avg Type soft key to select Exp or Lin.
Setting the Attenuation Constant or the Average Count
4.
Press the Count soft key.
5.
Turn the jog shuttle to set the attenuation constant or the average count.
•
•
For the procedures on how to enter values using the jog shuttle, see section 3.12,
“Entering Values and Strings.”
If the averaging type is Exp (exponential averaging), set the attenuation constant. If
the averaging type is Lin (moving averaging), set the average count.
ESC
IM 760101-01E
5-19
5.6 Averaging
During Harmonic Measurement
If Mode is turned ON in the Harmonics menu (see section 7.1), the instrument enters the
harmonic measurement mode.
1.
Press AVG to display the Avg menu.
Turning ON/OFF the Averaging Function
2.
Press the Averaging soft key to select ON or OFF.
ESC
Explanation
The averaging function is effective when reading of the numerical display is difficult due
to fluctuations. This occurs when the fluctuation of the power supply or the load is large
or when the input signal frequency is low.
During Normal Measurement
Turning ON/OFF Averaging
You can select whether to perform the specified averaging operation.
• ON: Performs averaging.
• OFF: Does not perform averaging.
Selecting the Averaging Type
Select one of the following list of choices. For the equation of each type, see section
1.3.
• Exp: Performs exponential averaging.
• Lin: Performs moving averaging.
Setting the Attenuation Constant or Average Count
If the averaging type is Exp (exponential averaging), set the attenuation constant. If
the averaging type is Lin (moving averaging), set the average count.
• For Exp: Select the attenuation constant from 2, 4, 8, 16, 32, and 64.
• For Lin: Select the average count from 8, 16, 32, 64, 128, and 256.
Measurement Functions That Are Averaged
The measurement functions that are directly averaged are shown below. Other
functions that use these functions in their computation are also affected by the
averaging. For details regarding the determination of each measurement function,
see appendix 1.
• Urms, Irms, Umn, Imn, Udc, Idc, and P
• Torque and speed are also measured when the motor evaluation function option (/
MTR) is installed.
5-20
IM 760101-01E
5.6 Averaging
During Harmonic Measurement
If Mode is turned ON in the Harmonics menu (see section 7.1), the instrument enters the
harmonic measurement mode.
When the fundamental frequency is 50/60 Hz, the attenuation constant is automatically
adjusted so that a first-order low-pass filter with a time constant of 1.5 s is achieved.
Exponential averaging is performed using this attenuation constant. For example, if the
data length for the analysis is 8192 and the fundamental frequency of the PLL source is
between 55 Hz and 75 Hz, the attenuation constant is set to 5.625. For other
frequencies, it is set to 4.6875.
5
Measurement Functions That Are Averaged
The measurement functions that are directly averaged are shown below. Other
functions that use these functions in their computation are also affected by the
averaging. For details regarding the determination of each measurement function,
see appendix 1.
U(k), I(k), P(k), and Q(k)
* k: harmonic order
Note
•
IM 760101-01E
The following measurement functions are not affected by averaging.
• During normal measurement
fU, fI, U+pk, U-pk, I+pk, I-pk, Time, Wp, Wp+, Wp-, q, q+, q-, WpΣ, Wp+Σ, WP-Σ, qΣ, q+Σ,
and q-Σ
• During harmonic measurement
φU(k), φI(k), φU1-U2, φU1-U3, φU1-I1, φU1-I2, and φU1-I3
* k: harmonic order
5-21
Measurement Conditions
Turning ON/OFF Averaging
You can select whether to perform the specified averaging operation.
• ON: Performs averaging.
• OFF: Does not perform averaging.
5.7
Changing the Data Update Rate
«For a functional description, see section 1.3.»
Keys
SELE
CT
SET
RE
DISPLAY
HOLD
UP DATE
RATE
FILE
SINGLE
ESC
TRIG'D
WAVE
CURSOR
STORE
COPY
STORE SET
MENU
REMOTE
HARMONICS
LOCAL
MAX HOLD
MISC
NULL
SHIFT
To exit the menu during operation, press ESC.
INPUT
RANGE
SCALING
WIRING
AVG
MEASURE
MOTOR SET
FILTER
CAL
INTEGRATOR
START
STOP
INTEG SET
RESET
SYNC SRC
Procedure
During Normal Measurement
1.
2.
Press UPDATE RATE to display the Update Rate menu.
Press the Update Rate Up Exec or Update Rate Down Exec soft key to
change the data update rate. The specified data update rate is displayed at the
upper right corner of the screen.
•
•
Pressing the Update Rate Up Exec soft key increases data update rate.
Pressing the Update Rate Down Exec soft key decreases data update rate.
ESC
During Harmonic Measurement
The data update rate is determined by the fundamental frequency of the PLL source and
the number of periods of the PLL source used for the analysis. You can not change the
data update rate from the Update Rate menu described in this section. For detailed
values, see section 17.6, “Functions.”
5-22
IM 760101-01E
5.7 Changing the Data Update Rate
Explanation
The data update rate refers to the interval in which the sampled data used to determine
the measurement functions is retrieved. When the retrieval of waveform display data is
OFF during normal measurement, the D/A output, communication output, or storing (to
the internal memory) of the numerical data is carried out using this interval.
Display Position of the Data Update Rate
The data update rate is displayed at the upper right corner of the screen when
UPDATE RATE is pressed.
Data update rate
5
During Normal Measurement
The data update rate is determined by the fundamental frequency of the PLL source
and the number of periods of the PLL source used for the analysis. You can not
change the data update rate from the Update Rate menu described in this section.
For detailed values, see section 17.6, “Functions.”
Note
The update rate of the numerical data and waveform data that are displayed on the screen
may take longer than the data update rate.
IM 760101-01E
5-23
Measurement Conditions
During Normal Measurement
You can select from the following choices. The numerical data is updated at the
selected period. You can increase the data update rate to acquire relatively fast load
fluctuations in the power system or decrease the rate to acquire sampled data for
several periods even for relatively long signals.
50 ms, 100 ms, 200 ms, 500 ms, 1 s, 2 s, and 5 s
5.8
Holding the Display and Performing Single
Measurements
«For a functional description, see section 1.3.»
Keys
SELE
CT
SET
RE
DISPLAY
HOLD
UP DATE
RATE
FILE
SINGLE
ESC
TRIG'D
WAVE
CURSOR
STORE
COPY
STORE SET
MENU
REMOTE
HARMONICS
LOCAL
MAX HOLD
MISC
NULL
SHIFT
To exit the menu during operation, press ESC.
INPUT
RANGE
SCALING
WIRING
AVG
MEASURE
MOTOR SET
FILTER
CAL
INTEGRATOR
START
STOP
INTEG SET
RESET
SYNC SRC
Procedure
Holding the Numerical Data Display
1.
Press HOLD. The HOLD indicator above and to the left of the key illuminates,
and the numerical data display is held.
Performing a Single Measurement
2.
Press SHIFT+HOLD (SINGLE). The measurement is performed once and the
instrument enters the held condition.
Releasing the Held Condition
3.
Press HOLD while the values are held. The HOLD indicator turns OFF, and the
numerical data display is updated.
Explanation
Hold
This function aborts the measurement-display operation that is performed at the data
update rate and holds the data display of the various functions. The D/A output, the
numerical data list that the built-in printer prints, the communication output, and other
values are set to the held numerical data.
Single Measurement
While in the held condition, the measurement is performed once at the specified data
update rate and enters the held condition.
Note
For details on the hold function during integration, see section 6.11.
5-24
IM 760101-01E
5.9
Holding the Numerical Data Display at the
Maximum
«For a functional description, see section 1.3.»
Keys
SELE
CT
SET
RE
DISPLAY
HOLD
UP DATE
RATE
FILE
SINGLE
ESC
TRIG'D
WAVE
CURSOR
STORE
COPY
STORE SET
MENU
REMOTE
HARMONICS
LOCAL
MAX HOLD
MISC
NULL
SHIFT
5
To exit the menu during operation, press ESC.
Measurement Conditions
INPUT
RANGE
SCALING
WIRING
AVG
MEASURE
MOTOR SET
FILTER
CAL
INTEGRATOR
START
STOP
INTEG SET
RESET
SYNC SRC
Procedure
Holding the Numerical Data Display at the Maximum
1.
Press SHIFT+LOCAL (MAX HOLD). The MAX HOLD indicator above and to
the left of the key illuminates, and the numerical data display is held at the
maximum.
Releasing the MAX Held Condition
2.
Press SHIFT+LOCAL (MAX HOLD) when the MAX HOLD indicator above and
to the left of the key is illuminated. The MAX HOLD indicator turns OFF and
MAX hold is released.
Explanation
MAX Hold
This function enables the maximum value of the numerical data to be held.
• Holds the data of measurement functions Urms, Umn, Udc, Uac, Irms, Imn, Idc,
Iac, P, S, Q, U+pk, U-pk, I+pk, and I-pk as well as the data of the Σ function of
these functions while the MAX hold function is enabled.
• The D/A output, the numerical data list that the built-in printer prints, the
communication output, and other values are set to the maximum held values.
IM 760101-01E
5-25
5.10 Performing Master/Slave Synchronized
Measurements
«For a functional description, see section 1.3.»
Keys
SELE
CT
SET
RE
DISPLAY
HOLD
UP DATE
RATE
FILE
SINGLE
ESC
TRIG'D
WAVE
STORE
COPY
STORE SET
MENU
REMOTE
HARMONICS
CURSOR
LOCAL
MAX HOLD
MISC
NULL
SHIFT
To exit the menu during operation, press ESC.
INPUT
RANGE
SCALING
WIRING
AVG
MEASURE
MOTOR SET
FILTER
CAL
INTEGRATOR
START
STOP
INTEG SET
RESET
SYNC SRC
Procedure
Setting the Instrument to be a Master or a Slave
1.
Press MEASURE to display the Measure menu.
2.
Press the Sync Measure soft key to select Master or Slave.
Only a single master and a single slave can be specified.
During normal measurement
ESC
During harmonic measurement
ESC
Performing Synchronized Measurements
Connect the external start signal input/output connectors between the master and
slave instruments using BNC connectors (sold separately) and do the same for the
external stop signal input/output connectors.
• The slave instrument starts its measurement at approximately the same time as the
start of the measurement on the master instrument.
• The slave instrument stops its measurement at approximately the same time as the
stop of the measurement on the master instrument.
5-26
IM 760101-01E
5.10 Performing Master/Slave Synchronized Measurements
Explanation
With the master instrument outputting measurement start and stop signals and the slave
instrument receiving those signals, synchronized measurement on two instruments is
achieved.
External Start/Stop Signal Input/Output Connector
Connect the external start signal input/output connectors on the rear panel between
the master and slave instruments using BNC connectors (sold separately) and do the
same for the external stop signal input/output connectors.
5
START
MEAS.
Item
Specification
Notes
Connector type
I/O level
BNC connector
TTL
Common to master and slave
Common to master and slave
Output logic
(Negative), falling edge
Applies to the master
Measurement start delay time Within (100 ns + 1 sample period) Applies to the master
Output hold time
Low level, 200 ns or more
Applies to the master
Input logic
Minimum pulse width
Input delay time
(Negative), falling edge
Applies to the slave
Low level, 200 ns or more
Applies to the slave
Within (100 ns + 1 sample period) Applies to the slave
Note
Synchronized measurement is unavailable in the following situations.
• when either master, slave, or both are in harmonic measurement mode.
• when the data update rate or retrieval of waveform display data ON/OFF setting for the
master is different from that of the slave.
• when real-time integration mode or store is in real-time mode.
Output Circuit for the External Start/Stop Signal and Time Chart
+5V
10 kΩ
+5V
100 Ω
Start/Stop
output signal
Measurement start delay time
Measurement start
Start/Stop
output signal
Output hold time
IM 760101-01E
5-27
Measurement Conditions
STOP
5.10 Performing Master/Slave Synchronized Measurements
Input Circuit for the External Start/Stop Signal and Time Chart
+5 V
100 Ω
Start/Stop
input signal
Minimum pulse width
Start/Stop
input signal
Input delay time
Measurement start
Trigger occurrence
CAUTION
• When the instrument is set to master, do not apply external voltage to the
external start/stop signal input/output connector (START/STOP). This may
cause damage to the instrument.
• Applying a voltage outside the 0 to 5 V range to the external start/stop signal
input/output connector when the instrument is set to slave may cause damage
to the instrument.
5-28
IM 760101-01E
5.11 Selecting the Crest Factor
Keys
SELE
CT
SET
RE
DISPLAY
HOLD
UP DATE
RATE
FILE
SINGLE
ESC
TRIG'D
WAVE
STORE
COPY
STORE SET
MENU
REMOTE
HARMONICS
CURSOR
LOCAL
MAX HOLD
MISC
NULL
SHIFT
5
To exit the menu during operation, press ESC.
Measurement Conditions
INPUT
RANGE
SCALING
WIRING
AVG
MEASURE
MOTOR SET
FILTER
CAL
INTEGRATOR
START
STOP
INTEG SET
RESET
SYNC SRC
Procedure
1.
2.
Press MISC to display the Misc menu.
Press the Config soft key to display the Config menu.
• Selecting the Crest Factor
3.
Press Crest Factor to select CF3 or CF6.
ESC
ESC
Explanation
Selecting the Crest Factor
The crest factor is a ratio of the peak to the rms value.
You can select CF3 or CF6.
Note
If you set the crest factor to 6, the voltage range and current range are set to the maximum
range on all elements.
If you set the crest factor to 6, the measurement conditions of crest factor 5 and higher
required by IEC 62018 are met.
IM 760101-01E
5-29
Chapter 6
Normal Measurement and Integration
6.1
Changing the Displayed Item of Numerical Data
«For a functional description, see section 1.4.»
Keys
SELE
CT
SET
RE
DISPLAY
HOLD
UP DATE
RATE
FILE
SINGLE
ESC
TRIG'D
WAVE
CURSOR
STORE
COPY
STORE SET
MENU
REMOTE
HARMONICS
LOCAL
MAX HOLD
MISC
NULL
SHIFT
To exit the menu during operation, press ESC.
6
INPUT
RANGE
WIRING
AVG
MEASURE
MOTOR SET
FILTER
CAL
INTEGRATOR
START
STOP
INTEG SET
RESET
SYNC SRC
Procedure
Check that the measurement mode is set to normal measurement. If the
measurement mode is set to harmonic measurement, set Mode to OFF in the
Harmonics menu (see section 7.1).
1.
Press DISPLAY to display the Display menu.
Check that Format (display format) is set to Numeric, Numeric+Wave, or
Numeric+Trend. For details on setting the display format, see section 4.1.
Check that Item Amount (number of displayed items) is set to 4 (2), 8 (4), 16 (8),
42 (21), or 78 (39). For details on setting the number of displayed items, see
section 4.1.
ESC
IM 760101-01E
6-1
Normal Measurement and Integration
SCALING
6.1 Changing the Displayed Item of Numerical Data
The following procedures are given for a representative example in which the
display format is set to Numeric.
2.
Press the Numeric Disp Items soft key to display the Numeric Items menu.
Selecting the Item to Be Changed
3.
Turn the jog shuttle to select the item to be changed. The item to be changed
is highlighted.
Changing the Measurement Function
4.
Press the Function soft key to display the measurement function selection box.
5.
Turn the jog shuttle to select any of the measurement function starting with
None.
6.
Press SELECT. The symbol for the selected measurement function and the
numerical data are displayed at the highlighted position.
Changing the Element/Wiring Unit
7.
Press the Element soft key to display the element/wiring unit selection box.
8.
Turn the jog shuttle to select any of the elements/wiring units starting with
Element1.
9.
Press SELECT. The symbol for the selected element number or wiring unit and
the numerical data are displayed at the highlighted position.
ESC
ESC
ESC
ESC
Resetting the Order of the Displayed Items
3.
Press the Reset List Exec soft key. The Alert dialog box is displayed.
4.
Turn the jog shuttle to select OK or Cancel.
5.
Select OK and press SELECT to execute the reset of the order of the displayed items.
Select Cancel and press SELECT to abort the reset of the order of the displayed items.
ESC
6-2
IM 760101-01E
6.1 Changing the Displayed Item of Numerical Data
Explanation
Changing the Element/Wiring Unit
• You can select the element/wiring unit from the following list of choices. The
selectable items vary depending on the installed elements.
Element1, Element2, Element3, Element4, Element5, Element6,
ΣA, ΣB, and ΣC
• If there are no elements that are assigned to the selected wiring unit, there is no
numerical data. Thus, [-------] (no data) is displayed in this case. For example, if
elements are assigned to ΣA and ΣB and no elements are assigned to ΣC, then the
measurement function for ΣC shows [-------] (no data).
Change the element of
the third item
Change the measurement
function of the third item
Resetting the Order of Display Items
You can reset the displayed order of numerical data to a preset order. For details on
the reset information, see appendix 3, “List of Initial Settings and Display Order of
Numerical Data.”
Note
•
•
•
IM 760101-01E
For the meanings of the measurement function symbols that are displayed, see section 1.2,
“Measurement Functions and Measurement Periods,” 1.5, “Computation,” 1.6, “Integration,”
appendix 1, “Symbols and Determination of Measurement Functions,” and appendix 2,
“Determination of Delta Computation.”
For details on the wiring units expressed as ΣA, ΣB, and ΣC, see section 5.1, “Selecting the
Wiring System.”
[-------] (no data) is displayed in places where the measurement function is not selected or
where numerical data is not present.
6-3
6
Normal Measurement and Integration
Changing the measurement function
• The types of measurement functions that can be selected are the items that are
indicated in “Measurement Function Types during Normal Measurement” and
“Measurement Function Types for Motor Evaluation Function (Option)” in section
1.2; “Delta Computation,” “User-Defined Functions,” and “Corrected Power” in
section 1.5; and “Measurement Functions of Integration” in section 1.6.
• You can also select not to display the measurement functions (None).
• The number (1, 2, 3, and 4) that is attached to the measurement function symbol of
the delta computation has no relation to the element number. For delta
computation with only a single measurement function, a fixed number is displayed
regardless of the element selected in the next section. For delta computation with
multiple measurement functions (voltage), Element1 through Element3 (selected in
the next section) correspond to the numbers 1 through 3 that are attached to the
measurement functions of the delta computation regardless of the element
specified as the delta computation target.
• The number attached to the user-defined function F1 to F4 is a portion of the
measurement function symbol. It is not related to the element number.
6.2
Setting the Measurement Period
«For a functional description, see section 1.2.»
Keys
SELE
CT
SET
RE
DISPLAY
HOLD
UP DATE
RATE
ESC
TRIG'D
WAVE
STORE
COPY
STORE SET
MENU
FILE
SINGLE
REMOTE
HARMONICS
CURSOR
LOCAL
MAX HOLD
MISC
NULL
SHIFT
To exit the menu during operation, press ESC.
INPUT
RANGE
SCALING
WIRING
AVG
MEASURE
MOTOR SET
FILTER
CAL
INTEGRATOR
START
STOP
INTEG SET
RESET
SYNC SRC
Procedure
1.
Press SYNC SRC to display the Sync Src menu.
Selecting the Target Element
2.
Press the Element Object soft key to display the Element menu.
Only the installed elements are displayed.
3.
Press one the soft keys corresponding to the displayed element to select the
target element. The selected element is displayed at the upper right corner of
the screen (if you selected element 1, Sync Src1 are displayed).
Setting the Synchronization Source
4.
Press the Item Up Exec or Item Down Exec soft key to set the synchronization
source. The specified synchronization source is displayed by the element
displayed at the upper right corner of the screen.
ESC
6-4
ESC
ESC
IM 760101-01E
6.2 Setting the Measurement Period
Copying the Synchronization Source
The synchronization source specified for a given element can be set to the elements
of the same wiring unit. The synchronization source for other elements that were
specified before is not held.
3.
Press one of the soft keys corresponding to the displayed element from which
the information is to be copied (the copy source).
4.
Press the Item Copy Exec soft key. The synchronization source of the copy
source is copied to the elements of the same wiring unit. However, if the wiring
system is pattern 1, the measurement range is copied to all other elements.
ESC
ESC
6
During normal measurement, the numerical data is measured or computed using the sampled
data in the measurement period that is determined according to the following principle.
Display Position of the Target Element and Synchronization Source
Displayed at the upper right corner of the screen when SYNC SRC is pressed.
Target element
Synchronization source
(example in which the voltage of Element2 is specified)
Selecting the Target Element to Be Specified
Only the installed elements are displayed. The Element menu is displayed according
to the element configuration of the product.
Setting the Synchronization Source
You can select which input signal will be the synchronization source (synchronized to
the zero-crossing point of the input signal) for each element. Select the signal to be
the synchronization source from the following list of choices. The selectable items
vary depending on the installed elements.
U1, I1, U2, I2, U3, I3, U4, I4, U5, I5, U6, I6, Ext Clk (external clock)*, and None
*
For the specifications of the Ext Clk (external clock), see the explanation in section 7.4.
Note
•
•
IM 760101-01E
If you specify no synchronization source by selecting “None,” the entire sampled data within the data
update interval is the data used to determine the numerical data. When measuring DC signals, this
method can be used to prevent errors in the detection of the measurement period caused by noise.
It is recommended that the synchronization source be set so that the number of periods of the
input signal is as many as possible by setting the measurement period long. This is to
improve the measurement accuracy.
6-5
Normal Measurement and Integration
Explanation
6.2 Setting the Measurement Period
Measurement Period
• The measurement period is set between the first point where the synchronization
source crosses the level zero point (center of the amplitude) on the rising slope (or
falling slope) within the data update interval and the last point where the
synchronization source crosses the level zero point (center of the amplitude) on the
rising slope (or falling slope) within the update interval.
• The rising or falling edge is automatically selected for the one that allows the
interval to be longer.
• If the number of rising slope or falling slope within the data update interval is zero or
one, the measurement period is set to the entire span within the data update interval.
Data update interval
Data update interval
Data update interval
Measurement Period
Measurement Period
Measurement Period
Synchronization source
Input signal U1
Input signal U2
Input signal U3
Note
•
•
The measurement period for the numerical data of the maximum value (Peak) for voltage and
current is the entire span within the data update interval regardless of the settings above.
Therefore, the measurement period for the measurement functions U+pk, U-pk, I+pk, I-pk,
CfU, CfI, FfU, and FfI that are determined from the maximum value of the voltage and current
is also the entire span within the data update interval.
The measurement period during harmonic measurement is as follows:
The number of sampled data to be used in harmonic measurement is set to 8192, 4096, or
2048 points (see section 7.7). The range corresponding to the selected number of sampled
data is the measurement period. When the waveform is displayed, the measurement period
corresponds to one screen of the waveform.
Copying the Synchronization Source
The synchronization source specified for a given element can be set to the elements
of the same wiring unit. However, if the wiring system is pattern 1, the measurement
range can be copied to all other elements. The synchronization source for other
elements that were specified before is not held.
6-6
IM 760101-01E
6.3
Selecting the Frequency Measurement Target
«For a functional description, see section 1.2.»
Keys
SELE
CT
SET
RE
DISPLAY
HOLD
UP DATE
RATE
FILE
SINGLE
ESC
TRIG'D
WAVE
STORE
COPY
STORE SET
MENU
REMOTE
HARMONICS
CURSOR
LOCAL
MAX HOLD
MISC
NULL
SHIFT
To exit the menu during operation, press ESC.
6
INPUT
RANGE
WIRING
AVG
MEASURE
MOTOR SET
FILTER
CAL
INTEGRATOR
START
STOP
INTEG SET
RESET
SYNC SRC
Procedure
1.
2.
Press MEASURE to display the Measure menu.
Press the Freq Item soft key to display the Freq Item dialog box.
3.
4.
Turn the jog shuttle to select the signal for which the frequency is to be measured.
Press SELECT. The frequency of the input signal to be measured is indicated
by the highlighting of the button that is located to the left of the selected input
signal. If the highlighting is released, the frequency of that input signal will not
be measured.
Only the input signal of installed elements are displayed.
ESC
Explanation
Up to three input signals from the installed elements can be selected as targets for
frequency measurements. If three input signals are already selected and you wish to
select another input signal, release one of the selected input signal first.
Note
Even if the harmonic measurement mode is turned ON (see section 7.1), the Freq Item menu above
is displayed and you can select the frequency measurement target. The frequency measurement
target is common to normal measurement and harmonic measurement. For the relation between the
frequency measurement target and the PLL source of harmonic measurement, see section 7.4.
IM 760101-01E
6-7
Normal Measurement and Integration
SCALING
6.4
Setting the User-Defined Function
«For a functional description, see section 1.5.»
Keys
SELE
CT
SET
RE
DISPLAY
HOLD
UP DATE
RATE
FILE
SINGLE
ESC
TRIG'D
WAVE
STORE
COPY
STORE SET
MENU
REMOTE
LOCAL
HARMONICS
CURSOR
MAX HOLD
MISC
NULL
SHIFT
To exit the menu during operation, press ESC.
INPUT
RANGE
SCALING
WIRING
AVG
MEASURE
MOTOR SET
FILTER
CAL
INTEGRATOR
START
STOP
INTEG SET
RESET
SYNC SRC
Procedure
Check that the measurement mode is set to normal measurement. If the
measurement mode is set to harmonic measurement, set Mode to OFF in the
Harmonics menu (see section 7.1).
1.
2.
Press MEASURE to display the Measure menu.
Press the User Defined soft key to display the User Defined Function dialog
box.
Turning ON/OFF the User-Defined Function Computation
3.
Turn the jog shuttle to select the user-defined function you wish to enter from
Function1 to Function4.
4.
Press SELECT to select ON or OFF.
ESC
6-8
IM 760101-01E
6.4 Setting the User-Defined Function
Setting the Unit
5.
Turn the jog shuttle to select Unit.
6.
Press SELECT to display the keyboard.
7.
Use the keyboard to set the unit.
For keyboard operations, see section 3.12, “Entering Values and Strings.”
Setting the Equation
8.
Turn the jog shuttle to select Expression.
9.
Press SELECT to display the keyboard.
10. Use the keyboard to set the equation.
For keyboard operations, see section 3.12, “Entering Values and Strings.”
ESC
ESC
6
An equation can be created by combining the measurement function symbols. Using the
numerical values of the measurement functions, the numerical data of the new equation
can be determined.
Turning ON/OFF the User-Defined Function
You can select whether to perform the specified user-defined function computation.
• ON
Performs the computation.
• OFF
Does not perform the computation.
Setting the Unit
• Number of characters
Eight characters or less. However, not all eight characters can be shown on the
numerical data display. This depends on the number of displayed items (see
section 4.1).
• Types of characters
Characters that are displayed on the keyboard or a space.
IM 760101-01E
6-9
Normal Measurement and Integration
Explanation
6.4 Setting the User-Defined Function
Setting the Equation
The combination of the measurement function and element number (Urms1, for
example) can be used as an operand to create up to four equations (F1 to F4). There
can be up to 16 operands in one equation.
• Measurement functions for computation
The operands for the measurement functions are shown below in the form
measurement function: operand.
Urms: URMS( )
Umn: UMN( )
Udc: UDC( )
Uac: UAC( )
Irms: IRMS( )
Imn: IMN( )
Idc: IDC( )
Iac: IAC( )
P: P( )
S: S( )
Q: Q( )
λ: LAMBDA( )
φ: PHI( )
fU: FU( )
fI: FI( )
U+pk: UPPK( )
U-pk: UMPK( )
I+pk: IPPK( )
I-pk: IMPK( )
CfU: CFU( )
CfI: CFI( )
FfU: FFU( )
FfI: FFI( )
Z: Z( )
Rs: RS( )
Xs: XS( )
Rp: RP( )
Xp: XP( )
Pc: PC( )
η: ETA( )
1/η: DIVETA( )
∆Urms: DELTAURM( )
∆Umn: DELTAUMN( )
∆Udc: DELTAUDC( )
∆Uac: DELTAUAC( )
∆Irms: DELTAIRM( )
∆Imn: DELTAIMN( )
∆Idc: DELTAIDC( )
∆Iac: DELTAIAC( )
Pm: PM( )
Torque: TORQUE( )
Speed: SPEED( )
Slip: SLIP( )
Sync: SYNC( )
ηmA: MAETA( )
ηmB: MBETA( )
Wp: WH( )
Wp+: WHP( )
Wp-: WHM( )
q: AH( )
q+: AHP( )
q-: AHM( )
Time: TI( )
• A symbol representing the element to which the measured signal is to be
applied is entered in parentheses ( ). Elements 1, 2, 3, 4, 5, 6, ΣA, ΣB, and ΣC
are represented by the symbols E1, E2, E3, E4, E5, E6, E7, E8, and E9
respectively. One symbol from E1 to E9 can be used, except for the following
computation symbols.
• One symbol from E1 to E6 can be entered in the parentheses for FU( ) to
FFI( ) functions.
• No symbols need to be entered in the parentheses for ETA( ), DIVETA( ),
PM( ), TORQUE( ), SPEED( ), SLIP( ), SYNC( ), MAETA( ), and MBETA( ).
• The element symbol inside the parentheses of delta computation
(DELTAURM( ) to DELTAIAC( )) does not represent the element to which the
measured signal is to be applied, but rather the location (∆1 to ∆4) at which to
store or display the results of the delta computation (see section 6.5). ∆1, ∆2,
∆3, and ∆4 are represented by symbols E1, E2, E3, and E4, respectively.
One symbol from E1 to E4 can be set within the range defined by the delta
computation. For example, DELTAURM(E1) substitutes the value of ∆Urms1
in the equation.
• The measurement functions η (efficiency 1) and 1/η (efficiency 2) are displayed
as percentages as indicated by the equations given in appendix 1, “Symbols
and Determination of Measurement Functions.” However, measurement
functions ETA and DIVETA described in this section are displayed as ratios.
Example η: 80%, ETA = 0.8
• The user-defined function lets you can combine operands to calculate physical
values other than those offered by the standard measurement functions. For
example, the equation for measurement function S calculates efficiency using
PSB in the numerator and PSA in the denominator. With user-defined functions,
you can calculate efficiency using different values in the numerator and
denominator, such as values from a separate power measurement.
6-10
IM 760101-01E
6.4 Setting the User-Defined Function
• Operators
The following operators can be used to create the equation.
Operator
Example
Description
+, –, ∗, /
URMS(E1)+URMS(E2)
Basic arithmetic of the measurement functions
ABS
ABS(UMN(E1)–UMN(E2))
Absolute value of the measurement function
SQR
SQR(IDC(E1))
Square of the measurement function
SQRT
SQRT(ABS(IDC(E1)))
Square root of the measurement function
LOG
LOG(UDC(E1))
Natural log of the measurement function
LOG10
LOG10(UDC(E1))
Common log of the measurement function
EXP
EXP(UAC(E1))
Exponent of the measurement function
NEG
NEG(URMS(E1))
Negation of the measurement function
6
Note
•
•
IM 760101-01E
An equation (F1 to F4) cannot be placed inside another equation (F1 to F4).
If an operand in the equation is undetermined, the computation result displays [-------] (no
data). For example, if a measurement function of a delta computation is in the equation, but
the delta computation is turned OFF or a measurement function of an element that is installed
is in the equation, an error message is displayed.
6-11
Normal Measurement and Integration
• Number and Type of Characters That Can Be Used in the Equation
• Number of characters
50 characters or less.
• Types of characters
Characters that are displayed on the keyboard or a space.
6.5
Setting the Delta Computation
«For a functional description, see section 1.5.»
Keys
SELE
CT
SET
RE
DISPLAY
HOLD
UP DATE
RATE
FILE
SINGLE
ESC
TRIG'D
WAVE
CURSOR
STORE
COPY
STORE SET
MENU
REMOTE
HARMONICS
LOCAL
MAX HOLD
MISC
NULL
SHIFT
To exit the menu during operation, press ESC.
INPUT
RANGE
SCALING
WIRING
AVG
MEASURE
MOTOR SET
FILTER
CAL
INTEGRATOR
START
STOP
INTEG SET
RESET
SYNC SRC
Procedure
Check that the measurement mode is set to normal measurement. If the
measurement mode is set to harmonic measurement, set Mode to OFF in the
Harmonics menu (see section 7.1).
1.
2.
Press MEASURE to display the Measure menu.
Press the ∆Measure soft key to display the ∆Measure dialog box.
Selecting the Target Wiring Unit for the Delta Computation
3.
Turn the jog shuttle to select Object.
4.
Press SELECT. The wiring unit selection box appears.
5.
Turn the jog shuttle to select the wiring unit.
6.
Press SELECT to confirm.
Selecting the Delta Computation Type
(The menu varies depending on the wiring system.)
7.
Turn the jog shuttle to select Type.
8.
Press SELECT to display the type selection box.
9.
Turn the jog shuttle to select the delta computation type.
10. Press SELECT to confirm.
ESC
6-12
IM 760101-01E
6.5 Setting the Delta Computation
Explanation
In the normal measurement mode, the sum or difference of the instantaneous values
(sampled data) of the voltage or current between the elements assigned to the target
wiring unit for the delta computation can be used to determine the measurement
functions, ∆U (∆Urms, ∆Umn, ∆Udc ∆Uac), ∆I (∆Irms, ∆Imn, ∆Idc, ∆Iac). This operation
is called delta computation. For the equation, see appendix 2. The measurement
periods are the same as those described in section 1.2, “Measurement Functions and
Measurement Periods.”
Selecting the Target Wiring Unit for the Delta Computation
You can select the target wiring unit for the delta computation from the following list of
choices. The selectable items vary depending on the selected wiring system pattern.
ΣA, ΣB, ΣC
6
• 3P3W>3V3A
Computes the other data when the wiring system is changed from three-phase,
three-wire (3P3W) to three-voltage, three-current (3V3A).
∆U1(∆Urms1, ∆Umn1, ∆Udc1, ∆Uac1)
∆I1 (∆Irms1, ∆Imn1, ∆Idc1, ∆Iac1)
I
R
I1
±
U
U1
±
∆U1
N
S
T
I2
I
±
∆I1
U
U2
±
• Delta>Star
Using the data from a three-voltage, three-current system, the various data of a
star connection is computed from the data of a delta connection (delta-star
transformation).
∆U1 (∆Urms1, ∆Umn1, ∆Udc1, ∆Uac1)
∆U2 (∆Urms2, ∆Umn2, ∆Udc2, ∆Uac2)
∆U3 (∆Urms3, ∆Umn3, ∆Udc3, ∆Uac3)
∆I4 (∆Irms4, ∆Imn4, ∆Idc4, ∆Iac4)
I
R
I1
±
∆U1
∆U3
T
N
∆U2
∆I4
S
I
I
IM 760101-01E
U
U
U3 U1
±
±
I2
±
I3 ±
U
U2
±
6-13
Normal Measurement and Integration
Selecting the Delta Computation Type
You can select the delta computation type from the following list of choices. The
selectable items vary depending on the selected wiring system pattern.
6.5 Setting the Delta Computation
• Star>Delta
Using the data from a three-phase, four-wire system, the various data of a delta
connection are computed from the data of a star connection (start-delta
transformation).
∆U1 (∆Urms1, ∆Umn1, ∆Udc1, ∆Uac1)
∆U2 (∆Urms2, ∆Umn2, ∆Udc2, ∆Uac2)
∆U3 (∆Urms3, ∆Umn3, ∆Udc3, ∆Uac3)
∆I4 (∆Irms4, ∆Imn4, ∆Idc4, ∆Iac4)
I
R
∆U1
∆U3
I1
±
U
U1
±
∆I4
T
∆U2
U3
S
I
I
I2
±
±
N
U2
U
U
±
I3 ±
Note
•
•
•
•
•
6-14
If the sampled data used in the computation do not exist (for example, when the element is
not installed), the sampled data are considered to be 0’s for the computation.
It is recommended that the measurement range and scaling (PT/CT ratio and coefficients) of
the elements that are being computed (delta computation) be set the same as much as
possible. Using a different measurement range or scaling causes the measurement resolution
of the sampled data to be different. In effect, the computation result will have errors.
The number (1, 2, 3, and 4) that is attached to the measurement function symbol of the delta
computation has no relation to the element number. For example, if the delta computation
type is set to 3P3W>3V3A, the true RMS value is computed using the u1-u2 data. The
resultant data is displayed as a ∆Urms1 value.
This function does not operate on products with only a single element. In such case, the
menu does not appear.
If the wiring system on which delta computation is to be performed is single-phase, two-wire
(1P2W), delta computation cannot be performed.
IM 760101-01E
6.6
Setting the Equations for Apparent Power and
Corrected Power
«For a functional description, see section 1.5.»
Keys
SELE
CT
SET
RE
DISPLAY
HOLD
UP DATE
RATE
FILE
SINGLE
ESC
TRIG'D
WAVE
STORE
COPY
STORE SET
MENU
REMOTE
HARMONICS
CURSOR
LOCAL
MAX HOLD
MISC
NULL
SHIFT
To exit the menu during operation, press ESC.
6
INPUT
RANGE
WIRING
AVG
MEASURE
MOTOR SET
FILTER
CAL
INTEGRATOR
START
STOP
INTEG SET
RESET
SYNC SRC
Procedure
Check that the measurement mode is set to normal measurement. If the
measurement mode is set to harmonic measurement, set Mode to OFF in the
Harmonics menu (see section 7.1).
1.
Press MEASURE to display the Measure menu.
Selecting the Equation for Apparent Power
2.
Press the S Formula soft key to display the S Formula menu.
3.
Press one of the soft keys from Urms∗Irms to Umean∗Irms to select the
equation for apparent power.
ESC
IM 760101-01E
ESC
6-15
Normal Measurement and Integration
SCALING
6.6 Setting the Equations for Apparent Power and Corrected Power
Setting the Equation for Corrected Power
2.
Press the Pc Formula soft key to display the Pc Formula dialog box.
• Selecting the applicable standard
3.
Turn the jog shuttle to select the standard for Pc Formula.
4.
Press SELECT to select either IEC76-1(1976), IEEE C57.12.90-1993 or IEC761(1993).
• Setting the coefficient
( When the applicable standard of the equation is IEC76-1(1976),
IEEE C57.12.90-1993)
5.
Turn the jog shuttle to select P1=.
6.
Press SELECT. A box used to set coefficient P1 appears.
7.
Turn the jog shuttle to set P1.
For the procedures on how to enter values using the jog shuttle, see section 3.12,
“Entering Values and Strings.”
8.
9.
10.
11.
Press SELECT or ESC to close the box.
Turn the jog shuttle to select P2=.
Press SELECT. A box used to set coefficient P2 appears.
Turn the jog shuttle to set P2.
For the procedures on how to enter values using the jog shuttle, see section 3.12,
“Entering Values and Strings.”
12.
Press SELECT or ESC to close the box.
ESC
6-16
IM 760101-01E
6.6 Setting the Equations for Apparent Power and Corrected Power
Explanation
Setting the Equation for Corrected Power
Depending on the applicable standard, when the load that is connected to the
potential transformer is extremely small, the active power of the potential transformer
that is measured needs to be compensated. In such case, set the compensating
equation and the coefficient. Corrected power (Pc) is a measurement function in the
normal measurement mode.
• Selecting the applicable standard
Select the standard from the following choices. For the equations of each
applicable standard, see section 1.5.
• IEC76-1(1976), IEEE C57.12.90-1993
• IEC76-1(1993)
• Setting the coefficient
Set coefficients P1 and P2.
Set the coefficients in the range from 0.0001 to 9.9999.
Note
The equations for apparent power and corrected power are applied to measurement functions
in the normal measurement mode.
IM 760101-01E
6-17
6
Normal Measurement and Integration
Selecting the Equation for Apparent Power
The apparent power, in the normal measurement mode, can be determined by the
product of the voltage (Urms, Umean, and Udc) and current (Irms, Imean, and Idc).
There are three types of voltages and currents when measuring in the normal
measurement mode. Select which voltage and current to use to determine the
apparent power from the following list of choices.
• Urms∗Irms
Determines the apparent power from the true rms values of voltage and current.
• Umean∗Imean
Determines the apparent power from the rectified mean value calibrated to the rms
value of the voltage and current.
• Udc∗Idc
Determines the apparent power from the simple average of the voltage and
current.
• Umean∗Irms
Determines the apparent power from the rectified mean value calibrated to the rms
value of the voltage and the true rms value of the current.
6.7
Selecting the Display Format of the Phase
Difference
«For a functional description, see section 1.5.»
Keys
SELE
CT
SET
RE
DISPLAY
HOLD
UP DATE
RATE
FILE
SINGLE
ESC
TRIG'D
WAVE
STORE
COPY
STORE SET
MENU
REMOTE
HARMONICS
CURSOR
LOCAL
MAX HOLD
MISC
NULL
SHIFT
To exit the menu during operation, press ESC.
INPUT
RANGE
SCALING
WIRING
AVG
MEASURE
MOTOR SET
FILTER
CAL
INTEGRATOR
START
STOP
INTEG SET
RESET
SYNC SRC
Procedure
Check that the measurement mode is set to normal measurement. If the
measurement mode is set to harmonic measurement, set Mode to OFF in the
Harmonics menu (see section 7.1).
1.
2.
3.
Press MEASURE to display the Measure menu.
Press the Phase soft key to display the Phase menu.
Press either the 180 Lead/Lag or 360 degrees soft key to select the display
format of the phase difference.
ESC
6-18
ESC
IM 760101-01E
6.7 Selecting the Display Format of the Phase Difference
Explanation
Select the display format of the phase difference φ of the voltage and current from the
following list of choices. This is valid during the normal measurement mode.
• 180 Lead/Lag
With the positive vertical axis set to zero degrees, this format displays φ using 180°
notation with a lead (D) indicated by the counter-clock wise direction and a lag (G) by
the clockwise direction.
• 360 degrees
With the positive vertical axis set to zero degrees, this format displays φ using 360° in
the clockwise direction.
Note
•
•
IM 760101-01E
6-19
6
Normal Measurement and Integration
•
•
The display format in the harmonic measurement mode is fixed regardless of the selection as
follows.
Measurement function φ( ) is displayed using 360° notation in the clockwise direction.
Measurement functions φU( ) and φI( ) are displayed using 180° notation with respect to the
fundamental signals U(1) and I(1). The counter-clockwise direction is negative and clockwise
direction is positive.
When the measured value of either the voltage or current is zero, an error is displayed.
When both the voltage and current are sinusoids and the ratio of the voltage and current
inputs do not differ greatly with respect to the measurement range, the phase difference φ of
lead and lag are detected and displayed correctly.
When the computation result of power factor λ exceeds “1,” φ is displayed as follows:
• When the power factor λ is greater than 1 and less than equal to 2, φ displays zero.
• When the power factor λ is greater than 2, φ displays an error.
6.8
Setting the Normal Integration Mode and the
Integration Timer
«For a functional description, see section 1.6.»
Keys
SELE
CT
SET
RE
DISPLAY
HOLD
UP DATE
RATE
FILE
SINGLE
ESC
TRIG'D
WAVE
STORE
COPY
STORE SET
MENU
REMOTE
HARMONICS
CURSOR
LOCAL
MAX HOLD
MISC
NULL
SHIFT
To exit the menu during operation, press ESC.
INPUT
RANGE
SCALING
WIRING
AVG
MEASURE
MOTOR SET
FILTER
CAL
INTEGRATOR
START
STOP
INTEG SET
RESET
SYNC SRC
Procedure
1.
Press SHIFT+START (INTEG SET) to display the Integ Set menu.
Selecting Normal Integration Mode or Repetitive Integration Mode (Continuous)
2.
Press the Mode soft key to display the Mode menu.
3.
Press either the Normal or Continuous soft key to select the integration mode.
Selecting All Element Simultaneous Integration or Individual Element Integration
(This menu does not appear on products with only a single element. Proceed to step 5.)
4.
Press the Independent Control soft key to select OFF or ON.
If OFF is selected, integration is performed on all elements simultaneously.
Proceed to step 5.
If ON is selected, integration is performed according to the integration timer for
each element. Proceed to step 11.
ESC
ESC
ESC
Note
You can set the individual element integration through key operation, but the execution of
integration can only be done through communication commands. Even if Independent Control
is set to ON (individual element integration ON), the WT1600 operates in the same fashion as
when Independent Control is OFF (individual element integration OFF).
6-20
IM 760101-01E
6.8 Setting the Normal Integration Mode and the Integration Timer
Setting the Integration Timer during All Element Simultaneous Computation
(Independent Control OFF)
5.
Press the Timer Setting soft key to display the Timer Setting dialog box.
6.
Turn the jog shuttle to select one of the hour, minute, and second boxes.
7.
Press SELECT. A box used to set the timer appears.
8.
Turn the jog shuttle to set the hour, minute, or second that you selected in step 6.
For the procedures on how to enter values using the jog shuttle, see section 3.12,
“Entering Values and Strings.”
9.
10.
Press SELECT or ESC to close the box.
Repeat steps 6 to 9 to set the hour, minute, and second. The procedure for setting
the integration timer during all element simultaneous computation ends here.
ESC
6
For the procedures on how to enter values using the jog shuttle, see section 3.12,
“Entering Values and Strings.”
17.
18.
19.
IM 760101-01E
Press SELECT or ESC to close the box.
If you selected Each in step 13, the hour, minute, and second are set only to
Element 1.
If you selected All in step 13, the hour, minute, and second are set to all
elements at once.
Repeat steps 14 to 17 to set hour, minute, and second.
If you selected Each in step 13, repeat steps 14 to 18 for all elements. The
procedure for setting the integration timer during individual element computation
ends here.
6-21
Normal Measurement and Integration
Setting the Integration Timer during Individual Element Computation (Independent
Control ON)
11. Press the Timer Setting soft key to display the Independent Timer Setting
dialog box.
12. Turn the jog shuttle to select Setting.
13. Press SELECT to select Each or All.
14. Turn the jog shuttle to select one box from hour, minute, and second for
Element 1.
15. Press SELECT. A box used to set the timer appears.
16. Turn the jog shuttle to set the hour, minute, or second that you selected in step 14.
6.8 Setting the Normal Integration Mode and the Integration Timer
ESC
Explanation
To perform integration, the integration mode and integration time must be set before
starting the operation. This section will describe how to set the normal integration mode
and the integration time. For the procedure in starting the integration, see section 6.11.
Selecting the Normal Integration Mode or Repetitive Integration Mode
In this mode, the integration time is set in relative time and the integration is
performed over the specified time. This mode consists of the following two types.
• Normal integration mode
The integration time is set in relative time. The integration is stopped after the
specified time elapses, when the maximum integration time of 10000 hours is
exceeded, when you press STOP, or when the integration value reaches the
maximum or minimum integration display value (±999999 MWh or ±999999 MAh).
The integration time and value are held at that point.
• Repetitive integration mode (continuous integration)
The integration time is set in relative time. When the specified time elapses, the
operation is automatically reset and restarted. Integration is repeated until Stop is
pressed. When the integration value reaches the maximum or minimum integration
display value. The integration time and value are held at that point.
Setting the Integration Timer
• Set the time in units of hour:minute:second in the following range.
0000:00:00 to 10000:00:00
• When performing all element simultaneous integration by turning Independent
Control OFF, a single integration timer can be specified. The value specified here
is also set in the integration timer of Element 1 in the Independent Timer Setting
dialog box that appears when Independent Control is turned ON.
• When performing individual element integration by turning Independent Control
ON, timers can be specified for each element. The value specified for the
integration timer for Element 1 is also set in the integration timer in the Timer
Setting dialog box that appears when Independent Control is turned OFF.
• By turning Independent Control ON, the integration timer can be set for each
element (Each) or for all elements at once (All).
Note
•
•
6-22
If the integration timer is set to 0000:00:00 in the normal integration mode, the integration is
performed in manual integration mode (see section 1.6 and 6.11).
The individual element integration function does not operate on products with only a single
element. In such case, the individual element integration menu does not appear.
IM 760101-01E
6.9
Setting the Real-time Integration Mode, the
Integration Timer, and the Reservation Time
«For a functional description, see section 1.6.»
Keys
SELE
CT
SET
RE
DISPLAY
HOLD
UP DATE
RATE
FILE
SINGLE
ESC
TRIG'D
WAVE
STORE
COPY
STORE SET
MENU
REMOTE
HARMONICS
CURSOR
LOCAL
MAX HOLD
MISC
NULL
SHIFT
To exit the menu during operation, press ESC.
6
INPUT
RANGE
WIRING
AVG
MEASURE
MOTOR SET
FILTER
CAL
INTEGRATOR
START
STOP
INTEG SET
RESET
SYNC SRC
Procedure
1.
Press SHIFT+START (INTEG SET) to display the Integ Set menu.
Selecting Real-time Normal Integration Mode (R-Normal) or Real-time Repetitive
Integration Mode (R-Continuous)
2.
Press the Mode soft key to display the Mode menu.
3.
Press either the R-Normal or R-Continuous soft key to select the integration mode.
Selecting All Element Simultaneous Integration or Individual Element Integration
(This menu does not appear on products with only a single element. Proceed to step 5.)
4.
Press the Independent Control soft key to select OFF or ON.
If OFF is selected, integration is performed on all elements at the same
reservation time. Proceed to step 5.
If ON is selected, integration is performed according to the reservation time and
integration timer for each element. Proceed to step 19.
ESC
ESC
ESC
Note
You can set the individual element integration through key operation, but the execution of
integration can only be done through communication commands. Even if Independent Control
is set to ON (individual element integration ON), the WT1600 operates in the same fashion
when Independent Control is OFF (individual element integration OFF).
IM 760101-01E
6-23
Normal Measurement and Integration
SCALING
6.9 Setting the Real-time Integration Mode, the Integration Timer, and the Reservation Time
Setting the Integration Timer during All Element Simultaneous Computation
(Independent Control OFF)
5.
Press the Timer Setting soft key to display the Timer Setting dialog box.
6.
Turn the jog shuttle to select one box from hour, minute, and second.
7.
Press SELECT. A box used to set the timer appears.
8.
Turn the jog shuttle to set the hour, minute, or second that you selected in step 6.
For the procedures on how to enter values using the jog shuttle, see section 3.12,
“Entering Values and Strings.”
9.
10.
Press SELECT or ESC to close the box.
Repeat steps 6 to 9 to set hour, minute, and second. The procedure for setting
the integration timer during all element simultaneous computation ends here.
ESC
Setting the Reservation Time during All Element Simultaneous Computation
(Independent Control OFF)
11. Press the Real Time Control soft key to display the Real Time Control dialog
box.
12. Turn the jog shuttle to select one of the reservation year, month, date, hour,
minute, and second boxes for specifying when the integration operation will
start.
13. Press SELECT. A box used to set the timer appears.
14. Turn the jog shuttle to set the year, month, date, hour, minute, or second that
you selected in step 12.
For the procedures on how to enter values using the jog shuttle, see section 3.12,
“Entering Values and Strings.”
15.
16.
17.
18.
6-24
Press SELECT or ESC to close the box.
Repeat steps 12 to 15 to set the year, month, date, hour, minute, and second.
Turn the jog shuttle to select one of the reservation year, month, date, hour,
minute, and second boxes for specifying when the integration operation will end.
Repeat steps 13 to 16 to set the year, month, date, hour, minute, and second.
The procedure for setting the reservation time during all element simultaneous
computation ends here.
IM 760101-01E
6.9 Setting the Real-time Integration Mode, the Integration Timer, and the Reservation Time
ESC
For the procedures on how to enter values using the jog shuttle, see section 3.12,
“Entering Values and Strings.”
25.
26.
27.
Press SELECT or ESC to close the box.
If you selected Each in step 21, the hour, minute, and second are set only to
Element 1.
If you selected All in step 21, the hour, minute, and second are set to all
elements at once.
Repeat steps 22 to 25 to set hour, minute, and second.
If you selected Each in step 21, repeat steps 22 to 26 for all elements. The
procedure for setting the integration timer during individual element computation
ends here.
ESC
IM 760101-01E
6-25
6
Normal Measurement and Integration
Setting the Integration Timer during Individual Element Computation
(Independent Control ON)
19. Press the Timer Setting soft key to display the Independent Timer Setting
dialog box.
20. Turn the jog shuttle to select Setting.
21. Press SELECT to select Each or All.
22. Turn the jog shuttle to select one box from hour, minute, and second for
Element1.
23. Press SELECT. A box used to set the timer appears.
24. Turn the jog shuttle to set the hour, minute, or second that you selected in step 22.
6.9 Setting the Real-time Integration Mode, the Integration Timer, and the Reservation Time
Setting the Reservation Time during Individual Element Computation (Independent
Control ON)
28. Press the Real Time Control soft key to display the Independent Real Time
Control dialog box.
29. Turn the jog shuttle to select one of the reservation year, month, date, hour,
minute, and second boxes for specifying when the integration operation will
start.
30. Press SELECT. A box used to set the timer appears.
31. Turn the jog shuttle to set the year, month, date, hour, minute, or second that
you selected in step 29.
For the procedures on how to enter values using the jog shuttle, see section 3.12,
“Entering Values and Strings.”
32.
33.
34.
35.
Press SELECT or ESC to close the box.
Repeat steps 29 to 32 to set the year, month, date, hour, minute, and second.
Turn the jog shuttle to select one of the reservation year, month, date, hour,
minute, and second boxes for specifying when the integration operation will end.
Repeat steps 30 to 33 to set the year, month, date, hour, minute, and second.
The procedure for setting the reservation time during individual element
computation ends here.
ESC
6-26
IM 760101-01E
6.9 Setting the Real-time Integration Mode, the Integration Timer, and the Reservation Time
Explanation
To perform integration, the integration mode and integration time must be set before
starting the operation. This section will describe how to set the normal integration mode
and the integration time for real-time control. For the procedure in starting the
integration, see section 6.11.
Selecting the Real-time Normal Integration Mode or Real-time Repetitive
Integration Mode
In this mode, integration is performed between the times specified by integration start
and stop. This mode consists of the following two types.
• Real-time repetitive integration mode (continuous integration)
The date and time of start and stop of the integration operation and the integration
timer value are specified. The integration is repeated at the specified timer setting
during that time. When the time specified by the timer elapses, the operation is
automatically reset and restarted. The integration is stopped at the specified time
or when the integration value reaches the maximum or minimum integration display
value. The integration time and value are held at that point.
Setting the Integration Timer
This description is the same as section 6.8.
• Set the time in units of hour:minute:second in the following range.
0000:00:00 to 10000:00:00
• When performing all element simultaneous integration by turning Independent
Control OFF, a single integration timer can be specified. The value specified here
is also set in the integration timer of Element 1 in the Independent Timer Setting
dialog box that appears when Independent Control is turned ON.
• When performing individual element integration by turning Independent Control
ON, timers can be specified for each element. The value specified for the
integration timer for Element 1 is also set in the integration timer in the Timer
Setting dialog box that appears when Independent Control is turned OFF.
• By turning Independent Control ON, the integration timer can be set for each
element (Each) or for all elements at once (All).
Note
•
•
IM 760101-01E
If the integration timer is set to 0000:00:00 in the real-time normal integration mode, the
integration is started at the specified start date/time. The integration is stopped at the
specified stop date/time, when the maximum integration time of 10000 hours is exceeded, or
when the integration value reaches the maximum or minimum integration display value. The
integration time and value are held at that point.
The individual element integration function does not operate on products with only a single
element. In such case, the individual element integration menu does not appear.
6-27
6
Normal Measurement and Integration
• Real-time normal integration mode
The date and time of start and stop of the integration operation and the integration
timer value are specified. The integration is stopped at the specified time, when
the timer value is reached, when the maximum integration time of 10000 hours is
exceeded, or when the integration value reaches the maximum or minimum
integration display value (±999999 MWh or ±999999 MAh). The integration time
and value are held at that point.
6.9 Setting the Real-time Integration Mode, the Integration Timer, and the Reservation Time
Setting the Reservation Time
• The reservation time is set in units of year:month:date, hour:minute:second.
Set the hour:minute:second in the following range.
00:00:00 to 23:59:59
• When performing all element simultaneous integration by turning Independent
Control OFF, a single reservation time can be specified. The value specified here
is also set in the reservation time of Element 1 in the Independent Real Time
Control dialog box that appears when Independent Control is turned ON.
• When performing individual element integration by turning Independent Control
ON, the reservation time can be specified for each element. The value specified
here for Element 1 is also set in the reservation time in the Real Time Control
dialog box that appears when Independent Control is turned OFF.
• By turning Independent Control ON, the reservation time can be set for each
element (Each) or for all elements at once (All).
• Make sure the reservation time for stopping the integration is after the reservation
time for starting the integration.
Note
•
•
6-28
The reservation time allows up to 31 days to be specified for February. If an erroneous date
is specified, an error message is displayed at the time of execution of the integration
operation (section 6.11). Reset the reservation time in this case.
Leap years are recognized at the time of execution of the integration operation.
IM 760101-01E
6.10 Selecting the Current Mode for Current Integration
and ON/OFF of Integration Auto Calibration
«For a functional description, see section 1.6.»
Keys
SELE
CT
SET
RE
DISPLAY
HOLD
UP DATE
RATE
FILE
SINGLE
ESC
TRIG'D
WAVE
CURSOR
STORE
COPY
STORE SET
MENU
REMOTE
HARMONICS
LOCAL
MAX HOLD
MISC
NULL
SHIFT
To exit the menu during operation, press ESC.
6
INPUT
RANGE
WIRING
AVG
MEASURE
MOTOR SET
FILTER
CAL
INTEGRATOR
START
STOP
INTEG SET
RESET
SYNC SRC
Procedure
1.
Press SHIFT+START (INTEG SET) to display the Integ Set menu.
Selecting the Current Mode for Current Integration
2.
Press the Current Mode soft key to display the Current Mode dialog box.
3.
Turn the jog shuttle to select Setting.
4.
Press SELECT to select Each or All.
5.
Turn the jog shuttle to select Element1.
6.
Press SELECT to select one of the RMS to AC soft keys.
If you selected Each in step 4, the current mode of only Element 1 is selected.
If you selected All in step 4, the current mode of all elements is selected at once.
7.
If you selected Each in step 4, repeat steps 5 and 6 for all elements.
ESC
IM 760101-01E
6-29
Normal Measurement and Integration
SCALING
6.10 Selecting the Current Mode for Current Integration and ON/OFF of Integration Auto Calibration
Turning ON/OFF the Integration Auto Calibration
8.
Press the Auto Cal soft key to select ON or OFF.
ESC
Explanation
Selecting the Current Mode for Current Integration
• Select the current type used for current integration on each element from the
following list of choices. For the equations of each current type, see section 1.2.
• RMS: True rms value
• MEAN: Rectified mean value calibrated to the rms value
• DC: Linear averaging
• AC: AC component
• When the current mode is set to DC, the polarity (+/–) is displayed.
Turning ON/OFF Integration Auto Calibration
Zero-level compensation is normally performed when the measurement range or line
filter is changed. However, zero-level compensation can be automatically performed
during integration.
• ON: Zero-level compensation is automatically performed approximately every
hour while integration is in progress.
• OFF: Zero-level compensation is not automatically performed while integration is in
progress.
Note
When zero-level compensation is in progress when integration auto calibration is turned ON,
the power and current values that were measured immediately before are integrated.
6-30
IM 760101-01E
6.11 Performing Integration (Start, Stop, and Reset)
«For a functional description, see section 1.6.»
Keys
SELE
CT
SET
RE
DISPLAY
HOLD
UP DATE
RATE
FILE
SINGLE
ESC
TRIG'D
WAVE
CURSOR
STORE
COPY
STORE SET
MENU
REMOTE
HARMONICS
LOCAL
MAX HOLD
MISC
NULL
SHIFT
To exit the menu during operation, press ESC.
6
INPUT
RANGE
WIRING
AVG
MEASURE
MOTOR SET
FILTER
CAL
INTEGRATOR
START
STOP
INTEG SET
RESET
SYNC SRC
Procedure
Check that the measurement mode is set to normal measurement. If the
measurement mode is set to harmonic measurement, set Mode to OFF in the
Harmonics menu (see section 7.1). Also, check that the retrieval of waveform
display data (see section 9.1) is turned OFF.
Performing Integration in the Manual Integration Mode
1.
Check that the integration mode is set to normal integration. See section 6.8.
2.
Check that the integration timer is set to 0000 : 00 : 00. See section 6.8.
• Starting the integration
3.
Press START. The START indicator above and to the left of the key illuminates
and the integration is started.
• Holding the integration
4.
Press HOLD. The HOLD indicator illuminates, and the numerical data display is
held. Integration continues.
• Releasing the Held Condition
5.
Press HOLD while the values are held. The HOLD indicator turns OFF, and the
numerical data display is updated. In the held condition, the display can be
updated by carrying out single measurements (by pressing SHIFT + HOLD
(SINGLE)).
• Stopping the integration
6.
Press STOP. The START indicator turns OFF and the STOP indicator
illuminates. The integration time and integration value are held. Integration
continues if you press START at this point.
• Resetting the Integration
7.
Press SHIFT+STOP (RESET). The STOP indicator turns OFF, the integration
time and integration value are reset, and the display shows [-------] (no data).
IM 760101-01E
6-31
Normal Measurement and Integration
SCALING
6.11 Performing Integration (Start, Stop, and Reset)
Performing Integration in the Normal Integration Mode
1.
Check that the integration mode is set to normal integration or repetitive
integration (Continuous). See section 6.8.
2.
Check that the integration timer is set to some value other than 0000:00:00.
See section 6.8.
• Starting the integration
3.
Press START. The START indicator above and to the left of the key illuminates
and the integration is started.
• Holding the integration
4.
Press HOLD. The HOLD indicator illuminates, and the numerical data display is
held. Integration continues.
• Releasing the Held Condition
5.
Press HOLD while the values are held. The HOLD indicator turns OFF, and the
numerical data display is updated. In the held condition, the display can be
updated by carrying out single measurements (by pressing SHIFT + HOLD
(SINGLE)).
• Stopping the integration
6.
Press STOP. The START indicator turns OFF and the STOP indicator
illuminates. The integration time and integration value are held. If you press
STOP before the time specified by the integration timer is reached and then
press START, integration continues up to the time specified by the integration
timer.
If the time specified by the integration timer elapses in the normal integration
mode, the START indicator turns OFF and the STOP indicator illuminates. The
integration time and integration value are held.
If the time specified by the integration timer elapses in the repetitive integration
mode, the integration time and integration value are automatically reset, and the
integration is repeated until Stop is pressed.
• Resetting the integration
7.
Press SHIFT+STOP (RESET). The STOP indicator turns OFF, the integration
time and integration value are reset, and the display shows [-------] (no data).
Displays Reset when the integration value is
reset and the integration is ready to be started.
ESC
6-32
Displays Start
during
Displays Stop
when
integration is
aborted,
cancelled, or
done.
Displays Ready at
Element1 when
only Element1 is
ready in the realtime integration
IM 760101-01E
6.11 Performing Integration (Start, Stop, and Reset)
Performing Integration in the Real-time Integration Mode
1.
Check that the integration mode is set to real-time normal integration (R-Normal)
or real-tie repetitive integration (R-Continuous). See section 6.9.
2.
Check that the integration timer and the reservation time are specified. See
section 6.9.
• Starting the integration
3.
Press START. The START indicator above and to the left of the key blinks and
the instrument enters the ready condition. When the reservation time for
starting the integration is reached, the START indicator changes to illumination
and the integration is started.
• Holding the integration
4.
Press HOLD. The HOLD indicator illuminates, and the numerical data display is
held. Integration continues.
• Stopping the integration
6.
Press STOP. The START indicator turns OFF and the STOP indicator
illuminates. The integration time and integration value are held. If you press
STOP before the time specified by the integration timer is reached and then
press START, integration continues up to the time specified by the integration
timer.
If the reservation time for stopping the integration is reached in the real-time
normal integration mode, the START indicator turns OFF and the STOP
indicator illuminates. The integration time and integration value are held.
If the time specified by the integration timer elapses in the real-time repetitive
integration mode, the integration time and integration value are automatically
reset, and the integration is repeated until STOP is pressed or when the
reservation time for stopping the integration is reached..
• Resetting the Integration
7.
Press SHIFT+STOP (RESET). The STOP indicator turns OFF, the integration
time and integration value are reset, and the display shows [-------] (no data).
Note
In addition to Reset, Start, Stop, and Ready, the following integration states are possible.
• TimeUp: When the time set on the integration timer elapses, integration automatically
stops. This is called the TimeUp state.
• Error: If a power failure occurs when integration is in progress, the integration result is
held. When the power recovers, the integration result calculated up to the point when the
power failure occurred is displayed with the integration operation stopped. This is called
the Error state.
IM 760101-01E
6-33
Normal Measurement and Integration
• Releasing the Held Condition
5.
Press HOLD while the values are held. The HOLD indicator turns OFF, and the
numerical data display is updated. In the held condition, the display can be
updated by carrying out single measurements (by pressing SHIFT + HOLD
(SINGLE)).
6
6.11 Performing Integration (Start, Stop, and Reset)
Explanation
Starting, Stopping, and Resetting the Integration
• The integration can be started, stopped, or reset from the front panel keys or
through communication commands.
• Communication commands allow starting, stopping, and resetting the integration of
individual elements. To perform all element simultaneous integration from the front
panel keys when performing integration on individual elements through
communication commands, the operation must be switched to collective operation
from individual operation using communication commands or front panel keys.
• The following figure shows the relationship between the integration operation and
start, stop, and reset. Pressing RESET after the integration has stopped resets the
integration value and the integration time.
Auto stop Reset
Abort
Abort
Reset
Restart
Restart
Start
Integration value
Time specified for
the timer
Integration time
START STOP
START STOP
RESET
START
RESET
Holding, Starting, and Stopping the Integration
When the display is held, the display of the integration result and communication output is
held. The integration operation continues regardless of whether the hold function is ON. The
relationship between the hold function and the start and stop operations are as follows.
• If the integration is started while the display is held, the display and communication
output do not change. When the hold function is released (OFF) or a single
measurement (by pressing HOLD (SINGLE) after pressing SHIFT) is made, the
integration result at that point is displayed or output via communications.
ON
HOLD (HOLD)
OFF
Display value
(Dotted line is the integration value.)
Integration time
START
STOP RESET
Note
•
•
•
•
6-34
The reservation time (section 6.9) allows up to 31 days to be specified for February. If an
erroneous date is specified, an error message is displayed at the time of execution of the
integration operation. Reset the reservation time in this case.
Leap years are recognized at the time of execution of the integration operation.
The data update rate cannot be changed while the integration is in progress.
You can set the individual element integration through key operation, but the execution of
integration can only be done through communication commands. Even if Independent Control
is set to ON (individual element integration ON), the WT1600 operates in the same fashion
when Independent Control is OFF (individual element integration OFF).
IM 760101-01E
6.11 Performing Integration (Start, Stop, and Reset)
• If the integration is stopped while the display is held, the display and
communication output values do not change from the held values. When the hold
function is released (OFF) or a single measurement (by pressing HOLD (SINGLE)
after pressing SHIFT) is made, the integration result at the time the integration was
stopped is displayed or output via communications.
ON
HOLD (HOLD)
OFF
SINGLE
ON
(Single measurement)
ON
ON
Display value
(Dotted line is the integration value.)
6
START
STOP
RESET
Sample Rate and the Allowable Frequency Range for Integration
The sample rate is approximately 200 kHz. The voltage/current signal frequencies
that can be integrated are as follows.
Integrated Item
Allowable Frequency Range for Integration
Active power
Current
DC to 100 kHz
When integrating Irms
When integrating Imn
When integrating Idc
When integrating Iac
DC, lower limit of frequency determined by the
data update rate to 100 kHz
DC, lower limit of frequency determined by the
data update rate to 100 kHz
DC to 100 kHz
DC, lower limit of frequency determined by the
data update rate to 100 kHz
Display Resolution
The maximum display resolution of integration value is 999999. When the integrated
value reaches 1000000 counts, the decimal point shifts automatically. For example, if
0.001 mWh is added to 999.999 mWh, the display shows 1.00000 Wh For the
number of displayed digits other than during integration, see section 1.4.
Display When Integration Overflow Occurs
When the integration time reaches its maximum (10000 hours) or the integration value
reaches its maximum or minimum (±999999 MWh or ± 999999 MAh), the integration
is stopped and the integration time and integration value at that point are held.
Integration When MAX Hold Function Is Enabled
The integration value is determined and displayed by summing the value that is measured
at every display update rate, irrespective of the MAX hold function (section 5.9).
Integration When the Measured Value Exceeds the Measurement Limit
If the instantaneous voltage or current of the sampled data exceeds 300% of the
measurement range when the crest factor is set to 3, the value is considered to be the
value corresponding to 300% for the purpose of integration. If the instantaneous
voltage or current of the sampled data exceeds 600% of the measurement range
when the crest factor is set to 6, the value is considered to be the value corresponding
to 600% for the purpose of integration.
IM 760101-01E
6-35
Normal Measurement and Integration
Integration time
6.11 Performing Integration (Start, Stop, and Reset)
Integration When Current Input Is Small
If Irms or Iac is less than or equal to 0.3% (less than or equal to 0.6% when the crest
factor is set to 6) and Imn is less than or equal to 1% (less than or equal to 2% when the
crest factor is set to 6) of the measurement range, the current is considered to be zero
for the purpose of integration.
Backup During Power Failures
• If a power failure occurs when integration is in progress, the integration result is
held. When the power recovers, the integration result calculated up to the point
when the power failure occurred is displayed with the integration operation stopped.
• If the integration is reset after the power recovers, integration can be started once
again.
Limitation on Modifying the Settings during Integration
When the integration is in progress, some of the functions cannot be changed as shown
below.
Integration Operation Condition
Integration Reset
Integrating
Integration Suspended
OFF
OFF
ON
OFF
OFF
ON
Wiring system
Yes
Yes
Yes
Measurement range
Yes
No
No
Scaling
Yes
No
No
Filter
Yes
No
No
Averaging
Yes
No
No
Synchronization source
Yes
No
No
Hold
Yes
Yes
Yes
Single measurement
Yes
Yes
Yes
Data update rate
Yes
No
No
Display format
Yes
Yes
Yes
Integration mode
Yes
No
No
(Displayable)
(Displayable)
Integration timer
Yes
No
No
(Displayable)
(Displayable)
Integration start
Yes
No
Yes
Integration stop
No
Yes
No
Integration reset
Yes
No
Yes
Waveform data acquisition
Yes
No
No
Harmonic measurement
Yes
No
No
Store (excludes integration
Yes
Yes
Yes
Printer
Yes
Yes
Yes
Zero-level crossing
Yes
No
No
Null
Yes
No
No
(START indicator)
(STOP indicator)
Function
synchronization mode)
• Yes: Settings can be modified.
• No: Settings cannot be modified.
• Starting integration in auto range mode switches the measurement range
to fixed range mode.
6-36
IM 760101-01E
Chapter 7
Harmonic Measurement
7.1
Setting the Harmonic Measurement Mode
Keys
SELE
CT
SET
RE
DISPLAY
HOLD
UP DATE
RATE
FILE
SINGLE
ESC
TRIG'D
WAVE
STORE
COPY
STORE SET
MENU
REMOTE
HARMONICS
CURSOR
LOCAL
MAX HOLD
MISC
NULL
SHIFT
To exit the menu during operation, press ESC.
INPUT
RANGE
SCALING
WIRING
AVG
MEASURE
MOTOR SET
FILTER
7
CAL
INTEGRATOR
STOP
RESET
SYNC SRC
Harmonic Measurement
START
INTEG SET
Procedure
1.
Press HARMONICS to display the Harmonics menu.
Turning ON/OFF the Harmonics Measurement Mode
2.
Press the Mode soft key to select ON or OFF. When turned ON, the
HARMONICS indicator above and to the left of the key illuminates.
ESC
Explanation
To perform harmonic measurement, the harmonic measurement mode must be enabled.
• ON: Performs harmonic measurement.
• OFF: Does not perform harmonic measurement. Normal measurement is performed.
Note
•
•
IM 760101-01E
The setup menu may be different when in the normal measurement mode and in the
harmonic measurement mode. When setting the instrument, check which measurement
mode the instrument is in.
The frequency measurement target is common to normal measurement and harmonic
measurement. For the procedure in selecting the frequency measurement target, see section
6.3.
7-1
7.2
Changing the Displayed Item of Numerical Data
«For a functional description, see section 1.4.»
Keys
SELE
CT
SET
RE
DISPLAY
HOLD
UP DATE
RATE
FILE
SINGLE
ESC
TRIG'D
WAVE
CURSOR
STORE
COPY
STORE SET
MENU
REMOTE
HARMONICS
LOCAL
MAX HOLD
MISC
NULL
SHIFT
To exit the menu during operation, press ESC.
INPUT
RANGE
SCALING
WIRING
AVG
MEASURE
MOTOR SET
FILTER
CAL
INTEGRATOR
START
STOP
INTEG SET
RESET
SYNC SRC
Procedure
Check that the measurement mode is set to harmonic measurement. If the
measurement mode is set to normal measurement, set Mode to ON in the
Harmonics menu (see section 7.1).
1.
Press DISPLAY to display the Display menu.
Check that Format (display format) is set to Numeric, Numeric+Wave,
Numeric+Bar, or Numeric+Trend. For the display format of the numerical
display, see section 4.1.
If Item Amount (number of displayed items) is set to 4 (2), 8 (4), or 16 (8),
proceed to step 2.
If Item Amount (number of displayed items) is set to Single List or Dual List,
proceed to step 13.
For details on setting the number of displayed items, see section 4.1.
ESC
7-2
IM 760101-01E
7.2 Changing the Displayed Item of Numerical Data
The following procedures are given for a representative example in which the
display format is set to Numeric.
When Item Amount (Number of Displayed Items) Is Set to 4 (2), 8 (4), or 16 (8)
2.
Press the Numeric Disp Items soft key to display the Numeric Items menu.
• Selecting the Item to Be Changed
3.
Press the Harm Item No. soft key.
4.
Turn the jog shuttle to select the item to be changed. The item to be changed
is highlighted.
• Changing the measurement function
5.
Press the Function soft key to display the measurement function selection box.
6.
Turn the jog shuttle to select any of the measurement function starting with
None.
7.
Press SELECT. The symbol for the selected measurement function and the
numerical data are displayed at the highlighted position.
• Changing the harmonic order
11. Press Order soft key.
12. Turn the jog shuttle to set the order. The specified harmonic order and the
numerical data are displayed at the highlighted position.
ESC
IM 760101-01E
ESC
ESC
ESC
ESC
7-3
Harmonic Measurement
• Changing the element/wiring unit
8.
Press the Element soft key to display the element and wiring unit selection box.
9.
Turn the jog shuttle to select any of the elements/wiring units starting with
Element1.
10. Press SELECT. The symbol for the selected element number or wiring unit and
the numerical data are displayed at the highlighted position.
7
7.2 Changing the Displayed Item of Numerical Data
• Resetting the order of the displayed items
3.
Press the Reset List Exec soft key. The order of the displayed items is reset.
4.
Turn the jog shuttle to select OK or Cancel.
5.
Select OK and press SELECT to execute the reset of the order of the displayed items.
Select Cancel and press SELECT to abort the reset of the order of the displayed items.
ESC
When Item Amount (Number of Displayed Items) is set to Single List or Dual List
13. Press the List Items soft key to display the List Items menu.
• Selecting the item to be changed
14. Press the List Item No. soft key.
15. Turn the jog shuttle to select 1 or 2.
•
•
When Item Amount is set to Single List, the data of List Item No. 1 is displayed using
two columns.
When Item Amount is set to Dual List, the data of List Item No. 1 and 2 is displayed in
each column.
• Changing the measurement function
16. Press the Function soft key to display the measurement function selection box.
17. Turn the jog shuttle to select the measurement function.
18. Press SELECT. The symbol for the selected measurement function and the
numerical data are displayed.
• Changing the element/wiring unit
19. Press the Element soft key to display the element/wiring unit selection box.
20. Turn the jog shuttle to select any of the elements/wiring units starting with
Element1.
21. Press SELECT. The symbol for the selected element number or wiring unit and
the numerical data are displayed.
7-4
IM 760101-01E
7.2 Changing the Displayed Item of Numerical Data
• Changing the harmonic order
22. Press ESC to return to the Display menu.
23. Turn the jog shuttle to set the harmonic order. The display is scrolled, and the
specified harmonic order and the numerical data are displayed. You can also
page-scroll (see section 4.1).
ESC
ESC
ESC
ESC
ESC
7
When Item Amount (Number of Displayed Items) Is Set to 4 (2), 8 (4), or 16 (8)
• Changing the measurement function
• The types of measurement functions that can be selected are indicated in
“Measurement Function Types for Harmonic Measurement” in section 1.2 and
“User-Defined Functions” in section 1.5.
• You can also select not to display the measurement functions (None).
• Changing the element/wiring unit
• You can select the element/wiring unit from the following list of choices. The
selectable items vary depending on the installed elements.
Element1, Element2, Element3, Element4, Element5, Element6,
ΣA, ΣB, and ΣC
• If the selected wiring unit is not a harmonic measurement target, there is no
numerical data. Thus, [-------] (no data) is displayed in this case. For example, if
the measurement target is ΣA, [-------] (no data) is displayed at the measurement
function of ΣC. For selecting the measurement target, see section 7.3.
IM 760101-01E
7-5
Harmonic Measurement
Explanation
7.2 Changing the Displayed Item of Numerical Data
• Changing the harmonic order
The harmonic order can be set to total or from dc (0th order) up to 100th order.
Changing the measurement
function of the third item
Changing the
element of the third item
Changing the order
When Item Amount (Number of Displayed Items) is set to Single List or Dual List
Two types of lists are available. When set to Single List, the data of List Item No. 1 is
displayed using two columns. When set to Dual List, the data of List Item No. 1 and 2
is displayed in each column.
You can set the list item No. to 1 or 2.
• Changing the measurement function
Select the measurement function to be changed from the following list of choices.
U, I, P, S, Q, λ, φ, φU, φI, Z, Rs, Xs, Rp, and Xp
• Changing the element/wiring unit
The description is the same as with the aforementioned “When Item Amount
(Number of Displayed Items) Is Set to 4 (2), 8 (4), or 16 (8).”
• Changing the harmonic order
The description is the same as with the aforementioned “When Item Amount
(Number of Displayed Items) Is Set to 4 (2), 8 (4), or 16 (8).”
Note
•
•
•
•
7-6
For the meanings of the measurement function symbols that are displayed, see section 1.2,
“Measurement Functions and Measurement Periods,” 1.5, “Computation,” and appendix 1,
“Symbols and Determination of Measurement Functions.”
For details on the wiring units expressed as ΣA, ΣB, and ΣC, see section 5.1, “Selecting the
Wiring System.”
[-------] (no data) is displayed in places where the measurement function is not selected or
where numerical data is not present.
The harmonic order can be set to total or from dc (0th order) up to 100th order. However, the
numerical data up to the order corresponding to the upper limit of harmonic order under
analysis (see section 17.6) that is automatically determined by the frequency of the PLL
source is the data determined by the harmonic measurement.
IM 760101-01E
7.3
Selecting the Measurement Target
Keys
SELE
CT
SET
RE
DISPLAY
HOLD
UP DATE
RATE
FILE
SINGLE
ESC
TRIG'D
WAVE
STORE
COPY
STORE SET
MENU
REMOTE
HARMONICS
CURSOR
LOCAL
MAX HOLD
MISC
NULL
SHIFT
To exit the menu during operation, press ESC.
INPUT
RANGE
SCALING
WIRING
AVG
MEASURE
MOTOR SET
FILTER
7
CAL
INTEGRATOR
STOP
RESET
SYNC SRC
Harmonic Measurement
START
INTEG SET
Procedure
1.
2.
3.
4.
5.
Press HARMONICS to display the Harmonics menu.
Press the Mode soft key to select ON.
Press the Object soft key to display the measurement target selection box.
Turn the jog shuttle to select the measurement target (wiring unit).
Press SELECT to confirm.
ESC
ESC
Explanation
You can select the target wiring unit for the harmonic measurement from the following list
of choices. The selectable items vary depending on the selected wiring system pattern.
ΣA, ΣB, and ΣC
Note
For the procedure in selecting the frequency measurement target, see section 6.3.
IM 760101-01E
7-7
7.4
Selecting the PLL Source
«For a functional description, see section 1.2.»
Keys
SELE
CT
SET
RE
DISPLAY
HOLD
UP DATE
RATE
FILE
SINGLE
ESC
TRIG'D
WAVE
STORE
COPY
STORE SET
MENU
REMOTE
HARMONICS
CURSOR
LOCAL
MAX HOLD
MISC
NULL
SHIFT
To exit the menu during operation, press ESC.
INPUT
RANGE
SCALING
WIRING
AVG
MEASURE
MOTOR SET
FILTER
CAL
INTEGRATOR
START
STOP
INTEG SET
RESET
SYNC SRC
Procedure
1.
2.
3.
Press HARMONICS to display the Harmonics menu.
Press the Mode soft key to select ON.
Press the PLL Source Up Exec or PLL Source Down Exec soft key to select
the PLL source. The selected PLL source is displayed at the upper right corner
of the screen at PLL Src.
•
•
Pressing the PLL Source Up Exec soft key makes the target element for the PLL
source smaller.
Pressing the PLL Source Down Exec soft key makes the target element for the PLL
source larger.
ESC
7-8
ESC
IM 760101-01E
7.4 Selecting the PLL Source
Explanation
Set the PLL (phase locked loop) source that is used to determine the fundamental
period, which acts as the reference in the analysis of the harmonic orders.
Displayed Position of the Selected PLL Source
The selected PLL source is displayed at the upper right corner of the screen when
HARMONICS is pressed.
Below is a display example when the PLL source is set to the voltage of Element1.
PLL source
Voltage
Element
Selecting the PLL Source
Select the PLL source from the following list of choices. The selectable items vary
depending on the installed elements.
U1, I1, U2, I2, U3, I3, U4, I4, U5, I5, U6, I6, Ext Clk*, and Smp Clk*
If you select “Ext Clk,” harmonic measurement is performed using the frequency of the signal
applied to the external clock input connector as the fundamental frequency. If you select
“Smp Clk,” harmonic measurement is performed using (1/2048) × the frequency of the signal
applied to the external clock input connector as the fundamental frequency.
When the PLL Source Is Set to Ext Clk or Smp Clk
Apply a clock signal to the external clock input connector (EXT CLK) on the rear panel
according to the following specifications.
EXT CLK
• Ext Clk specifications
Item
Specification
Connector type
BNC connector, same as the Smp Clk connector, simultaneous input with
Smp Clk is not allowed.
10 Hz to 1 kHz
TTL
50% duty ratio rectangular wave
Frequency range
Input level
Input waveform
• Smp Clk specifications
Item
Specification
Connector type
BNC connector, same as the Ext Clk connector, simultaneous input with
Ext Clk is not allowed.
Frequency equal to 2048 times the fundamental frequency of 0.5 Hz to
100 Hz
TTL
50% duty ratio rectangular wave
Frequency range
Input level
Input waveform
CAUTION
Applying a voltage outside the range of 0 to 5 V to the external clock input
connector (EXT CLK) can damage the instrument.
IM 760101-01E
7-9
Harmonic Measurement
*
7
7.4 Selecting the PLL Source
Note
•
•
•
•
•
7-10
The frequency of up to three signals including the signals selected for the PLL source as fU
(voltage frequency) or fI (current frequency) can be measured. For the procedure in selecting
the frequency measurement target, see section 6.3. If the number of frequency measurement
targets exceeds three because you selected a PLL source other than the source selected in
section 6.3, frequency measurement targets are removed in order from the element with the
largest number in the order voltage and current.
Select a signal that has the same period as the target signal for the harmonic measurement.
Selecting an input signal with little distortion for the PLL source enables stable harmonic
measurement. If the fundamental frequency of the PLL source fluctuates or if the
fundamental frequency cannot be measured due to waveform distortion, correct
measurement results will not be obtained. It is recommended that the voltage of the PLL
source be set so that the distortion is small with respect to the current.
If all the input signals are distorted or the amplitude level is small with respect to the
measurement range, the specifications may not be met. To achieve accurate measurements
on the high orders of the harmonics, set the PLL source to external clock and apply a signal
with the same period as the input signal to the external clock input connector.
If the fundamental frequency is less than or equal to 440 Hz and the signal contains high
frequency components, it is recommended that the zero crossing filter be set to 500 Hz. The
cut-off frequency of this filter is 500 Hz and is valid only for the frequency measurement
circuit.
If the amplitude level of the signal input to the element specified as the PLL source is small
with respect to the range, PLL synchronization may not be achieved. If the crest factor is set
to 3, set the measurement range so that the amplitude level of the PLL source is at least
30%. If the crest factor is set to 6, set the measurement range so that the amplitude level of
the PLL source is at least 60%.
When the PLL source frequency changes, the correct measured values are displayed starting
from the 4th data update after the change.
IM 760101-01E
7.5
Setting the Harmonic Order to Be Analyzed
Keys
SELE
CT
SET
RE
DISPLAY
HOLD
UP DATE
RATE
FILE
SINGLE
ESC
TRIG'D
WAVE
STORE
COPY
STORE SET
MENU
REMOTE
HARMONICS
CURSOR
LOCAL
MAX HOLD
MISC
NULL
SHIFT
To exit the menu during operation, press ESC.
INPUT
RANGE
SCALING
WIRING
AVG
MEASURE
MOTOR SET
FILTER
7
CAL
INTEGRATOR
STOP
RESET
SYNC SRC
Harmonic Measurement
START
INTEG SET
Procedure
1.
2.
Press HARMONICS to display the Harmonics menu.
Press the Mode soft key to select ON.
Selecting the Minimum Harmonic Order to Be Analyzed
3.
Press the Min Order soft key to select 0 or 1.
Selecting the Maximum Harmonic Order to Be Analyzed
4.
Turn the jog shuttle to set the maximum harmonic order to be analyzed.
ESC
IM 760101-01E
ESC
7-11
7.5 Setting the Harmonic Order to Be Analyzed
Explanation
Select the range of harmonic orders that will be used to determine the numerical data of
Total and the distortion factor of the harmonic waveform. For details on how to
determine the data, see appendix 1.
Selecting the Minimum Harmonic Order to Be Analyzed
You can select from the following list of choices.
• 0: Includes the 0th order (DC) component when determining the various numerical
data of the harmonic waveform.
• 1: Does not include the 0th order (DC) component when determining the various
numerical data of the harmonic waveform. 1st order (fundamental signal) is the
first component used.
Setting the Maximum Harmonic Order to Be Analyzed
Select the harmonic order in the range from 1 to 100th order.
Note
•
•
7-12
When the minimum harmonic order is set to 1, the numerical data representing the total of the
harmonic measurement data will not include the DC component.
You can set the maximum harmonic order up to 100th order, but the maximum harmonic
order that is actually used to determine the numerical data is the order corresponding to the
upper limit of harmonic order under analysis. The upper limit is determined automatically
(maximum is 100) by the frequency of the PLL source. The numerical data corresponding
harmonic orders exceeding the upper limit is shown as [-------] (no data).
IM 760101-01E
7.6
Selecting the Equation for the Distortion Factor
Keys
SELE
CT
SET
RE
DISPLAY
HOLD
UP DATE
RATE
FILE
SINGLE
ESC
TRIG'D
WAVE
STORE
COPY
STORE SET
MENU
REMOTE
HARMONICS
CURSOR
LOCAL
MAX HOLD
MISC
NULL
SHIFT
To exit the menu during operation, press ESC.
INPUT
RANGE
SCALING
WIRING
AVG
MEASURE
MOTOR SET
FILTER
7
CAL
INTEGRATOR
STOP
RESET
SYNC SRC
Harmonic Measurement
START
INTEG SET
Procedure
1.
2.
3.
4.
Press HARMONICS to display the Harmonics menu.
Press the Mode soft key to select ON.
Press the Thd Formula soft key to display the Thd Formula menu.
Press the 1/Total or 1/Fundamental soft key to select the equation for the
distortion factor.
ESC
ESC
ESC
Explanation
When determining the measurement functions Uhdf, Ihdf, Phdf, Uthd, Ithd, and Pthd of
the harmonic measurement mode, select the denominator of the equation from the
following list of choices. For the equation, see appendix 1.
• 1/Total
All harmonic measurement data from the minimum to the maximum harmonic order
(up to the upper limit of harmonic order) to be analyzed become the denominator.
• 1/Fundamental
The data of the fundamental signal component (1st order) become the denominator.
Note
The minimum and maximum harmonic orders to be analyzed are the components selected in
section 7.5.
IM 760101-01E
7-13
7.7
Changing the Data Length
Keys
SELE
CT
SET
RE
DISPLAY
HOLD
UP DATE
RATE
FILE
SINGLE
ESC
TRIG'D
WAVE
STORE
COPY
STORE SET
MENU
REMOTE
HARMONICS
CURSOR
LOCAL
MAX HOLD
MISC
NULL
SHIFT
To exit the menu during operation, press ESC.
INPUT
RANGE
SCALING
WIRING
AVG
MEASURE
MOTOR SET
FILTER
CAL
INTEGRATOR
START
STOP
INTEG SET
RESET
SYNC SRC
Procedure
1.
2.
3.
4.
Press HARMONICS to display the Harmonics menu.
Press the Mode soft key to select ON.
Press the Window Width soft key to display the Window Width menu.
Press one of the 8192 to 2048 soft keys to select the window width to be
analyzed.
ESC
ESC
ESC
Explanation
You can select the target data length (number of sampled data) for the harmonic
measurement from the following list of choices. The selected data length becomes the
measurement period. When the waveform is displayed, the measurement period
corresponds to one screen of the waveform.
8192, 4096, and 2048
Note
The data update rate (interval) during harmonic measurement is as follows:
• When all the following conditions are met: a data length of 8192, retrieval of waveform
display data turned OFF, and a PLL source frequency of 50/60 Hz.
{8192/(sampling frequency during harmonic measurement)} s
• For all other conditions
{data length/(sampling frequency during harmonic measurement) + approx. 0.5} s
7-14
IM 760101-01E
7.8
Setting the User-Defined Function
Keys
SELE
CT
SET
RE
DISPLAY
HOLD
UP DATE
RATE
FILE
SINGLE
ESC
TRIG'D
WAVE
STORE
COPY
STORE SET
MENU
REMOTE
LOCAL
HARMONICS
CURSOR
MAX HOLD
MISC
NULL
SHIFT
To exit the menu during operation, press ESC.
INPUT
RANGE
SCALING
WIRING
AVG
MEASURE
MOTOR SET
FILTER
7
CAL
INTEGRATOR
STOP
RESET
SYNC SRC
Procedure
Check that the measurement mode is set to harmonic measurement. If the
measurement mode is set to normal measurement, set Mode to ON in the
Harmonics menu (see section 7.1).
1.
2.
Press MEASURE to display the Measure menu.
Press the User Defined soft key to display the User Defined Function dialog
box.
Turning ON/OFF the User-Defined Function Computation
3.
Turn the jog shuttle to select the user-defined function you wish to enter from
Function1 to Function4.
4.
Press SELECT to select ON or OFF.
ESC
IM 760101-01E
7-15
Harmonic Measurement
START
INTEG SET
7.8 Setting the User-Defined Function
Setting the Unit
5.
Turn the jog shuttle to select Unit.
6.
Press SELECT to display the keyboard.
7.
Use the keyboard to set the unit.
For keyboard operations, see section 3.12, “Entering Values and Strings.”
Setting the Equation
8.
Turn the jog shuttle to select Expression.
9.
Press SELECT to display the keyboard.
10. Use the keyboard to set the equation.
For keyboard operations, see section 3.12, “Entering Values and Strings.”
ESC
ESC
Explanation
An equation can be created by combining the measurement function symbols. Using the
numerical values of the measurement functions, the numerical data of the new equation
can be determined.
Turning ON/OFF the User-Defined Function
You can select whether to perform the specified user-defined function computation.
• ON
Performs the computation.
• OFF
Does not perform the computation.
Setting the Unit
• Number of Characters
Eight characters or less. However, not all eight characters can be shown on the
numerical data display. This depends on the number of displayed items (see
section 4.1).
• Types of characters
Characters that are displayed on the keyboard and spaces
7-16
IM 760101-01E
7.8 Setting the User-Defined Function
Setting the Equation
The combination of the measurement function, element number, and harmonic order
(U(E1,OR1), for example) can be used as an operand to create up to four equations
(F1 to F4). There can be up to 16 operands in one equation.
• Measurement functions for computation
The operators for the measurement functions are shown below in the form
measurement function: operand.
U: U( , )
I: I( , )
P: P( , )
S: S( , )
Q: Q( , )
λ: LAMBDA( , )
φ: PHI( , )
φU: UPHI( , )
φI: IPHI( , )
Z: Z( , )
Rs: RS( , )
Xs: XS( , )
Rp: RP( , )
Xp: XP( , )
Uhdf: UHDF( , )
Ihdf: IHDF( , )
Phdf: PHDF( , )
Uthd: UTHD( )
Ithd: ITHD( )
Pthd: PTHD( )
Uthf: UTHF( )
Ithf: ITHF( )
Utif: UTIF( )
Itif: ITIF( )
hvf: HVF( )
hcf: HCF( )
fU: FU( )
fI: FI( )
φU1-U2: PHIU1U2( )
φU1-U3: PHIU1U3( )
φU1-I1: PHIU1I1( )
φU1-I2: PHIU1I2( )
φU1-I3: PHIU1I3( )
7
IM 760101-01E
7-17
Harmonic Measurement
• ( , )A symbol representing the element to which the measured signal is to be
applied is entered on the left side. OR followed by the harmonic order is
entered on the right side. (E1,OR2) is an example. Elements 1, 2, 3, 4, 5, 6,
ΣA, ΣB, and ΣC are represented by the symbols E1, E2, E3, E4, E5, E6, E7, E8,
and E9 respectively. One symbol from E1 to E9 can be used, except for the
following computation symbols.
• One symbol from E1 to E6 can be entered in the parentheses for PHI( , ) to FI( ).
• One symbol from E7 to E9 can be entered in the parentheses for PHIU1U2( )
to PHIU1I3( ).
• For operands that do not have a comma inside the parentheses, no harmonic
order needs to be specified.
• If the harmonic section is set to “ORT,” it represents Total; if it is set to “0
(zero),” it represents DC.
7.8 Setting the User-Defined Function
• Operators
The following operators can be used to create the equation.
Operator
Example
Description
+, –, ∗, /
U(E1,OR1)–U(E2,OR1)
Basic arithmetic of the measurement functions
ABS
ABS(P(E1,ORT)+P(E2,ORT))
Absolute value of the measurement function
SQR
SQR(I(E1,OR0))
Square of the measurement function
SQRT
SQRT(ABS(I(E1,OR3)))
Square root of the measurement functions
LOG
LOG(U(E1,OR25))
Natural log of the measurement functions
LOG10
LOG10(U(E1,OR25))
Common log of the measurement function
EXP
EXP(U(E1,OR12))
Exponent of the measurement function
NEG
NEG(U(E1,OR12))
Negation of the measurement function
• Number and Type of Characters That Can Be Used in the Equation
• Number of Characters
50 characters or less.
• Types of characters
Characters that are displayed on the keyboard and spaces
Note
•
•
7-18
An equation (F1 to F4) cannot be placed inside another equation (F1 to F4).
If an operand in the equation is undetermined, the computation result displays [-------] (no data).
(For example, if the measurement function of an element that is not installed is in the equation.)
IM 760101-01E
7.9
Changing the Display Items of Bar Graphs and
Performing Cursor Measurements
«For a functional description, see section 1.8.»
Keys
SELE
CT
SET
RE
DISPLAY
HOLD
UP DATE
RATE
FILE
SINGLE
ESC
TRIG'D
WAVE
CURSOR
STORE
COPY
STORE SET
MENU
REMOTE
HARMONICS
LOCAL
MAX HOLD
MISC
NULL
SHIFT
To exit the menu during operation, press ESC.
INPUT
RANGE
SCALING
WIRING
AVG
MEASURE
MOTOR SET
FILTER
7
CAL
INTEGRATOR
STOP
RESET
SYNC SRC
Procedure
Check that the measurement mode is set to harmonic measurement. If the
measurement mode is set to normal measurement, set Mode to ON in the
Harmonics menu (see section 7.1).
1.
Press DISPLAY to display the Display menu.
Check that Format (display format) is set to Bar, Numeric+Bar, Wave+Bar, or
Bar+Trend. For the display format of the bar graph, see section 4.3.
When the display format is set to Numeric+Bar, Wave+Bar, or Bar+Trend,
pressing the Bar Setting soft key displays the Bar Setting menu.
ESC
IM 760101-01E
7-19
Harmonic Measurement
START
INTEG SET
7.9 Changing the Display Items of Bar Graphs and Performing Cursor Measurements
The following procedures are given for a representative example in which the
display format is set to Bar.
Selecting the Number of Split Bar Graph Windows
2.
Press the Bar Format soft key to display the Bar Format menu.
3.
Press one of the keys from Single to Triad to select the number of windows.
• If you select Single, the bar graph with the Bar Item No. 1 in the next section
is displayed.
• If you select Dual, the bar graphs with the Bar Item No. 1 and 2 in the next
section is displayed.
• If you select Triad, the bar graphs with the Bar Item No. 1 to 3 in the next
section is displayed.
Selecting the Item to Be Changed
4.
Press the Bar Item No. soft key.
5.
Turn the jog shuttle to select 1 to 3.
Changing the Measurement Function
6.
Press the Function soft key to display the measurement function selection box.
7.
Turn the jog shuttle to select the measurement function.
8.
Press SELECT. The symbol for the selected measurement function and the bar
graph are displayed.
Changing the Element
9.
Press the Element soft key to display the element selection box.
10. Turn the jog shuttle to select any of the elements/wiring units starting with Element1.
11. Press SELECT. The selected element number and the bar graph are displayed.
Setting the Display Range of the Bar Graph
The difference between the start and end orders must be greater than or equal to 10.
• Setting the start order
12. Press the Start Order/End Order soft key to set the jog shuttle target to Start Order.
13. Turn the jog shuttle to set the start order of the bar graph.
For the procedures on how to enter values using the jog shuttle, see section 3.12,
“Entering Values and Strings.”
• Setting the end order
14. Press the Start Order/End Order soft key to set the jog shuttle target to End
Order.
15. Turn the jog shuttle to set the end order of the bar graph.
For the procedures on how to enter values using the jog shuttle, see section 3.12,
“Entering Values and Strings.”
ESC
7-20
ESC
ESC
ESC
IM 760101-01E
7.9 Changing the Display Items of Bar Graphs and Performing Cursor Measurements
Performing Cursor Measurements
2.
Press SHIFT+WAVE (CURSOR) to display the Cursor menu.
• Turning ON/OFF cursor measurement
3.
Press the Bar Cursor soft key to select ON or OFF.
If ON is selected, the result of the cursor measurement is displayed.
• Moving the cursor
4.
Press the Bar C1 +/Bar C2 x soft key to set the jog shuttle target to Bar C1 +,
Bar C2 x, or both Bar C1 + and Bar C2 x.
•
•
•
5.
If you select Bar C1 +, the position of cursor + can be moved.
If you select Bar C2 x, the position of cursor x can be moved.
If you select both Bar C1 + and Bar C2 x, the two cursors can be moved without
changing the spacing between the two. The value of the digit being specified by Bar
C1 + changes.
Turn the jog shuttle to set and move the cursor position in terms of the
harmonic order.
7
For the procedures on how to enter values using the jog shuttle, see section 3.12,
“Entering Values and Strings.”
Harmonic Measurement
ESC
ESC
Explanation
Selecting the Item to Be Changed
Three types of bar graphs can be specified. Select the type from 1 (bar graph 1) to 3
(bar graph 3).
Changing the Measurement Function
Select the measurement function to be changed from the following list of choices.
U, I, P, S, Q, λ, φ, φU, φI, Z, Rs, Xs, Rp, and Xp
Changing the Element
• Select the element from the following list of choices. The selectable items vary
depending on the installed elements.
Element1, Element2, Element3, Element4, Element5, and Element6
• If the selected element is not a harmonic measurement target, there is no numerical
data. Thus, the bar graph is not displayed in this case. For example, if the
measurement target is ΣA and you select the element assigned to ΣC, the bar graph
will not be displayed. For selecting the measurement target, see section 7.3.
IM 760101-01E
7-21
7.9 Changing the Display Items of Bar Graphs and Performing Cursor Measurements
Setting the Display Range of the Bar Graph
• Set the display range of the bar graph using harmonic order.
• The display range of bar graph 1 to bar graph 3 is the same.
• The minimum value is 0th order (dc). However, if the measurement function is set
to φ, φU, or φI, there is no value for the 0th order. Thus, 0th order is not displayed
on the bar graph.
• If the measurement function is set to φU or φI, there is no value for the 1st order.
Thus, 1st order is not displayed on the bar graph.
• The maximum value is the 100th order. However, bar graphs of orders that exceed
the upper limit of harmonic order under analysis (see section 17.6) are not
displayed.
Cursor Measurement
• ON/OFF
A cursor can be placed on the displayed bar graph to measure the value at that
point.
• ON: Performs cursor measurement.
• OFF: Does not perform harmonic measurement.
• Measured items
• Y1+: Y-axis value of cursor + of bar graph 1
• Y1x: Y-axis value of cursor x of bar graph 1
• ∆Y1: The difference between the Y-axis values of cursor + and cursor x of bar
graph 1
• Y2+: Y-axis value of cursor + of bar graph 2
• Y2x: Y-axis value q ‡cursor x of bar graph 2
• ∆Y2: The difference between the Y-axis values of cursor + and cursor x of bar
graph 2
• Y3+: Y-axis value of cursor + of bar graph 3
• Y3x: Y-axis value of cursor x of bar graph 3
• ∆Y3: The difference between the Y-axis values of cursor + and cursor x of bar
graph 3
• Cursor position
• Two cursors (+ and x) are displayed in each graph (bar graphs 1 to 3).
• The cursor position is set using harmonic order.
• Bar graph displays the harmonic order indicating the cursor position.
• The position of cursor + is displayed as in order+: 2.
• The position of cursor x is displayed as in orderx: 55.
• The harmonic order indicating the positions of cursor + and x are common to bar
graph 1 to bar graph 3.
Note
if unmeasurable data exists, “***” is displayed in the measured value display area.
7-22
IM 760101-01E
7.10 Changing the Vector Display
«For a functional description, see section 1.8.»
Keys
SELE
CT
SET
RE
DISPLAY
HOLD
UP DATE
RATE
FILE
SINGLE
ESC
TRIG'D
WAVE
STORE
COPY
STORE SET
MENU
REMOTE
HARMONICS
CURSOR
LOCAL
MAX HOLD
MISC
NULL
SHIFT
To exit the menu during operation, press ESC.
INPUT
RANGE
SCALING
WIRING
AVG
MEASURE
MOTOR SET
FILTER
7
CAL
INTEGRATOR
STOP
RESET
SYNC SRC
Procedure
Check that the measurement mode is set to harmonic measurement. If the
measurement mode is set to normal measurement, set Mode to ON in the
Harmonics menu (see section 7.1).
1.
Press DISPLAY to display the Display menu.
Check that Format (display format) is set to Vector. For the display format of
vectors, see section 4.4.
Turning ON/OFF the Numerical Data Display
2.
Press the Numeric soft key to select ON or OFF.
ESC
IM 760101-01E
7-23
Harmonic Measurement
START
INTEG SET
7.10 Changing the Vector Display
Zooming in on the Vector
2.
Press the U Mag/I Mag soft key to set the jog shuttle target to U Mag, I Mag, or
both U Mag and I Mag.
•
•
•
3.
If U Mag is selected, you can zoom in on the vector of the fundamental wave U(1) of
each element that is specified for harmonic measurement.
If I Mag is selected, you can zoom in on the vector of the fundamental wave I(1) of
each element that is specified for harmonic measurement.
If both U Mag and I Mag is selected, you can zoom in on the vector of the fundamental
waves U(1) and I(1) of each element that are specified for harmonic measurement
without changing the difference in the zoom factor between U Mag and I Mag. The
value of the digit being specified by U Mag changes.
Turn the jog shuttle to set the zoom factor.
ESC
Explanation
The phase and size (rms value) relationship between the fundamental waves U(1) and
I(1) of each element specified for harmonic measurement (see section 7.3) can be
displayed using vectors. The positive vertical axis is set to 0 (angle 0), and the vector of
each input signal is displayed.
Turning ON/OFF the Numerical Data Display
Select whether to display the numerical data. The size and the phase difference
between the signals can be displayed along with the vector display. For the display
format of the phase difference, see section 6.7.
• ON: Displays the numerical data.
• OFF: Does not display the numerical data.
Setting the Zoom Factor of Vectors
The size of the vectors can be changed.
• The zoom factor can be set in the range of 0.100 to 100.000.
• You can specify separate zoom factors for the fundamental waves U(1) and I(1).
7-24
IM 760101-01E
7.10 Changing the Vector Display
Vector Display Examples
When displaying numerical data (the size of the signal and the phase difference between signals)
For a 3P4W (three-phase, four-wire)
wiring system
U1(1), U2(1), and U3(1) are common
mode voltages.
I1(1), I2(1), and I3(1) are line currents.
For a 3V3A (three-voltage, three-current)
wiring system
U1(1), U2(1), and U3(1) are line voltages.
I1(1), I2(1), and I3(1) are line currents.
Size of the peripheral circle (range)
For a 3P3W (three-phase, three-wire)
wiring system
U1(1), U2(1), and U3(1) are line voltages.
I1(1), I2(1), and I3(1) are line currents.
However, U3(1) and I3(1) are not actually
measured for the three-phase three-wire
system. The vectors are displayed
through computation.
7
I1(1)
U1(1)
φU1-U2
φ1(1),
φU1-I1
I3(1)
φU1-I2
φU1-I3
φ3(1)
U3(1)
U2(1)
φ2(1)
φU1-U3
I2(1)
When the vector size is zoomed
• By moving the vectors, U1(1), U2(1), and
U3(1), so that the starting points of vectors
are all at the origin, the phase relationship
can be observed in the same fashion as the
φU3-U1
three-phase four-wire system. For the
U1(1)
relationship between the positions of the
U3(1)
vectors after moving them, see “Vector
O
φU1-U2
Display of Harmonics” in section 1.8. (The
WT1600 does not provide a function for
I3(1)
U2(1)
moving the vectors.)
φU2-U3
• The phase difference between the line
voltages can be determined from the phase
I2(1)
difference measurement functions φU1-U2
and φU1-U3.
φU1-U2 = This is the measurement function
φU1-U2.
φU2-U3 = (φU1-U3) – (φU1-U2) – 180°
φU2-U3 = (φU1-U3) – (φU1-U2) – 180°
Example in which the voltage is zoomed 2 times
and the current is zoomed 1/2 times
IM 760101-01E
Size of the peripheral circle (range)
The size of the vector representing the voltage
and current is expanded 2 times and 1/2 times,
respectively. The voltage range and current
range values are reduced to 1/2 and 2 the
original values, respectively.
7-25
Harmonic Measurement
I1(1)
Chapter 8
8.1
Motor Evaluation (Option)
Inputting Signals of Rotating Speed and
Torque
The rotating speed, torque, and output of a motor can be determined from the DC
voltage (analog signal) or pulse count signal received from a revolution sensor, which is
proportional to the rotating speed of the motor, and the DC voltage (analog signal)
received from a torque meter, which is proportional to the motor’s torque. In addition, the
synchronous speed and slip of a motor can be determined by setting the motor’s number
of poles. Furthermore, the active power and frequency that are measured by the
WT1600 and the motor output can be used to compute the motor efficiency and the total
efficiency. The motor evaluation function does not operate during harmonic
measurement.
CAUTION
Applying a voltage exceeding the maximum allowable input to the revolution
signal input connector (SPEED) or torque signal input connector (TORQUE) can
damage the instrument.
8
Motor Evaluation (Option)
Revolution Signal Input Connector (SPEED)
Input the signal output from the revolution sensor (a DC voltage (analog signal) or a
pulse signal that is proportional to the rotating speed of the motor) according to the
following specifications.
SPEED
DC Voltage (Analog Input)
Item
Specification
Connector type
Input range
Effective input range
BNC connector
20 V, 10 V, 5 V, 2 V, and 1 V
±110% of the measurement range
However, ±20 V or less
Approx. 1 MΩ
±20 V
±42 Vpeak or less
Input resistance
Maximum allowable input
Continuous maximum common mode voltage
Pulse Input
IM 760101-01E
Item
Specification
Connector type
Frequency range
Amplitude input range
Effective amplitude
Input waveform
Input resistance
Continuous maximum common mode voltage
BNC connector
2 Hz to 200 kHz
±5 Vpeak
1 V (peak-to-peak) or more
50% duty ratio rectangular wave
Approx. 1 MΩ
±42 Vpeak or less
8-1
8.1 Inputting Signals of Rotating Speed and Torque
Torque Meter Signal Input Connector (TORQUE)
Input the signal output from the torque meter (a DC voltage (analog signal) that is
proportional to the torque of the motor) according to the following specifications.
TORQUE
Item
Specification
Connector type
Input range
Effective input range
BNC connector
20 V, 10 V, 5 V, 2 V, and 1 V
±110% of the measurement range
However, ±20 V or less
Approx. 1 MΩ
±20 V
±42 Vpeak or less
Input resistance
Maximum allowable input
Continuous maximum common mode voltage
8-2
IM 760101-01E
8.2
Selecting the Input Range of the Revolution and
Torque Signals and the Synchronization Source
Keys
SELE
CT
SET
RE
DISPLAY
HOLD
UP DATE
RATE
FILE
SINGLE
ESC
TRIG'D
WAVE
CURSOR
STORE
COPY
STORE SET
MENU
REMOTE
HARMONICS
LOCAL
MAX HOLD
MISC
NULL
SHIFT
To exit the menu during operation, press ESC.
INPUT
RANGE
SCALING
WIRING
AVG
MEASURE
MOTOR SET
FILTER
CAL
INTEGRATOR
START
STOP
INTEG SET
RESET
SYNC SRC
8
Procedure
Press SHIFT+RANGE (MOTOR SET) to display the Motor Set dialog box.
Selecting the Input Range of the Revolution Signal
• When Analog is selected in the latter section “Selecting the revolution signal
type”
2.
Turn the jog shuttle to select Range under Speed.
3.
Press SELECT to display the input range selection box.
4.
Turn the jog shuttle to select the input range from Auto and 20 V to 1 V.
5.
Press SELECT to confirm the new input range.
Input range is selectable when the
type of revolution signal is “Analog.”
IM 760101-01E
8-3
Motor Evaluation (Option)
1.
8.2 Selecting the Input Range of the Revolution and Torque Signals and the Synchronization Source
Selecting the Input Range of the Torque Signal
2.
Turn the jog shuttle to select Range under Torque.
3.
Press SELECT to display the input range selection box.
4.
Turn the jog shuttle to select the input range from Auto and 20 V to 1 V.
5.
Press SELECT to confirm the new input range.
Selecting the Revolution Signal Type
2.
Turn the jog shuttle to select Sense Type.
3.
Press SELECT to select Analog or Pulse.
Setting the Pulse Input Range
(When the type of revolution signal is Pulse, set the pulse input range (rated value of
the rotating speed). For D/A output (see section 15.1), the D/A output value is +5 V
when the rotating speed is equal to the rated value.)
2.
Turn the jog shuttle to select Pulse Range.
3.
Press SELECT to display the pulse input range selection box.
4.
Turn the jog shuttle to set the pulse input range.
For the procedures on how to enter values using the jog shuttle, see section 3.12,
“Entering Values and Strings.”
5.
Press SELECT or ESC to close the box.
Selecting the Synchronization Source
2.
Turn the jog shuttle to select Sync Source.
3.
Press SELECT to display the synchronization signal selection box.
4.
Turn the jog shuttle to select any of the signals starting with U1.
5.
Press SELECT to confirm the new synchronization source.
8-4
IM 760101-01E
8.2 Selecting the Input Range of the Revolution and Torque Signals and the Synchronization Source
Explanation
Signals from revolution sensors and torque meters can be input to the revolution signal
input connector (SPEED) and the torque signal input connector (TORQUE) of the WT1600
for making measurements. For revolution sensors, the signal is a DC voltage (analog
signal) or a pulse count that is proportional to the rotating speed of the motor. For torque
meters, it is a DC voltage (analog signal) that is proportional to the motor’s torque.
Selecting the Revolution Signal Type
You can select from the following list of choices.
• Analog
Select this when the revolution signal type is a DC voltage (analog signal).
• Pulse
Select this when the revolution signal type is a pulse signal.
Selecting the Input Range of the Revolution and Torque Signals
Two types of range settings are available: fixed range and auto range.
• Fixed range
Select from the following input ranges.
20 V, 10 V, 5 V, 2 V, and 1 V
Pulse Input Range
• When the type of revolution signal is Pulse, set the value of the rotating speed
(rated value of the rotating speed) that will cause a D/A output (see section 15.1) of
+5 V.
• Set the pulse count in the range from 0.0001 to 99999.9999.
• When the type of revolution signal is Pulse, the lower limit of the waveform display
is fixed to 0, and the upper limit is the value equal to 1.2 times the rated value
specified here.
Selecting the Synchronization Source
• Select which element’s input signal will be used as a synchronization source
(synchronized to the zero crossing point of the selected signal) when measuring
the analog signal of the revolution signal and torque signal. Select the signal to be
the synchronization source from the following list of choices. The selectable items
vary depending on the installed elements.
U1, I1, U2, I2, U3, I3, U4, I4, U5, I5, U6, I6, Ext Clk (external clock)*, and None
*
For the specifications of the Ext Clk (external clock), see the explanation in section 7.4.
• The measurement period determined by the synchronization source selected here
is used to measure the analog signal of the revolution signal and torque signal. If
you specify no synchronization source by selecting “None,” the entire sampled data
within the data update interval is the data used to determine the rotating speed and
torque.
• This does not apply when the revolution signal is a pulse signal.
• When the revolution signal is a pulse signal, the measured value of the revolution
signal is the averaged interval of the pulse signal of the measurement period
determined from the synchronized source selected here. If the period of the pulse
signal is not included in this measurement interval, the measured value is
determined from the previous period.
IM 760101-01E
8-5
8
Motor Evaluation (Option)
• Auto range
Select Auto for the input range setting to enable auto range. The range changes
automatically depending on the amplitude of the input signal. The switching
conditions and precautions are the same as the descriptions given in section 5.2,
“Setting the Measurement Range during Direct Input.” The different ranges used in
the auto mode are the same as those available for fixed range.
8.3
Selecting the Line Filter
Keys
SELE
CT
SET
RE
DISPLAY
HOLD
UP DATE
RATE
FILE
SINGLE
ESC
TRIG'D
WAVE
CURSOR
STORE
COPY
STORE SET
MENU
REMOTE
HARMONICS
LOCAL
MAX HOLD
MISC
NULL
SHIFT
To exit the menu during operation, press ESC.
INPUT
RANGE
SCALING
WIRING
AVG
MEASURE
MOTOR SET
FILTER
CAL
INTEGRATOR
START
STOP
INTEG SET
RESET
SYNC SRC
Procedure
1.
2.
3.
4.
5.
Press SHIFT+RANGE (MOTOR SET) to display the Motor Set dialog box.
Turn the jog shuttle to select Line Filter.
Press SELECT to display the line filter selection box.
Turn the jog shuttle to select OFF or 100 Hz.
Press SELECT to confirm the new line filter. The same filter is set to both the
revolution signal and the torque signal.
Explanation
A line filter can be inserted into the circuits that measure the revolution signal and torque
signal. It eliminates harmonic noise.
• The cutoff frequency can be selected from the list of choices below.
OFF and 100 Hz
• Selecting OFF disables the filter.
Note
When the revolution signal type is Pulse, the line filter does not function.
8-6
IM 760101-01E
8.4
Setting the Scaling Factor, the Pulse Count,
and Unit Used to Measure the Rotating Speed
Keys
SELE
CT
SET
RE
DISPLAY
HOLD
UP DATE
RATE
FILE
SINGLE
ESC
TRIG'D
WAVE
STORE
COPY
STORE SET
MENU
REMOTE
HARMONICS
CURSOR
LOCAL
MAX HOLD
MISC
NULL
SHIFT
To exit the menu during operation, press ESC.
INPUT
RANGE
SCALING
WIRING
AVG
MEASURE
MOTOR SET
FILTER
CAL
INTEGRATOR
START
STOP
INTEG SET
RESET
SYNC SRC
8
Procedure
Motor Evaluation (Option)
1.
Press SHIFT+RANGE (MOTOR SET) to display the Motor Set dialog box.
Setting the Scaling Factor Used to Transform the Revolution Signal
2.
Turn the jog shuttle to select Scaling under Speed.
3.
Press SELECT to display the scaling factor setting box.
4.
Turn the jog shuttle to set the scaling factor.
For the procedures on how to enter values using the jog shuttle, see section 3.12,
“Entering Values and Strings.”
5.
IM 760101-01E
Press SELECT or ESC to close the box.
8-7
8.4 Setting the Scaling Factor, the Pulse Count, and Unit Used to Measure the Rotating Speed
Setting the Pulse Count per Rotation When the Revolution Signal type Is Set to Pulse
2.
Turn the jog shuttle to select Pulse N.
3.
Press SELECT to display the pulse count setting box.
4.
Turn the jog shuttle to set the pulse count.
For the procedures on how to enter values using the jog shuttle, see section 3.12,
“Entering Values and Strings.”
5.
Press SELECT or ESC to close the box.
Setting the Unit of Rotating Speed
2.
Turn the jog shuttle to select Unit under Speed.
3.
Press SELECT to display the keyboard.
4.
Use the keyboard to set the unit.
For keyboard operations, see section 3.12, “Entering Values and Strings.”
8-8
IM 760101-01E
8.4 Setting the Scaling Factor, the Pulse Count, and Unit Used to Measure the Rotating Speed
Explanation
Setting the Scaling Factor
Set the factor used to transform the revolution signal. Set the factor in the range from
0.0001 to 99999.9999.
• When the revolution signal type is Analog
By setting the number of rotations per volt of input voltage, the rotating speed is
derived from the following equation.
Speed (rotating speed)
= Input voltage from the revolution sensor × Scaling factor
• When the revolution signal type is Pulse
The value is used as a scaling factor in the equation given in the next item “Setting
the pulse count.”
Setting the Pulse Count
Set the pulse count per rotation. Set the factor in the range from 1 to 9999. The scaling
factor takes effect when the revolution signal type is set to Pulse in section 8.2.
Speed (rotating speed) =
Pulse count (pulse count per revolution)
× Scaling factor*
8
When the scaling factor is 1, the rotating speed is equal to the number of rotations per
minute (min–1 or rpm). When the revolution signal is a changed signal, you can set the
scaling factor (see previous item) to determine the rotating speed before the change.
Setting the Unit of Rotating Speed
• Number of Characters
Eight characters or less.
• Types of characters
Characters that are displayed on the keyboard or spaces.
IM 760101-01E
8-9
Motor Evaluation (Option)
*
Number of input pulses from the
revolution sensor per minute
8.5
Setting the Scaling Factor and Unit Used to
Measure the Torque
Keys
SELE
CT
SET
RE
DISPLAY
HOLD
UP DATE
RATE
FILE
SINGLE
ESC
TRIG'D
WAVE
STORE
COPY
STORE SET
MENU
REMOTE
HARMONICS
CURSOR
LOCAL
MAX HOLD
MISC
NULL
SHIFT
To exit the menu during operation, press ESC.
INPUT
RANGE
SCALING
WIRING
AVG
MEASURE
MOTOR SET
FILTER
CAL
INTEGRATOR
START
STOP
INTEG SET
RESET
SYNC SRC
Procedure
1.
Press SHIFT+RANGE (MOTOR SET) to display the Motor Set dialog box.
Setting the Scaling Factor Used to Transform the Torque Signal
2.
Turn the jog shuttle to select Scaling under Torque.
3.
Press SELECT to display the scaling factor setting box.
4.
Turn the jog shuttle to set the scaling factor.
For the procedures on how to enter values using the jog shuttle, see section 3.12,
“Entering Values and Strings.”
5.
8-10
Press SELECT or ESC to close the box.
IM 760101-01E
8.5 Setting the Scaling Factor and Unit Used to Measure the Torque
Setting the Unit of Torque
2.
Turn the jog shuttle to select Torque under Unit.
3.
Press SELECT to display the keyboard.
4.
Use the keyboard to set the unit.
For keyboard operations, see section 3.12, “Entering Values and Strings.”
Explanation
Torque = Input voltage from the torque meter × Scaling factor
Setting the Unit of Torque
• Number of Characters
Eight characters or less.
• Types of characters
Characters that are displayed on the keyboard or spaces.
Note
To set the unit of the motor output that is determined in section 8.7 to “W,” set the unit of torque to N•m.
IM 760101-01E
8-11
8
Motor Evaluation (Option)
Setting the Scaling Factor
You can specify the scaling factor used to transform the torque signal to the torque of
the motor. Set the factor in the range from 0.0001 to 99999.9999.
By setting the torque per volt of input voltage, the torque is derived from the input
voltage from the torque meter using the following equation.
8.6
Setting the Motor’s Number of Poles Used to
Compute the Synchronous Speed and the Slip
Keys
SELE
CT
SET
RE
DISPLAY
HOLD
UP DATE
RATE
FILE
SINGLE
ESC
TRIG'D
WAVE
STORE
COPY
STORE SET
MENU
REMOTE
HARMONICS
CURSOR
LOCAL
MAX HOLD
MISC
NULL
SHIFT
To exit the menu during operation, press ESC.
INPUT
RANGE
SCALING
WIRING
AVG
MEASURE
MOTOR SET
FILTER
CAL
INTEGRATOR
START
STOP
INTEG SET
RESET
SYNC SRC
Procedure
1.
Setting
2.
3.
4.
Press SHIFT+RANGE (MOTOR SET) to display the Motor Set dialog box.
the Motor’s Number of Poles
Turn the jog shuttle to select Pole.
Press SELECT to display the motor’s number of poles selection box.
Turn the jog shuttle to set the number of poles.
For the procedures on how to enter values using the jog shuttle, see section 3.12,
“Entering Values and Strings.”
5.
8-12
Press SELECT or ESC to close the box.
IM 760101-01E
8.6 Setting the Motor’s Number of Poles Used to Compute the Synchronous Speed and the Slip
Selecting the Frequency Measurement Source (Voltage or Current Supplied to the Motor)
2.
Turn the jog shuttle to select Sync Speed.
3.
Press SELECT to display the frequency measurement source selection box.
4.
Turn the jog shuttle to select any of the target input signals for frequency
measurement (see section 6.3).
When the button to the left of the input signal in the selection box is highlighted, that is
the target input signal for frequency measurement selected in section 6.3.
5.
Press SELECT to confirm the new frequency measurement source.
Explanation
Setting the Frequency Measurement Source
• Select the frequency measurement source from the following list of choices. The
selectable items vary depending on the installed elements.
U1, I1, U2, I2, U3, I3, U4, I4, U5, I5, U6, and I6
• Select any of the target input signals for frequency measurement. When the button to the
left of the input signal in the frequency measurement source selection box is highlighted,
that is the target input signal for frequency measurement selected in section 6.3. If you
select an input signal that is not a frequency measurement target, an error results.
• In normal cases, a voltage or current supplied to the motor of which the input
signal is a frequency measurement target (see section 6.3) is selected. If a
frequency other than that of the voltage and current supplied by the motor is
specified, the synchronous speed may not be determined correctly.
Equation for Deriving the Synchronous Speed
The unit of synchronous speed is fixed to min –1 or rpms. The equation is shown below.
120 × Frequency of the frequency measurement source (Hz)
Sync (min–1) =
Motor’s number of poles
Equation for Deriving the Slip
The unit of synchronous speed is fixed to min–1 (or rpm). Therefore, to determine the
slip, set the scaling factor (see section 8.4) of the rotating speed so that the unit of
rotating speed is also min–1 (or rpm).
Slip (%) =
Synchronous speed (min–1) – Rotating speed* (min–1)
× 100
Synchronous speed (min–1)
* Rotating speed derived in section 8.4.
Note
Please select a stable voltage or current (supplied by the motor) with small distortion or noise
for the frequency measurement source.
IM 760101-01E
8-13
8
Motor Evaluation (Option)
Setting the Motor’s Number of Poles
The value can be set in the range of 1 to 99. Sets the number of poles for the motor
being measured.
8.7
Setting the Scaling Factor and Unit Used to
Compute the Motor Output
Keys
SELE
CT
SET
RE
DISPLAY
HOLD
UP DATE
RATE
FILE
SINGLE
ESC
TRIG'D
WAVE
STORE
COPY
STORE SET
MENU
REMOTE
HARMONICS
CURSOR
LOCAL
MAX HOLD
MISC
NULL
SHIFT
To exit the menu during operation, press ESC.
INPUT
RANGE
SCALING
WIRING
AVG
MEASURE
MOTOR SET
FILTER
CAL
INTEGRATOR
START
STOP
INTEG SET
RESET
SYNC SRC
Procedure
1.
Press SHIFT+RANGE (MOTOR SET) to display the Motor Set dialog box.
Setting the Scaling Factor Used to Compute the Motor Output
2.
Turn the jog shuttle to select Scaling under Pm.
3.
Press SELECT to display the scaling factor setting box.
4.
Turn the jog shuttle to set the scaling factor.
For the procedures on how to enter values using the jog shuttle, see section 3.12,
“Entering Values and Strings.”
5.
8-14
Press SELECT or ESC to close the box.
IM 760101-01E
8.7 Setting the Scaling Factor and Unit Used to Compute the Motor Output
Setting the Unit of Motor Output
2.
Turn the jog shuttle to select Unit under Pm.
3.
Press SELECT to display the keyboard.
4.
Use the keyboard to set the unit.
For keyboard operations, see section 3.12, “Entering Values and Strings.”
Explanation
Motor output Pm
2 × π × Rotating speed*1
=
× Scaling factor × Torque*2
60
*1 Rotating speed derived in section 8.4.
*2 Torque derived in section 8.5.
Note
For products with ROM version 1.05 or earlier, the equation for Pm is as follows:
Pm = Rotating speed × Scaling factor × Torque
Setting the Unit of Motor Output
• Number of Characters
Eight characters or less.
• Types of characters
Characters that are displayed on the keyboard or spaces.
IM 760101-01E
8-15
8
Motor Evaluation (Option)
Setting the Scaling Factor
You can specify the scaling factor used to compute the motor output (mechanical
power) from the rotating speed and torque. Set the factor in the range from 0.0001 to
99999.9999.
The equation is indicated below. When the scaling factors of rotating speed and
torque (see section 8.4 and 8.5) are set so that the unit of rotating speed is min–1 (or
rpm) and the unit of torque is N•m and the scaling factor of the motor output specified
here is 1, the unit of motor output Pm becomes W. In the computation of efficiency in
section 8.8, the computation is carried out by taking the unit of Pm to be W.
Therefore, it is recommended that the scaling factors of the items be set so that the
unit of Pm becomes W.
8.8
Computing the Motor Efficiency and Total
Efficiency
From the active power measured by the WT1600 and the motor output determined in
section 8.7, the WT1600 can compute the motor efficiency (ratio of the motor output
versus the power consumption by the motor) and total efficiency (ratio of the motor
output versus the power consumption by the motor as well as the converter through
which power is fed to the motor). Computation examples are indicated below.
When the Motor Input Is Wired to ΣA
ηmA is the motor efficiency.
Motor efficiency ηmA(%) =
Motor output* (W)
× 100
ΣA(W)
* Motor output derived in section 8.7.
ΣA
Power consumption
by the motor
Motor
Motor output
When the Converter Input Is Wired to ΣA and Motor Input Is Wired to ΣB
ηmA and ηmB are the total efficiency and motor efficiency, respectively.
Motor efficiency ηmB(%) =
Total efficiency ηmA(%) =
Motor output* (W)
× 100
ΣB(W)
Motor output* (W)
× 100
ΣA(W)
* Motor output derived in section 8.7.
ΣA
Power consumption
by the motor and
converter
Converter
ΣB
Power consumption
by the motor
Motor
Motor output
When the Converter Input Is Wired to ΣB and Motor Input Is Wired to ΣA
ηmA and ηmB are the motor efficiency and total efficiency, respectively.
Motor efficiency ηmA(%) =
Motor output* (W)
× 100
ΣΑ(W)
Total efficiency ηmA(%) =
Motor output* (W)
× 100
ΣΒ(W)
* Motor output derived in section 8.7.
ΣB
Power consumption
by the motor and
converter
Converter
ΣA
Power consumption
by the motor
Motor
Motor output
Note
With this wiring system, the delta computation function (see section 6.5) can be used to carry
out 3P3W>3V3A transformation. From the 3P3W>3V3A transformation, you can determine
one set of line voltage and common mode current that is not being measured.
8-16
IM 760101-01E
Chapter 9
Waveform Display
9.1
Retrieving Waveform Display Data
«For a functional description, see section 1.7.»
Keys
SELE
CT
SET
RE
DISPLAY
HOLD
UP DATE
RATE
FILE
SINGLE
ESC
TRIG'D
WAVE
STORE
COPY
STORE SET
MENU
REMOTE
HARMONICS
CURSOR
LOCAL
MAX HOLD
MISC
NULL
SHIFT
To exit the menu during operation, press ESC.
INPUT
RANGE
SCALING
WIRING
AVG
MEASURE
MOTOR SET
FILTER
CAL
INTEGRATOR
START
STOP
INTEG SET
RESET
SYNC SRC
Procedure
1.
ESC
ESC
Explanation
The retrieval of waveform display data must be turned ON to display waveforms. The
sample data that was acquired within the data update rate is P-P compressed and stored
to the memory as waveform display data.
• ON
The retrieval of waveform display data starts according to the trigger settings (see
section 9.3).
• OFF
Waveform display data is not retrieved.
IM 760101-01E
9-1
9
Waveform Display
2.
3.
Press DISPLAY to display the Display menu.
Check that Format (display format) is set to Wave, Numeric+Wave, Wave+Bar,
or Wave+Trend. For details on setting the display format, see section 4.2.
Press WAVE to display the Wave menu.
Press the Wave Sampling soft key to select ON or OFF. When turned ON,
retrieval of waveform display data is started according to the trigger setting (see
section 9.3).
9.2
Setting the Time Axis
«For a functional description, see section 1.7.»
Keys
SELE
CT
SET
RE
DISPLAY
HOLD
UP DATE
RATE
FILE
SINGLE
ESC
TRIG'D
WAVE
STORE
COPY
STORE SET
MENU
REMOTE
HARMONICS
CURSOR
LOCAL
MAX HOLD
MISC
NULL
SHIFT
To exit the menu during operation, press ESC.
INPUT
RANGE
SCALING
WIRING
AVG
MEASURE
MOTOR SET
FILTER
CAL
INTEGRATOR
START
STOP
INTEG SET
RESET
SYNC SRC
Procedure
• Check that the measurement mode is set to normal measurement. If the
measurement mode is set to harmonic measurement, Set Mode to OFF in the
Harmonics menu (see section 7.1).
• The retrieval of waveform display data must be turned ON to display
waveforms. For the procedure, see section 9.1.
1.
2.
3.
Press DISPLAY to display the Display menu.
Check that Format (display format) is set to Wave, Numeric+Wave, or
Wave+Trend. For details on setting the display format, see section 4.2.
Press WAVE to display the Wave menu.
Turn the jog shuttle to set the time axis. When the display of scale values is
turned ON (see section 9.8), the time at the left end (fixed to 0 s) and the right
end of the screen are displayed at the lower left corner and lower right corner of
the screen, respectively.
ESC
9-2
ESC
IM 760101-01E
9.2 Setting the Time Axis
Explanation
During Normal Measurement
Set the time axis in terms of Time/div (time per grid).
The time axis can be set in 1, 2, or 5 steps in the range up to the point in which the
time corresponding to one screen is equal to the data update rate. If the data update
rate is 500 ms, for example, changing the time per division in the order 0.5 ms, 1 ms,
2 ms, 5 ms, 10 ms, 20 ms, and 50 ms changes the time corresponding to one screen
in the order 5 ms, 10 ms, 50 ms, 100 ms, 200 ms, and 500 ms.
Time/div setting
• Number of data points displayed
in the range from the left to the
right end of the screen
• When "P-P" is displayed,
waveform is displayed using
P-P compression
(see section 1.7.)
Time at the left end of
the screen (fixed to 0 s)
Time at the right end of
the screen
No time/div setting
• Number of data points displayed
in the range from the left to the
right end of the screen
• When "P-P" is displayed,
waveform is displayed using
P-P compression
(see section 1.7.)
Display segment at the left
end of the screen
(0th line)
IM 760101-01E
Display segment at the right
end of the screen
(500th line)
9-3
9
Waveform Display
During Harmonic Measurement
The time corresponding to one screen in harmonic measurement is automatically
determined from the sample rate, which can be derived from the fundamental
frequency of the PLL source (see section 7.4), and the data length (Time width over
which FFT analysis is performed when determining harmonics, see section 7.7). It
cannot be set arbitrarily.
9.3
Setting the Trigger
«For a functional description, see section 1.7.»
Keys
SELE
CT
SET
RE
DISPLAY
HOLD
UP DATE
RATE
FILE
SINGLE
ESC
TRIG'D
WAVE
STORE
COPY
STORE SET
MENU
REMOTE
HARMONICS
CURSOR
LOCAL
MAX HOLD
MISC
NULL
SHIFT
To exit the menu during operation, press ESC.
INPUT
RANGE
SCALING
WIRING
AVG
MEASURE
MOTOR SET
FILTER
CAL
INTEGRATOR
START
STOP
INTEG SET
RESET
SYNC SRC
Procedure
The retrieval of waveform display data must be turned ON to display
waveforms. For the procedure, see section 9.1.
1.
2.
3.
Press DISPLAY to display the Display menu.
Check that Format (display format) is set to Wave, Numeric+Wave, Wave+Bar,
or Wave+Trend. For details on setting the display format, see section 4.2.
Press WAVE to display the Wave menu.
Press the Trigger soft key to display the Trigger menu.
ESC
9-4
ESC
IM 760101-01E
9.3 Setting the Trigger
Selecting the Trigger Mode
4.
Press the Mode soft key to display the Mode menu.
5.
Press the Auto or Normal soft key to select the trigger mode.
ESC
ESC
Selecting the Trigger Source
4.
Press the Source soft key to display the trigger source selection box.
5.
Turn the jog shuttle to select any of the signals starting with U1.
6.
Press SELECT to confirm the new trigger source.
ESC
9
Waveform Display
Selecting the Trigger Slope
4.
Press the Slope soft key to select
,
, or
.
Setting the Trigger Level
4.
Turn the jog shuttle to set the trigger level.
For the procedures on how to enter values using the jog shuttle, see section 3.12,
“Entering Values and Strings.”
IM 760101-01E
9-5
9.3 Setting the Trigger
Explanation
Trigger is a cue used to display the waveform on the screen. The trigger is activated
when the specified trigger condition is met. At this point, the waveform is ready to be
displayed on the screen.
Selecting the Trigger Mode
Trigger mode specifies the conditions for updating the screen display. You can select
from the following list of choices.
• Auto
Enables auto mode.
• If a trigger occurs (TRIG’D indicator illuminates) within the timeout time (approx.
100 ms), the display is updated using that trigger.
• If a trigger does not occur within the timeout time, the display is automatically
updated (TRIG’D indicator not illuminated) when the timeout time elapses.
• When the trigger signal period is greater than or equal to 100 ms, the two
conditions above are met alternately and the display is updated. In such case,
use normal mode.
• Normal
Enables normal mode.
• The display is updated when the trigger occurs.
• The display is not updated if the trigger does not occur.
Selecting the Trigger Source
Select the target for the specified trigger condition (trigger source) from the following
list of choices. The selectable items vary depending on the installed elements.
U1, I1, U2, I2, U3, I3, U4, I4, U5, I5, U6, I6, and Ext Clk (external clock)*
*
If the trigger source is set to Ext Clk, apply a signal according to the following
specifications. If the trigger source is set to Ext Clk, the trigger level settings are void.
When Setting the Trigger Source to Ext Clk
Apply a trigger signal to the external clock input connector (EXT CLK) on the rear
panel according to the following specifications.
EXT CLK
Item
Specification
Connector type
Input level
Minimum pulse width
Trigger delay time
BNC connector
TTL
1 µs
Within (1 µs + 1 sample period)
CAUTION
Applying a voltage outside the range of 0 to 5 V to the external clock input
connector (EXT CLK) can damage the instrument.
9-6
IM 760101-01E
9.3 Setting the Trigger
Input Circuit for the External Trigger Signal and Time Chart
+5 V
EXT CLK 100 Ω
External trigger signal
Minimum pulse width
External trigger
(when set to )
Trigger delay time
Internal trigger
Setting the Trigger Level
Trigger level refers to the level through which the trigger slope passes. When the
slope of the trigger source passes through the specified trigger level on a rising or
falling edge, a trigger occurs.
• The level can be set in the range from 0.0 to ±100.0%.
• Half of the total vertical span of the waveform display screen is considered to be 100%.
With the vertical center of the screen taken to be the input zero line, the upper and
lower limits of the waveform display screen are 100% and –100%, respectively. If
the crest factor is set to 3, the upper and lower limits of the waveform display screen
correspond to three times the measurement range (if scaled, the range after scaling)
of the voltage/current that is set for each element. Likewise, if the crest factor is set
to 6, the upper and lower limits correspond to six times the measurement range.
• The trigger level setting is void when the trigger source is set to Ext Clk.
Measurement range: 100 Vrms when the crest factor is 3, 50 Vrms when the crest factor is 6
Trigger level: 25%
100% (300 Vpk)
T
Input zero line
(Vertical center)
Trigger level 25% (75 V)
–100% (–300 Vpk)
Note
To prevent erroneous operation caused by noise, the trigger function uses approximately 2%
hysteresis if the crest factor is set to 3. If the trigger slope is set to , for example, the trigger
does not occur until the input signal level falls approximately 2% below the trigger level. The
trigger function uses approximately 4% hysteresis if the crest factor is set to 6.
IM 760101-01E
9-7
9
Waveform Display
Selecting the Trigger Slope
The up and down movement of a signal level is called a slope. When the slope is
used as one of the trigger conditions, it is called a trigger slope. You can select the
trigger slope from the following list of choices.
•
: The trigger occurs when the trigger source signal rises above the trigger level
from a lower level.
•
: The trigger occurs when the trigger source signal falls below the trigger level
from a higher level.
: Trigger occurs on both the rising and falling cases.
•
9.4
Zooming Vertically and Moving the Vertical
Position
«For a functional description, see section 1.7.»
Keys
SELE
CT
SET
RE
DISPLAY
HOLD
UP DATE
RATE
FILE
SINGLE
ESC
TRIG'D
WAVE
STORE
COPY
STORE SET
MENU
REMOTE
LOCAL
HARMONICS
CURSOR
MAX HOLD
MISC
NULL
SHIFT
To exit the menu during operation, press ESC.
INPUT
RANGE
SCALING
WIRING
AVG
MEASURE
MOTOR SET
FILTER
CAL
INTEGRATOR
START
STOP
INTEG SET
RESET
SYNC SRC
Procedure
The retrieval of waveform display data must be turned ON to display
waveforms. For the procedure, see section 9.1.
1.
2.
3.
Press DISPLAY to display the Display menu.
Check that Format (display format) is set to Wave, Numeric+Wave, Wave+Bar,
or Wave+Trend. For details on setting the display format, see section 4.2.
Press WAVE to display the Wave menu.
Press the V Zoom & Position soft key to display the V Zoom & Pos menu.
Selecting the Target Element
4.
Press the Element Object soft key to display the Element menu.
Only the installed elements are displayed.
5.
ESC
9-8
Press one the soft keys corresponding to the displayed element to select the
target element.
ESC
ESC
ESC
IM 760101-01E
9.4 Zooming Vertically and Moving the Vertical Position
Zooming in on the Voltage Waveform
6.
Press the (U) V Zoom soft key.
7.
Turn the jog shuttle to set the zoom factor.
Moving the Voltage Waveform Position
6.
Press the (U) Position soft key.
7.
If the crest factor is set to 3 or 6, turn the jog shuttle to set the position in terms
of a percentage with the value equal to measurement range × 3 or
measurement range × 6, respectively, taken to be 100%.
For the procedures on how to enter values using the jog shuttle, see section 3.12,
“Entering Values and Strings.”
Zooming in on the Current Waveform
6.
Press the (I) V Zoom soft key.
7.
Turn the jog shuttle to set the zoom factor.
Moving the Current Waveform Position
6.
Press the (I) Position soft key.
7.
If the crest factor is set to 3 or 6, turn the jog shuttle to set the position in terms
of a percentage with the value equal to measurement range × 3 or
measurement range × 6, respectively, taken to be 100%.
For the procedures on how to enter values using the jog shuttle, see section 3.12,
“Entering Values and Strings.”
9
ESC
IM 760101-01E
ESC
ESC
ESC
ESC
9-9
Waveform Display
Copying the Zoom Factor and Position
The zoom factor and position specified for a given element can be set to the elements
of the same wiring unit. The zoom factor and position for other elements that were
specified before are not held.
6.
Press one of the soft keys corresponding to the displayed element from which
the information is to be copied (the copy source).
7.
To copy the zoom factor, press the V Zoom Copy Exec soft key. To copy the
position, press the Position Copy Exec soft key. The zoom factor and position
of the voltage and current waveforms of the copy source are copied to the
elements of the same wiring unit. However, if the wiring system is pattern 1, the
settings are copied to all other elements.
9.4 Zooming Vertically and Moving the Vertical Position
Explanation
Selecting the Target Element to Be Specified
Only the installed elements are displayed. The Element menu is displayed according
to the element configuration of the product.
Zoom (Vertical Direction Only)
You can expand or reduce each displayed waveform (voltage/current). You can
select the zoom factor from the following list of choices.
0.1, 0.2, 0.25, 0.4, 0.5, 0.75, 0.8, 1, 1.14, 1.25, 1.33, 1.41, 1.5, 1.6, 1.77, 2, 2.28, 2.66,
2.83, 3.2, 3.54, 4, 5, 8, 10, 12.5, 16, 20, 25, 40, 50, and 100
Moving the Position (Vertical Direction Only)
The displayed position of the waveform can be moved vertically to the desired position
such as when you wish to view the mutual relationship between the voltage and
current waveforms or when the section of the waveform you wish to view goes out of
the display frame.
• The position can be set in the range from 0.000 to ±130.000%.
• When the zoom factor is 1, half of the total vertical span of the waveform display
screen (equal to measurement range × 3 or measurement range × 6 when the
crest factor is set to 3 or 6, respectively) is considered to be 100%.
100%
Move the position
by 50%
Move the position
by –50%
–100%
• When the zoom factor is not 1, the value equal to the measurement range × 3
(100%) or measurement range × 6 (100%) when the crest factor is set to 3 or 6,
respectively, is not located at the upper and lower limits of the screen as shown in
the following figure. Set the position by paying attention to the zoom factor. The
following figure shows an example when the crest factor is set to 3.
300 Vpk
(100%)
300 Vpk
(100%)
255 Vpk
150 Vpk
150 Vpk
Move the position
by –25%
–75 Vpk
–150 Vpk
–150 Vpk
Range displayed on
the screen
–300 Vpk
(–100%)
–300 Vpk
(–100%)
Note
To expand and view a section of the waveform, we recommend the following procedure.
1. Set the zoom factor to 1.
2. Move the vertical position so that the desired section of the waveform is at the center
position (according to the procedure described in this section).
3. Set the vertical zoom factor.
9-10
IM 760101-01E
9.5
Turning ON/OFF the Waveform Display
«For a functional description, see section 1.7.»
Keys
SELE
CT
SET
RE
DISPLAY
HOLD
UP DATE
RATE
FILE
SINGLE
ESC
TRIG'D
WAVE
CURSOR
STORE
COPY
STORE SET
MENU
REMOTE
HARMONICS
LOCAL
MAX HOLD
MISC
NULL
SHIFT
To exit the menu during operation, press ESC.
INPUT
RANGE
SCALING
WIRING
AVG
MEASURE
MOTOR SET
FILTER
CAL
INTEGRATOR
START
STOP
INTEG SET
RESET
SYNC SRC
Procedure
The retrieval of waveform display data must be turned ON to display
waveforms. For the procedure, see section 9.1.
Press DISPLAY to display the Display menu.
Check that Format (display format) is set to Wave, Numeric+Wave, Wave+Bar,
or Wave+Trend. For details on setting the display format, see section 4.2.
The following procedures are given for a representative example in which the
display format is set to Wave.
2.
Press the Wave Setting soft key to display the Wave Setting menu.
ESC
IM 760101-01E
9-11
Waveform Display
1.
9
9.5 Turning ON/OFF the Waveform Display
3.
Press the Wave Display soft key to display the Wave Display dialog box.
Turning ON/OFF the Display of the Input Signal Waveforms at Once
• Turning ON the display of the waveforms at once
4.
Turn the jog shuttle to select All ON.
5.
Press SELECT. All the buttons to the left of the input signal are highlighted. In
addition, if the retrieval of the waveform display data (see section 9.1) is ON, the
waveforms are displayed.
• Turning OFF the display of the waveforms at once
4.
Turn the jog shuttle to select All OFF.
5.
Press SELECT. The highlighting of all the buttons to the left of the signal is
cleared and the waveforms are no longer displayed.
Turning ON/OFF the Input Signal Waveforms One at a Time
4.
Turn the jog shuttle to select the input signal you wish to set.
5.
Press SELECT. If the retrieval of the waveform display data (see section 9.1) is
ON and the button to the left of the selected input signal is highlighted, the
waveform of that input signal is displayed. If the highlighting of the button is
cleared, the waveform of that input signal is no longer displayed.
ESC
Explanation
Only the input signals corresponding to the installed elements are displayed. The
waveform display can be turned ON/OFF for those input signals. For models with the
motor evaluation function (option), the waveform display for Speed and Torque input
signals can be turned ON/OFF through this procedure.
9-12
IM 760101-01E
9.6
Splitting the Screen and Displaying Waveforms
«For a functional description, see section 1.7.»
Keys
SELE
CT
SET
RE
DISPLAY
HOLD
UP DATE
RATE
FILE
SINGLE
ESC
TRIG'D
WAVE
STORE
COPY
STORE SET
MENU
REMOTE
HARMONICS
CURSOR
LOCAL
MAX HOLD
MISC
NULL
SHIFT
To exit the menu during operation, press ESC.
INPUT
RANGE
SCALING
WIRING
AVG
MEASURE
MOTOR SET
FILTER
CAL
INTEGRATOR
START
STOP
INTEG SET
RESET
SYNC SRC
Procedure
The retrieval of waveform display data must be turned ON to display
waveforms. For the procedure, see section 9.1.
Press DISPLAY to display the Display menu.
Check that Format (display format) is set to Wave, Numeric+Wave, Wave+Bar,
or Wave+Trend. For details on setting the display format, see section 4.2.
The following procedures are given for a representative example in which the
display format is set to Wave.
Selecting the Number of Split Windows
2.
Press the Wave Setting soft key to display the Wave Setting menu.
3.
Press the Wave Format soft key to display the Format menu.
4.
Press one of the keys from Single to Quad to select the number of windows.
ESC
IM 760101-01E
ESC
ESC
9-13
Waveform Display
1.
9
9.6 Splitting the Screen and Displaying Waveforms
Selecting the Waveform Mapping
5.
Press the Wave Mapping soft key to display the Wave Mapping dialog box.
6.
Turn the jog shuttle to select Mode.
7.
Press SELECT to select Auto, Fixed, or User. If you selected User, proceed to
step 8.
8.
Turn the jog shuttle to select the input signal you wish to set.
9.
Press SELECT to display the display position number selection box.
10. Turn the jog shuttle to select 0 to 3.
11. Press SELECT to confirm the new display position.
ESC
9-14
IM 760101-01E
9.6 Splitting the Screen and Displaying Waveforms
Explanation
The screen can be evenly divided and the waveforms can be mapped to the divided
windows.
Selecting the Number of Divisions
Select the number of divisions of the screen from the following list of choices.
• Single: No division
• Dual: 2 divisions
• Triad: 3 divisions
• Quad: 4 divisions
The number of displayed points in the vertical direction of one divided window varies
depending on the number of divisions as follows.
Single: 432 points, Dual: 216 points, Triad: 144 points, Quad: 108 points
Waveform Mapping
• Auto
The waveforms that are turned ON (see section 9.5) are mapped to the divided
windows in order by element numbers in the order voltage (U) and current (I),
followed by speed* and torque*.
*
Applicable only to products with the motor evaluation function (option).
The following figure shows how the waveforms are displayed when all 6 elements
are installed, with the motor evaluation function (option), the number of division is
Quad, display of U1, I1, U2, I2, U3, I3, I4, and Torque is ON, and display of U4, U5,
I5, U6, I6, and Speed is OFF.
Auto
U1, U3
I1, I3
U2, I4
I2, Torque
Fixed
U1, U3
I1, I3, Torque
U2
I2, I4
• User
The waveforms can be mapped arbitrarily to the divided windows regardless of
whether or not the display is turned ON. You can select the display position from 0
to 3. The waveforms are mapped in order starting from number 0 from the top
divided window.
User (when the screen is divided into
three windows with I1, Speed, and
Torque set to 0, 1, and 3, respectively)
I1, Torque
0, 3
Displayed in order according
Speed
1
to the specified number.
2
IM 760101-01E
9-15
9
Waveform Display
• Fixed
The waveforms are mapped in order by element number in the order voltage (U)
and current (I) to the divided windows regardless of whether or not the display is
turned ON. Speed* is displayed in the top frame; Torque* is displayed in the 2nd
frame from the top.
9.7
Interpolating the Display and Changing the
Graticule
«For a functional description, see section 1.7.»
Keys
SELE
CT
SET
RE
DISPLAY
HOLD
UP DATE
RATE
FILE
SINGLE
ESC
TRIG'D
WAVE
STORE
COPY
STORE SET
MENU
REMOTE
LOCAL
HARMONICS
CURSOR
MAX HOLD
MISC
NULL
SHIFT
To exit the menu during operation, press ESC.
INPUT
RANGE
SCALING
WIRING
AVG
MEASURE
MOTOR SET
FILTER
CAL
INTEGRATOR
START
STOP
INTEG SET
RESET
SYNC SRC
Procedure
The retrieval of waveform display data must be turned ON to display
waveforms. For the procedure, see section 9.1.
1.
Press DISPLAY to display the Display menu.
Check that Format (display format) is set to Wave, Numeric+Wave, Wave+Bar,
or Wave+Trend. For details on setting the display format, see section 4.2.
The following procedures are given for a representative example in which the
display format is set to Wave.
2.
Press the Wave Setting soft key to display the Wave Setting menu.
Selecting Whether to Interpolate the Display
3.
Press the Interpolate soft key to select
ESC
9-16
or
.
ESC
IM 760101-01E
9.7 Interpolating the Display and Changing the Graticule
Changing the Graticule
3.
Press the Graticule soft key to select
,
, or
.
ESC
Explanation
Selecting Whether to Interpolate the Display
When there are less than 500 points of sampled data on the time axis, the area
between the display points (rasters) is no longer continuous. This function
interpolates between the points to display the waveforms. You can select from the
following list of choices.
•
: No interpolation is performed.
• When there are 500 points or more of sampled data
9
Waveform Display
• When there are less than 500 points of sampled data
•
: Linearly interpolates between two points.
• When there are 500 points or more of sampled data
Connects the dots vertically.
• When there are less than 500 points of sampled data
IM 760101-01E
9-17
9.7 Interpolating the Display and Changing the Graticule
Changing the Graticule
Select the grid or cross scale to display on the screen from the following list of
choices.
9-18
•
: Grid display
•
: No grid or cross scale display
•
: Cross scale display
IM 760101-01E
9.8
Turning ON/OFF the Scale Value and
Waveform Label
«For a functional description, see section 1.7.»
Keys
SELE
CT
SET
RE
DISPLAY
HOLD
UP DATE
RATE
FILE
SINGLE
ESC
TRIG'D
WAVE
STORE
COPY
STORE SET
MENU
REMOTE
HARMONICS
CURSOR
LOCAL
MAX HOLD
MISC
NULL
SHIFT
To exit the menu during operation, press ESC.
INPUT
RANGE
SCALING
WIRING
AVG
MEASURE
MOTOR SET
FILTER
CAL
INTEGRATOR
START
STOP
INTEG SET
RESET
SYNC SRC
Procedure
The retrieval of waveform display data must be turned ON to display
waveforms. For the procedure, see section 9.1.
9
Press DISPLAY to display the Display menu.
Check that Format (display format) is set to Wave, Numeric+Wave, Wave+Bar,
or Wave+Trend. For details on setting the display format, see section 4.2.
2.
Press the Wave Setting soft key to display the Wave Setting menu.
Turning ON/OFF the Scale Value Display
3.
Press the Scale Value soft key to select ON or OFF.
Turning ON/OFF the Waveform Label
3.
Press the Trace Label soft key to select ON or OFF.
ESC
IM 760101-01E
ESC
ESC
9-19
Waveform Display
1.
9.8 Turning ON/OFF the Scale Value and Waveform Label
Explanation
Turning ON/OFF the Scale Value Display
You can select whether or not to display (ON/OFF) the upper and lower limits of the
vertical axis and the values at the left and right ends of the horizontal axis (time axis,
see section 9.2) of each channel.
• ON
Displays the scale values.
• OFF
Does not display the scale values.
Turning ON/OFF the Label Display
Select whether to display the waveform label name (input signal name).
• ON
Displays the label name.
• OFF
Does not display the label name.
Upper limit
Waveform label
Lower limit
Time at the right end of the screen
Time at the left end of the screen
9-20
IM 760101-01E
9.9
Performing Cursor Measurements
«For a functional description, see section 1.7.»
Keys
SELE
CT
SET
RE
DISPLAY
HOLD
UP DATE
RATE
FILE
SINGLE
ESC
TRIG'D
WAVE
STORE
COPY
STORE SET
MENU
REMOTE
HARMONICS
CURSOR
LOCAL
MAX HOLD
MISC
NULL
SHIFT
To exit the menu during operation, press ESC.
INPUT
RANGE
SCALING
WIRING
AVG
MEASURE
MOTOR SET
FILTER
CAL
INTEGRATOR
START
STOP
INTEG SET
RESET
SYNC SRC
Procedure
The retrieval of waveform display data must be turned ON to display
waveforms. For the procedure, see section 9.1.
2.
Press DISPLAY to display the Display menu.
Check that Format (display format) is set to Wave, Numeric+Wave, Wave+Bar,
or Wave+Trend. For details on setting the display format, see section 4.2.
Press SHIFT+WAVE (CURSOR) to display the Cursor menu.
Turning ON/OFF Cursor Measurement
3.
Press the Wave Cursor soft key to select ON or OFF.
If ON is selected, the result of the cursor measurement is displayed.
ESC
IM 760101-01E
ESC
9-21
Waveform Display
1.
9
9.9 Performing Cursor Measurements
Selecting the Target Waveform for Cursor Measurement
• Selecting the target waveform for cursor +
4.
Press the WaveC1 Trace soft key to display the target waveform selection box.
5.
Turn the jog shuttle to select any of the signals starting with U1.
6.
Press SELECT to confirm the new target waveform.
• Selecting the target waveform for cursor x
4.
Press the WaveC2 Trace soft key to display the target waveform selection box.
5.
Turn the jog shuttle to select any of the signals starting with U1.
6.
Press SELECT to confirm the new target waveform.
Selecting the Movement Path of the Cursor
7.
Press the Cursor Path soft key to display the Cursor Path menu.
8.
Press one of the soft keys from Max to Mid to select the movement path.
Moving the Cursor
9.
Press the Wave C1 +/Wave C2 x soft key to set the jog shuttle target to Wave
C1 +, Wave C2 x, or both Wave C1 + and Wave C2 x.
•
•
•
10.
If you select Wave C1 +, the position of cursor + can be moved.
If you select Wave C2 x, the position of cursor x can be moved.
If you select both Wave C1 + and Wave C2 x, the two cursors can be moved without
changing the spacing between the two. The value of the digit being specified by Wave
C1 + changes.
Turn the jog shuttle to move the cursor.
For the procedures on how to enter values using the jog shuttle, see section 3.12,
“Entering Values and Strings.”
ESC
9-22
ESC
ESC
ESC
ESC
IM 760101-01E
9.9 Performing Cursor Measurements
Explanation
ON/OFF
A cursor can be placed on the displayed waveform to measure and display the value
at that point. It can be used to measure the voltage and current of various sections of
the waveform and the data on the horizontal axis (X-axis).
• ON: Performs cursor measurement.
• OFF: Does not perform cursor measurement.
Measurement Target
Select the target waveform for the cursor measurement from the following list of
choices. The selectable items vary depending on the installed elements.
U1, I1, U2, I2, U3, I3, U4, I4, U5, I5, U6, I6, Speed*, and Torque*
*
Applicable only on models with the motor evaluation function (option). However, during
harmonic measurement, they do not appear.
Measurement Item
• Y+: Vertical value of cursor + (Y-axis value)
• Yx: Vertical value of cursor x (Y-axis value)
• ∆Y: The difference between the Y-axis values of cursor + and cursor x
• X+: X-axis value of cursor + from the left end of the screen
• Xx: X-axis value of cursor x from the left end of the screen
• ∆X: The difference between the X-axis values of cursor + and cursor x
• 1/∆X: The inverse of the difference between the X-axis values of cursor + and
cursor x
9
Cursor Movement
• Cursors move on the selected waveform.
• The range of movement of cursors is from the left end to the right end of the screen.
• The movement step of cursors is as follows.
• For normal measurement, the step is equal to (time corresponding to one
screen) ÷ 500.
• For harmonic measurement, the step is 1 point.
Note
•
•
•
IM 760101-01E
If unmeasurable data exists, “***” is displayed in the measured value display area.
∆Y is measured even if the unit is different. The result has no unit in this case.
If the crest factor is set to 3, the allowed range of cursor measurement vertically is ±300% of
the range. However, for 1000 V range, the range is within ±200%. If the crest factor is set to
6, it is ±600% of the range. However, for 500 V range, the range is within ±400%.
9-23
Waveform Display
Movement Path of the Cursor
Since the WT1600 P-P compresses the sampled data (see section 1.7), two data
points, maximum and minimum values, are displayed at the same time axis position.
This specifies where the cursor is to move.
• Max
Moves along the maximum values on the time axis and measures the value at
each point.
• Min
Moves along the minimum values on the time axis and measures the value at each
point.
• Mid
Moves along the middle of the maximum and minimum values on the time axis and
measures the value at each point.
Chapter 10 Trend Display
10.1 Retrieving Trend Display Data
«For a functional description, see section 1.8.»
Keys
SELE
CT
SET
RE
DISPLAY
HOLD
UP DATE
RATE
FILE
SINGLE
ESC
TRIG'D
WAVE
STORE
COPY
STORE SET
MENU
REMOTE
HARMONICS
CURSOR
LOCAL
MAX HOLD
MISC
NULL
SHIFT
To exit the menu during operation, press ESC.
INPUT
RANGE
SCALING
WIRING
AVG
MEASURE
MOTOR SET
FILTER
CAL
INTEGRATOR
START
STOP
INTEG SET
RESET
SYNC SRC
Procedure
1.
Press DISPLAY to display the Display menu.
Check that Format (display format) is set to Trend, Numeric+Trend,
Wave+Trend, or Bar+Trend. For details on setting the display format, see
section 4.5.
2.
Press the Trend Setting soft key to display the Trend Setting menu.
10
ESC
ESC
Explanation
The retrieval of trend display data must be turned ON to display trends. The numerical
data of the measurement function is P-P compressed* and stored to the memory as
trend display data.
*
P-P compression is performed when there are more than two points of data at a single
display segment.
• ON
The retrieval of trend waveform data starts.
• OFF
Trend display data is not retrieved.
IM 760101-01E
10-1
Trend Display
Selecting Whether to Retrieve Trend Data (ON/OFF)
3.
Press the Trend Sampling soft key to select ON or OFF. If ON is selected, the
retrieval of trend waveform data starts.
10.2 Selecting the Trend Display Target
«For a functional description, see section 1.8.»
Keys
SELE
CT
SET
RE
DISPLAY
HOLD
UP DATE
RATE
FILE
SINGLE
ESC
TRIG'D
WAVE
STORE
COPY
STORE SET
MENU
REMOTE
HARMONICS
CURSOR
LOCAL
MAX HOLD
MISC
NULL
SHIFT
To exit the menu during operation, press ESC.
INPUT
RANGE
SCALING
WIRING
AVG
MEASURE
MOTOR SET
FILTER
CAL
INTEGRATOR
START
STOP
INTEG SET
RESET
SYNC SRC
Procedure
1.
Press DISPLAY to display the Display menu.
Check that Format (display format) is set to Trend, Numeric+Trend,
Wave+Trend, or Bar+Trend. For details on setting the display format, see
section 4.5.
The following procedures are given for a representative example in which the
display format is set to Trend.
2.
3.
Press the Trend Setting soft key to display the Trend Setting menu.
Press the Trend Disp Items soft key to display the Trend Items menu.
During normal measurement
ESC
10-2
ESC
During harmonic measurement
ESC
IM 760101-01E
10.2 Selecting the Trend Display Target
During Normal Measurement
Selecting the Item to Be Set
4.
Turn the jog shuttle to select T1 to T16.
Selecting the Measurement Function
5.
Press the Function soft key to display the measurement function selection box.
6.
Turn the jog shuttle to select any of the measurement function starting with
None.
7.
Press SELECT to confirm.
Selecting the Element/Wiring Unit
8.
Press the Element soft key to display the element/wiring unit selection box.
9.
Turn the jog shuttle to select any of the elements/wiring units starting with
Element1.
10. Press SELECT to confirm.
ESC
ESC
ESC
10
Trend Display
IM 760101-01E
10-3
10.2 Selecting the Trend Display Target
During Harmonic Measurement
Selecting the Item to Be Set
4.
Press the Trend Object soft key.
5.
Turn the jog shuttle to select T1 to T16.
Selecting the Measurement Function
6.
Press the Function soft key to display the measurement function selection box.
7.
Turn the jog shuttle to select any of the measurement function starting with
None.
8.
Press SELECT to confirm.
Selecting the Element/Wiring Unit
9.
Press the Element soft key to display the element/wiring unit selection box.
10. Turn the jog shuttle to select any of the elements/wiring units starting with
Element1.
11. Press SELECT to confirm.
Selecting the Harmonic Order
12. Press the Order soft key.
13. Turn the jog shuttle to select the order from Total and 0 to the maximum
harmonic order (see section 7.5).
ESC
10-4
ESC
ESC
ESC
IM 760101-01E
10.2 Selecting the Trend Display Target
Explanation
Set the item to be shown on the trend display. You can set 16 lines of trends, trend 1
(T1) through trend 16 (T16).
During Normal Measurement
Selecting the Measurement Function
• The types of measurement functions that can be selected are the items that are
indicated in “Measurement Function Types during Normal Measurement” and
“Measurement Function Types for Motor Evaluation Function (Option)” in section
1.2; “Delta Computation,” “User-Defined Function,” and “Corrected Power” in
section 1.5; and “Measurement Functions of Integration” in section 1.6.
• You can also select not to display the measurement functions (None).
• If you selected measurement functions of delta computation, the meanings of the
elements described in the next section are different from when other measurement
functions are selected. For details, see the explanation in section 6.1.
Selecting the Element/Wiring Unit
• You can select the element/wiring unit from the following list of choices. The
selectable items vary depending on the installed elements.
Element1, Element2, Element3, Element4, Element5, Element6, ΣA, ΣB, and ΣC
• If there are no elements that are assigned to the selected wiring unit, there is no
numerical data. Thus, the trend is not displayed in this case. For example, if
elements are assigned to ΣA and ΣB and no elements are assigned to ΣC, then the
trend at the measurement function for ΣC is not displayed.
During Harmonic Measurement
Note
•
•
•
•
•
IM 760101-01E
For the meanings of the measurement function symbols that are displayed, see section 1.2,
“Measurement Functions and Measurement Periods,” 1.5, “Computation,” 1.6, “Integration,”
appendix 1, “Symbols and Determination of Measurement Functions,” and appendix 2,
“Determination of Delta Computation.”
For details on the wiring units expressed as ΣA, ΣB, and ΣC, see section 5.1, “Selecting the
Wiring System.”
The trend is not displayed in places where the measurement function is not selected or where
numerical data is not present.
The harmonic order can be set to total or from dc (0th order) up to 100th order. However, the data
determined by the harmonic measurement is the numerical data from the minimum harmonic order to
be analyzed as specified in section 7.5 (Min Order) to the maximum order to be analyzed (see
section 17.6) that is automatically determined by the frequency of the PLL source.
If you change the item for which the trend is displayed, only the modified trend is cleared, and
the new trend is displayed from the cleared point (position).
10-5
10
Trend Display
Selecting the Measurement Function
• The types of measurement functions that can be selected are indicated in
“Measurement Function Types for Harmonic Measurement” in section 1.2 and
“User-Defined Functions” in section 1.5.
• You can also select not to display the measurement functions (None).
Selecting the Element/Wiring Unit
• You can select the element/wiring unit from the following list of choices. The
selectable items vary depending on the installed elements.
Element1, Element2, Element3, Element4, Element5, Element6, ΣA, ΣB, and ΣC
• If the selected wiring unit is not a harmonic measurement target, there is no
numerical data. Thus, the trend is not displayed in this case. For example, if the
measurement target is ΣA, the trend at the measurement function of ΣC is not
displayed. For selecting the measurement target, see section 7.3.
Changing the Harmonic Order
The harmonic order can be set to total or from dc (0th order) up to 100th order.
10.3 Turning ON/OFF the Trend Display
Keys
SELE
CT
SET
RE
DISPLAY
HOLD
UP DATE
RATE
FILE
SINGLE
ESC
TRIG'D
WAVE
CURSOR
STORE
COPY
STORE SET
MENU
REMOTE
HARMONICS
LOCAL
MAX HOLD
MISC
NULL
SHIFT
To exit the menu during operation, press ESC.
INPUT
RANGE
SCALING
WIRING
AVG
MEASURE
MOTOR SET
FILTER
CAL
INTEGRATOR
START
STOP
INTEG SET
RESET
SYNC SRC
Procedure
The retrieval of trend display data must be turned ON to display trends. For the
procedure, see section 10.1.
1.
Press DISPLAY to display the Display menu.
Check that Format (display format) is set to Trend, Numeric+Trend,
Wave+Trend, or Bar+Trend. For details on setting the display format, see
section 4.5.
The following procedures are given for a representative example in which the
display format is set to Trend.
2.
Press the Trend Setting soft key to display the Trend Setting menu.
ESC
10-6
IM 760101-01E
10.3 Turning ON/OFF the Trend Display
3.
Press the Trend Display soft key to display the Trend Display dialog box.
Turning ON/OFF the Trend Display at Once
• Turning ON the display of all trends at once
4.
Turn the jog shuttle to select All ON.
5.
Press SELECT. All the buttons to the left of the trend symbols are highlighted.
In addition, if the retrieval of the trend display data (see section 10.1) is ON, the
trends are displayed.
• Turning OFF the display of all trends at once
4.
Turn the jog shuttle to select All OFF.
5.
Press SELECT. The highlighting of all the buttons to the left of the trend
symbols is cleared and the trends are no longer displayed.
Turning ON/OFF the Trend One at a Time
4.
Turn the jog shuttle to select the desired trend symbol.
5.
Press SELECT. If the retrieval of the trend display data (see section 10.1) is
ON and the button to the left of the selected trend symbol is highlighted, the
corresponding trend is displayed. If the highlighting of the button is cleared, the
trend is no longer displayed.
ESC
10
Trend Display
Explanation
You can turn ON/OFF the 16 lines of trends, trend 1 (T1) through trend 16 (T16).
The trend display varies depending on the time axis (T/div) setting of section 10.5. For
example, if T/div is 3 s and the data update rate is set to 50 ms, the trend display is
updated every second. If T/div is 1 day and the data update rate is set to 50 ms, the
trend display is updated every 1728 s.
IM 760101-01E
10-7
10.4 Splitting the Screen and Displaying Trends
«For a functional description, see section 1.8.»
Keys
SELE
CT
SET
RE
DISPLAY
HOLD
UP DATE
RATE
FILE
SINGLE
ESC
TRIG'D
WAVE
STORE
COPY
STORE SET
MENU
REMOTE
HARMONICS
CURSOR
LOCAL
MAX HOLD
MISC
NULL
SHIFT
To exit the menu during operation, press ESC.
INPUT
RANGE
SCALING
WIRING
AVG
MEASURE
MOTOR SET
FILTER
CAL
INTEGRATOR
START
STOP
INTEG SET
RESET
SYNC SRC
Procedure
The retrieval of trend display data must be turned ON to display trends. For the
procedure, see section 10.1.
1.
Press DISPLAY to display the Display menu.
Check that Format (display format) is set to Trend, Numeric+Trend,
Wave+Trend, or Bar+Trend. For details on setting the display format, see
section 4.5.
The following procedures are given for a representative example in which the
display format is set to Trend.
2.
3.
4.
Press the Trend Setting soft key to display the Trend Setting menu.
Press the Trend Format soft key to display the Format menu.
Press one of the keys from Single to Quad to select the number of windows.
ESC
10-8
ESC
ESC
IM 760101-01E
10.4 Splitting the Screen and Displaying Trends
Explanation
The screen can be evenly divided and the trends can be mapped to the divided windows.
Selecting the Number of Windows
Same as the waveform display (section 9.6).
Waveform Mapping
The trends that are turned ON (see section 10.3) are mapped in order according to
the trend number (T1 to T16) to the divided windows. This corresponds to the “Auto”
setting for the waveform display.
10
Trend Display
IM 760101-01E
10-9
10.5 Setting the Time Axis
«For a functional description, see section 1.8.»
Keys
SELE
CT
SET
RE
DISPLAY
HOLD
UP DATE
RATE
FILE
SINGLE
ESC
TRIG'D
WAVE
CURSOR
STORE
COPY
STORE SET
MENU
REMOTE
HARMONICS
LOCAL
MAX HOLD
MISC
NULL
SHIFT
To exit the menu during operation, press ESC.
INPUT
RANGE
SCALING
WIRING
AVG
MEASURE
MOTOR SET
FILTER
CAL
INTEGRATOR
START
STOP
INTEG SET
RESET
SYNC SRC
Procedure
The retrieval of trend display data must be turned ON to display trends. For the
procedure, see section 10.1.
1.
Press DISPLAY to display the Display menu.
Check that Format (display format) is set to Trend, Numeric+Trend,
Wave+Trend, or Bar+Trend. For details on setting the display format, see
section 4.5.
The following procedures are given for a representative example in which the
display format is set to Trend.
2.
Press the Trend Setting soft key to display the Trend Setting menu.
ESC
10-10
IM 760101-01E
10.5 Setting the Time Axis
During Normal Measurement When the Retrieval of Waveform Display Data
(see section 9.1) Is OFF
3.
Turn the jog shuttle to set the time axis. When the display of scale values is
turned ON (see section 9.8), the time at the left end and the right end of the
screen are displayed at the lower left corner (fixed to 0 s) and lower right corner
of the screen, respectively.
During Normal Measurement When the Retrieval of Waveform Display Data Is ON
3.
Turn the jog shuttle to set the time axis (horizontal axis). When the display of
scale values is turned ON, the data point number at the left end (fixed to 0) and
the right end of the screen are displayed at the lower left corner and lower right
corner of the screen, respectively.
During Harmonic Measurement
3.
Turn the jog shuttle to set the time axis (horizontal axis). When the display of
scale values is turned ON, the data point number at the left end (fixed to 0) and
the right end of the screen are displayed at the lower left corner and lower right
corner of the screen, respectively.
During normal measurement
ESC
During harmonic measurement
ESC
10
Trend Display
Explanation
During Normal Measurement When the Retrieval of Waveform Display Data
(see section 9.1) Is OFF
Set the time axis in terms of T/div (time per grid).
Set the time per division in the range of 3 s to 1 day.
During Normal Measurement When the Retrieval of Waveform Display Data Is ON
Set the time axis (horizontal axis) in terms of P/div (points per grid).
Set the number of data points per division in the range of 1 to 500.
During Harmonic Measurement
Set the time axis (horizontal axis) in terms of P/div (points per grid).
Set the number of data points per division in the range of 1 to 500.
Note
If the time axis is changed, the retrieval of trend waveform data restarts. The trend display up
to that point is cleared and the trend starts from the left end of the screen.
IM 760101-01E
10-11
10.6 Setting the Scale
Keys
SELE
CT
SET
RE
DISPLAY
HOLD
UP DATE
RATE
FILE
SINGLE
ESC
TRIG'D
WAVE
STORE
COPY
STORE SET
MENU
REMOTE
HARMONICS
CURSOR
LOCAL
MAX HOLD
MISC
NULL
SHIFT
To exit the menu during operation, press ESC.
INPUT
RANGE
SCALING
WIRING
AVG
MEASURE
MOTOR SET
FILTER
CAL
INTEGRATOR
START
STOP
INTEG SET
RESET
SYNC SRC
Procedure
The retrieval of trend display data must be turned ON to display trends. For the
procedure, see section 10.1.
1.
Press DISPLAY to display the Display menu.
Check that Format (display format) is set to Trend, Numeric+Trend,
Wave+Trend, or Bar+Trend. For details on setting the display format, see
section 4.5.
The following procedures are given for a representative example in which the
display format is set to Trend.
2.
3.
Press the Trend Setting soft key to display the Trend Setting menu.
Press the Trend Scale soft key to display the Trend Scale menu.
ESC
10-12
ESC
IM 760101-01E
10.6 Setting the Scale
Selecting the Target Trend to Be Scaled
4.
Press the Trend Object soft key.
5.
Turn the jog shuttle to select T1 to T16.
Selecting Auto Scaling or Manual Scaling
6.
Press the Scaling soft key to select Auto or Manual.
Setting the Upper Limit during Manual Scaling
7.
Press the Upper Scale soft key.
8.
Turn the jog shuttle to set the upper limit.
For the procedures on how to enter values using the jog shuttle, see section 3.12,
“Entering Values and Strings.”
Setting the Lower Limit during Manual Scaling
7.
Press the Lower Scale soft key.
8.
Turn the jog shuttle to set the lower limit.
For the procedures on how to enter values using the jog shuttle, see section 3.12,
“Entering Values and Strings.”
ESC
ESC
ESC
ESC
10
Setting the Scale
Set the upper and lower limits of the display frame when displaying the trend. You
can select the scaling method from the following list of choices.
• Auto
Set to auto scaling. The upper and lower limits on the screen display are
automatically determined from the maximum and minimum values of the trend
display data.
• Manual
Set to manual scaling. The upper and lower limits can be set arbitrary as
necessary.
Setting the Upper and Lower Limits during Manual Scaling
You can set the limits in the range of –9.9999E+30 to 9.9999E+30.
Note
The setting in section 9.8 determines whether the upper and lower limits and labels are
displayed.
IM 760101-01E
10-13
Trend Display
Explanation
10.7 Performing Cursor Measurements
«For a functional description, see section 1.7.»
Keys
SELE
CT
SET
RE
DISPLAY
HOLD
UP DATE
RATE
FILE
SINGLE
ESC
TRIG'D
WAVE
STORE
COPY
STORE SET
MENU
REMOTE
HARMONICS
LOCAL
CURSOR
MAX HOLD
MISC
NULL
SHIFT
To exit the menu during operation, press ESC.
INPUT
RANGE
SCALING
WIRING
AVG
MEASURE
MOTOR SET
FILTER
CAL
INTEGRATOR
START
STOP
INTEG SET
RESET
SYNC SRC
Procedure
The retrieval of trend display data must be turned ON to display trends. For the
procedure, see section 10.1.
1.
2.
Press DISPLAY to display the Display menu.
Check that Format (display format) is set to Trend, Numeric+Trend,
Wave+Trend, or Bar+Trend. For details on setting the display format, see
section 4.5.
Press SHIFT+WAVE (CURSOR) to display the Cursor menu.
Turning ON/OFF Cursor Measurement
3.
Press the Trend Cursor soft key to select ON or OFF.
If ON is selected, the result of the cursor measurement is displayed.
ESC
10-14
ESC
IM 760101-01E
10.7 Performing Cursor Measurements
Selecting the Target Trend for Cursor Measurement
• Selecting the target trend for cursor +
4.
Press the TrendC1 Trace soft key to display the target trend selection box.
5.
Turn the jog shuttle to select T1 to T16.
6.
Press SELECT to confirm the new target trend.
• Selecting the target trend for cursor x
4.
Press the TrendC2 Trace soft key to display the target trend selection box.
5.
Turn the jog shuttle to select T1 to T16.
6.
Press SELECT to confirm the new target trend.
Moving the Cursor
7.
Press the Trend C1 +/Trend C2 x soft key to set the jog shuttle target to Trend
C1 +, Trend C2 x, or both Trend C1 + and Trend C2 x.
•
•
•
8.
If you select Trend C1 +, the position of cursor + can be moved.
If you select Trend C2 x, the position of cursor x can be moved.
If you select both Trend C1 + and Trend C2 x, the two cursors can be moved without
changing the spacing between the two. The value of the digit being specified by Trend
C1 + changes.
Turn the jog shuttle to move the cursor.
For the procedures on how to enter values using the jog shuttle, see section 3.12,
“Entering Values and Strings.”
ESC
ESC
ESC
10
Trend Display
IM 760101-01E
10-15
10.7 Performing Cursor Measurements
Explanation
ON/OFF
A cursor can be placed on the displayed trend to measure and display the value at
that point. It can be used to measure the data on the vertical axis (Y-axis) and
horizontal axis (X-axis) of various sections of the trend.
• ON: Performs cursor measurement.
• OFF: Does not perform cursor measurement.
Measurement Target
Select the target trend for the cursor measurement from T1 to T16.
Measured Items
• Y+: Vertical value of cursor + (Y-axis value)
• Yx: Vertical value of cursor x (Y-axis value)
• ∆Y: The difference between the Y-axis values of cursor + and cursor x
• X+: X-axis value of cursor + from the left end of the screen
• During normal measurement (retrieval of waveform display data ON, see section
9.1).
Indicates the position of cursor + in terms of data points from the left end of the
screen with the left end of the screen taken to be the 0 point.
• During normal measurement (retrieval of waveform display data OFF)
Indicates the relative time of cursor + from the left end of the screen with the left
end of the screen taken to be 0 s. The numerical value on the menu indicates
the position of cursor + in terms of data points from the left end of the screen
with the left end of the screen taken to be the 0 point.
• During Harmonic Measurement
Indicates the position of cursor + in terms of data points from the left end of the
screen with the left end of the screen taken to be the 0 point.
• Xx: X-axis value of cursor x from the left end of the screen
• During normal measurement (retrieval of waveform display data ON)
Indicates the position of cursor x in terms of data points from the left end of the
screen with the left end of the screen taken to be the 0 point.
• During normal measurement (retrieval of waveform display data OFF)
Indicates the relative time of cursor x from the left end of the screen with the left
end taken to be 0 s. The numerical value on the menu indicates the position of
cursor x in terms of data points from the left end of the screen with the left end
of the screen taken to be the 0 point.
• During Harmonic Measurement
Indicates the position of cursor x in terms of data points from the left end of the
screen with the left end of the screen taken to be the 0 point.
• ∆X: The difference between the X-axis values of cursor + and cursor x
• D+: Data and time at the cursor + position
• During normal measurement (retrieval of waveform display data OFF)
Indicates the date and time (year/month/date hour:minute:second) of
measurement.
• During harmonic measurement and normal measurement (retrieval of waveform
display data ON)
Not displayed.
10-16
IM 760101-01E
10.7 Performing Cursor Measurements
• Dx: Date and time of cursor x position
• During normal measurement (retrieval of waveform display data OFF)
Indicates the date and time (year/month/date hour:minute:second) of
measurement.
• During harmonic measurement and normal measurement (retrieval of waveform
display data ON)
Not displayed.
Cursor Movement
• Cursors move on the selected trend.
• The range of movement of cursors is from the left end to the right end of the
screen.
• The cursors moves along the data points displayed on the screen one point at a
time.
Note
•
•
If unmeasurable data exists, “***” is displayed in the measured value display area.
∆Y is measured even if the unit is different. The result has no unit in this case.
10
Trend Display
IM 760101-01E
10-17
10.8 Restarting the Trend
Keys
SELE
CT
SET
RE
DISPLAY
HOLD
UP DATE
RATE
FILE
SINGLE
ESC
TRIG'D
WAVE
STORE
COPY
STORE SET
MENU
REMOTE
HARMONICS
CURSOR
LOCAL
MAX HOLD
MISC
NULL
SHIFT
To exit the menu during operation, press ESC.
INPUT
RANGE
SCALING
WIRING
AVG
MEASURE
MOTOR SET
FILTER
CAL
INTEGRATOR
START
STOP
INTEG SET
RESET
SYNC SRC
Procedure
The retrieval of trend display data must be turned ON to display trends. For the
procedure, see section 10.1.
1.
Press DISPLAY to display the Display menu.
Check that Format (display format) is set to Trend, Numeric+Trend,
Wave+Trend, or Bar+Trend. For details on setting the display format, see
section 4.5.
The following procedures are given for a representative example in which the
display format is set to Trend.
2.
3.
Press the Trend Setting soft key to display the Trend Setting menu.
Press the Restart Trend Exec soft key to restart the trend.
ESC
10-18
ESC
IM 760101-01E
10.8 Restarting the Trend
Explanation
When the trend is restarted, the trend up to that point is cleared.
In addition to pressing the Restart Trend Exec soft key, the following operations cause
the trend to be restarted.
• Changing the data update rate
• Changing the time axis setting of the trend
• Turning ON/OFF the harmonic measurement mode
• Turning ON/OFF the retrieval of waveform display data
• Turning ON/OFF the retrieval of trend data
Note
If you change the item for which the trend is displayed (see section 10.2), only the modified
trend is cleared, and the new trend is displayed from the cleared point (position).
10
Trend Display
IM 760101-01E
10-19
Chapter 11 Storing and Recalling Data and Saving the Stored Data
11.1 Setting the Store Mode
Keys
SELE
CT
SET
RE
DISPLAY
HOLD
UP DATE
RATE
FILE
SINGLE
ESC
TRIG'D
WAVE
STORE
COPY
STORE SET
MENU
REMOTE
LOCAL
HARMONICS
CURSOR
MAX HOLD
MISC
NULL
SHIFT
To exit the menu during operation, press ESC.
INPUT
RANGE
SCALING
WIRING
AVG
MEASURE
MOTOR SET
FILTER
CAL
INTEGRATOR
START
STOP
INTEG SET
RESET
SYNC SRC
Procedure
1.
2.
3.
4.
5.
ESC
Press SHIFT+STORE (STORE SET) to display the Store Set dialog box.
Press the Mode soft key to select Store.
Press the Store Setting soft key to display the Store Setting dialog box.
Press the Mode soft key to display the Mode menu.
Press one of Manual to Integ Sync soft keys to select the store mode.
ESC
ESC
ESC
11
Storing and Recalling Data and Saving the Stored Data
IM 760101-01E
11-1
11.1 Setting the Store Mode
Explanation
To store data, parameters such as the store mode, the store count, the store interval,
and the store reservation time must be specified before executing the operation. This
section explains the store mode. For the procedure on how to set the store count, the
store interval, and the store reservation time, see section 11.2; for the procedure on how
to start the store operation, see section 11.4.
Store Mode
You can select the timing used to start or end the store operation from the following
list of choices.
• Manual
This is the manual mode. When you press STORE, the numerical data or
waveform display data can be stored at the specified store interval for the specified
store counts.
• Real Time
This is the real-time mode. When you press STORE, the numerical data or
waveform display data can be stored from the specified reservation time for starting
the store operation at the specified store interval for the specified store counts (or
until the reservation time for ending the store operation).
• Integ Sync
• This is the integration synchronization mode. When you press STORE, the
numerical data or waveform display data can be stored when the integration
starts at the specified store interval for the specified store counts (or until the
integration is stopped).
• By setting the time of the integration timer (see section 6.8 or 6.9) to an integer
multiple of the store interval, the integrated values at integration start and
integration stop that are repeated according to the time setting of the integration
timer can be stored.
11-2
IM 760101-01E
11.2 Setting the Store Count, the Store Interval, and
the Store Reservation Time
Keys
SELE
CT
SET
RE
DISPLAY
HOLD
UP DATE
RATE
FILE
SINGLE
ESC
TRIG'D
WAVE
STORE
COPY
STORE SET
MENU
REMOTE
LOCAL
HARMONICS
CURSOR
MAX HOLD
MISC
NULL
SHIFT
To exit the menu during operation, press ESC.
INPUT
RANGE
SCALING
WIRING
AVG
MEASURE
MOTOR SET
FILTER
CAL
INTEGRATOR
START
STOP
INTEG SET
RESET
SYNC SRC
Procedure
1.
2.
3.
Press SHIFT+STORE (STORE SET) to display the Store Set dialog box.
Press the Mode soft key to select Store.
Press the Store Setting soft key to display the Store Setting dialog box.
Setting the Store Count
4.
Turn the jog shuttle to set the store count.
For the procedures on how to enter values using the jog shuttle, see section 3.12,
“Entering Values and Strings.”
8.
9.
ESC
IM 760101-01E
Press SELECT or ESC to close the box.
Repeat steps 5 to 8 to set hour, minute, and second.
ESC
ESC
ESC
11-3
11
Storing and Recalling Data and Saving the Stored Data
Setting the Store Interval
4.
Press the Interval Setting soft key to display the Interval Setting dialog box.
5.
Turn the jog shuttle to select one of the hour, minute, and second boxes.
6.
Press SELECT. A box used to set the time appears.
7.
Turn the jog shuttle to set the hour, minute, or second that you selected in step 5.
11.2 Setting the Store Count, the Store Interval, and the Store Reservation Time
Setting the Store Reservation Time
4.
Press the Mode soft key to display the Mode menu.
5.
Press the Real Time soft key to select the real-time mode. The store
reservation time menu appears.
6.
Press the Real Time Control soft key to display the Real Time Control dialog
box.
7.
Turn the jog shuttle to select one of the reservation year, month, date, hour,
minute, and second boxes for specifying when the store operation will start
(Store Start).
8.
Press SELECT. A box used to set the time appears.
9.
Turn the jog shuttle to set the year, month, date, hour, minute, or second that
you selected in step 7.
For the procedures on how to enter values using the jog shuttle, see section 3.12,
“Entering Values and Strings.”
10.
11.
12.
13.
ESC
11-4
Press SELECT or ESC to close the box.
Repeat steps 7 to 10 to set the year, month, date, hour, minute, and second.
Turn the jog shuttle to select one of the reservation year, month, date, hour,
minute, and second boxes for specifying when the store operation will end
(Store End).
Repeat steps 8 to 11 to set the year, month, date, hour, minute, and second.
ESC
ESC
IM 760101-01E
11.2 Setting the Store Count, the Store Interval, and the Store Reservation Time
Explanation
To store data, parameters such as the store mode, the store count, the store interval,
and the store reservation time must be specified before executing the operation. This
section explains the store count, the store interval, and the store reservation time. For
the procedure on how to set the store mode, see section 11.1; for the procedure on how
to start the store operation, see section 11.4.
Setting the Store Count
• Set the store count in the range from 1 to 999999.
• If the data being stored exceeds the internal memory size (approximately 12 MB, or
approximately 11 MB when using a WT1600 with ROM version 2.01 or later) of the
store destination, the store operation stops before reaching the specified store
count.
Setting the Store Interval
Set the interval at which the data is to be stored.
• Set the interval in units of hour : minute : second in the following range. If the
interval is set to 00:00:00, the data is stored in sync with the updating of the
numerical data or waveform display data.
00 : 00 : 00 to 99 : 59 : 59
• By setting the time of the integration timer (see section 6.8 or 6.9) to an integer
multiple of the store interval, the integrated values at integration start and
integration stop that are repeated according to the time setting of the integration
timer can be stored.
Note
•
•
IM 760101-01E
The reservation time allows up to 31 days to be specified for February. If an erroneous date
is specified, an error message is displayed at the time of execution of the store operation
(section 11.4). Reset the reservation time in this case.
Leap years are recognized at the time of execution of the store operation.
11-5
11
Storing and Recalling Data and Saving the Stored Data
Setting the Store Reservation Time
• The reservation time is set in units of year : month : date, hour : minute : second.
• Set the hour : minute : second in the following range.
00 : 00 : 00 to 23 : 59 : 59
• Make sure the reservation time for stopping the store operation is after the
reservation time for starting the store operation.
11.3 Setting the Numerical Data and Waveform
Display Data to Be Stored
Keys
SELE
CT
SET
RE
DISPLAY
HOLD
UP DATE
RATE
FILE
SINGLE
ESC
TRIG'D
WAVE
STORE
COPY
STORE SET
MENU
REMOTE
HARMONICS
CURSOR
LOCAL
MAX HOLD
MISC
NULL
SHIFT
To exit the menu during operation, press ESC.
INPUT
RANGE
SCALING
WIRING
AVG
MEASURE
MOTOR SET
FILTER
CAL
INTEGRATOR
START
STOP
INTEG SET
RESET
SYNC SRC
Procedure
1.
2.
3.
Press SHIFT+STORE (STORE SET) to display the Store Set dialog box.
Press the Mode soft key to select Store.
Press the Store Setting soft key to display the Store Setting dialog box.
Selecting the Stored Item
4.
Press the Store Item soft key to display the Store Item dialog box.
5.
Press one of the soft keys from Numeric to Numeric+Wave to select the stored
item.
•
•
•
If you select Numeric, the stored item is the numerical data.
If you select Wave, the stored item is the waveform display data.
If you select Numeric+Wave, the stored item is both the numerical data and the
waveform display data.
ESC
11-6
ESC
ESC
IM 760101-01E
11.3 Setting the Numerical Data and Waveform Display Data to Be Stored
Selecting the Numerical Data to Be Stored
(This operation is valid if the stored item was set to Numeric or Numeric+Wave in step 5.)
6.
Press the List Item soft key to display the List Item dialog box.
• Selecting all items at once (during normal measurement only)
7.
Turn the jog shuttle to select All ON.
8.
Press SELECT. The buttons to the left of all the elements and measurement
functions are highlighted indicating that all items will be stored.
• Deselecting all items at once (during normal measurement only)
7.
Turn the jog shuttle to select All OFF.
8.
Press SELECT. The highlighting of the buttons to the left of all the elements
and measurement functions are cleared indicating that all items will not be
stored.
ESC
During normal measurement
During harmonic measurement
Items specified in Preset1
Items specified in Preset2
• Setting the items one at a time
7.
Turn the jog shuttle to select the element or measurement function that you
wish to specify.
8.
Press SELECT. When the button to the left of the selected element or
measurement function is highlighted, the numerical data of the measurement
function of the element will be stored. When the highlighting of the button is
cleared, the numerical data of the measurement function of the element will not
be stored.
IM 760101-01E
11-7
11
Storing and Recalling Data and Saving the Stored Data
• Selecting only the items that are preset (during normal measurement only)
7.
Turn the jog shuttle to select Preset1 or Preset2.
8.
Press SELECT. The buttons to the left of all the elements and measurement
functions that are specified in Preset1 or Preset 2 are highlighted indicating that
the items will be stored.
11.3 Setting the Numerical Data and Waveform Display Data to Be Stored
Selecting the Waveform Display Data to Be Stored
(This operation is valid if the stored item was set to Wave or Numeric+Wave in step 5.)
6.
Press the Wave Trace soft key to display the Wave Trace dialog box.
• Selecting all the items at once
7.
Turn the jog shuttle to select All ON.
8.
Press SELECT. The buttons to the left of all the signals are highlighted
indicating that all items will be stored.
• Deselecting all the items at once
7.
Turn the jog shuttle to select All OFF.
8.
Press SELECT. The highlighting of the buttons to the left of all the signals are
cleared indicating that all items will not be stored.
ESC
• Setting the items one at a time
7.
Turn the jog shuttle to select the input signal you wish to set.
8.
Press SELECT. When the button to the left of the selected input signal is
highlighted, the input signal will be stored. If the highlighting of the button is
cleared, the input signal will not be stored.
11-8
IM 760101-01E
11.3 Setting the Numerical Data and Waveform Display Data to Be Stored
Explanation
Selecting the Items to Be Stored
Select the item to be stored from the following list of choices.
• Numeric
Numerical data are stored.
• Wave
Waveform display data are stored.
• Numeric+Wave
Numerical data and waveform display data are stored.
Selecting the Numerical Data to Be Stored
Select which numerical data items are to be stored.
• During Normal Measurement
• Only installed elements and wiring units are applicable for the selection.
• The measurement functions that are to be stored can be selected from the items
that are indicated in “Measurement Function Types during Normal
Measurement” and “Measurement Function Types for Motor Evaluation Function
(Option)” in section 1.2; “Delta Computation,” “User-Defined Functions,” and
“Corrected Power” in section 1.5; and “Measurement Functions of Integration” in
section 1.6.
• During Harmonic Measurement
• Only installed elements are applicable for the selection.
• The measurement functions that are to be stored can be selected from U
(including Uhdf), I (including Ihdf), P (including Phdf), S, Q, λ, φ, φU, φI, Z, Rs,
Xs, Rp, Xp, and Others*.
*
If Others is selected, the measurement functions Uthd, Ithd, Pthd, Uthf, Ithf, Utif, Itif,
hvf, hcf, fU, and fI of the selected elements, phase difference φ, Σ functions, userdefined functions, and so on are stored.
Note
•
•
•
•
•
IM 760101-01E
For the meanings of the measurement function symbols that are displayed, see section 1.2,
“Measurement Functions and Measurement Periods,” 1.5, “Computation,” 1.6, “Integration,”
appendix 1, “Symbols and Determination of Measurement Functions,” and appendix 2,
“Determination of Delta Computation.”
For details on the wiring units expressed as ΣA, ΣB, and ΣC, see section 5.1, “Selecting the
Wiring System.”
[-------] (no data) is stored in places where there is no numerical data.
If there are no integrated values because integration is not performed, [-------] (no data) is
stored. The integration time is stored along with [--------].
The maximum harmonic for which the data is stored is the upper limit of harmonic order under
analysis that is specified in section 7.5. [-------] (no data) is stored for harmonic orders without
data.
11-9
Storing and Recalling Data and Saving the Stored Data
Selecting the Waveform Display Data to Be Stored
• Select which waveform display data items are to be stored.
• Only the input signals of the installed elements are applicable for the selection.
• For models with the motor evaluation function (option), the input signals of Speed
and Torque are also selectable items.
11
11.4 Storing the Data
Keys
SELE
CT
SET
RE
DISPLAY
HOLD
UP DATE
RATE
FILE
SINGLE
ESC
TRIG'D
WAVE
CURSOR
STORE
COPY
STORE SET
MENU
REMOTE
HARMONICS
LOCAL
MAX HOLD
MISC
NULL
SHIFT
To exit the menu during operation, press ESC.
INPUT
RANGE
SCALING
WIRING
AVG
MEASURE
MOTOR SET
FILTER
CAL
INTEGRATOR
START
STOP
INTEG SET
RESET
SYNC SRC
Procedure
Initializing (Clearing) the Internal Memory
1.
Press SHIFT+STORE (STORE SET) to display the Store Set dialog box.
2.
Press the Mode soft key to select Store.
3.
Press the Store to soft key to select Memory.
4.
Press the Initialize Memory Exec soft key to display the Alert dialog box.
5.
Turn the jog shuttle to select OK or Cancel.
6.
If you select OK and press SELECT, the data in the internal memory is cleared.
If you select Cancel and press SELECT, the clearing of the data in the internal
memory is aborted.
ESC
11-10
ESC
ESC
IM 760101-01E
11.4 Storing the Data
Starting the Store Operation
7.
Press STORE. The STORE indicator above and to the left of the key
illuminates. The store operation starts according to the following conditions
depending on the store mode (see section 11.1).
• During manual mode
Starts the store operation. When STORE is pressed, the first store operation
is executed. “Store:Start” is displayed at the upper left corner of the screen.
• During real-time mode
The instrument enters the store ready condition and “Store:Ready” is
displayed at the upper left corner of the screen. The store operation starts at
the reservation time for starting the operation. When the reservation time for
starting the store operation is reached, the first store operation is executed.
“Store:Start” is displayed at the upper left corner of the screen.
• During integration synchronization mode
The instrument enters the store ready condition and “Store:Ready” is
displayed at the upper left corner of the screen. When integration starts, the
store operation starts. When integration starts, the first store operation is
executed. “Store:Start” is displayed at the upper left corner of the screen.
Stopping the Store Operation
8.
If the store operation is in progress, pressing STORE again stops the operation.
The STORE indicator above and to the left of the key turns off.
IM 760101-01E
11-11
11
Storing and Recalling Data and Saving the Stored Data
Automatically Stopping the Store Operation
8.
The store operation stops automatically according to the following conditions
depending on the store mode. The STORE indicator above and to the left of the
key turns off.
• During manual mode
The store operation stops when the specified store count of data is stored or
when the data is stored up to the internal memory size (approximately 12 MB,
or approximately 11 MB when using a WT1600 with ROM version 2.01 or
later). “Store:Stop” is displayed at the upper left corner of the screen.
• During real-time mode
The store operation stops when the specified store count of data is stored,
when the reservation time for stopping the store operation is reached, or
when the data is stored up to the internal memory size. “Store:Stop” is
displayed at the upper left corner of the screen.
• During integration synchronization mode
The store operation stops when the specified store count of data is stored,
when integration stops, or when the data is stored up to the internal memory
size. “Store:Stop” is displayed at the upper left corner of the screen.
11.4 Storing the Data
Explanation
To store data, parameters such as the store mode, the store count, the store interval,
and the store reservation time must be specified before executing the operation. This
section explains the start and stop operations of storage. For the procedure on how to
set the store mode, see section 11.1; for the procedure on how to set the store count, the
store interval, and the store reservation time, see section 11.2.
Initializing (Clearing) the Internal Memory
• Store operation can be executed only when the internal memory is cleared.
• If you are performing the first store operation after turning ON the power switch,
there is no need to clear the internal memory.
Starting the Store Operation
The store operation starts according to various conditions depending on the store
mode (see section 11.1). For details, see the procedural explanation.
Stopping the Store Operation
• The store operation can be forcibly stopped using the STORE key.
• The store operation stops automatically according to the various conditions
depending on the store mode. For details, see the procedural explanation.
Saving the Stored Data
The data stored to the internal memory cannot be held by means of the internal
lithium battery. The data in the internal memory is lost when the power to the
WT1600 is turned OFF. If you wish to keep the data, save the data to a storage
medium before turning OFF the power.
Note
•
•
•
•
•
•
•
11-12
To start the store operation again after stopping the operation, the internal memory must be
cleared.
[-------] (no data) is stored in places where there is no numerical data.
If there are no integrated values because integration is not performed, [-------] (no data) is
stored. The integration time is stored along with [--------].
The maximum harmonic for which the data is stored is the maximum harmonic order to be
analyzed that is specified in section 7.5. [-------] (no data) is stored for harmonic orders
without data.
While the store operation is in progress, you cannot turn ON/OFF the harmonic measurement
mode or change the PLL source, the equation for distortion, scaling, averaging, filter,
integration mode, integration timer, or the store interval.
If you press HOLD to hold the display while the store operation is in progress, the value that
existed when HOLD was pressed is stored.
If you press HOLD to hold the display while storing data with the store interval is 00:00:00, the
store operation stops.
IM 760101-01E
11.5 Saving the Stored Data
Keys
SELE
CT
SET
RE
DISPLAY
HOLD
UP DATE
RATE
FILE
SINGLE
ESC
TRIG'D
WAVE
STORE
COPY
STORE SET
MENU
REMOTE
HARMONICS
CURSOR
LOCAL
MAX HOLD
MISC
NULL
SHIFT
To exit the menu during operation, press ESC.
INPUT
RANGE
SCALING
WIRING
AVG
MEASURE
MOTOR SET
FILTER
CAL
INTEGRATOR
START
STOP
INTEG SET
RESET
SYNC SRC
Procedure
1.
2.
3.
Press SHIFT+STORE (STORE SET) to display the Store Set dialog box.
Press the Mode soft key to select Store.
Press the Store to soft key to select Memory or File.
If you selected Memory, proceed to “When Saving Data That Has Already Been
Stored” on the next page.
If you selected File, proceed to “When Saving Data through a Store-and-Save
Operation Sequence” on page 11-16.
ESC
11
ESC
Storing and Recalling Data and Saving the Stored Data
IM 760101-01E
11-13
11.5 Saving the Stored Data
When Saving Data That Has Already Been Stored
4.
Press the Convert Memory soft key to display the Convert Memory dialog box.
Selecting the Data Type for Saving the Data
5.
Press the Data Type soft key to select ASCII or Float.
Selecting the Save Destination Medium
6.
Press the File List soft key to display the File List dialog box.
7.
Turn the jog shuttle to select the save destination medium (indicated by [ ]).
8.
Press SELECT to confirm the new medium.
Selecting the Save Destination Directory
(Perform this operation when directories are present on the medium.)
9.
Turn the jog shuttle to select the save destination directory (indicated by < >).
10. Press SELECT to confirm the new directory.
The selected medium/directory is displayed in “Path=......” located at the upper
left corner of the File List dialog box.
ESC
ESC
ESC
Setting the File Name and Comment
11. Press the File Name soft key to display the Save dialog box.
12. Turn the jog shuttle to select Auto Naming.
13. Press SELECT to select ON or OFF.
14. Turn the jog shuttle to select File Name.
15. Press SELECT to display the keyboard.
16. Use the keyboard to set the file name.
For keyboard operations, see section 3.12, “Entering Values and Strings.”
17.
18.
Enter the comment in a similar fashion.
Press ESC to close the Save dialog box.
ESC
11-14
ESC
IM 760101-01E
11.5 Saving the Stored Data
Executing the Save Operation
19. Press the Convert Memory Exec soft key. The stored data is saved to the
directory indicated by Path=...... At the same time, the Convert Memory Exec
soft key changes to an Abort soft key.
Aborting the Save Operation
20. Press the Abort soft key to abort the save operation. At the same time, the
Abort soft key changes to a Convert Memory Exec soft key.
ESC
Specifying the File to Be Displayed on the File List Dialog Box
11. Press the Filter soft key to select Item or All.
Viewing the Properties
11. On the File List dialog box, turn the jog shuttle to select the file.
12. Press the Property soft key to display the file property window.
13. Press ESC to close the file property window.
ESC
11
ESC
Storing and Recalling Data and Saving the Stored Data
IM 760101-01E
11-15
11.5 Saving the Stored Data
When Saving Data through a Store-and-Save Operation Sequence
4.
Press the File setting soft key to display the File setting dialog box.
Selecting the Data Type for Saving the Data
5.
Same as step 5 under “Selecting the Data Type for Saving the Data” on page
11-14.
Selecting the Save Destination Medium
6.
Same as steps 6 to 8 under “Selecting the Save Destination Medium” on page
11-14.
Selecting the Save Destination Directory
7.
Same as steps 9 and 10 under “Selecting the Save Destination Directory” on
page 11-14.
Setting the File Name and Comment
8.
Same as steps 11 to 18 under “Setting the File Name and Comment” on page
11-14.
Initializing (Clearing) the Internal Memory
9.
Press ESC twice to return to the Store Set menu.
10. Press the Initialize Memory Exec soft key to display the Alert dialog box.
11. Turn the jog shuttle to select OK or Cancel.
12. If you select OK and press SELECT, the data in the internal memory is cleared.
If you select Cancel and press SELECT, the clearing of the data in the internal
memory is aborted.
Starting the Store Operation
13. Press STORE. The store operation starts (see section 11.4) according to
various conditions depending on the store mode (see section 11.1).
Stopping the Store Operation and Saving the Data
14. If the store operation is in progress, pressing STORE again stops the operation.
Then, the stored data is saved to the directory indicated by Path=......
Automatically Stopping the Store Operation and Saving the Data
15. The store operation stops (see section 11.4) automatically according to the
various conditions depending on the store mode. Then, the stored data is saved
to the directory indicated by Path=......
Specifying the File to Be Displayed on the File List Dialog Box
Same as step 11 under “Specifying the File to Be Displayed on the File List Dialog
Box” on page 11-15.
Viewing the Properties
Same as steps 11 to 13 under “Viewing Properties” on page 11-15.
Note
•
•
11-16
If the medium at the save destination does not exist when saving the stored data, an error
message is displayed and the save operation is aborted. Since the data is stored in the
internal memory in this case, you can save the data stored to the memory by selecting
“Memory” according to step 3 on page 11-13 and then carrying out the steps on given on
pages 11-14 and 11-15.
Since filing operations are not possible during the integration operation condition, do not
perform the store-and-save operation sequence while in integration synchronization mode.
Also, data that are stored cannot be saved during the integration operation condition.
IM 760101-01E
11.5 Saving the Stored Data
Explanation
CAUTION
Do not remove the medium (disk) or turn OFF the power when the access
indicator or
is blinking. Such acts can damage the medium or destroy the
data on the medium.
Selecting the Data Type
Select the data type from the following list of choices. The extension is automatically added.
• ASCII
• Numerical data or waveform display data is saved in ASCII format.
• The file can be used on your PC for analysis.
• The file cannot be loaded to the WT1600.
• Float
• Numerical data or waveform display data is saved in 32-bit floating format.
• The file cannot be loaded to the WT1600.
Extension and Data Size of the Numerical Data File
• During normal measurement
Data Type
Extension Data Size (Bytes)
ASCII
.CSV
Float
.WTD
Approx. 7 K (condition: number of elements 1, store all measurement
functions 10 times.)
When integration is not performed
Approx. (4 K + (4 × Dn + 16) × store count
When integration is performed
Approx. (4 K + (4 × Dn + 16 + 16 × Ti ) × store count
Dn: Number of numerical data to be stored
(Number of measurement functions × (number of elements +
number of wiring units))
Ti: Number of integration time to be stored
Data Type
Extension Data Size (Bytes)
ASCII
.CSV
Float
.WTD
*
Approx. 25 K (condition: number of elements 1, measurement
functions U and Others, maximum order* 100, store 10 times)
Approx. (4 K + (4 × Dn + 16) × store count
Dn: Number of numerical data to be stored
• When U, I, or P is stored: Number of elements × maximum order* × 2
• When S to Xp are stored: Number of elements × maximum order*
• When Others are stored: Number of elements × 11 + 21
The maximum + 2 (Total, dc) harmonic order to be analyzed as specified in section 7.5.
Extension and Data Size of the Waveform Display Data File
• During normal measurement
Data Type
Extension
Data Size
ASCII
Float
.CSV
.FLD
Approx. 103 K (condition: when one waveform is to be stored)
Approx. (4 K + (4 × 1002 × TW + 16) × store count)
Tw: Number of waveforms to be stored
• During harmonic measurement
Same as for normal measurement.
IM 760101-01E
11-17
Storing and Recalling Data and Saving the Stored Data
• During harmonic measurement
11
11.5 Saving the Stored Data
Selecting the Medium and Directory
Media on which saving and reading is possible are displayed on the File List dialog
box.
Display Example of a Medium
[FD0]: Floppy disk
[SC4]: SCSI device whose ID number is 4 (built-in hard disk, fixed to ID4)
[SC5]: SCSI device whose ID number is 5 (see section 12.3)
[SC5_01]: Partition 1 of a SCSI device whose ID number is 5
[ND0]: Network drive (see section 13.3)
File Name and Comment
• A file name must be assigned. Comments are optional.
• You cannot save to a file name that already exists in the same directory
(overwriting not allowed).
Number of Characters and Types That Can Be Used
Item
Number of Characters
Characters That Can Be Used
File name
Comment
1 to 8 characters
0 to 25 characters
0-9, A-Z, %, _, ( ) (parenthesis), - (minus sign)
Characters that are displayed on the keyboard and spaces
Auto Naming Function
When Auto Naming is turned ON, files with a three digit number from 000 to 999 are
automatically created when saving the data. You can specify a common name (up to
five characters, specified through Filename) that is placed before the number.
Initializing (Clearing) the Internal Memory
• Store operation can be executed only when the internal memory is cleared.
• If you are performing the first store operation after turning ON the power switch,
there is no need to clear the internal memory.
Specifying the File to Be Displayed on the File List Dialog Box
Specify the type of files to be displayed.
• Item
Displays only the numerical data and waveform display data files in the selected
directory.
• All
Displays all the files in the selected directory.
11-18
IM 760101-01E
11.5 Saving the Stored Data
Properties
Displays the filename.extension, the file size, the date the file was saved, the
attribute, and the comment of the selected file.
Note
•
•
•
•
The following data is stored in the places where numerical data does not exist when saving
the stored numerical data.
• For ASCII files: Characters NAN, +INF, -INF, or ERROR.
• For Float files: 0x7FC00000, 0x7F800000, 0xFF800000, or 0xFFFFFFFE.
Up to 36 characters can be displayed in Path.
The file names are not case-sensitive. Comments are case-sensitive. In addition, the
following five file names cannot be used due to limitations of MS-DOS.
AUX, CON, PRN, NUL, and CLOCK
When using the GP-IB or serial interface commands to enter a file name, the following
symbols that do not exist on the keyboard of this instrument can be used.
{}
11
Storing and Recalling Data and Saving the Stored Data
IM 760101-01E
11-19
11.6 Recalling the Stored Data
Keys
SELE
CT
SET
RE
DISPLAY
HOLD
UP DATE
RATE
FILE
SINGLE
ESC
TRIG'D
WAVE
STORE
COPY
STORE SET
MENU
REMOTE
HARMONICS
CURSOR
LOCAL
MAX HOLD
MISC
NULL
SHIFT
To exit the menu during operation, press ESC.
INPUT
RANGE
SCALING
WIRING
AVG
MEASURE
MOTOR SET
FILTER
CAL
INTEGRATOR
START
STOP
INTEG SET
RESET
SYNC SRC
Procedure
1.
2.
3.
Press SHIFT+STORE (STORE SET) to display the Store Set dialog box.
Press the Mode soft key to select Recall.
Turn the jog shuttle and set the Recall No. (number of the data to be recalled).
The corresponding data is displayed.
ESC
ESC
Explanation
You can recall and display the stored numerical data or waveform display data.
There is a one-to-one relationship between the store count number (see section 11.2) and
the Recall No. If you wish to recall the first stored data, for example, set Recall No. to 1.
Note
Only the data stored to the internal memory can be recalled.
11-20
IM 760101-01E
Chapter 12 Saving and Loading the Data
12.1 Precautions to Be Taken When Using the
Floppy Disk Drive
Floppy Disks That Can Be Used
The 3.5" floppy disks below can be used. You can format the disk on the WT1600.
2HD: 1.44 MB MS-DOS format
Inserting the Floppy Disk into the Floppy Disk Drive
With the label facing up, insert the disk from the side with the shutter. Insert the disk
until the eject button pops out.
Removing the Disk from the Floppy Disk Drive
Check that the access indicator is turned OFF and press the eject button.
Access indicator
Eject button
CAUTION
General Handling Precautions of Floppy Disks
For the general handling precautions of the floppy disk, read the instruction manual that
came with the floppy disk.
IM 760101-01E
12-1
12
Saving and Loading the Data
Do not remove the floppy disk drive when the access indicator or
is blinking.
Such act can damage the magnetic head of the floppy disk drive or destroy the
data on the disk.
12.2 Built-in Hard Disk (Option)
Keys
SELE
CT
SET
RE
DISPLAY
HOLD
UP DATE
RATE
FILE
SINGLE
ESC
TRIG'D
WAVE
STORE
COPY
STORE SET
MENU
REMOTE
HARMONICS
CURSOR
LOCAL
MAX HOLD
MISC
NULL
SHIFT
To exit the menu during operation, press ESC.
INPUT
RANGE
SCALING
WIRING
AVG
MEASURE
MOTOR SET
FILTER
CAL
INTEGRATOR
START
STOP
INTEG SET
RESET
SYNC SRC
Procedure
1.
2.
3.
4.
Press MISC to display the Misc menu.
Press the Next 1/2 soft key to display the Next 2/2 menu.
Press the SCSI Setting soft key to display the SCSI Setting dialog box.
Press the HDD Motor soft key to select ON or OFF.
ESC
ESC
ESC
Explanation
• You can turn ON/OFF the power to the built-in hard disk on this instrument. By
turning the power OFF, you can protect the built-in hard disk from vibrations.
• The SCSI ID of the built-in hard disk is fixed to 4.
• The size of the built-in hard disk is approximately 10 GB. The disk is formatted with 5
partitions before being shipped from the factory.
CAUTION
• Do not turn OFF the power while the built-in hard disk is being accessed. Such
act can damage the data on the hard disk.
• When using the instrument in a vibrating environment, turn OFF the motor
power of the built-in hard disk.
12-2
IM 760101-01E
12.3 Connecting a SCSI Device
SCSI (Option) Specifications
Item
Specification
Interface standard
Connector type
Electrical specifications
SCSI (Small Computer System Interface), ANSI X3.131-1986
Half pitch 50 pins (pin type)
Single end. See the figure below for the pin configuration.
Terminator is built in.
Pin No.
Signal Name
Pin No.
Signal Name
1 to 12
13
14 to 25
26
27
28
29
30
31
32
33
34
35to 37
GND
NC
GND
-DB0
-DB1
-DB2
-DB3
-DB4
-DB5
-DB6
-DB7
-DBP
GND
38
39, 40
41
42
43
44
45
46
47
48
49
50
–
TERMPWR
GND
-ATN
GND
-BSY
-ACK
-RST
-MSG
-SEL
-C/D
-REQ
-I/O
–
Pin No.
2
26
27
3
28
1
(Rear
panel)
23
24
48
49
25
50
Items Necessary for Connection
Cable
Use a commercially sold cable that is 3 m or less in length, that has a ferrite core on
each end of the cable, and that has a characteristic impedance between 90 and 132 Ω.
Procedure When Connecting the WT1600 and a SCSI Device
1.
2.
Connect the SCSI cable to the SCSI connector on the rear panel of the
instrument.
Turn ON the SCSI device first and then the WT1600.
To format the hard disk, follow the procedure described in the section 12.5,
“Formatting the Disk.”
12
Note
When connecting multiple SCSI devices in a chain, attach a SCSI terminator to the device at
the other end of the chain.
IM 760101-01E
12-3
Saving and Loading the Data
Connectable SCSI Devices
Most SCSI devices (MO disk drive, hard disk, and ZIP) can be connected to the
instrument, but there are some exceptions. For example, the maximum number of
partitions that can be selected is 10 and each partition cannot exceed 2 GB. If the
total capacity of all partitions exceeds 20 GB, the hard disk cannot be formatted.
For details on which devices can be connected, ask your YOKOGAWA dealer.
For general handling precautions for the connected SCSI device, see the instruction
manual that is provided with the device.
12.4 Changing the SCSI ID Number
Keys
SELE
CT
SET
RE
DISPLAY
HOLD
UP DATE
RATE
FILE
SINGLE
ESC
TRIG'D
WAVE
STORE
COPY
STORE SET
MENU
REMOTE
HARMONICS
CURSOR
LOCAL
MAX HOLD
MISC
NULL
SHIFT
To exit the menu during operation, press ESC.
INPUT
RANGE
SCALING
WIRING
AVG
MEASURE
MOTOR SET
FILTER
CAL
INTEGRATOR
START
STOP
INTEG SET
RESET
SYNC SRC
Procedure
1.
2.
3.
Press MISC to display the Misc menu.
Press the Next 1/2 soft key to display the Next 2/2 menu.
Press the SCSI Setting soft key to display the SCSI Setting dialog box.
Changing the SCSI ID Number of the WT1600
4.
Press the Own ID soft key.
5.
Turn the jog shuttle to select 0 to 7.
6.
Press the Initialize SCSI soft key. The SCSI ID is changed to the selected ID
number.
The
icon at the upper left corner of the screen blinks while the change is in
progress. When the change is complete, the icon disappears.
ESC
12-4
ESC
ESC
IM 760101-01E
12.4 Changing the SCSI ID Number
Explanation
The SCSI ID number is used to distinguish between the various devices connected to
the SCSI chain. Make sure not to use duplicate ID numbers on any of the connected
devices. The SCSI is optional.
Selectable Range of SCSI ID Numbers for the WT1600
Own ID can be set in the range of 0 to 7. The default value is 6.
SCSI ID Number of the Built-in Hard Disk
Fixed to 4.
Note
•
•
•
Do not set the SCSI ID number of the external SCSI device to the same ID number as the
built-in hard disk of the WT1600.
When changing the SCSI ID number, make sure to press the Initialize SCSI soft key.
The SCSI ID numbers of external SCSI devices are automatically detected.
12
Saving and Loading the Data
IM 760101-01E
12-5
12.5 Formatting the Disk
Keys
SELE
CT
SET
RE
DISPLAY
HOLD
UP DATE
RATE
FILE
SINGLE
ESC
TRIG'D
WAVE
STORE
COPY
STORE SET
MENU
REMOTE
HARMONICS
CURSOR
LOCAL
MAX HOLD
MISC
NULL
SHIFT
To exit the menu during operation, press ESC.
INPUT
RANGE
SCALING
WIRING
AVG
MEASURE
MOTOR SET
FILTER
CAL
INTEGRATOR
START
STOP
INTEG SET
RESET
SYNC SRC
Procedure
1.
2.
3.
Press FILE to display the File menu.
Press the Utility soft key. The Utility menu and the File List dialog box appear.
Press the Function soft key to display the Function menu.
ESC
12-6
ESC
IM 760101-01E
12.5 Formatting the Disk
Selecting the Medium to Be Formatted
4.
Press the Format soft key. The media list is displayed in the File List dialog box.
5.
Turn the jog shuttle to select the medium to be formatted.
If there are no external SCSI devices that are detected and only a floppy disk is
inserted in the floppy drive, only [FD0] appears.
Viewing the Media Information
6.
Press the Media Info soft key. The information about the medium that was
selected in step 5 is displayed.
If you selected FD0 in step 5, proceed to step 7 below.
If you selected SC.. in step 5, proceed to step 7 on the next page.
ESC
ESC
Selecting the Floppy Disk Format
7.
Press the Format soft key to display the Format menu. Proceed to step 10.
ESC
12
Saving and Loading the Data
IM 760101-01E
12-7
12.5 Formatting the Disk
Selecting the Medium Format of the SCSI Device
7.
Press the Format soft key to display the Format menu.
• Selecting the number of partitions
8.
Turn the jog shuttle to select a value from 1 to 10.
• Selecting the format type
9.
Press the Format Type soft key to select Normal or Quick.
For models with firmware version 1.06 or later, if you select SC4 (internal hard
disk), this menu is not displayed. Only a logical format (Quick) is performed.
ESC
ESC
ESC
Executing (OK)/Aborting (Cancel) the Format Operation
10. Press the Format Exec soft key to display the Alert dialog box.
11. Turn the jog shuttle to select OK or Cancel.
12. Select OK and press SELECT to execute the format operation.
Select Cancel and press SELECT to abort the format operation.
ESC
12-8
IM 760101-01E
12.5 Formatting the Disk
Explanation
CAUTION
• Do not remove the medium (disk) or turn OFF the power when the access
indicator or
is blinking. Such acts can damage the medium or destroy the
data on the medium.
• If the WT1600 cannot recognize a formatted medium, format the disk again on
the WT1600. Note that all the data on the disk are cleared when the disk is
formatted. Make sure to back up important data beforehand.
Media Information
Lists the information about the selected medium.
• Media Name: Name of the medium.
• Media Size:
Total size.
• Used Space:
Size of the used area.
• Vacant Space: Size of the free area.
• Partition Size: Number of partitions.
If you press the Media Info soft key when a floppy disk that has been formatted to MSDOS format is inserted in the floppy drive, the media information of the floppy disk is
displayed.
Formatting a Floppy Disk
When using a new floppy disk, you must format it. The format is 2 HD 1.44 MB/18
sectors.
Formatting a Disk
The formats of the disk that are connected via the SCSI (option) are as follows:
• MO/PD
Semi-IBM format. It is handled as a removable disk.
• Zip/JAZ
Hard disk format. It is handled as a fixed disk.
12
Saving and Loading the Data
Formatting a Hard Disk
IBM-compatible format.
IM 760101-01E
12-9
12.5 Formatting the Disk
Selecting the Format Type
When formatting an external SCSI device, you can select the format type from the
following list of choices.
• Normal
Performs both physical format and logical format.
• Quick
Performs only a logical format.
The approximate time required for the format operation are indicated below (the time
varies depending on the SCSI device).
Media
Normal
Quick
MO (128 MB)
MO (230 MB)
External HDD (10 GB)
Built-in hard disk
Built-in hard disk
Approx. 10 minutes
Approx. 10 minutes
Approx. 15 minutes
Approx. 15 minutes
—
Approx. 15 s
Approx. 15 s
Approx. 15 s
Approx. 10 s
Approx. 10 s
(For models with firmware version 1.06 or later)
Selecting the Number of Partitions
• The external hard disk can be divided into several partitions.
• Select the number of partitions in the range from 1 to 10. If the number of partitions is
set to “2,” the hard disk is divided into two partitions named “SC0” and “SC1.”
• When formatting a large hard disk, select the number of partitions so that each
partition does not exceed 2 GB.
• If the total capacity of all partitions exceeds 20 GB, the hard disk cannot be
formatted.
• The selection of the number of partitions only applies to a hard disk. For all other
media, it is handled as one partition.
Note
•
•
•
•
•
•
•
•
•
•
12-10
If you format a medium that has data stored on it, all the data are cleared when the medium is
formatted.
It takes approximately a minute and a half to format a floppy disk.
You cannot format a floppy disk if the write-protect is ON.
Do not format a disk while the WT1600 and a PC is connected via a SCSI cable.
Floppy disks that are formatted to formats other than those listed in this section cannot be
used.
If an error message is displayed after the format operation, the floppy disk may be damaged.
You can use floppy disks that are formatted using MS-DOS on a PC.
Quick (logical) format only clears (initializes) information such as directory entries and FAT. If
you need to check for bad tracks, perform a physical format (Normal).
If data is written to an external SCSI device when there are bad tracks, an access error (604
Media failure) may occur preventing additional data to be written. It is recommended that
Normal be used when a medium is formatted for the first time after purchase or a medium
that can no longer be read or written and that Quick be used on a medium you have been
using before.
The WT1600 can perform Quick format of DVD-RAM. Physical format (Normal) is not
possible.
IM 760101-01E
12.6 Saving Setup Parameters, Waveform Display
Data, and Numerical Data
Keys
SELE
CT
SET
RE
HOLD
DISPLAY
UP DATE
RATE
FILE
SINGLE
ESC
TRIG'D
WAVE
STORE
COPY
STORE SET
MENU
REMOTE
HARMONICS
CURSOR
LOCAL
MAX HOLD
MISC
NULL
SHIFT
To exit the menu during operation, press ESC.
INPUT
RANGE
SCALING
WIRING
AVG
MEASURE
MOTOR SET
FILTER
CAL
INTEGRATOR
START
STOP
INTEG SET
RESET
SYNC SRC
Procedure
1.
Press FILE to display the File menu.
Selecting the Item to Be Saved
2.
Press the File Item soft key to display the File Item menu.
3.
Press one of the soft keys from Setup to Numeric to select the item to be saved.
If you selected Setup, proceed to step 11 under “Executing/Aborting the Save
Operation” on page 12-14.
If you selected Wave, proceed to “Selecting the Waveform Display Data” on the
next page.
If you selected Numeric, proceed to “Selecting the Numerical Data” on the 12-13.
ESC
ESC
12
Saving and Loading the Data
IM 760101-01E
12-11
12.6 Saving Setup Parameters, Waveform Display Data, and Numerical Data
Selecting the Waveform Display Data
Selecting the Type of Waveform Display Data to Be Saved
4.
Press the Data Type soft key to display the Data Type menu.
5.
Press one of the keys from Binary to Float to select the data type.
ESC
ESC
Selecting the Input Signals to Be Saved
The input signal selection box appears only when you select Float in step 5. (When
the data type is set to Binary or ASCII, the waveform that is displayed on the screen is
saved.)
6.
Press the Save soft key to display the Save Menu menu.
7.
Press the Trace soft key to display the input signal selection box.
8.
Turn the jog shuttle to select any of the signals starting with U1.
9.
Press SELECT to select the input signal to be saved.
Proceed to step 12 on page 12-14.
ESC
12-12
ESC
IM 760101-01E
12.6 Saving Setup Parameters, Waveform Display Data, and Numerical Data
Selecting the Numerical Data
Selecting the Type of Numerical Data to Be Saved
4.
Press the Data Type soft key to select ASCII or Float.
Selecting the Numerical Data to Be Saved
5.
Press the List Item soft key to display the List Item dialog box.
• Selecting all items at once (during normal measurement only)
6.
Turn the jog shuttle to select All ON.
7.
Press SELECT. The buttons to the left of all the elements and measurement
functions are highlighted indicating that all items will be saved.
• Deselecting all items at once (during normal measurement only)
6.
Turn the jog shuttle to select All OFF.
7.
Press SELECT. The highlighting of the buttons to the left of all the elements
and measurement functions are cleared indicating that all items will not be
saved.
ESC
ESC
During normal measurement
During harmonic measurement
Items specified in Preset1
IM 760101-01E
Items specified in Preset2
12-13
12
Saving and Loading the Data
• Selecting only the items that are preset (during normal measurement only)
6.
Turn the jog shuttle to select Preset1 or Preset2.
7.
Press SELECT. The buttons to the left of all the elements and measurement
functions that are specified in Preset1 or Preset 2 are highlighted indicating that
the items will be saved.
12.6 Saving Setup Parameters, Waveform Display Data, and Numerical Data
• Setting the items one at a time
6.
Turn the jog shuttle to select the element or measurement function that you
wish to specify.
7.
Press SELECT. When the button to the left of the selected element or
measurement function is highlighted, the numerical data of the measurement
function of the element will be saved. When the highlighting of the button is
cleared, the numerical data of the measurement function of the element will not
be saved.
Proceed to step 10.
Executing/Aborting the Save Operation
10.
11.
12.
Press ESC to close the List Item dialog box.
Press the Save soft key to display the Save Menu menu.
Press the File List soft key to display the File List dialog box.
Selecting the Save Destination Medium
13. Turn the jog shuttle to select the save destination medium (indicated by [ ]).
14. Press SELECT to confirm the new medium.
Selecting the Save Destination Directory
(Perform this operation when directories are present on the medium.)
15. Turn the jog shuttle to select the save destination directory (indicated by < >).
16 . Press SELECT to confirm the new directory.
The selected medium/directory is displayed in “Path=......” located at the upper
left corner of the File List dialog box.
ESC
ESC
Setting the File Name and Comment
17. Press the File Name soft key to display the Save dialog box.
18. Turn the jog shuttle to select Auto Naming.
19. Press SELECT to select ON or OFF.
20. Turn the jog shuttle to select File Name.
21. Press SELECT to display the keyboard.
22. Use the keyboard to set the file name.
For keyboard operations, see section 3.12, “Entering Values and Strings.”
23.
24.
12-14
Enter the comment in a similar fashion.
Press ESC to close the Save dialog box.
IM 760101-01E
12.6 Saving Setup Parameters, Waveform Display Data, and Numerical Data
ESC
ESC
Executing the Save Operation
25. Press the Save Exec soft key. The data is saved to the directory indicated by
Path=...... At the same time, the Save Exec soft key changes to an Abort soft
key.
Aborting the Save Operation
26. Press the Abort soft key to abort the save operation. At the same time, the
Abort soft key changes to a Save Exec soft key.
ESC
ESC
12
Viewing the Properties
Same as the procedure given in “Viewing the Properties” in section 12.9.
IM 760101-01E
12-15
Saving and Loading the Data
Specifying the File to Be Displayed on the File List Dialog Box
Same as the procedure given in “Specifying the File to Be Displayed on the File List
Dialog Box” in section 12.9.
12.6 Saving Setup Parameters, Waveform Display Data, and Numerical Data
Explanation
CAUTION
Do not remove the medium (disk) or turn off the power when the access
indicator or
is blinking. Such acts can damage the medium or destroy the
data on the medium.
Setup Parameters, Waveform Display Data, and Numerical Data can be saved.
Saving Setup Parameters
Select Setup from the File Item menu to save setup parameters.
• Setup parameters that are saved
The setup parameter of each key existing at the time of the save operation can be
saved. However, setup parameters such as the date and time, communications,
and SCSI ID numbers are not saved.
• Data size
The data size of a single set of setup parameters is approximately 20 KB.
• Extension
.set extension is automatically added to the file name.
Saving the Displayed Waveform Data
Select Wave from the File Item menu to save waveform display data.
• Selecting the data type
Select the data type from the following list of choices. The extension is
automatically added.
• Binary
• Saved in binary format.
• The file cannot be loaded to the WT1600.
• ASCII
• Saved in ASCII format.
• The file can be used on your PC for analysis.
• The file cannot be loaded to the WT1600.
• Float
• Saved in 32-bit floating format.
• The file cannot be loaded to the WT1600.
12-16
IM 760101-01E
12.6 Saving Setup Parameters, Waveform Display Data, and Numerical Data
• Extension and data size
• During normal measurement
Data Type
Extension
Data Size (Bytes)
Binary
.WVF
.HDR
.CSV
.FLD
Approx. (4 K + 4 × 1002 × Tw), Tw: Number of displayed waveforms
Approx. 7 K
Approx. 15 K (condition: when there is one displayed waveform)
Approx. (4 K + 4 × 1002)
ASCII
Float
• During harmonic measurement
Same as for normal measurement.
• Selecting the waveform
• When the data type is set to Binary or ASCII, the waveform that is displayed on
the screen is saved.
• When the data type is Float, the waveform of the input signal selected from the
following is saved.
• Only the input signals of the installed elements are applicable for the selection.
• For models with the motor evaluation function (option), the input signals of
Speed and Torque are also selectable items.
• The setup parameters including vertical axis, horizontal axis, and trigger of the
waveform to be saved are also saved.
Saving the Numerical Data
Select Numeric from the File Item menu to save numerical data.
• Selecting the data type
Select the data type from the following list of choices. The extension is
automatically added.
• ASCII
• Saved in ASCII format.
• The file can be used on your PC for analysis.
• The file cannot be loaded to the WT1600.
• Float
• Saved in 32-bit floating format.
• The file cannot be loaded to the WT1600.
12
IM 760101-01E
Data Type
Extension
Data Size (Bytes)
ASCII
.CSV
Float
.WTD
Approx. 2 K (condition: number of elements 1, all measurement
functions)
When integration is not performed
Approx. (4 K + 4 × Dn)
When integration is performed
Approx. (4 K + (4 × Dn + 16 × Ti))
Dn: Number of numerical data to be saved
(Number of measurement functions × (number of elements +
number of wiring units))
Ti: Number of integration time to be saved
12-17
Saving and Loading the Data
• Extension and data size
• During normal measurement
12.6 Saving Setup Parameters, Waveform Display Data, and Numerical Data
• During harmonic measurement
Data Type
Extension
Data Size (Bytes)
ASCII
.CSV
Float
.WTD
Approx. 4.2 K (condition: number of elements 1, measurement
functions U and Others, maximum order* 100)
Approx. (4 K + 4 K × Dn)
Dn: Number of numerical data to be saved
• When U, I, or P are to be saved: Number of elements × maximum
order* × 2
• When S to Xp are saved: Number of elements × maximum order*
• When Others are stored: Number of elements × 11 + 21
*
The maximum harmonic order to be analyzed as specified in section 7.5.
• Selecting the numerical data
Select which numerical data items are to be saved.
• During normal measurement
• Only installed elements and wiring units are applicable for the selection.
• The measurement functions can be selected from the items that are indicated in
“Measurement Function Types during Normal Measurement” and “Measurement
Function Types for Motor Evaluation Function (Option)” in section 1.2; “Delta
Computation,” “User-Defined Functions,” and “Corrected Power” in section 1.5; and
“Measurement Functions of Integration” in section 1.6.
• During harmonic measurement
• Only installed elements are applicable for the selection.
• The measurement functions can be selected from U (including Uhdf), I
(including Ihdf), P (including Phdf), S, Q, λ, φ, φU, φI, Z, Rs, Xs, Rp, Xp, and
Others*.
*
If Others is selected, the measurement functions Uthd, Ithd, Pthd, Uthf, Ithf, Utif, Itif,
hvf, hcf, fU, and fI of the selected elements, phase difference φ, Σ functions, userdefined functions, and so on are saved.
Selecting the Medium and Directory
Media on which saving and reading is possible are displayed on the File List dialog box.
Display example of media
[FD0]: Floppy disk
[SC4]: SCSI device whose ID number is 4 (built-in hard disk, fixed to ID4)
[SC5]: SCSI device whose ID number is 5 (see section 12.3)
[SC5_01]: Partition 1 of a SCSI device whose ID number is 5
[ND0]: Network drive (see section 13.3)
File Name and Comment
• A file name must be assigned. Comments are optional.
• You cannot save to a file name that already exists in the same directory
(overwriting not allowed).
Number of Characters and Types That Can Be Used
12-18
Item
Number of Characters Characters That Can Be Used
File name
Comment
1 to 8 characters
0 to 25 characters
0-9, A-Z, %, _, ( ) (parenthesis), - (minus sign)
Characters that are displayed on the keyboard and spaces
IM 760101-01E
12.6 Saving Setup Parameters, Waveform Display Data, and Numerical Data
Auto Naming Function
When Auto Naming is turned ON, files with a three digit number from 000 to 999 are
automatically created when saving the data. You can specify a common name (up to
five characters, specified through Filename) that is placed before the number.
Specifying the File to Be Displayed on the File List Dialog Box
Same as the explanation given in “Specifying the File to Be Displayed on the File List
Dialog Box” in section 12.9.
Properties
Same as the explanation given in “Properties” in section 12.9.
Note
•
•
•
•
•
•
•
•
•
For the meanings of the measurement function symbols that are displayed, see section 1.2,
“Measurement Functions and Measurement Periods,” 1.5, “Computation,” 1.6, “Integration,”
appendix 1, “Symbols and Determination of Measurement Functions,” and appendix 2,
“Determination of Delta Computation.”
For details on the wiring units expressed as ΣA, ΣB, ΣC, see section 5.1, “Selecting the
Wiring System.”
The maximum order for which the harmonic data is saved is the maximum harmonic order to
be analyzed that is specified in section 7.5.
If you change the extension of the file such as on a PC, the file can no longer be loaded.
The following data is saved in the places where numerical data does not exist when saving
the numerical data.
• For ASCII files: Characters NAN, +INF, -INF, or ERROR.
• For Float files: 0x7FC00000, 0x7F800000, 0xFF800000, or 0xFFFFFFFE.
Up to 36 characters can be displayed in Path.
The file names are not case-sensitive. Comments are case-sensitive. In addition, the
following five file names cannot be used due to limitations of MS-DOS.
AUX, CON, PRN, NUL, and CLOCK
When using the GP-IB or serial interface commands to enter a file name, the following
symbols that do not exist on the keyboard of this instrument can be used.
{}
Setup parameters that have been saved on products with firmware version having
incompatible data cannot be loaded.
12
Saving and Loading the Data
IM 760101-01E
12-19
12.7 Saving Screen Image Data
Keys
SELE
CT
SET
RE
DISPLAY
HOLD
UP DATE
RATE
FILE
SINGLE
ESC
TRIG'D
WAVE
STORE
COPY
STORE SET
MENU
REMOTE
HARMONICS
CURSOR
LOCAL
MAX HOLD
MISC
NULL
SHIFT
To exit the menu during operation, press ESC.
INPUT
RANGE
SCALING
WIRING
AVG
MEASURE
MOTOR SET
FILTER
CAL
INTEGRATOR
START
STOP
INTEG SET
RESET
SYNC SRC
Procedure
1.
2.
3.
Press SHIFT+COPY (MENU) to display the Copy menu.
Press the Copy to soft key to display the Copy to menu.
Press the File soft key.
ESC
ESC
Selecting the Save Destination Medium and Directory
4.
Press the File List soft key to display the File List dialog box.
5.
Same as the procedures given in “Selecting the Save Destination Medium” and
“Selecting the Save Destination Directory” in section 12.6.
6.
Press ESC to close the File List dialog box.
12-20
IM 760101-01E
12.7 Saving Screen Image Data
Selecting the Data Format
7.
Press the Format soft key to display the Format menu.
8.
Press one of the soft keys from TIFF to Post Script to select the data format.
If you select TIFF or BMP, proceed to step 9.
If you selected Post Script, proceed to step 11.
Selecting the Color
(This procedure is applicable if you selected TIFF or BMP in step 8.)
9.
Turn the jog shuttle to select Color to OFF.
If the data format is BMP and you selected Color or Reverse, proceed to step 10.
If you selected the TIFF data format or color OFF, proceed to step 11.
Turning ON/OFF the Data Compression
(This procedure is applicable if you selected BMP in step 8 and Color or Reverse in
Step 9.)
10. Press the Compression soft key to select ON or OFF.
ESC
ESC
For BMP
Setting the File Name and Comment
11. Same as the procedure given in “Setting the File Name and Comment” in
section 12.6.
12
Aborting the Save Operation
14. Press the Abort soft key in the Copy menu.
ESC
IM 760101-01E
12-21
Saving and Loading the Data
Executing the Save Operation
12. Switch to the screen you wish to save.
13. Press COPY. The screen image data is saved to the directory indicated by
Path=......
12.7 Saving Screen Image Data
Explanation
You can save the screen image data.
Selecting the Medium and Directory
Same as the explanation given in “Selecting the Medium and Directory” in section 12.6.
Data Format Selection, Extension, and Data Size
Select the data format from the following list of choices. The extension is
automatically added.
Data Format
Extension
Data Size (Bytes)
TIFF
BMP
PostScript
.TIF
.BMP
.PS
Approx. 350 K (Color)
Approx. 50 K (Color, Compress is ON)
Approx. 80 K
*
Reference value. For PostScript, there are no Color, Reverse, and data compression
selection items. For TIFF, there is no data compression selection item.
Selecting the Color
Select the color when the data format is TIFF or BMP from the following list of
choices.
• Color
Saves the screen image data in color (256 colors).
• Reverse
Saves the screen image data with a white background, black text, and colored
waveforms.
• OFF
Saves the screen image data in black and white.
Turning ON/OFF Data Compression
When the data format is BMP and the color selection is Color or Reverse, select from
the following list of choices.
• OFF
Outputs the data without compression.
• ON
Saves the BMP format image using RLE data compression.
File Name and Comment
Same as the explanation given in “File Name and Comment” in section 12.6.
However, only the first 20 characters of the comment can be displayed on the screen.
Auto Naming Function
Same as the explanation in “Auto Naming Function” in section 12.6.
12-22
IM 760101-01E
12.8 Loading Setup Parameters
Keys
SELE
CT
SET
RE
DISPLAY
HOLD
UP DATE
RATE
FILE
SINGLE
ESC
TRIG'D
WAVE
STORE
COPY
STORE SET
MENU
REMOTE
HARMONICS
CURSOR
LOCAL
MAX HOLD
MISC
NULL
SHIFT
To exit the menu during operation, press ESC.
INPUT
RANGE
SCALING
WIRING
AVG
MEASURE
MOTOR SET
FILTER
CAL
INTEGRATOR
START
STOP
INTEG SET
RESET
SYNC SRC
Procedure
1.
2.
3.
Press FILE to display the File menu.
Press the File Item soft key to display the File Item menu.
Press the Setup soft key to select the setup parameters.
ESC
ESC
12
Saving and Loading the Data
IM 760101-01E
12-23
12.8 Loading Setup Parameters
4.
Press the Load soft key. The Load Menu menu and the File List dialog box
appear.
Selecting the Load Source Medium
5.
Turn the jog shuttle to select the load source medium (indicated by [ ]).
6.
Press SELECT to confirm the new medium.
Selecting the Load Source Directory
(Perform this operation when directories are present on the medium.)
7.
Turn the jog shuttle to select the load source directory (indicated by < >).
8.
Press SELECT to confirm the new directory.
The selected medium/directory is displayed in “Path=......” located at the upper
left corner of the File List dialog box.
ESC
Selecting the File to Be Loaded
9.
Turn the jog shuttle to select the file.
Executing the Load Operation
10. Press the Load Exec soft key. The selected file is read from the directory
indicated in Path=...... At the same time, the Load Exec soft key changes to an
Abort soft key.
Aborting the Load Operation
11. Press the Abort soft key to abort the load operation. At the same time, the
Abort soft key changes to a Load Exec soft key.
ESC
12-24
ESC
IM 760101-01E
12.8 Loading Setup Parameters
Specifying the File to Be Displayed on the File List Dialog Box
Same as the procedure given in “Specifying the File to Be Displayed on the File List
Dialog Box” in section 12.9.
Viewing the Properties
Same as the procedure given in “Viewing the Properties” in section 12.9.
Explanation
CAUTION
Do not remove the medium (disk) or turn OFF the power when the access
indicator or
is blinking. Such acts can damage the medium or destroy the
data on the medium.
The setup parameters saved using the WT1600 can be loaded.
Selecting the Medium and Directory
Same as the explanation given in “Selecting the Medium and Directory” in section 12.6.
Specifying the File to Be Displayed on the File List Dialog Box
Same as the explanation given in “Specifying the File to Be Displayed on the File List
Dialog Box” in section 12.9.
Properties
Same as the explanation given in “Properties” in section 12.9.
Note
•
•
•
•
•
•
IM 760101-01E
12-25
12
Saving and Loading the Data
•
If you change the extension of the file such as on a PC, the file can no longer be loaded.
Up to 36 characters can be displayed in Path.
The file names are not case-sensitive. Comments are case-sensitive.
If the setup parameters that are saved to a file is loaded, the key settings are changed to the
loaded information and cannot be undone. It is recommended that you first save the current
setup parameters and then load the setup parameters from a file.
Setup parameters such as the date and time, communications, and SCSI ID numbers are not
saved. Therefore, loading setup parameters from a file will not change the date and time,
communication, and SCSI ID settings.
Setup parameters that have been saved on products with firmware version having
incompatible data cannot be loaded.
Settings can not be loaded between different models, or models with different element
configurations, firmware (ROM), options, or other characteristics.
12.9 Specifying the File to Be Displayed, Viewing
File Properties, and Changing the File Attribute
Keys
SELE
CT
SET
RE
DISPLAY
HOLD
UP DATE
RATE
FILE
SINGLE
ESC
TRIG'D
WAVE
STORE
COPY
STORE SET
MENU
REMOTE
HARMONICS
CURSOR
LOCAL
MAX HOLD
MISC
NULL
SHIFT
To exit the menu during operation, press ESC.
INPUT
RANGE
SCALING
WIRING
AVG
MEASURE
MOTOR SET
FILTER
CAL
INTEGRATOR
START
STOP
INTEG SET
RESET
SYNC SRC
Procedure
1.
2.
3.
4.
Press FILE to display the File menu.
Press the Utility soft key. The Utility menu and the File List dialog box appear.
Press the Function soft key to display the Function menu.
Press the Delete soft key to display the Delete menu.
ESC
ESC
ESC
Selecting the Medium and Directory
5.
Same as the procedures given in “Selecting the Save Destination Medium” and
“Selecting the Save Destination Directory” in section 12.6.
12-26
IM 760101-01E
12.9 Specifying the File to Be Displayed, Viewing File Properties, and Changing the File Attribute
Specifying the File to Be Displayed on the File List Dialog Box
6.
Press the Filter soft key to select Item or All.
•
•
If you select Item, the list of files corresponding to the file type (Setup, Wave, or
Numeric) that is specified for File Item in the File menu, in the directory selected in step
5, is displayed.
If you select All, the list of all the files in the directory selected in step 5 is displayed.
Viewing the Properties
7.
On the File List dialog box, turn the jog shuttle to select the file.
8.
Press the Property soft key to display the file property window.
9.
Press ESC to close the file property window.
ESC
ESC
Changing the File Attribute
10. Turn the jog shuttle to select a file.
11. Press the Attribute soft key to change the attribute of the selected file to R or R/W.
ESC
12
Saving and Loading the Data
IM 760101-01E
12-27
12.9 Specifying the File to Be Displayed, Viewing File Properties, and Changing the File Attribute
Explanation
CAUTION
Do not remove the medium (disk) or turn OFF the power when the access
indicator or
is blinking. Such acts can damage the medium or destroy the
data on the medium.
Selecting the Medium and Directory
Same as the explanation given in “Selecting the Medium and Directory” in section 12.6.
Specifying the File to Be Displayed on the File List Dialog Box
You can specify the file to be displayed on the File List dialog box.
• Item
The list of files corresponding to the file type (Setup, Wave, or Numeric) that is
specified for File Item in the File menu, in the selected directory, is displayed.
• All
The list of all the files in the selected directory is displayed.
Property
Displays the filename.extension, the file size, the date the file was saved, the
attribute, and the comment of the selected file.
Selecting the File Attribute
Select the file attribute of each file from the following list of choices.
• R/W
Read and write.
• R
Read only. No writing or deleting.
Note
You cannot change a directory attribute.
12-28
IM 760101-01E
12.10 Deleting Files
Keys
SELE
CT
SET
RE
DISPLAY
HOLD
UP DATE
RATE
FILE
SINGLE
ESC
TRIG'D
WAVE
STORE
COPY
STORE SET
MENU
REMOTE
HARMONICS
CURSOR
LOCAL
MAX HOLD
MISC
NULL
SHIFT
To exit the menu during operation, press ESC.
INPUT
RANGE
SCALING
WIRING
AVG
MEASURE
MOTOR SET
FILTER
CAL
INTEGRATOR
START
STOP
INTEG SET
RESET
SYNC SRC
Procedure
1.
2.
3.
4.
Press FILE to display the File menu.
Press the Utility soft key. The Utility menu and the File List dialog box appear.
Press the Function soft key to display the Function menu.
Press the Delete soft key to display the Delete menu.
ESC
ESC
ESC
12
Specifying the File to Be Displayed on the File List Dialog Box
6.
Same as the procedure given in “Specifying the File to Be Displayed on the File
List Dialog Box” in section 12.9.
Viewing the Properties
7.
Same as the procedure given in “Viewing the Properties” in section 12.9.
Changing the File Attribute
8.
Same as the procedure given in “Changing the File Attribute” in section 12.9.
IM 760101-01E
12-29
Saving and Loading the Data
Selecting the Medium and Directory
5.
Same as the procedures given in “Selecting the Save Destination Medium” and
“Selecting the Save Destination Directory” in section 12.6.
12.10 Deleting Files
Selecting the File to Be Deleted One at a Time
9.
Turn the jog shuttle to select a file.
10. Press the Set/Reset soft key. If an asterisk is displayed to the left of the file
name in the File List dialog box, the file will be deleted. If the asterisk to the left
of the file name disappears, the file will not be deleted.
Proceed to step 12.
ESC
Selecting the Files to be Deleted at Once
9.
Turn the jog shuttle to select a file, directory, or medium.
10. Press the All Set soft key. Asterisks appear to the left of the directory
containing the selected file and all the files in the directory, the selected
directory and all the files in the directory, or all the directories and files in the
selected medium. The corresponding items will be deleted. At the same time,
the All Set key changes to an All Reset soft key.
11. Press the All Reset soft key. Asterisks to the left of the directory containing the
selected file and all the files in the directory, the selected directory and all the
files in the directory, or all the directories and files in the selected medium
disappear. The corresponding items will not be deleted. At the same time, the
All Reset soft key changes to an All Set soft key.
ESC
ESC
Executing the Delete Operation
12. Press the Delete Exec soft key. All files with asterisks are deleted.
12-30
IM 760101-01E
12.10 Deleting Files
Explanation
CAUTION
Do not remove the medium (disk) or turn OFF the power when the access
indicator or
is blinking. Such acts can damage the medium or destroy the
data on the medium.
Selecting the Medium and Directory
Same as the explanation given in “Selecting the Medium and Directory” in section 12.6.
Specifying the File to Be Displayed on the File List Dialog Box
Same as the explanation given in “Specifying the File to Be Displayed on the File List
Dialog Box” in section 12.9.
Properties
Same as the explanation given in “Properties” in section 12.9.
Selecting the File Attribute
Same as the explanation given in “Selecting the File Attribute” in section 12.9.
Note
•
•
•
•
•
IM 760101-01E
Data that is deleted cannot be recovered. Make sure you erase the correct files.
You can delete directories if there are no files in them.
When File Item is Wave, Data Type is Binary, and Filter is Item, deleting a file with a .wvf
extension that has an asterisk causes the file with the same name with the .hdr extension to
also be deleted. When Filter is All, only the files that have the asterisks are deleted.
If the file attribute (see section 12.9) is “R,” you cannot delete the file.
If an error occurs while deleting multiple files, the files after the error occurrence are not
deleted.
12-31
12
Saving and Loading the Data
Selecting the Files to Be Deleted
• By placing asterisks to the left of the file names, those files can be deleted.
• There are two methods in selecting the files to be deleted.
• Selecting the files one at a time
Press the Set/Reset soft key to place asterisks to the left of the files one at a
time.
• Selecting the files at once
Press the All Set soft key to place asterisks to the left of the selected file names
at once. There are three methods in selecting the files at once.
• If you select a file and press the All Set soft key, asterisks are placed by the
directory containing the selected file and all the files in the directory.
• If you select a directory and press the All Set soft key, asterisks are placed by
the selected directory and all the files in the directory.
• If you select a medium and press the All Set soft key, asterisks are placed by
all the directories and files in the selected medium.
12.11 Copying Files
Keys
SELE
CT
SET
RE
DISPLAY
HOLD
UP DATE
RATE
FILE
SINGLE
ESC
TRIG'D
WAVE
STORE
COPY
STORE SET
MENU
REMOTE
HARMONICS
CURSOR
LOCAL
MAX HOLD
MISC
NULL
SHIFT
To exit the menu during operation, press ESC.
INPUT
RANGE
SCALING
WIRING
AVG
MEASURE
MOTOR SET
FILTER
CAL
INTEGRATOR
START
STOP
INTEG SET
RESET
SYNC SRC
Procedure
1.
2.
3.
4.
Press FILE to display the File menu.
Press the Utility soft key. The Utility menu and the File List dialog box appear.
Press the Function soft key to display the Function menu.
Press the Copy soft key to display the Copy menu.
ESC
ESC
ESC
Selecting the copy destination medium and directory
5.
Same as the procedures given in “Selecting the Save Destination Medium” and
“Selecting the Save Destination Directory” in section 12.6.
Specifying the File to Be Displayed on the File List Dialog Box
6.
Same as the procedure given in “Specifying the File to Be Displayed on the File
List Dialog Box” in section 12.9.
Viewing the Properties
7.
Same as the procedure given in “Viewing the Properties” in section 12.9.
Changing the File Attribute
8.
Same as the procedure given in “Changing the File Attribute” in section 12.9.
12-32
IM 760101-01E
12.11 Copying Files
Selecting the Copy Source Files One at a Time
9.
Turn the jog shuttle to select a file.
10. Press the Set/Reset soft key. If an asterisk is displayed to the left of the file
name in the File List dialog box, the file will be copied. If the asterisk to the left
of the file name disappears, the file will not be copied.
Proceed to step 12.
ESC
Selecting the Copy Source Files at Once
9.
Turn the jog shuttle to select a file, directory, or medium.
10. Press the All Set soft key. Asterisks appear to the left of the directory
containing the selected file and all the files in the directory, the selected
directory and all the files in the directory, or all the directories and files in the
selected medium. The corresponding items will be copied. At the same time,
the All Set soft key changes to an All Reset soft key.
11. Press the All Reset soft key. Asterisks to the left of the directory containing the
selected file and all the files in the directory, the selected directory and all the
files in the directory, or all the directories and files in the selected medium
disappear. The corresponding items will not be copied. At the same time, the
All Reset soft key changes to an All Set soft key.
ESC
12
ESC
Saving and Loading the Data
IM 760101-01E
12-33
12.11 Copying Files
Selecting the Copy Destination
12. Press the Dest Dir soft key. The copy execution menu and the copy destination
File List dialog box appears.
ESC
Selecting the copy destination medium or directory
13. Same as the procedures given in “Selecting the Save Destination Medium” and
“Selecting the Save Destination Directory” in section 12.6.
Executing the Copy Operation
14. Press the Copy Exec soft key. All the copy source files with asterisks are
copied.
ESC
12-34
IM 760101-01E
12.11 Copying Files
Explanation
CAUTION
Do not remove the medium (disk) or turn OFF the power when the access
indicator or
is blinking. Such acts can damage the medium or destroy the
data on the medium.
Selecting the Copy Source/Destination Medium and Directory
Same as the explanation given in “Selecting the Medium and Directory” in section 12.6.
Specifying the File to Be Displayed on the File List Dialog Box
Same as the explanation given in “Specifying the File to Be Displayed on the File List
Dialog Box” in section 12.9.
Properties
Same as the explanation given in “Properties” in section 12.9.
Selecting the File Attribute
Same as the explanation given in “Selecting the File Attribute” in section 12.9.
Note
•
•
•
•
IM 760101-01E
You cannot copy files if files with the same file name exist at the copy destination.
You cannot copy the same files to another directory after copying the files. Select the files to
be copied again and copy them.
When File Item is Wave, Data Type is Binary, and Filter is Item, copying a file with a .wvf
extension that has an asterisk causes the file with the same name with the .hdr extension to
also be copied. When Filter is All, only the files that have the asterisks are copied.
If an error occurs while copying multiple files, the files after the error occurrence are not
copied.
12-35
12
Saving and Loading the Data
Selecting the Copy Source Files
• By placing asterisks to the left of the file names, those files can be copied.
• There are two methods in selecting the files to be copied.
• Selecting the files one at a time
Press the Set/Reset soft key to place asterisks to the left of the files one at a time.
• Selecting the files at once
Press the All Set soft key to place asterisks to the left of the selected file names
at once. There are three methods in selecting the files at once.
• If you select a file and press the All Set soft key, asterisks are placed by the
directory containing the selected file and all the files in the directory.
• If you select a directory and press the All Set soft key, asterisks are placed by
the selected directory and all the files in the directory.
• If you select a medium and press the All Set soft key, asterisks are placed by
all the directories and files in the selected medium.
12.12 Renaming Directories and Files and Creating
Directories
Keys
SELE
CT
SET
RE
DISPLAY
HOLD
UP DATE
RATE
FILE
SINGLE
ESC
TRIG'D
WAVE
STORE
COPY
STORE SET
MENU
REMOTE
HARMONICS
CURSOR
LOCAL
MAX HOLD
MISC
NULL
SHIFT
To exit the menu during operation, press ESC.
INPUT
RANGE
SCALING
WIRING
AVG
MEASURE
MOTOR SET
FILTER
CAL
INTEGRATOR
START
STOP
INTEG SET
RESET
SYNC SRC
Procedure
1.
2.
3.
Press FILE to display the File menu.
Press the Utility soft key. The Utility menu and the File List dialog box appear.
Press the Function soft key to display the Function menu.
ESC
12-36
ESC
IM 760101-01E
12.12 Renaming Directories and Files and Creating Directories
Renaming a Directory or File
4.
Press the Rename soft key to display the Rename menu.
ESC
Selecting the Medium and Directory
5.
Same as the procedures given in “Selecting the Save Destination Medium” and
“Selecting the Save Destination Directory” in section 12.6.
Specifying the File to Be Displayed on the File List Dialog Box
6.
Same as the procedure given in “Specifying the File to Be Displayed on the File
List Dialog Box” in section 12.9.
Viewing the Properties
7.
Same as the procedure given in “Viewing the Properties” in section 12.9.
Changing the File Attribute
8.
Same as the procedure given in “Changing the File Attribute” in section 12.9.
Renaming a Directory or File
9.
Turn the jog shuttle to select a directory or file.
10. Press the File Name soft key to display the keyboard. The name of the
selected directory or file is displayed in the entry box of the keyboard.
11. Use the keyboard to enter the directory or file name.
12
Saving and Loading the Data
For keyboard operations, see section 3.12, “Entering Values and Strings.”
ESC
IM 760101-01E
ESC
12-37
12.12 Renaming Directories and Files and Creating Directories
Creating a Directory
4.
Press the MakeDir soft key to display the MakeDir menu.
ESC
Selecting the Medium and Directory
5.
Same as the procedures given in “Selecting the Save Destination Medium” and
“Selecting the Save Destination Directory” in section 12.6.
Specifying the File to Be Displayed on the File List Dialog Box
6.
Same as the procedure given in “Specifying the File to Be Displayed on the File
List Dialog Box” in section 12.9.
Viewing the Properties
7.
Same as the procedure given in “Viewing the Properties” in section 12.9.
Changing the File Attribute
8.
Same as the procedure given in “Changing the File Attribute” in section 12.9.
Creating a Directory
9.
Turn the jog shuttle to select a medium or directory.
10. Press the Dir Name soft key to display the keyboard.
11. Use the keyboard to enter the directory name.
For keyboard operations, see section 3.12, “Entering Values and Strings.”
ESC
12-38
ESC
IM 760101-01E
12.12 Renaming Directories and Files and Creating Directories
Explanation
CAUTION
Do not remove the medium (disk) or turn OFF the power when the access
indicator or
is blinking. Such acts can damage the medium or destroy the
data on the medium.
Selecting the Copy Source/Destination Medium and Directory
Same as the explanation given in “Selecting the Medium and Directory” in section 12.6.
Specifying the File to Be Displayed on the File List Dialog Box
Same as the explanation given in “Specifying the File to Be Displayed on the File List
Dialog Box” in section 12.9.
Properties
Same as the explanation given in “Properties” in section 12.9.
Selecting the File Attribute
Same as the explanation given in “Selecting the File Attribute” in section 12.9.
Renaming a Directory or File
The method in setting the name when renaming a directory or file is the same as the
explanation given in “File Name and Comment” in section 12.6.
Creating a Directory
You can create a new directory in the medium. The method in setting the name when
creating a directory is the same as the explanation given in “File Name and Comment”
in section 12.6.
Note
•
IM 760101-01E
You cannot change a directory attribute.
If a file with the same name already exists in the same directory, the file cannot be renamed.
If a directory with the same name already exists in the same directory, the directory cannot be
created.
When File Item is Wave, Data Type is Binary, and Filter is Item, renaming the name of the
selected file with a .WVF extension causes the file with the same name with the .HDR
extension to be changed. When Filter is All, the name of only the selected files is changed.
12-39
12
Saving and Loading the Data
•
•
•
Chapter 13 Ethernet Communications (Option)
13.1 Connecting the WT1600 to a PC
Network Connection
To connect to a network, connect a UTP (Unshielded Twisted-Pair) cable or an STP
(Shielded Twisted-Pair) cable that is connected to a hub, for example, to the 10BASE-T
port on the rear panel of the WT1600.
10BASE-T HUB or router
PC
UTP cable
or
STP cable
(straight)
WT1600
10BASE-T port
RJ-45 modular jack
NIC
One-to-One Connection
Even when connecting the WT1600 and a PC in a one-to-one configuration, connect
them via a hub as shown below.
10BASE-T HUB
or router
WT1600
PC
UTP
cable
or
STP
cable
(straight)
13
Note
•
•
IM 760101-01E
When connecting the WT1600 and a PC in a one-to-one configuration, use a 10BASE-T/
100BASE-TX auto switching NIC or a 10BASE-T NIC on the PC side.
Avoid connecting the WT1600 and a PC directly without going through a hub. Operations are
not guaranteed for communications using direct connection.
13-1
Ethernet Communications (Option)
NIC
13.2 Setting the Ethernet Interface (TCP/IP)
Keys
SELE
CT
SET
RE
DISPLAY
HOLD
UP DATE
RATE
FILE
SINGLE
ESC
TRIG'D
WAVE
STORE
COPY
STORE SET
MENU
REMOTE
HARMONICS
CURSOR
LOCAL
MAX HOLD
MISC
NULL
SHIFT
To exit the menu during operation, press ESC.
INPUT
RANGE
SCALING
WIRING
AVG
MEASURE
MOTOR SET
FILTER
CAL
INTEGRATOR
START
STOP
INTEG SET
RESET
SYNC SRC
Procedure
1.
2.
3.
Press MISC to display the Misc menu.
Press the Next 1/2 soft key to display the Next 2/2 menu.
Press the Network soft key to display the Network menu.
ESC
4.
ESC
Press the TCP/IP Setup soft key to display the TCP/IP Setup dialog box.
ESC
13-2
IM 760101-01E
13.2 Setting the Ethernet Interface (TCP/IP)
When Using Only DHCP
5.
6.
7.
8.
9.
Turn the jog shuttle to select DHCP.
Press SELECT to select ON.
Turn the jog shuttle to select DNS.
Press SELECT to display the DNS selection box.
Turn the jog shuttle to select OFF.
When Using Only DNS
5.
6.
Turn the jog shuttle to select DHCP.
Press SELECT to select OFF.
Entering the IP Address
7.
Turn the jog shuttle to select IP Address.
8.
Press SELECT to display the IP address entry box.
9.
Turn the jog shuttle to enter the IP address of the WT1600.
For the procedures on how to enter values using the jog shuttle, see section 3.12,
“Entering Values and Strings.”
10.
11.
Press SELECT or ESC to close the box.
Enter all four octets of the IP address.
Entering the Subnet Mask
Enter the subnet mask according to the system or network to which the WT1600
belongs. If the subnet mask is not required, proceed to “Entering the Default
Gateway.”
12. Turn the jog shuttle to select Net Mask.
13. Enter all four octets of the subnet mask of the network to which the WT1600
belongs in the same fashion as the IP address.
13
IM 760101-01E
13-3
Ethernet Communications (Option)
Entering the Default Gateway
Enter the default gateway according to the system or network to which the WT1600
belongs. If the default gateway is not required, proceed to “Turning ON the DNS.”
14. Turn the jog shuttle to select Gate Way.
15. Enter all four octets of the default gateway of the network to which the WT1600
belongs in the same fashion as the IP address.
13.2 Setting the Ethernet Interface (TCP/IP)
Turning ON the DNS
16. Turn the jog shuttle to select DNS.
17. Press SELECT to display the DNS selection box.
18. Turn the jog shuttle to select ON.
19. Press SELECT to confirm the DNS ON setting.
Entering the Domain Name
Enter the domain name of the system or network to which the WT1600 belongs.
20. Turn the jog shuttle to select Domain Name.
21. Press SELECT to display the keyboard.
22. Use the keyboard to enter the domain name of the network to which the
WT1600 belongs.
For keyboard operations, see section 3.12, “Entering Values and Strings.”
Entering the Address of the Primary DNS Server
23. Turn the jog shuttle to select DNS Server1.
24. Enter all four octets of the primary DNS server address in the same fashion as
the IP address.
Entering the Address of the Secondary DNS Server
Enter the information if the system or network to which the WT1600 belongs uses a
secondary DNS server. If a secondary server is not used, proceed to “Entering the
Primary Domain Suffix.”
25. Turn the jog shuttle to select DNS Server2.
26. Enter all four octets of the secondary DNS server address in the same fashion
as the IP address.
Entering the Primary Domain Suffix
Enter the information if a domain suffix is required.
27. Turn the jog shuttle to select Domain Suffix1.
28. Enter the primary domain suffix in the same fashion as the IP address.
Entering the Secondary Domain Suffix
Enter the information if a secondary domain suffix is present.
29. Turn the jog shuttle to select Domain Suffix2.
30. Enter the secondary domain suffix in the same fashion as the IP address.
13-4
IM 760101-01E
13.2 Setting the Ethernet Interface (TCP/IP)
When Using Both DHCP and DNS
5.
6.
7.
8.
9.
Turn the jog shuttle to select DHCP.
Press SELECT to select ON.
Turn the jog shuttle to select DNS.
Press SELECT to display the DNS selection box.
Turn the jog shuttle to select ON or Auto.
If you selected ON, you must enter information according to “Entering the
Domain Name” through “Entering the Secondary Domain Suffix” on the previous
page.
If you selected Auto, the entry information from “Entering the Domain Name” to
“Entering the Secondary Domain Suffix” is automatically set by the DHCP
server. Therefore, you do not have to enter the information.
Explanation
To use the Ethernet communication functions of the WT1600, DHCP, IP address, IP
address, subnet mask, default gateway, and DNS must be specified.
Consult your system or network administrator in setting these parameters.
DHCP (Dynamic Host Configuration Protocol)
• The IP address, subnet mask, default gateway, and DNS can be automatically
specified by using DHCP.
• To use DHCP, the network must have a DHCP server.
• Consult your network administrator to see if DHCP can be used.
• If you use DHCP, a different IP address may be assigned every time the WT1600
is powered up. You must be careful when using the FTP server function of the
WT1600.
IM 760101-01E
13-5
Ethernet Communications (Option)
IP Address (Internet Protocol Address)
• Enter the IP address assigned to the WT1600. The default setting is “0.0.0.0.”
• The IP address is used to uniquely identify a device on the Internet when using
TCP/IP. The address is a 32-bit value expressed using four octets (each 0 to 255),
each separated by a period as in [192.168.111.24].
• A unique IP address must be obtained from the network administrator.
• If DHCP can be used, the address is automatically assigned.
13
13.2 Setting the Ethernet Interface (TCP/IP)
Subnet Mask
• Enter the mask value used when determining the subnet network address from the
IP address. The default setting is “255.255.255.0.”
• Consult your network administrator for the appropriate value. You may not need to
set the value.
• If DHCP can be used, the subnet mask is automatically assigned.
Default Gateway
• Enter the IP address of the default gateway that is used when communicating with
other devices on a different segment (network unit). The default setting is “0.0.0.0.”
• Consult your network administrator for the appropriate value. You may not need to
set the value.
• If DHCP can be used, the default gateway is automatically assigned.
DNS (Domain Name System)
DNS is a system used to associate names used on the Internet called host names
and domain names to IP addresses. Given AAA.BBBBB.com, AAA is the host name
and BBBBB.com is the domain name. Instead of using the IP address, which is a
sequence of numbers, host name and domain name can be used to access the
network.
• Enter the domain name, the DNS server address, and the domain suffix. If DHCP
can be used, these values are automatically assigned.
• When accessing a network drive or a network printer from the WT1600, a name
can be used to access the destination rather than an IP address.
• Entering the domain name
• Enter the network domain name that the WT1600 belongs to.
• Enter up to 30 characters.
• The characters that can be used are 0-9, A-Z, %, _, ( ) (parenthesis), - (minus
sign).
• Entering the DNS server address
• Enter the IP address of the DNS server. The default setting is “0.0.0.0.”
• You can specify up to two DNS server addresses, primary and secondary.
When the primary DNS server is down, the secondary DNS server is
automatically looked up for the mapping of the host name/domain name and IP
address.
• Entering the Domain Suffix
• When the IP address corresponding to the server name with the domain name
specified in the previous section is not found, the system may be set up to
search using a different domain name. Enter this alternate domain name as the
domain suffix.
• You can specify up to two domain suffixes, primary and secondary.
Note
•
•
13-6
If you changed settings related to the Ethernet network, the WT1600 must be power cycled.
If the WT1600 is turned ON with the DHCP function enabled without an Ethernet cable
connected, communications and file functions may not operate properly. In this case, turn
DHCP OFF and power cycle the WT1600.
IM 760101-01E
13.2 Setting the Ethernet Interface (TCP/IP)
Configuring the TCP/IP Settings of the PC
Communication parameters such as the IP address must be specified also on the PC side.
Communication parameters are specified for each Ethernet NIC that is installed in the PC.
Here, the settings of the NIC required for connecting your PC and the WT1600 are explained.
If the IP address and other parameters are to be assigned dynamically using the DHCP
server, the following settings are not necessary.
Select Obtain an IP address automatically under the IP Address tab of the TCP/IP
Properties dialog box.
For example, if you are connecting a PC and the WT1600 to an independent Ethernet
network, you can specify parameters as indicated in the next table. For details on the
parameters, consult your system or network administrator.
Parameter
Value
Notes
IP address
Subnet mask
(Example) 192.168.21.128
(Example) 255.255.255.0
IP address for the PC
Set the same value as the subnet mask that
was specified for the WT1600.
Gateway
DNS
WINS
None
Not used
Not used
The following procedure describes the steps for Windows 95/98. If you are using Windows
NT/2000 Pro carry out equivalent steps according to your operating system.
1. Select Start > Settings > Control Panel. The Control Panel opens.
2. Double-click the Network icon to display the Network dialog box.
3. Select TCP/IP corresponding to the Ethernet NIC that is connected to your PC and click
Properties. The TCP/IP Properties dialog box appears.
13
4. Set the parameters such as the IP address according to the table above and click OK.
Ethernet Communications (Option)
IM 760101-01E
13-7
13.3 Saving Setup, Waveform Display, Numerical, and
Image Data to the FTP Server (FTP Client Function)
Keys
SELE
CT
SET
RE
DISPLAY
HOLD
UP DATE
RATE
FILE
SINGLE
ESC
TRIG'D
WAVE
STORE
COPY
STORE SET
MENU
REMOTE
HARMONICS
CURSOR
LOCAL
MAX HOLD
MISC
NULL
SHIFT
To exit the menu during operation, press ESC.
INPUT
RANGE
SCALING
WIRING
AVG
MEASURE
MOTOR SET
FILTER
CAL
INTEGRATOR
START
STOP
INTEG SET
RESET
SYNC SRC
Procedure
1.
2.
3.
Press MISC to display the Misc menu.
Press the Next 1/2 soft key to display the Next 2/2 menu.
Press the Network soft key to display the Network menu.
ESC
4.
ESC
Press the Net Drive Setup soft key to display the Net Drive Setup dialog box.
ESC
13-8
IM 760101-01E
13.3 Saving Setup, Waveform Display, Numerical, and Image Data to the FTP Server (FTP Client Function)
Specifying the Save Destination FTP Server
5.
Turn the jog shuttle to select FTP Server.
6.
Press SELECT to display the keyboard.
7.
Use the keyboard to enter the IP address of the FTP server. If you are using
DNS, you can specify the server by name.
For keyboard operations, see section 3.12, “Entering Values and Strings.”
Entering the Login Name and Password for Accessing the Save Destination FTP Server
8.
Turn the jog shuttle to select Login Name.
9.
Press SELECT to display the keyboard.
10. Use the keyboard to enter the login name.
For keyboard operations, see section 3.12, “Entering Values and Strings.”
11.
12.
13.
Turn the jog shuttle to select Password.
Press SELECT to display the keyboard.
Use the keyboard to enter the password. Password is not required if the login
name is anonymous.
For keyboard operations, see section 3.12, “Entering Values and Strings.”
Setting the Timeout Time
14. Turn the jog shuttle to select Time Out.
15. Press SELECT to display the timeout time selection box.
16. Turn the jog shuttle to set the timeout time.
For the procedures on how to enter values using the jog shuttle, see section 3.12,
“Entering Values and Strings.”
17.
Press SELECT or ESC to close the box.
Connecting to/Disconnecting from the Save Destination FTP Server
18. Turn the jog shuttle to select Connect or Disconnect.
19. Press SELECT.
•
•
If you select Connect and press SELECT, connection is established to the save
destination FTP server. When the connection is made,
is displayed at the upper
left corner of the screen.
If you select Disconnect and press SELECT, connection to the save destination FTP
server is dropped. The
displayed at the upper left corner of the screen disappears.
13
IM 760101-01E
13-9
Ethernet Communications (Option)
Saving the Data
• To save the setup parameters, waveform display data, or numerical data, carry out
the save operation according to the procedure given in section 12.6.
• To save the screen image data, carry out the save operation according to the
procedure given in section 12.7.
• However, for the procedure “Selecting the Save Destination Medium” on page 1214, select ND0 for the medium.
13.3 Saving Setup, Waveform Display, Numerical, and Image Data to the FTP Server (FTP Client Function)
Explanation
The FTP client function of the WT1600 can be used to save the setup parameters, waveform
display data, numerical data, and screen image data to an FTP server on the network in a similar
fashion to saving the various data on a floppy disk or the built-in hard disk.
Save Destination FTP Server
• Specify the FTP server by entering the IP address.
• If you are using DNS (see section 13.2), you can specify the server by name.
• The FTP server program must be running on the PC or workstation that is to
become the save destination FTP server. In addition, the following points need
attention regarding the server program settings.
• Set the list output (string returned by the dir command) to UNIX format.
• Set the home directory and its subdirectories to allow writing.
• The client cannot move above the home directory.
• The newest file is not necessarily displayed at the top of the file list.
• Files and directories that are longer than 8 characters cannot be accessed.
• Depending on the server, “<..>” that indicates a higher directory may not be displayed.
• The time information in the file list will not be displayed correctly for the following cases.
• On Windows NT when the time stamp is displayed using am and pm.
• Servers that return characters other than ASCII characters in the list
• The following operations are not possible from the WT1600 on files that have been
saved on an FTP server.
• Enabling/Disabling file protection, copying, and renaming
• Formatting the FTP server medium
Entering the Login Name and Password
Enter the login name and password for accessing the save destination FTP server.
• Login name
• Enter up to 15 characters.
• The characters that can be used are 0-9, A-Z, %, _, ( ) (parenthesis), - (minus sign).
• Password
• Enter up to 15 characters.
• The characters that can be used are 0-9, A-Z, %, _, ( ) (parenthesis), - (minus sign).
Setting the Timeout Time
When an FTP server is accessed from the WT1600 and connection cannot be
established after a certain period of time (timeout time), the WT1600 decides that the
connection to the FTP server is not possible and closes the connection.
Select the value in the range of 0 to 3600 s. The default value is 15 s.
Note
•
•
•
•
13-10
The FTP client function cannot be used under the following cases.
• When the WT1600 is being accessed by a PC or workstation on the network (FTP server
function, see section 13.6).
• When the WT1600 is performing file operations (see chapter 12).
When using the FTP client function, set the TCP/IP parameters according to section 13.2,
“Setting the Ethernet Interface (TCP/IP).”
To apply new settings that are made while the connection is up, drop the connection using
Disconnect and reconnect.
If a connection is dropped by the server while you are operating the FTP client, the
connection will be automatically reestablished when you display the File List dialog box
through file operation.
IM 760101-01E
13.4 Outputting the Screen Image to a Network
Printer
Keys
SELE
CT
SET
RE
DISPLAY
HOLD
UP DATE
RATE
FILE
SINGLE
ESC
TRIG'D
WAVE
STORE
COPY
STORE SET
MENU
REMOTE
HARMONICS
CURSOR
LOCAL
MAX HOLD
MISC
NULL
SHIFT
To exit the menu during operation, press ESC.
INPUT
RANGE
SCALING
WIRING
AVG
MEASURE
MOTOR SET
FILTER
CAL
INTEGRATOR
START
STOP
INTEG SET
RESET
SYNC SRC
Procedure
1.
2.
3.
Press MISC to display the Misc menu.
Press the Next 1/2 soft key to display the Next 2/2 menu.
Press the Network soft key to display the Network menu.
ESC
ESC
13
Press the Net Print Setup soft key to display the Net Print Setup dialog box.
ESC
IM 760101-01E
13-11
Ethernet Communications (Option)
4.
13.4 Outputting the Screen Image to a Network Printer
Specifying the Printer Server
5.
Turn the jog shuttle to select LPR Server.
6.
Press SELECT to display the keyboard.
7.
Use the keyboard to enter the IP address of the printer server. If you are using
DNS, you can specify the server by name.
For keyboard operations, see section 3.12, “Entering Values and Strings.”
Entering the Printer Name
8.
Turn the jog shuttle to select LPR Name.
9.
Press SELECT to display the keyboard.
10. Use the keyboard to enter the printer name.
For keyboard operations, see section 3.12, “Entering Values and Strings.”
Setting the Output Destination to a Network Printer
1.
Press SHIFT+COPY (MENU) to display the Copy menu.
2.
Press the Copy to soft key to display the Copy to menu.
3.
Press the Net Print soft key.
Selecting the Output Command
4.
Press the Format soft key to display the Format menu.
5.
Press one of the soft keys from ESC-P to Post Script to select the output
format.
If you selected BJ, proceed to step 6.
If you selected ESC-P, ESC-P2, or PCL5, proceed to step 8 on the next page.
If you selected LIPS3 or Post Script, proceed to step 9 on the next page.
ESC
13-12
ESC
ESC
ESC
IM 760101-01E
13.4 Outputting the Screen Image to a Network Printer
Selecting the Resolution
(This procedure is applicable if you selected BJ in step 5.)
6.
Press the Resolution soft key to display the Resolution menu.
7.
Select one of 180dpi to 360dpi soft keys to select the resolution.
Turning ON/OFF the Color Output
(This procedure is applicable if you selected ESC-P, ESC-P2, BJ, or PCL5 in step 5.)
8.
Press the Color soft key to select ON or OFF.
Setting Comments
9.
Press the Comment soft key. A keyboard appears.
10. Use the keyboard to enter the comment.
For keyboard operations, see section 3.12, “Entering Values and Strings.”
ESC
ESC
ESC
Executing the Output Operation
11. Switch to the screen you wish to output.
12. Press COPY. The screen image is output.
Canceling the Output Operation
13. Press the Abort soft key in the Copy menu.
ESC
13
Ethernet Communications (Option)
IM 760101-01E
13-13
13.4 Outputting the Screen Image to a Network Printer
Explanation
The LPR client function of the WT1600 can be used to output screen images to a
network printer in the same fashion as outputting the image on a floppy disk or the builtin hard disk.
Printer Server
• Specify the printer server by entering the IP address.
• If you are using DNS (see section 13.2), you can specify the server by name.
Printer Name
Enter the name of the output destination printer on the network.
Selecting the Output Command
Select the output command type from the following list of choices.
• ESC-P
• ESC-P2 (for printers that support ESC/P raster commands)
• BJ
• PCL5
• LIPS3
• Post Script
Turning ON/OFF the Color Output
You can select whether to output the image in color when the output command type is
ESC-P, ESC-P2, BJ, or PCL5.
• ON
The displayed screen image can be output to a printer in color (256 colors).
• OFF
The displayed screen image can be output to a printer in black and white.
Setting Comments
Same as the explanation given in “File Name and Comment” in section 12.6.
Note
•
•
•
13-14
The LPR client function cannot be used under the following cases.
• When the WT1600 is being accessed by a PC or workstation on the network (FTP server
function, see section 13.6).
• When the WT1600 is performing file operations (see chapter 12).
When using the LPR client function, set the TCP/IP parameters according to section 13.2,
“Setting the Ethernet Interface (TCP/IP).”
Output is possible to printers that support the TCP/IP protocol.
IM 760101-01E
13.5 Sending E-mail Messages
Keys
SELE
CT
SET
RE
DISPLAY
HOLD
UP DATE
RATE
FILE
SINGLE
ESC
TRIG'D
WAVE
STORE
COPY
STORE SET
MENU
REMOTE
HARMONICS
CURSOR
LOCAL
MAX HOLD
MISC
NULL
SHIFT
To exit the menu during operation, press ESC.
INPUT
RANGE
SCALING
WIRING
AVG
MEASURE
MOTOR SET
FILTER
CAL
INTEGRATOR
START
STOP
INTEG SET
RESET
SYNC SRC
Procedure
1.
2.
3.
Press MISC to display the Misc menu.
Press the Next 1/2 soft key to display the Next 2/2 menu.
Press the Network soft key to display the Network menu.
ESC
ESC
13
Ethernet Communications (Option)
4.
Press the Mail Setup soft key to display the Mail Setup dialog box.
ESC
IM 760101-01E
13-15
13.5 Sending E-mail Messages
Specifying the Mail Server
5.
Turn the jog shuttle to select Mail Server.
6.
Press SELECT to display the keyboard.
7.
Use the keyboard to enter the IP address of the mail server. If you are using
DNS, you can specify the server by name.
For keyboard operations, see section 3.12, “Entering Values and Strings.”
Entering the Destination Mail Address
8.
Turn the jog shuttle to select Mail Address.
9.
Press SELECT to display the keyboard.
10. Use the keyboard to enter the destination mail address.
For keyboard operations, see section 3.12, “Entering Values and Strings.”
Setting Comments
(Enter a comment as necessary.)
11. Turn the jog shuttle to select Comment.
12. Press SELECT to display the keyboard.
13. Use the keyboard to enter the comment.
For keyboard operations, see section 3.12, “Entering Values and Strings.”
Setting the Time of Transmission
14. Turn the jog shuttle to select one of the hour, minute, and second boxes of
MailBaseTime.
15. Press SELECT to display the entry box.
16. Turn the jog shuttle to set the hour, minute, or second that you selected in step 14.
For the procedures on how to enter values using the jog shuttle, see section 3.12,
“Entering Values and Strings.”
17.
18.
13-16
Press SELECT or ESC to close the box.
Repeat steps 14 to 17 to set hour, minute, and second.
IM 760101-01E
13.5 Sending E-mail Messages
Selecting the Transmission Interval
19. Turn the jog shuttle to select Interval.
20. Press SELECT to display the selection box.
21. Turn the jog shuttle to select OFF or 1h to 24h.
If you select OFF, mails are not transmitted.
22.
Press SELECT or ESC to close the box.
Performing a Test Transmission
23. Turn the jog shuttle to select Mail Test.
24. Press SELECT to send a test mail to the destination.
Explanation
The condition of the WT1600 can be sent in e-mail messages at a certain interval to a
specified mail destination.
Mail Server
• Specify the mail server by entering the IP address.
• If you are using DNS (see section 13.2), you can specify the server by name.
Recipient Mail Address
Enter the mail address of the device that is to receive the messages sent by the
WT1600.
Setting Comments
Same as the explanation given in “File Name and Comment” in section 12.6.
Setting the Time of Transmission
• Specify the time to start transmitting the e-mail messages.
• Set the time in units of hour : minute : second in the following range.
0:0:0 to 23:59:59
13
IM 760101-01E
13-17
Ethernet Communications (Option)
Selecting the Transmission Interval
• Specify the interval for transmitting the e-mail messages.
• You can select from the following list of choices. If you select OFF, mails are not
transmitted.
OFF, 1h, 2h, 3h, 4h, 6h, 8h, 12h, and 24h
13.5 Sending E-mail Messages
Transmitted Information of the WT1600
The numerical data from numbers 1 to 100 of the menu items (Norm Item No. during
normal measurement, Harm Item No. during harmonic measurement) that are
displayed when Format (display format) under the Display menu is set to Numeric is
transmitted.
Note
•
•
•
13-18
When using the SMTP client function, set the TCP/IP parameters according to section 13.2,
“Setting the Ethernet Interface (TCP/IP).”
The sender (From) address of the e-mail messages sent by the WT1600 is the same as the
specified recipient address.
When the transmission interval is set to “OFF,” mail messages cannot be transmitted.
IM 760101-01E
13.6 Accessing the WT1600 from a PC or
Workstation (FTP Server Function)
Keys
SELE
CT
SET
RE
DISPLAY
HOLD
UP DATE
RATE
FILE
SINGLE
ESC
TRIG'D
WAVE
STORE
COPY
STORE SET
MENU
REMOTE
HARMONICS
CURSOR
LOCAL
MAX HOLD
MISC
NULL
SHIFT
To exit the menu during operation, press ESC.
INPUT
RANGE
SCALING
WIRING
AVG
MEASURE
MOTOR SET
FILTER
CAL
INTEGRATOR
START
STOP
INTEG SET
RESET
SYNC SRC
Procedure
1.
2.
3.
Press MISC to display the Misc menu.
Press the Next 1/2 soft key to display the Next 2/2 menu.
Press the Network soft key to display the Network menu.
ESC
ESC
13
Ethernet Communications (Option)
4.
Press the User Account soft key to display the User Account dialog box.
ESC
IM 760101-01E
13-19
13.6 Accessing the WT1600 from a PC or Workstation (FTP Server Function)
Setting the User Name
5.
Turn the jog shuttle to select User Name.
6.
Press SELECT to display the keyboard.
7.
Use the keyboard to enter the user name.
•
•
For keyboard operations, see section 3.12, “Entering Values and Strings.”
When not restricting the access, specify anonymous. If you specify anonymous, you
do not have to set the password.
Setting the Password
(If you set user name to anonymous in step 7, you do not have to set the password.)
8.
Turn the jog shuttle to select Password.
9.
Press SELECT to display the keyboard.
10. Use the keyboard to enter the password.
For keyboard operations, see section 3.12, “Entering Values and Strings.”
Setting the Timeout Time
11. Turn the jog shuttle to select Time Out.
12. Press SELECT to display the timeout time selection box.
13. Turn the jog shuttle to set the timeout time.
For the procedures on how to enter values using the jog shuttle, see section 3.12,
“Entering Values and Strings.”
14.
Press SELECT or ESC to close the box.
Accessing the WT1600
15. Execute an FTP client software on the PC or workstation.
16. Access the WT1600 using the user name and password specified in the
previous section.
13-20
IM 760101-01E
13.6 Accessing the WT1600 from a PC or Workstation (FTP Server Function)
Displaying the Logging List
17. Press the Connect Log List soft key to display the access log of the WT1600.
ESC
Explanation
The floppy disk, built-in hard disk, and SCSI devices connected via SCSI (option) of the
WT1600 can be accessed from a PC or workstation (WS) on the network.
To access the WT1600, an FTP client software is needed on the PC or workstation.
Setting the User Name
• Enter the user name to allow access to the WT1600.
• Enter up to 15 characters.
• The characters that can be used are 0-9, A-Z, %, _, ( ) (parenthesis), - (minus
sign).
• If you specify anonymous, the WT1600 can be accessed from the outside (PC or
WS) without a password.
Setting the Password
• Enter the password for the user name to allow access to the WT1600
• Enter up to 15 characters.
• The characters that can be used are 0-9, A-Z, %, _, ( ) (parenthesis), - (minus
sign).
• If the user name is set to anonymous, the WT1600 can be accessed from the
outside (PC or WS) without a password.
13
Logging List
The access log of the WT1600 can be displayed. The data and time, user name, and
IP address of the 25 recent accesses are displayed.
IM 760101-01E
13-21
Ethernet Communications (Option)
Setting the Timeout Time
The WT1600 closes the connection to the network if there is no access for a certain
period of time (timeout time).
Select the value in the range of 0 to 3600 s. The default value is 60 s.
13.6 Accessing the WT1600 from a PC or Workstation (FTP Server Function)
Note
•
•
•
•
•
•
•
13-22
The WT1600 supports only a single client.
When the WT1600 is accessed from the PC or workstation (login),
is displayed at the
upper left corner of the screen.
The FTP server function cannot be used under the following cases.
• When the WT1600 is accessing a PC or workstation on the network (FTP client function,
see section 13.3).
• When the WT1600 is outputting to a network printer (LPR client function, see section 13.3)
• When the WT1600 is performing file operations (see chapter 12).
In the root directory of the PC or workstation accessing the WT1600, the floppy disk is
displayed as [FD0], the built-in hard disk as [SC4_00][SC4_01][SC4_02][SC4_03][SC4_04],
the network drive as [ND0], other drives connected via SCSI as [SCn] (where n is the SCSI
ID), and so on.
The logging list is cleared when the power is turned OFF.
When using the FTP server function, set the TCP/IP parameters according to section 13.2,
“Setting the Ethernet Interface (TCP/IP).”
To apply new settings, the WT1600 must be power cycled.
IM 760101-01E
13.7 Checking the Presence of the Ethernet
Interface (Option) and the MAC address
Keys
SELE
CT
SET
RE
DISPLAY
HOLD
UP DATE
RATE
FILE
SINGLE
ESC
TRIG'D
WAVE
STORE
COPY
STORE SET
MENU
REMOTE
LOCAL
HARMONICS
CURSOR
MAX HOLD
MISC
NULL
SHIFT
To exit the menu during operation, press ESC.
INPUT
RANGE
SCALING
WIRING
AVG
MEASURE
MOTOR SET
FILTER
CAL
INTEGRATOR
START
STOP
INTEG SET
RESET
SYNC SRC
Procedure
1.
2.
Press MISC to display the Misc menu.
Press the Information soft key to display the Information window.
The presence of the Ethernet interface (option) and the MAC address information are
displayed in the Information window.
ESC
13
The Presence of the Ethernet Interface (Option)
The presence of the Ethernet interface is displayed under Ethernet in the Information window.
• If Yes is displayed, the Ethernet interface is installed.
• If No is displayed, the Ethernet interface is not installed.
MAC Address
MAC address is a unique address that is pre-assigned to the WT1600. The MAC
address is displayed under Mac Address in the Information window.
Note
The MAC address is displayed only on products with the Ethernet interface. If the MAC
address appears as xxxxxx_xxx_xxx even when the Ethernet Interface is installed, then
contact your nearest YOKOGAWA dealer.
IM 760101-01E
13-23
Ethernet Communications (Option)
Explanation
13.8 Setting the FTP Passive Mode and LPR/SMTP
Timeout
Keys
SELE
CT
SET
RE
DISPLAY
HOLD
UP DATE
RATE
FILE
SINGLE
ESC
TRIG'D
WAVE
STORE
COPY
STORE SET
MENU
REMOTE
HARMONICS
CURSOR
LOCAL
MAX HOLD
MISC
NULL
SHIFT
To exit the menu during operation, press ESC.
INPUT
RANGE
SCALING
WIRING
AVG
MEASURE
MOTOR SET
FILTER
CAL
INTEGRATOR
START
STOP
INTEG SET
RESET
SYNC SRC
Procedure
1.
2.
3.
Press MISC to display the Misc menu.
Press the Next 1/2 soft key to display the Next 2/2 menu.
Press the Network soft key to display the Network menu.
ESC
4.
ESC
Press the Others soft key to display the Others dialog box.
ESC
13-24
IM 760101-01E
13.8 Setting the FTP Passive Mode and LPR/SMTP Timeout
Turning ON/OFF the FTP Passive Mode
5.
Turn the jog shuttle to select FTP Passive.
6.
Press SELECT to select ON or OFF.
Setting the LPR Timeout Time
5.
Turn the jog shuttle to select LPR Time Out.
6.
Press SELECT to display the timeout time selection box.
7.
Turn the jog shuttle to set the timeout time.
For the procedures on how to enter values using the jog shuttle, see section 3.12,
“Entering Values and Strings.”
8.
Press SELECT or ESC to close the box.
Setting the SMPT Timeout Time
5.
Turn the jog shuttle to select SMTP Time Out.
6.
Press SELECT to display the timeout time selection box.
7.
Turn the jog shuttle to set the timeout time.
For the procedures on how to enter values using the jog shuttle, see section 3.12,
“Entering Values and Strings.”
8.
Press SELECT or ESC to close the box.
Explanation
Enters special settings related to the FTP client, LPR, and SMTP. Normally, these
parameters do not need to be specified.
Turning ON/OFF the FTP Passive Mode
Turn this function ON when using the WT1600 behind a firewall* that requires the
passive mode. The default setting is OFF.
*
A firewall is furnished on a system that has security features. It prevents intrusion from the
outside into the network system.
Setting the SMTP* Timeout Time
When a mail server is accessed from the WT1600 and connection cannot be
established after a certain period of time (timeout time), the WT1600 decides that the
connection to the mail server is not possible and closes the connection.
Select the value in the range of 0 to 3600 s. The default value is 15 s.
*
IM 760101-01E
SMTP (Simple Mail Transfer Protocol) is a protocol that resides above the TCP/IP layer and
is used by the e-mail transmission system.
13-25
13
Ethernet Communications (Option)
Setting the LPR Timeout Time
The WT1600 closes the connection to the printer if there is no response from the
printer for a certain period of time (timeout time) when it accesses the printer.
Select the value in the range of 0 to 3600 s. The default value is 15 s.
Chapter 14 Built-in Printer (Option)
14.1 Installing the Paper Roll and Paper Feeding
Keys
SELE
CT
SET
RE
DISPLAY
HOLD
UP DATE
RATE
FILE
SINGLE
ESC
TRIG'D
WAVE
STORE
COPY
STORE SET
MENU
REMOTE
LOCAL
HARMONICS
CURSOR
MAX HOLD
MISC
NULL
SHIFT
PUSH
INPUT
RANGE
SCALING
WIRING
AVG
MEASURE
MOTOR SET
FILTER
CAL
INTEGRATOR
START
STOP
INTEG SET
RESET
To exit the menu during operation, press ESC.
SYNC SRC
Procedure
1.
Press the section marked as PUSH on the printer cover. The printer cover
opens.
Printer cover
2.
Pull up on the release lever to the FREE position (vertical).
Release lever
14
FREE
Built-in Printer (Option)
MAN
FEED
HOLD
Roll pocket
IM 760101-01E
14-1
14.1 Installing the Paper Roll and Paper Feeding
3.
With approximately 13 cm of the roll paper unrolled, place the roll paper in the
roll pocket in the direction indicated by the figure below.
4.
Insert the roll paper evenly under the paper roller and move the release lever to
the HOLD position (horizontal).
If you reverse the direction in which the roll paper is placed, nothing will be printed.
Release lever
Roller
FREE
MAN
FEED
HOLD
Roll paper
5.
6.
7.
8.
Roll pocket
Press SHIFT+COPY (MENU) to display the Copy menu.
Press the Copy to soft key to display the Copy to menu.
Press the Printer soft key.
Press the Paper Feed soft key. Each time the soft key is pressed, the roll paper
is fed approximately 2 cm. Feed the roll paper until approximately 10 cm of
paper is showing at the top of the paper roller.
Check that there are no slacks in the roll paper and that the roll paper is inside the roll
pocket.
ESC
ESC
ESC
Roller
Roll paper
Roll pocket
Press the Paper Feed soft key to take up
the slack in the paper.
14-2
Align the left and right edges of the paper as it
exits the printer so that they are even with the
sides of the roll.
IM 760101-01E
14.1 Installing the Paper Roll and Paper Feeding
9.
Insert the roll paper that is showing in the slit of the printer cover.
Slit in the
printer cover
10.
Close the printer cover. Firmly press the section marked as PUSH until it
clicks in place.
Printer cover
14
Built-in Printer (Option)
IM 760101-01E
14-3
14.1 Installing the Paper Roll and Paper Feeding
Explanation
Printer Roll Paper
Use only the dedicated roll paper provided by YOKOGAWA. When using the printer
for the first time, use the roll paper that is included in the package. Order extra rolls
from your nearest YOKOGAWA dealer.
Part No.
B9316FX
Specifications
Thermal-sensitive paper, 10 m
Sales unit
10 rolls
Handling Precautions of the Roll Paper
The paper is a thermal-sensitive paper that changes color with the application of heat.
Take note of the following points.
• Storage precautions
The paper starts changing color at around 70°C. It is affected by heat, humidity,
light, and chemicals regardless of whether the paper has been used of not.
• Store the paper in a cool, dry, and dark place.
• After opening the package, use it quickly.
• If the paper is left in contact with plastic film (such as a vinyl chloride film or
Scotch tape) containing plasticizers for an extended time, the paper will lose
some of its ability to reproduce color. If you are going to store the paper in a
folder, for example, use a folder made of polypropylene.
• When using glue on the paper, do not use a glue containing organic solvents
such as alcohol or ether, as they will change the color of the paper.
• For prolonged storage, we suggest you copy the roll chart. Due to the
characteristics of the thermal-sensitive paper, the recording section may lose
color over time.
• Precautions on Use
• Use only genuine paper rolls provided by YOKOGAWA.
• Touching the paper with sweaty hands can leave finger print marks or blur the
printing.
• Rubbing the surface with a hard object can cause the paper to change color due
to the heat caused by friction.
• Outputting If chemicals, oil, or other liquids come in contact with the paper, the
paper may change color or the printing may fade.
Note
•
•
•
•
14-4
To cut the paper after the paper roll is installed and the printer cover is closed, pull the roll
paper upward against the cover.
If you open the printer cover immediately after you cut the roll paper, repeat steps 5 to 10.
After installing the roll paper and closing the printer cover, check that the paper is being fed
correctly by carrying out step 8. If the paper is not being fed evenly, continue to feed the
paper for approximately 30 cm. The paper will straighten out.
If you reverse the direction in which the roll paper is placed, the printer head does not make
contact with the thermal-sensitive surface. Hence, nothing will be printed.
IM 760101-01E
14.2 Printing Screen Images
Keys
SELE
CT
SET
RE
DISPLAY
HOLD
UP DATE
RATE
FILE
SINGLE
ESC
TRIG'D
WAVE
STORE
COPY
STORE SET
MENU
REMOTE
HARMONICS
CURSOR
LOCAL
MAX HOLD
MISC
NULL
SHIFT
To exit the menu during operation, press ESC.
INPUT
RANGE
SCALING
WIRING
AVG
MEASURE
MOTOR SET
FILTER
CAL
INTEGRATOR
START
STOP
INTEG SET
RESET
SYNC SRC
Procedure
1.
2.
3.
Press SHIFT+COPY (MENU) to display the Copy menu.
Press the Copy to soft key to display the Copy to menu.
Press the Printer soft key.
Setting Comments
4.
Press the Comment soft key to display the keyboard.
5.
Use the keyboard to enter the comment.
For keyboard operations, see section 3.12, “Entering Values and Strings.”
ESC
ESC
ESC
ESC
14
Built-in Printer (Option)
IM 760101-01E
14-5
14.2 Printing Screen Images
Executing the Print Operation
6.
Switch to the screen you wish to print.
7.
Press COPY to print the screen image.
Aborting the Print Operation
8.
Press the Abort soft key in the Copy menu.
ESC
Explanation
The screen image can be printed on the built-in printer (option).
Setting Comments
The comment that you entered is displayed at the bottom of the screen. The
comment on the screen is also printed as a screen image.
Number of Characters and Types That Can Be Used
Item
Number of Characters
Characters That Can Be Used
Comment
0 to 25* characters
Characters that are displayed on the keyboard and spaces
*
14-6
You can enter up to 25 characters for the comment, but only the first 20 characters are
displayed on the screen.
IM 760101-01E
14.3 Printing Numerical Data Lists and Bar Graphs
Keys
SELE
CT
SET
RE
DISPLAY
HOLD
UP DATE
RATE
FILE
SINGLE
ESC
TRIG'D
WAVE
STORE
COPY
STORE SET
MENU
REMOTE
HARMONICS
CURSOR
LOCAL
MAX HOLD
MISC
NULL
SHIFT
To exit the menu during operation, press ESC.
INPUT
RANGE
SCALING
WIRING
AVG
MEASURE
MOTOR SET
FILTER
CAL
INTEGRATOR
START
STOP
INTEG SET
RESET
SYNC SRC
Procedure
1.
2.
3.
Press SHIFT+COPY (MENU) to display the Copy menu.
Press the Copy to soft key to display the Copy to menu.
Press the Printer soft key.
ESC
ESC
Printing or Not Printing (ON/OFF) the Header Information
4.
Press the Information soft key to select ON or OFF.
14
Built-in Printer (Option)
ESC
IM 760101-01E
14-7
14.3 Printing Numerical Data Lists and Bar Graphs
During Normal Measurement
5.
Press the List Item soft key to display the List Item dialog box.
Selecting the Numerical Data to Be Printed
• Selecting the items at once
6.
Turn the jog shuttle to select All ON.
7.
Press SELECT. The buttons to the left of all the elements and measurement
functions are highlighted indicating that all items will be printed.
• Deselecting all the items at once
6.
Turn the jog shuttle to select All OFF.
7.
Press SELECT. The highlighting of the buttons to the left of all the elements and
measurement functions are cleared indicating that all items will not be printed.
ESC
• Selecting only the items that are preset
6.
Turn the jog shuttle to select Preset1 or Preset2.
7.
Press SELECT. The buttons to the left of all the elements and measurement
functions that are specified in Preset1 or Preset 2 are highlighted indicating that
the items will be printed.
Items specified in Preset1
Items specified in Preset2
• Setting the items one at a time
6.
Turn the jog shuttle to select the element or measurement function that you
wish to specify.
7.
Press SELECT. When the button to the left of the selected element or
measurement function is highlighted, the numerical data of the measurement
function of the element will be printed. When the highlighting of the button is
cleared, the numerical data of the measurement function of the element will not
be printed.
Proceed to step 10.
14-8
IM 760101-01E
14.3 Printing Numerical Data Lists and Bar Graphs
During Harmonic Measurement
5.
Press the List Item soft key to display the List Item dialog box.
Selecting the Numerical Data to Be Printed
6.
Turn the jog shuttle to select Numeric/Bar.
7.
Press SELECT to select Numeric.
8.
Turn the jog shuttle to select the element or measurement function that you
wish to specify.
9.
Press SELECT. When the button to the left of the selected element or
measurement function is highlighted, the numerical data of the measurement
function of the element will be printed. When the highlighting of the button is
cleared, the numerical data of the measurement function of the element will not
be printed.
Selecting the Bar Graph to Be Printed
6.
Turn the jog shuttle to select Numeric/Bar.
7.
Press SELECT to select Bar.
8.
Turn the jog shuttle to select the element or measurement function that you
wish to specify.
9.
Press SELECT. When the button to the left of the selected element or
measurement function is highlighted, the numerical data of the measurement
function of the element will be printed. When the highlighting of the button is
cleared, the numerical data of the measurement function of the element will not
be printed.
ESC
14
Built-in Printer (Option)
IM 760101-01E
14-9
14.3 Printing Numerical Data Lists and Bar Graphs
Executing/Aborting the Print Operation
10.
Press ESC to close the List Item dialog box.
Executing the Print Operation
11. Press the Print Data List Exec soft key. The numerical data list is printed.
Aborting the Print Operation
12. Press the Abort soft key in the Copy menu.
ESC
Explanation
During Normal Measurement
Header Information
• Only installed elements are applicable for the selection.
• The following items are available as header information.
• Measurement mode (Normal)
• Data update rate
• Date, time
• Measurement range of each element
Turning ON/OFF Header Information Printing
• ON: Prints the header information.
• ON: Does not print the header information.
Selecting the Numerical Data
• Only installed elements and wiring units are applicable for the selection.
• The numerical data can be selected from the items that are indicated in
“Measurement Function Types during Normal Measurement” and “Measurement
Function Types for Motor Evaluation Function (Option)” in section 1.2; “Delta
Computation,” “User-Defined Functions,” and “Corrected Power” in section 1.5; and
“Measurement Functions of Integration” in section 1.6.
Print Format of the Numerical Data List
• The selected numerical data items are printed.
• Prints a list consisting of elements in the horizontal direction and measurement
functions in the vertical direction.
14-10
IM 760101-01E
14.3 Printing Numerical Data Lists and Bar Graphs
During Harmonic Measurement
Header Information
• Only installed elements are applicable for the selection.
• The following items are available as header information.
• Measurement mode (Harmonics)
• Date, time
• PLL Source
• fU, fI
• Phase difference of the fundamental wave (φU1-U2, φU1-U3, φU1-I1, φU1-I2,
and φU1-I3)
• Measurement range of each element
• Total of U, I, P, S, Q, λ, and φ of each element
• Uthd, Ithd, Pthd, Uthf, Ithf, Utif, Itif, hvf, and hcf of each element
Turning ON/OFF Header Information Printing
• ON: Prints the header information.
• OFF: Does not print the header information.
Selecting Numerical Data and Bar Graph
You can select numerical data or bar graph to be printed.
• Only installed elements are applicable for the selection.
• The numerical data can be selected from U (including Uhdf), I (including Ihdf), P
(including Phdf), S, Q, λ, φ, φU, φI, Z, Rs, Xs, Rp, Xp, and ΣList.
• The bar graph can be selected from U, I, P, S, Q, λ, φ, φU, φI, Z, Rs, Xs, Rp, Xp,
Uhdf, Ihdf, and Phdf.
• The range of harmonic order is the range specified by Min Order and Max Order in
section 7.5.
Print Format of Numerical Data Lists and Bar Graphs
• The selected numerical data or bar graph items are printed.
• Prints a list consisting of elements and measurement functions in the horizontal
direction and harmonic order in the vertical direction.
14
Built-in Printer (Option)
IM 760101-01E
14-11
Chapter 15 D/A Output and Other Functions
15.1 Setting the D/A Output (Option)
Keys
SELE
CT
SET
RE
DISPLAY
HOLD
UP DATE
RATE
FILE
SINGLE
ESC
TRIG'D
WAVE
STORE
COPY
STORE SET
MENU
REMOTE
HARMONICS
CURSOR
LOCAL
MAX HOLD
MISC
NULL
SHIFT
To exit the menu during operation, press ESC.
INPUT
RANGE
SCALING
WIRING
AVG
MEASURE
MOTOR SET
FILTER
CAL
INTEGRATOR
START
STOP
INTEG SET
RESET
SYNC SRC
Procedure
1.
2.
3.
Press MISC to display the Misc menu.
Press the Next 1/2 soft key to display the Next 2/2 menu.
Press the D/A Output Items soft key to display the D/A Output menu.
ESC
ESC
D/A Output and Other Functions
15
IM 760101-01E
15-1
15.1 Setting the D/A Output (Option)
Setting the D/A Output Items during Normal Measurement
Selecting the Target Channel
4.
Turn the jog shuttle to select 1 to 30.
Selecting the Measurement Function
5.
Press the Function soft key to display the measurement function selection box.
6.
Turn the jog shuttle to select any of the measurement function starting with
None.
7.
Press SELECT to confirm.
Selecting the Element/Wiring Unit
8.
Press the Element soft key to display the element/wiring unit selection box.
9.
Turn the jog shuttle to select any of the elements/wiring units starting with
Element1.
10. Press SELECT to confirm.
Proceed to step 14.
ESC
15-2
ESC
ESC
IM 760101-01E
15.1 Setting the D/A Output (Option)
Setting the D/A Output Items during Harmonic Measurement
Selecting the Target Channel
4.
Press the Harm Item No. soft key.
5.
Turn the jog shuttle to select 1 to 30.
Selecting the Measurement Function
6.
Press the Function soft key to display the measurement function selection box.
7.
Turn the jog shuttle to select any of the measurement function starting with
None.
8.
Press SELECT to confirm.
Selecting the Element/Wiring Unit
9.
Press the Element soft key to display the element/wiring unit selection box.
10. Turn the jog shuttle to select any of the elements/wiring units starting with
Element1.
11. Press SELECT to confirm.
Selecting the Harmonic Order
12. Press Order soft key.
13. Turn the jog shuttle to select the order from Total and 0 to the maximum
harmonic order (see section 7.5).
ESC
ESC
ESC
ESC
D/A Output and Other Functions
15
IM 760101-01E
15-3
15.1 Setting the D/A Output (Option)
Setting the Rated Time of Integrated D/A Output
14.
15.
17.
18.
19.
Press SHIFT+START (INTEG SET) to display the Integ Set menu.
Press the D/A Output Rated Time soft key to display the D/A Rated Time
dialog box.
Turn the jog shuttle to select one of the hour, minute, and second boxes.
Press SELECT to display the entry box.
Turn the jog shuttle to set the hour, minute, or second that you selected in step 17.
For the procedures on how to enter values using the jog shuttle, see section 3.12,
“Entering Values and Strings.”
20.
21.
Press SELECT or ESC to close the box.
Repeat steps 17 to 20 to set hour, minute, and second.
ESC
15-4
IM 760101-01E
15.1 Setting the D/A Output (Option)
Explanation
The numerical data can be output using ± 5-V FS DC voltage from the D/A output
connector on the rear panel. Up to 30 items (channels) can be specified for each
measurement mode, normal and harmonic.
Pin Arrangement and Signal Assignment of the D/A Output Connector
The pin arrangement and assignments of the connector are as follows:
D/A OUTPUT
1
19
18
36
Pin No.
Signal Name
Pin No.
Signal Name
1
2
3
4
5
6
7
8
9
10
11
12
13
14
15
16
17
18
D/A CH1
D/A CH3
D/A CH5
D/A CH7
D/A CH9
D/A CH11
D/A CH13
D/A CH15
D/A CH17
D/A CH19
D/A CH21
D/A CH23
D/A CH25
D/A CH27
D/A CH29
D/A GND
D/A GND
–
19
20
21
22
23
24
25
26
27
28
29
30
31
32
33
34
35
36
D/A CH2
D/A CH4
D/A CH6
D/A CH8
D/A CH10
D/A CH12
D/A CH14
D/A CH16
D/A CH18
D/A CH20
D/A CH22
D/A CH24
D/A CH26
D/A CH28
D/A CH30
D/A GND
D/A GND
–
Note
D/A GND (pins 16, 17, 34, and 35) are connected internally to the case.
CAUTION
D/A Output Items during Normal Measurement
Selecting the Measurement Function
• The types of measurement functions that can be selected are the items that are
indicated in “Measurement Function Types during Normal Measurement” and
“Measurement Function Types for Motor Evaluation Function (Option)” in section
1.2; “Delta Computation,” “User-Defined Function,” and “Corrected Power” in
section 1.5; and “Measurement Functions of Integration” in section 1.6.
• You can also select not to output the measurement functions (None). For channels
that are set to None, 0 V is output since no corresponding data exists.
• If you selected measurement functions of delta computation, the meanings of the
elements described in the next section are different from when other measurement
functions are selected. For details, see the explanation in section 6.1.
Selecting the Element/Wiring Unit
• You can select the element/wiring unit from the following list of choices. The
selectable items vary depending on the installed elements.
Element1, Element2, Element3, Element4, Element5, Element6,
ΣA, ΣB, and ΣC
IM 760101-01E
15-5
D/A Output and Other Functions
Do not short the D/A output terminal or apply external voltage to it. This may
cause damage to the instrument.
15
15.1 Setting the D/A Output (Option)
• If there are no elements that are assigned to the selected wiring unit, there is no
numerical data. Thus, 0 V is output in this case. For example, if elements are
assigned to ΣA and ΣB and no elements are assigned to ΣC, then the
measurement function for ΣC output 0 V.
D/A Output Items during Harmonic Measurement
Selecting the Measurement Function
• The types of measurement functions that can be selected are indicated in
“Measurement Function Types for Harmonic Measurement” in section 1.2 and
“User-Defined Functions” in section 1.5.
• You can also select not to output the measurement functions (None). For channels
that are set to None, 0 V is output since no corresponding data exists.
• The DA output is fixed at 0 for channels on which Z, Rs, Xs, Rp, Xp,Utif, Itif, F1,
F2, F3, or F4 were selected as the measurement function.
Selecting the Element/Wiring Unit
• You can select the element/wiring unit from the following list of choices. The
selectable items vary depending on the installed elements.
Element1, Element2, Element3, Element4, Element5, Element6,
ΣA, ΣB, and ΣC
• If the selected wiring unit is not a harmonic measurement target, there is no
numerical data. Thus, 0 V is output in this case. For example, if the measurement
target is ΣA, 0 V is output at the measurement function of ΣC. For selecting the
measurement target, see section 7.3.
Changing the Harmonic Order
The harmonic order can be set to total or from dc (0th order) up to 100th order.
Note
•
•
•
•
•
•
•
15-6
For the meanings of the measurement function symbols that are output, see section 1.2,
“Measurement Functions and Measurement Periods,” 1.5, “Computation,” 1.6, “Integration,”
appendix 1, “Symbols and Determination of Measurement Functions,” and appendix 2,
“Determination of Delta Computation.”
For details on the wiring units expressed as ΣA, ΣB, and ΣC, see section 5.1, “Selecting the
Wiring System.”
0 V is output in places where the measurement function is not selected or where numerical
data is not present..
The harmonic order can be set to total or from dc (0th order) up to 100th order. However, the
numerical data up to the order corresponding to the upper limit of harmonic order under
analysis (see section 17.6) that is automatically determined from the minimum analysis order
specified in section 7.5 to the PLL source frequency is the data determined by the harmonic
measurement. For harmonic orders less than the minimum analysis order specified in section
7.5 (for example, 0th order when Min Order is set to 1st order) and those greater than the
maximum analysis order, the output is 0 V.
If scaling factors such as PT ratio, CT ratio, and power coefficient are specified on the
voltage, current, and power, and the scaling is ON, 100% (5 V) is output when the scaled
value is equal to the scaled rated value (measurement range × scaling factor).
For Σ functions, 100% (5 V) is output when the input is equal to the total value that is obtained
when the rated value is input to each corresponding element. If different scaling factors are
placed on each element, 100% (5 V) is output when the scaled value is equal to the scaled
rated value (measurement range × scaling factor).
If numerous D/A output items are specified (other than None), it may take some time before
the built-in printer starts printing. In this case, reduce the number of output items or hold the
measurement (see section 5.8).
IM 760101-01E
15.1 Setting the D/A Output (Option)
Rated Time of Integrated D/A Output
In the case of integrated values, the integrated value that is obtained while continuously
applying a rated value (same value as the measurement range) for the specified time is
taken to be 100%. The D/A output at that point is 5 V. The D/A output from the
integrated value of 0 (0 V) to the integrated value of 100% (5 V) is assumed to change
linearly with time. The D/A output value is determined by the level of the actual input
with respect to this assumed line (see the figure on the next page).
Setting the Rated Time of Integrated D/A Output
• Set the time in units of hour : minute : second in the following range.
0000:01:00 to 10000:59:59
• This setting is valid in the manual integration mode.
• For normal integration and repetitive integration modes (includes real-time), the
time specified for the timer is the rated time of integrated D/A output.
Note
You cannot specify a time less than 1 minute to the rated time of integrated D/A output.
Relationship between the Output Items and D/A Output Voltages
Frequency
D/A output
Approx. 7.5 V
5.0 V
2.5 V
0.5 V
D/A Output and Other Functions
10 Hz
100 kHz
1 kHz
0.5 Hz
1 MHz
100 Hz
10 kHz
1 Hz
Displayed value
Integrated Value
D/A output
Approx. 7.0 V
Input that is 140% of the rating
5.0 V
Rated input
p
0
t0
15
Integration time
t0: Rated time of integrated D/A output for manual integration mode,
specified time of timer for normal integration and repetitive
(continuous) integration modes
IM 760101-01E
15-7
15.1 Setting the D/A Output (Option)
Other Items
Output
Displayed Value
Approx. 7.0 V
140%
5.0 V
100%
0V
0%
–5.0 V
–100%
Approx. –7.0 V
–140%
D/A output
Approx. 7.5 V
Approx. 7.0 V
5.0 V
–140 –100
0
100 140
Displayed value [%]
–5.0 V
Approx. –7.0 V
Approx. –7.5 V
• λ and φ are not output outside ± 5 V. When the display format of φ is 360 degrees
(360° format), φ is output in the range of 0 V to +5 V. When the display format of φ is
180 Lead/lag (180° lag to 180° lead), φ is output in the range of –5 V to +5 V.
However, approximately 7.5 V is output when an error occurs. For U-pk and I-pk only,
approximately –7.5 V is output when an error occurs.
• For η, 1/η, Uhdf, Ihdf, Phdf, Uthd, Ithd, Pthd, Uthf, Ithf, hvf, hcf, Slip*, ηmA*, and ηmB*,
+5 V is output when the measured value is equal to 100%.
• For Utif and Itif, +5 V is output when the measured value is equal to 100.
• For Torque*, +5 V is output when the measured value is equal to a value (rated value)
of “input range” × “torque scaling factor.” For example, with an input range of 10 V, if
the scaling factor is set to 1 N•m torque per 1 V input voltage, +5 V is output when
torque is 10 N•m.
• For Speed*, when the revolution signal is an analog signal, +5 V is output when the
measured value is equal to a value (rated value) of “input range” of the analog signal
× “scaling factor of rotating speed.” For example, with an input range of 10 V, if the
scaling factor is set to 100 rpm rotating speed per 1 V input voltage, +5 V is output
when the rotating speed is 1000 rpms.
• For Speed*, when the revolution signal is a pulse signal, +5 V is output when the
measured value is equal to the Pulse Range value (rated value) that was specified in
section 8.2.
• For Sync*, +5 V is output when the measured value is equal to the rated value of
Speed.
• For Pm*, +5 V is output when the measured value is equal to a motor output
determined by the rated value of the torque and of the rotating speed.
*
15-8
Applicable only to products with the motor evaluation function (option).
IM 760101-01E
15.2 RGB Video Signal (VGA) Output
The screen of the WT1600 can be output to a monitor through the RGB video signal
(VGA) output. Connectable monitors are VGA monitors or multi-sync monitors capable
of displaying VGA.
CAUTION
• Connect the cable after turning OFF the WT1600 and the monitor.
• Do not short the RGB VIDEO OUT terminal or apply external voltage to it. This
may cause damage to the instrument.
Pin Arrangement and Signal Assignment of the Video Signal Output Connector
The pin arrangement and assignments of the connector are as follows:
6
1
11
5
15
VIDEO-OUT
(VGA)
10
Pin No.
Signal Name
Specifications
1
2
3
4
5
6
7
8
9
10
11
12
13
14
15
Red
Green
Blue
–
–
GND
GND
GND
–
GND
–
–
Horizontal sync signal
Vertical sync signal
–
0.7 Vp-p
0.7 Vp-p
0.7 Vp-p
Approx. 31.5 kHz, TTL
(negative logic)
Approx. 60 Hz, TTL
(negative logic)
1.
2.
3.
Turn OFF the power to the WT1600 and the monitor.
Connect the WT1600 and the monitor using an analog RGB cable.
The screen of the WT1600 appears on the monitor when the power to both the
WT1600 and the monitor are turned ON.
Note
•
•
•
IM 760101-01E
The RGB video signal is constantly output from the video signal output connector.
The monitor screen may flicker if the WT1600 or another device is brought close to the
monitor.
The edge of the screen may drop out depending on the monitor type.
D/A Output and Other Functions
Connecting to the Monitor
15
15-9
15.3 Initializing the Settings
Keys
SELE
CT
SET
RE
DISPLAY
HOLD
UP DATE
RATE
FILE
SINGLE
ESC
TRIG'D
WAVE
STORE
COPY
STORE SET
MENU
REMOTE
HARMONICS
CURSOR
LOCAL
MAX HOLD
MISC
NULL
SHIFT
To exit the menu during operation, press ESC.
INPUT
RANGE
SCALING
WIRING
AVG
MEASURE
MOTOR SET
FILTER
CAL
INTEGRATOR
START
STOP
INTEG SET
RESET
SYNC SRC
Procedure
Note
Check that it is okay to initialize the settings before actually initializing the settings. You
cannot set the settings back after initialization. It is recommended that the setup parameters
be saved (see section 12.6) before initialization.
1.
2.
3.
4.
Press MISC to display the Misc menu.
Press the Initialize Settings soft key. An Alert dialog box appears.
Turn the jog shuttle to select OK or Cancel.
Select OK and press SELECT to execute the initialization.
Select Cancel and press SELECT to abort the initialization.
ESC
15-10
IM 760101-01E
15.3 Initializing the Settings
Explanation
The values specified by the panel keys can be reset to the factory default values. This is
useful when you wish to clear previous settings or start the settings from scratch. For
details on the initial settings, see appendix 3, “List of Initial Settings and Display Order of
Numerical Data.”
Settings That Cannot Be Initialized
• Date and time settings
• Settings related to saving and loading data.
• Settings related to screen image output.
• Settings related to the GP-IB interface, serial interface, and Ethernet interface.
• SCSI ID number setting (SCSI is optional.).
Initializing at Power Up
If the power switch is turned ON while pressing RESET, the WT1600 powers up using
initial settings. In this case, “Settings That Cannot Be Initialized” as indicated above
excluding the date and time are also initialized.
D/A Output and Other Functions
15
IM 760101-01E
15-11
15.4 Performing Zero-Level Compensation
Keys
SELE
CT
SET
RE
DISPLAY
HOLD
UP DATE
RATE
FILE
SINGLE
ESC
TRIG'D
WAVE
CURSOR
STORE
COPY
STORE SET
MENU
REMOTE
HARMONICS
LOCAL
MAX HOLD
MISC
NULL
SHIFT
To exit the menu during operation, press ESC.
INPUT
RANGE
SCALING
WIRING
AVG
MEASURE
MOTOR SET
FILTER
CAL
INTEGRATOR
START
STOP
INTEG SET
RESET
SYNC SRC
Procedure
Press SHIFT+MEASURE (CAL) to execute zero-level compensation.
Explanation
Zero-Level Compensation
This function is used to create a zero input condition using the internal circuit of the
instrument and setting the level at that point to zero level. Zero-level compensation
must be performed to meet the specifications of this instrument (see chapter 17).
• Pressing CAL executes the zero-level compensation.
• Zero-level compensation is performed the first time the measurement is made after
turning ON/OFF harmonic measurement or changing the measurement range or
input filter.
Note
•
•
•
15-12
For making accurate measurements, it is recommended that zero-level compensation be
performed after warming up the instrument for at least an hour. In addition, the ambient
temperature need to be within the specifications (see chapter 17) and stable.
If the harmonic measurement ON/OFF setting, measurement range, and input filter are not
changed over a long period of time, the zero level may change due to the changes in the
environment surrounding the instrument. It is recommended that zero-level compensation be
performed in this case.
There are functions that automatically perform zero-level compensation during integration.
See section 6.10.
IM 760101-01E
15.5 Using the NULL Function
Keys
SELE
CT
SET
RE
DISPLAY
HOLD
UP DATE
RATE
FILE
SINGLE
ESC
TRIG'D
WAVE
CURSOR
STORE
COPY
STORE SET
MENU
REMOTE
HARMONICS
LOCAL
MAX HOLD
MISC
NULL
SHIFT
To exit the menu during operation, press ESC.
INPUT
RANGE
SCALING
WIRING
AVG
MEASURE
MOTOR SET
FILTER
CAL
INTEGRATOR
START
STOP
INTEG SET
RESET
SYNC SRC
Procedure
Activating the NULL Function
1.
Press SHIFT+MISC (NULL). The NULL indicator that is below and to the left of
the key illuminates and the NULL function is activated.
Clearing the NULL Function
2.
Press SHIFT+MISC (NULL). when the NULL function is activated. The NULL
indicator turns OFF and the NULL function is canceled.
Explanation
Null Value
When the NULL function is turned ON, the NULL values are set to the Udc and Idc
values (numerical data of the simple average of the voltage and current during normal
measurement), Speed and Torque (on products with the motor evaluation function
when the input signal from the sensor is an analog signal) that were measured the
previous time. If the previously measured Udc and Idc as well as Speed and Torque
values do not exist, such as when the NULL function is turned ON without making a
measurement after turning ON the power, Udc and Idc are set to zero.
Note
•
•
The NULL function is automatically cleared when the range or filter setting is changed or
when the harmonic mode is turned ON/OFF.
If the crest factor is set to 3, a NULL value of approximately 50% is set for a signal that
exceeds 50% of the range. If the crest factor is set to 6, a NULL value of approximately
100% is set for a signal that exceeds 100% of the range.
Measurement Function Affected by the NULL Function
The NULL value is subtracted from the sampled data. Hence, all measurement
functions are affected by the NULL values.
IM 760101-01E
15-13
D/A Output and Other Functions
The NULL function can be used to subtract the DC offset while the external sensor or
measurement cable is connected. Execute the NULL function at zero input condition
(current input terminal open and voltage input terminal shorted).
15
15.6 Selecting the Message Language and the
Screen Brightness
Keys
SELE
CT
SET
RE
DISPLAY
HOLD
UP DATE
RATE
FILE
SINGLE
ESC
TRIG'D
WAVE
STORE
COPY
STORE SET
MENU
REMOTE
LOCAL
HARMONICS
CURSOR
MAX HOLD
MISC
NULL
SHIFT
To exit the menu during operation, press ESC.
INPUT
RANGE
SCALING
WIRING
AVG
MEASURE
MOTOR SET
FILTER
CAL
INTEGRATOR
START
STOP
INTEG SET
RESET
SYNC SRC
Procedure
1.
2.
Press MISC to display the Misc menu.
Press the Config soft key to display the Config menu.
Selecting the Message Language
3.
Press the Message soft key to display the Message menu.
4.
Press the JPN, ENG, or CHN soft key to select the message language.
Selecting the Screen Brightness
3.
Turn the jog shuttle to select –1 to 3.
ESC
15-14
ESC
ESC
ESC
IM 760101-01E
15.6 Selecting the Message Language and the Screen Brightness
Explanation
Selecting the Message Language
An error message is displayed when an error occurs. Select the language to use to
display the message and the menu from the choices below. The error codes for the
error messages are the same. For details on the error messages, see section 16.2.
• JPN
Displays the messages in Japanese.
• ENG
Displays the messages in English.
• CHN
Displays the messages in Chinese.
Selecting the Screen Brightness
Select the screen brightness in the range of –1 to 3. The darkest setting is –1 and the
brightest setting is 3.
D/A Output and Other Functions
15
IM 760101-01E
15-15
15.7 Setting the Display Color of the Screen
Keys
SELE
CT
SET
RE
DISPLAY
HOLD
UP DATE
RATE
FILE
SINGLE
ESC
TRIG'D
WAVE
STORE
COPY
STORE SET
MENU
REMOTE
HARMONICS
CURSOR
LOCAL
MAX HOLD
MISC
NULL
SHIFT
To exit the menu during operation, press ESC.
INPUT
RANGE
SCALING
WIRING
AVG
MEASURE
MOTOR SET
FILTER
CAL
INTEGRATOR
START
STOP
INTEG SET
RESET
SYNC SRC
Procedure
1.
2.
Press MISC to display the Misc menu.
Press the Next 1/2 soft key to display the Next 2/2 menu.
ESC
Setting the Graphic Color
• Selecting default or user
3.
Press the Graph Color soft key to display the Graph Color menu.
4.
Turn the jog shuttle to select Default or User.
ESC
15-16
ESC
IM 760101-01E
15.7 Setting the Display Color of the Screen
• Setting user colors
3.
Press the User Color soft key to display the Graph Color dialog box.
4.
Turn the jog shuttle to select the item you wish to set.
5.
Press SELECT to display the color level selection box.
6.
Turn the jog shuttle to set the color level.
For the procedures on how to enter values using the jog shuttle, see section 3.12,
“Entering Values and Strings.”
7.
Press SELECT or ESC to close the box.
ESC
Setting the Text Color
• Selecting preset or user
3.
Press the Text Color soft key to display the Text Color menu.
4.
Turn the jog shuttle to select Preset1 to User.
ESC
ESC
D/A Output and Other Functions
• Setting user colors
3.
Press the User Color soft key to display the Text Color dialog box.
4.
Turn the jog shuttle to select the item you wish to set.
5.
Press SELECT to display the color level selection box.
6.
Turn the jog shuttle to set the color level.
15
For the procedures on how to enter values using the jog shuttle, see section 3.12,
“Entering Values and Strings.”
7.
IM 760101-01E
Press SELECT or ESC to close the box.
15-17
15.7 Setting the Display Color of the Screen
ESC
Explanation
The display color for each item can be specified. Set the color using a ratio (0-7) of red
(R), green (G), and blue (B).
Setting the Graphic Color
Select default color or user color.
For user color, the display color can be specified for each item.
• Back
Set the background color within the waveform display frame.
• Grid
Set the color of the grid within the waveform display frame and the area within the
waveform display frame.
• Cursor
Set the display color of the cursor.
• U1 to I6, Speed*, Torque*
Set the display color of the waveform. I1 and U5, U2 and I5, I2 and U6, U3 and I6,
I3 and Speed, and U4 and Torque will have the same display color setting.
*
Applicable only on products with the motor evaluation function (option).
Setting the Text Color
Select from Preset1 to 3 and user setting.
For user color, the display color can be specified for each item.
• Menu Fore
Set the color of the text on the menu, dialog box, window, and other screens.
• Menu Back
Set the background color of the waveform display frame.
• Select Box
Set the background color of the background within the selected menu frame and
box.
• Sub Menu
Set the display color of the selected dialog box or window.
• Selected Key
Set the display color of the selected soft key or item.
15-18
IM 760101-01E
15.8 Setting Key Lock
Keys
SELE
CT
SET
RE
DISPLAY
HOLD
UP DATE
RATE
FILE
SINGLE
ESC
TRIG'D
WAVE
STORE
COPY
STORE SET
MENU
REMOTE
HARMONICS
CURSOR
LOCAL
MAX HOLD
MISC
NULL
SHIFT
To exit the menu during operation, press ESC.
INPUT
RANGE
SCALING
WIRING
AVG
MEASURE
MOTOR SET
FILTER
CAL
INTEGRATOR
START
STOP
INTEG SET
RESET
SYNC SRC
Procedure
1.
2.
Press MISC to display the Misc menu.
Press the Config soft key to display the Config menu.
Setting Key Lock
3.
Press the Key Lock soft key to select ON or OFF.
ESC
ESC
Key Lock
If key lock is turned ON, all keys except the power switch, MISC key, ESC key, and
the 5th soft key from the top are disabled.
When key lock is ON, the word “Lock” blinks at the upper right corner of the screen.
Note
Key lock ON/OFF setting is held even when the power is turned OFF.
IM 760101-01E
15-19
D/A Output and Other Functions
Explanation
15
Chapter 16 Troubleshooting, Maintenance, and Inspection
16.1 Troubleshooting
Troubleshooting
• If a message is displayed on the screen, read the succeeding pages.
• If servicing is necessary, or if the instrument is not operating correctly after performing
the corrective actions below, contact your nearest YOKOGAWA dealer.
Problem and Corrective Action
Sections
Nothing shows up on the display when the power switch is turned ON.
Securely connect the power cord to the power connector of the instrument and the power outlet.
3.5
Set supply voltage within the permitted range.
3.5
Check the display settings.
15.7
Check that the fuse is not blown.
16.5
The displayed data is not correct.
Check that the ambient temperature and humidity are within the specifications.
3.2
Check that noise is not affecting the measurement.
3.1, 3.3
Check the wiring of the measurement cable.
3.3 to 3.9
Check the wiring system.
3.6 to 3.9,
5.1
Check that the line filter is turned OFF.
5.5
Check the measurement period settings.
6.2
Power cycle the instrument.
3.10
Keys do not work.
Check the REMOTE indicator. If the REMOTE indicator is ON, press the LOCAL key to turn it OFF.
—
Do a key test. If it fails, servicing is required..
16.3
Triggering does not work.
9.3
Check that the trigger source is being applied.
9.3
Check the format of the medium. If necessary, format the medium.
12.5
Check that the write-protect is disabled.
—
Check the free space on the medium. Remove unnecessary files as necessary or use a new medium.
12.5
Troubleshooting, Maintenance, and Inspection
Check the trigger conditions.
Check that the GP-IB address or the parameter settings of the serial interface satisfy the specifications.
—*
16
Check that the interface satisfies the electrical and mechanical specifications.
—*
Unable to make harmonic measurements.
Check the PLL source settings.
7.4
Check that the PLL source input signal is within the specifications.
7.4
Unable to print.
The printer head may be damaged or worn out.
Servicing required.
—
Unable to recognize the medium.
Check that the cables are properly connected.
12.3
Check the format of the medium. If necessary, format the medium.
12.5
The medium may be damaged.
—
Unable to save data to the selected medium.
Unable to set or control the instrument via the communication interface.
* See the Communication Interface User’s Manual (IM760101-11E).
IM 760101-01E
16-1
16.2 Error Messages and Corrective Actions
Error Messages
There are cases in which error messages are displayed on the screen during operation.
This section describes the meanings of the messages and the appropriate corrective actions.
The messages can be displayed in English or Japanese (see section 15.6). If the
corrective action indicates servicing, contact your nearest YOKOGAWA dealer for
repairs.
In addition to the error messages listed in this section, there are also communication
related error messages. These messages are described in the Communication Interface
User’s Manual (IM760101-11E).
Error in Execution
Code
Message
Corrective Action
Sections
11
Cannot measure PLL frequency.
Check input level.
7.4
601
Invalid file name or SCSI ID.
Check file name or SCSI ID.
12.4, 12.6
602
No media inserted or no SCSI device.
Make sure that the storage medium is
inserted (if applicable), and check the SCSI
device connection and the SCSI ID.
12.1-12.4
603
No SCSI device or no media inserted.
Check the SCSI device connection and the SCSI
ID, and make sure that the storage medium is
inserted (if applicable).
12.1-12.4
604
Media failure.
Check the storage medium.
—
605
File not found.
Check the file name and the storage medium.
—
606
Media is protected.
Set the disk’s (medium’s) write protect switch to OFF.
—
607
Media was removed while accessing.
Check the storage medium.
—
608 ,
609
File already exists.
—
12.6
610
Contains invalid characters.
—
12.6
611,
612
Media full.
Delete unnecessary file(s) or use another disk.
12.5-12.10
613
File system failure.
Check using another disk. If the same message
still appears, maintenance service is required.
—
614
File is protected.
—
12.9
615
Physical format error.
Reformat the medium. If the same error occurs, the
instrument is probably unable to execute a
format on this medium.
12.5
616
to 620
File system failure.
Check using another disk. If the same message
still appears, maintenance service is required.
—
621
File is damaged.
Check the file.
—
622
to 641
File system failure.
Check using another disk. If the same message
still appears, maintenance service is required.
—
642
No media exists in SCSI device.
Check that the storage medium is correctly inserted
in the SCSI device.
—
643
to 653
Media failure.
Check the medium.
—
654
Media failure.
Check the format type of the floppy disk.
12.5
655
to 664
File system failure.
Check using another disk. If the same message
still appears, maintenance service is required.
—
665
Cannot load this file format. File was stored
on other models or other versions.
—
—
666
File is now being accessed.
Execute after access is made.
—
668
Cannot find ‘.HDR’ file.
Check the file.
12.6
16-2
IM 760101-01E
16.2 Error Messages and Corrective Actions
Codes Messages
Actions
Sections
669
Cannot find ‘.INF’ file.
Check the file.
—
670
No wave displayed.
Turn ON the display for the appropriate waves.
9.5
671
Save data not found.
Check for presence of data.
12.6,12.7
672
This model does not have the SCSI interface.
—
page iii
673
SCSI controller failure.
Maintenance service is required.
—
674
Initializing file system.
Please wait.
12.5
Cannot load this file.
—
—
679
Printer error.
Maintenance service is required.
—
680
Move the release arm to the “HOLD” position.
—
14.1
681
Paper empty.
Load a roll chart.
14.1
682,
683
Printer over heat.
Power off immediately.
—
684
No built-in printer on this model.
Check the specifications to see whether or not the
optional printer is provided.
page ii
685
Printer time out.
Maintenance service is required.
—
705
Can not operate while accessing medium.
Wait until access has completed.
—
706
Can not operate during hard copy.
Wait until output has completed.
—
710
File not found.
Check the file.
—
711
File operation not allowed during hard copy.
Wait until the hard copy completes.
—
712
Can not compress this hardcopy image.
Turn off compression switch.
12.7
750
Cannot connect to the ftp server.
Confirm the network settings and connection.
Chapter 13
751
Has not connect with ftp server yet.
Confirm the network settings and connection.
Chapter 13
752
This ftp function in not supported.
—
Chapter 13
753
FTP Error: Pwd
Confirm the network settings and connection.
Chapter 13
754
FTP Error: Cwd
Confirm the network settings and connection.
Chapter 13
755
FTP Error: Rm
Confirm the network settings and connection.
Chapter 13
756
FTP Error: List
Confirm the network settings and connection.
Chapter 13
757
FTP Error: Mkdir
Confirm the network settings and connection.
Chapter 13
758
FTP Error: Rmdir
Confirm the network settings and connection.
Chapter 13
759
FTP Error: Get
Confirm the network settings and connection.
Chapter 13
760
FTP Error: Put
Confirm the network settings and connection.
Chapter 13
761
FTP Error: GetData
Confirm the network settings and connection.
Chapter 13
762
FTP Error: PutData
Confirm the network settings, connection,
and disk capacity.
Chapter 13
763
FTP Error: AppendData
Confirm the network settings, connection,
and disk capacity.
Chapter 13
764
FTP Error: Client Handle
Confirm the network settings and connection.
Chapter 13
765
FTP Error: Others
Confirm the network settings and connection.
Chapter 13
785
Cannot send data to a network printer.
Confirm the network settings and connection.
Chapter 13
786
Cannot send a mail.
Confirm the network settings and connection.
Chapter 13
Troubleshooting, Maintenance, and Inspection
675
16
IM 760101-01E
16-3
16.2 Error Messages and Corrective Actions
Error in Setting
Code
Message
Corrective Action
Sections
800
Illegal date-time.
Set the correct date and time.
3.11
801
Illegal file name.
The file name contains characters which are not
allowed or the file name is not a valid MS-DOS file
name. Enter another file name.
12.6
802
Cannot be set in the normal measurement mode. Set the measurement mode to harmonic.
7.1
803
Cannot be set in the harmonic measurement
mode.
Set the measurement mode to normal.
7.1
805
Cannot change this parameter when averaging
is ON.
Turn OFF the averaging function.
5.6
806
Cannot change this parameter when any of
the user-defined functions is ON.
Turn OFF all user-defined functions.
6.4, 7,8
808
Cannot change this parameter during
numerical display.
—
—
809
Cannot change this parameter during
vector display.
—
—
810
Cannot change this parameter during
bar graph display.
—
—
812
Cannot be set while storing/recalling of data
being performed.
—
—
813
Cannot be set while integration is running.
Reset Integration.
6.11
816
Cannot set selected Harmonics Object with
current Wiring Pattern.
—
5.1
820
Cannot be set while trend sampling is running.
—
10.1
823
Cannot change during CAL.
Wait until CAL is completed.
15.4
827
Illegal math expression.
Input a correct computing equation.
6.4, 7.8
834
Duplicate SCSI ID.
Set different ID numbers.
12.4
840
Attempted to start integration when wave
sampling was ON.
Turn OFF the wave sampling function.
9.1
841
Attempted to start integration after
integration time has reached its preset value.
Reset Integration.
6.11
842
Attempted to start integration while
integration is in progress.
—
6.11
843
Measurement stopped due to overflow during
integration or due to a power failure.
Reset Integration.
6.11
844
Attempted to stop integration even though
integration was not in progress.
—
6.11
845
Attempted to reset integration even though
integration was in progress or integration
mode was not selected.
—
6.11
846
Attempted to start integration while
measurement of peak overflow was in progress
or during an overrange condition.
—
6.11
847
Attempted to start integration in continuous
integration mode when integration preset
time was set to “0”.
—
6.8
848
Attempted made to start integration in real time
counting integration mode when the end time
had already passed.
—
6.9
849
Attempted made to start storing in real time
counting storing mode when the end time had
already passed.
—
11.2
16-4
IM 760101-01E
16.2 Error Messages and Corrective Actions
Code
Message
Corrective Action
Sections
850
Stored file already exists.
Initialize memory before storing.
—
11.4
851
Stored file and measurement mode are different.
Set the appropriate measurement mode before
recalling.
—
7.1
852
Stored file is illegal.
Initialize memory before storing.
—
11.4
853
Cannot be executed/set during Recall mode.
Set the Mode to Store.
—
11.1
854
Waveform display data not found.
Turn ON the wave sampling function.
9.1
855
Storing momory is full.
Storing has been stopped.
—
11.4
856
An error has occured while storing.
Storing has been stopped.
—
—
857
Cannot be set while Master/Slave Syncronized
Measurement is set to Slave.
—
5.10
860
Attempted to start integration while trend
sampling was ON.
Turn OFF the trend sampling function.
10.1
Error in System Operation
Message
Corrective Action
Sections
901
Failed to backup setup data.
Will initialize.
3.10
902
System RAM failure.
Maintenance service is required.
—
903
System ROM failure.
Maintenance service is required.
—
904
System RAM failure.
Maintenance service is required
—
906
Fan stopped.
Power off immediately. Maintenance service is
required.
—
907
Backup battery is flat.
Maintenance service is required to replace the
backup battery.
—
908
Internal temperature is too high.
Power off immediately. Maintenance service is
required.
—
909
Illegal SUM value.
Maintenance service is required.
—
910
RAM read/write error.
Maintenance service is required.
—
911
Memory bus error.
Maintenance service is required.
—
912
Fatal error in Communication-driver.
Maintenance service is required.
—
914
Time out occurs in Communications.
—
—
915
EEPROM SUM error.
EEPROM may be damaged. Maintenance service is
required.
—
920
SUM error of NULL value.
The Null value is reset to 0.
—
921
System Failed to Draw Display.
—
—
922
Failed in communication with DSP.
—
—
923
Transmit data abnormality from DSP.
—
—
924
FIFO abnormality.
—
—
Troubleshooting, Maintenance, and Inspection
Code
16
Note
If the corrective action indicates maintenance service, try initializing the instrument. It may
recover from the error.
IM 760101-01E
16-5
16.3 Performing a Self-Test
Keys
SELE
CT
SET
RE
DISPLAY
HOLD
UP DATE
RATE
FILE
SINGLE
ESC
TRIG'D
WAVE
STORE
COPY
STORE SET
MENU
REMOTE
HARMONICS
CURSOR
LOCAL
MAX HOLD
MISC
NULL
SHIFT
To exit the menu during operation, press ESC.
INPUT
RANGE
SCALING
WIRING
AVG
MEASURE
MOTOR SET
FILTER
CAL
INTEGRATOR
START
STOP
INTEG SET
RESET
SYNC SRC
Procedure
1.
2.
3.
4.
Press MISC to display the Misc menu.
Press the Selftest soft key to display the Selftest menu.
Press the Test Item soft key to display the Test Item menu.
Press the Memory or Key Board soft key to select the test item.
If you selected Memory, proceed to “Testing the Memory” on the next page.
If you selected Key Board, proceed to “Testing the Keys and the Keyboard” on
the next page.
ESC
16-6
ESC
ESC
IM 760101-01E
16.3 Performing a Self-Test
Testing the Memory
5.
Pressing the Test Exec soft key execute the memory test.
ESC
Testing the Keys and the Keyboard
• Testing the Keys
5.
Press the Test Exec soft key.
6.
Press the front panel keys to test them.
7.
Press the arrow keys (< and >). The indicator lights one by one each time an
arrow key is pressed.
8.
Press ESC twice to exit from the key test.
• Testing the keyboard
9.
Press the Soft Key soft key to display the keyboard.
10. Operate the keyboard. Check that the characters entered on the keyboard are
correctly displayed in the entry box of the keyboard.
For keyboard operations, see section 3.12, “Entering Values and Strings.”
ESC
Troubleshooting, Maintenance, and Inspection
ESC
Explanation
Memory Test
Tests whether the internal ROM and RAM are operating correctly. If Pass is
displayed, it is operating correctly. If Failed is displayed, contact your nearest
YOKOGAWA dealer.
Testing the Keys and the Keyboard
• Tests whether the front panel keys are operating properly. If the name of the key
being pressed appears on the screen, it is operating correctly.
• If the indicator turns ON/OFF when the arrow keys (< or >) are pressed, the keys
are operating correctly.
• To exit from the key test, press ESC twice.
• If the display is not correct, contact your nearest YOKOGAWA dealer.
IM 760101-01E
16-7
16
16.4 Checking the System Conditions
Keys
SELE
CT
SET
RE
DISPLAY
HOLD
UP DATE
RATE
FILE
SINGLE
ESC
TRIG'D
WAVE
CURSOR
STORE
COPY
STORE SET
MENU
REMOTE
HARMONICS
LOCAL
MAX HOLD
MISC
NULL
SHIFT
To exit the menu during operation, press ESC.
INPUT
RANGE
SCALING
WIRING
AVG
MEASURE
MOTOR SET
FILTER
CAL
INTEGRATOR
START
STOP
INTEG SET
RESET
SYNC SRC
Procedure
1.
2.
Press MISC to display the Misc menu.
Press the Information soft key to display the Information window.
ESC
ESC
Explanation
Displaying the System Conditions
You can check the model, ROM version, element configuration, and the existence of
options.
16-8
IM 760101-01E
16.5 Replacing the Power Fuse
WARNING
• To prevent the possibility of fire, use only a fuse having the specified rating
(voltage, current, and type).
• Make sure to turn OFF the instrument and unplug the power cord before
replacing the fuse.
• Never short the fuse holder.
Fuse Rating
The power fuse used on this instrument is specified as follows.
• Maximum rated voltage: 250 V
• Maximum rated current: 6.3 A
• Type: Time lag
• Standard: UL/VDE certified
• Part number: A1354EF
Replacement Procedure
Fuse
Spare fuse
Fuse holder
Troubleshooting, Maintenance, and Inspection
Replace the power fuse according to the procedure below.
1.
Turn OFF the power switch.
2.
Remove the power cord from the power connector.
3.
Insert the tip of a flat-blade screw driver in the dented section of the fuse holder
on the power connector side, turn it in the direction of the arrow, and remove the
fuse holder.
4.
Remove the blown fuse that is attached to the tip of the fuse holder.
5.
Attach a new fuse to the fuse holder and attach the fuse holder back in the
original place.
16
IM 760101-01E
16-9
16.6 Recommended Replacement Parts
The three-year warranty applies only to the WT1600 (starting from the day of delivery)
and does not cover any other items nor expendable items (items which wear out). The
replacement period for expendable items varies depending on the conditions of use.
Refer to the table below as a general guideline. Contact your nearest YOKOGAWA
dealer for replacement parts.
16-10
Parts Name
Recommended Replacement Period
Built-in printer
LCD backlight
Backup battery
(Lithium battery)
Under normal usage, 200 rolls of paper (part No. : B9316FX)
3 years
3 years
Parts Name
Warranty Period
Built-in hard disk
1 year after purchase (excludes data)
IM 760101-01E
Chapter 17 Specifications
17.1 Input
Specification
Input terminal type
Voltage
Plug-in terminal (safety terminal)
Current
• Direct input
: Large binding post (frequency band of assured accuracy: up to 1
MHz for the 5 A terminal, up to 100 kHz for the 50 A terminal).
• Current senser input : BNC connector (frequency band of assured accuracy: up to 500
kHz).
Input format
Voltage
Floating input, resistive voltage divider
Current
Floating input, shunt input
Measurement range
(Rated value)
Voltage
• When the crest factor is set to 3: 1.5 V, 3 V, 6 V, 10 V, 15 V, 30 V, 60 V, 100 V, 150 V, 300 V,
600 V, and 1000 V
• When the crest factor is set to 6: 750 mV, 1.5 V, 3 V, 5 V, 7.5 V, 15 V, 30 V, 50 V, 75 V, 150
V, 300 V, and 500 V
Current (5-A input element)
• Direct input:
• When the crest factor is set to 3: 10 mA, 20 mA, 50 mA, 100 mA, 200 mA, 500 mA, 1 A, 2
A, and 5 A
• When the crest factor is set to 6: 5 mA, 10 mA, 25 mA, 50 mA, 100 mA, 250 mA, 500 mA,
1 A, and 2.5 A
• Current sensor input:
• When the crest factor is set to 3: 50 mV, 100 mV, 250 mV, 500 mV, 1 V, 2.5 V, 5 V, and
10 V
• When the crest factor is set to 6: 25 mV, 50 mV, 125 mV, 250 mV, 500 mV, 1 V, 2.5 V,
and 5 V
Current (50-A input element)
• Direct input:
• When the crest factor is set to 3: 1 A, 2 A, 5 A, 10 A, 20 A, and 50 A
• When the crest factor is set to 6: 500 mA, 1 A, 2.5 A, 5 A, 10 A, and 25 A
• Current sensor input:
• When the crest factor is set to 3: 50 mV, 100 mV, 250 mV, 500 mV, 1 V, 2.5 V, 5 V, and
10 V
• When the crest factor is set to 6: 25 mV, 50 mV, 125 mV, 250 mV, 500 mV, 1 V, 2.5 V,
and 5 V
Input impedance
(Input resistance)
Voltage
Approx. 2 MΩ
Current (5-A input element)
• Direct input: Approx. 100 mΩ + approx. 0.07 µH
• Current sensor input: Approx. 100 kΩ
Current (50-A input element)
• Direct input: Approx. 2 mΩ + approx. 0.07 µH
• Current sensor input: Approx. 100 kΩ
Instantaneous maximum
allowable input
(1 period, for 20 ms)
Voltage
Peak value of 4000 V or RMS value of 1500 V, whichever is less.
Current (5-A input element)
• Direct input: Peak value of 30 A or RMS value of 15 A, whichever is less.
• Current sensor input: Peak value less than or equal to 10 times the measurement range.
Current (50-A input element)
• Direct input: Peak value of 450 A or RMS value of 300 A, whichever is less.
• Current sensor input: Peak value less than or equal to 10 times the measurement range.
Continuous maximum
allowable input
Voltage
Peak value of 1500 V or RMS value of 1000 V, whichever is less.
Current (5-A input element)
• Direct input: Peak value of 10 A or RMS value of 7 A, whichever is less.
• Current sensor input: Peak value less than or equal to 5 times the measurement range.
Current (50-A input element)
• Direct input: Peak value of 150 A or RMS value of 50 A, whichever is less.
• Current sensor input: Peak value less than or equal to 5 times the measurement range.
IM 760101-01E
Specifications
Item
17
17-1
17.1 Input
Item
Specification
Continuous maximum
common mode voltage
(50/60 Hz)
600 Vrms
Influence from common
mode voltage
When 600 Vrms is applied with the voltage input terminals shorted and current input terminals open.
• 50/60 Hz: ±0.01% of range or less (±(0.01 × 15/(rated value of the range))% of range or less
for 10-V range or less).
• Up to 100 kHz (reference value): ±0.1 × f% of range or less (±(0.1 × f × 15/(rated value of
range))% of range or less for 10-V range or less). Twice this value if the crest factor is set to
6. Except, at least 0.01%. The unit of frequency f is kHz.
Line filter
Select from OFF, 500 Hz, and 5.5 kHz.
Zero crossing filter
Select from OFF and 500 Hz.
A/D converter
Simultaneous conversion of voltage and current inputs.
Resolution: 16 bits. Conversion speed: Approx. 5 µs.
Range switching
Specifiable for each input element manually, automatically, or through communication commands.
Auto range function
Range increase
• When Urms or Irms exceeds 110% of the measurement range
• When the peak value of the input signal exceeds approx. 330% (Approx. 660% if the crest
factor is set to 6) of the measurement range
Range decrease
When Urms or Irms is less than or equal to 30% of the measurement range and Upk and Ipk is
less than or equal to 300% (Less than or equal to 600% if the crest factor is set to 6) of the next
lower range
17.2 Display
Item
Specification
Display
6.4" color TFT LCD monitor
Display resolution of the
entire screen*
640 (H) × 480 (V) dots
Display resolution of the
waveform display
501 (H) × 432 (V) dots
* The LCD screen may contain 0.02% of defect with respect to the total number of pixels.
17-2
IM 760101-01E
17.3 Measurement Functions (Items) during Normal
Measurement
Measurement Functions Determined for Each Input Element
For details on the determination and equations of measurement functions, see appendix 1.
Item
Symbol and Meaning
Voltage (V)
Urms: true rms value, Umn: rectified mean value calibrated to the rms value,Udc: simple average,
Uac: AC component
Current (A)
Irms: true rms value, Imn: rectified mean value calibrated to the rms value,Idc: simple average,
Iac: AC component
Active power (W)
P
Apparent power (VA)
S
Reactive power (var)
Q
Power factor
λ
Phase difference (° )
φ
Frequency (Hz)
fU (FreqU): voltage frequency, fI (FreqI): current frequency
The frequency of up to three signals can be measured as fU or fI. You can also select to measure
only three sets of voltage frequencies or only three sets of current frequencies. The display of
signals that are not selected shows [------] (no data).
Voltage max. and min. (V) U+pk: Voltage maximum, U-pk: Voltage minimum
Current max. and min. (A) I+pk: Current maximum, I-pk: Current minimum
Crest factor
CfU: Voltage crest factor, CfI: Current crest factor
Form factor
FfU: Voltage form factor, FfI: Current form factor
Impedance (Ω ) of the
load circuit
Z
Resistance and reactance Rs: Resistance of the load circuit that has a resistor R, inductor L, and capacitor C connected in
(Ω ) of the load circuit
series
Xs: Reactance of the load circuit that has a resistor R, inductor L, and capacitor C connected in
series
Rp: Resistance of the load circuit that has an R, L, and C connected in parallel
Xp: Reactance of the load circuit that has an R, L, and C connected in parallel
Corrected Power(W)
Pc
(Applicable standard IEC76-1(1976), IEEE C57.12.90-1993, IEC76-1(1993))
Integration
Time: Integration time
Wp: Sum of positive and negative watt hours
Wp+: Sum of positive P (consumed watt hour)
Wp-: Sum of negative P (watt hour returned to the power supply)
q: Sum of positive and negative ampere hours
q+: Sum of positive I (ampere hour)
q-: Sum of negative I (ampere hour)
However, the ampere hour is the integration of one of the selected current Irms, Imn, Idc, or Iac.
Specifications
17
IM 760101-01E
17-3
17.3 Measurement Functions (Items) during Normal Measurement
Measurement Functions (Σ Functions) Determined for Each Wiring Unit (ΣA, ΣB, and ΣC)
For details on the determination and equations of Σ functions, see appendix 1.
Item
Symbol and Meaning
Voltage (V)
UrmsΣ: true rms value, UmnΣ: rectified mean value calibrated to the rms value,
UdcS: simple average, UacS: AC component
Current (A)
IrmsΣ: true rms value, ImnΣ: rectified mean value calibrated to the rms value, IdcΣ: simple average,
IacΣ: AC component
Active power (W)
PΣ
Apparent power (VA)
SΣ
Reactive power (var)
QΣ
Power factor
λΣ
Phase difference (° )
φΣ
Impedance (Ω ) of the
load circuit
ZΣ
Resistance and reactance RsΣ: Resistance of the load circuit that has a resistor R, inductor L, and capacitor C connected in
(Ω ) of the load circuit
series
XsΣ: Reactance of the load circuit that has a resistor R, inductor L, and capacitor C connected in
series
RpΣ: Resistance of the load circuit that has an R, L, and C connected in parallel
XpΣ: Reactance of the load circuit that has a R, L, and C connected in parallel
Corrected Power(W)
PcΣ
(Applicable standard IEC76-1(1976), IEEE C57.12.90-1993, IEC76-1(1993))
Integration
Time: Integration time
WpΣ: Sum of positive and negative watt hours
Wp+Σ: Sum of positive P (consumed watt hour)
Wp-Σ: Sum of negative P (watt hour returned to the power supply)
qΣ: Sum of positive and negative ampere hours
q+Σ: Sum of positive I (ampere hour)
q-Σ: Sum of negative I (ampere hour)
Efficiency 1
η: Efficiency of wiring B against wiring A
Efficiency 2
1/η: Efficiency of wiring A against wiring B
Measurement Functions of Motor Evaluation
For details on the determination and equations of the measurement functions of motor
evaluation, see appendix 1.
Item
Symbol and Meaning
Rotating speed
Speed: Motor’s rotating speed
Torque
Torque: Motor’s torque
Synchronous speed
Sync
Slip (%)
Slip
Motor output
Pm: Motor’s mechanical output (mechanical power)
Motor efficiency (%)
ηmA or ηmB: Ratio of the motor output versus the power consumption of the motor
Total efficiency*(%)
ηmA or ηmB: Ratio of the motor output versus the power consumed by the motor as well as the
converter through which power is fed to the motor
*
*
17-4
If PΣA is the power to the converter and the motor and PΣB is the power to the motor, ηmA and ηmB are the total efficiency
and motor efficiency, respectively. Conversely, if PΣB is the power to the converter and the motor and PΣA is the power to
the motor, ηmB and ηmA are the total efficiency and motor efficiency, respectively. For details, see section 8.8.
IM 760101-01E
17.4 Measurement Functions (Items) during
Harmonic Measurement
Measurement Functions Determined for Each Input Element
For details on the determination and equations of measurement functions, see appendix 1.
Item
Symbol and Meaning
Voltage (V)
U(k): rms value of the harmonic voltage of order k*1, U: total rms value of the voltage signal*2
Current (A)
I(k): rms value of the harmonic current of order k, I: total rms value of the current signal
Active power (W)
P(k): Active power of the harmonic signal of order k, P: total active power
Apparent power (VA)
S(k): Apparent power of the harmonic signal of order k, S: total apparent power
Reactive power (var)
Q(k): Reactive power of the harmonic signal of order k, Q: total reactive power
Power factor
λ(k): Power factor of the harmonic signal of order k, λ: total power factor
Phase difference (° )
φ(k): Phase difference between the harmonic voltage and current of order k, φ: total phase
φU(k): Phase difference of each harmonic voltage U(k) with respect to the fundamental signal U(1)
φI(k): Phase difference of each harmonic current I(k) with respect to the fundamental signal I(1)
Impedance (Ω ) of the
load circuit
Z(k): Impedance of the load circuit observed by the kth order harmonic signal.
Resistance and reactance Rs(k): Resistance observed by the kth order harmonic signal of the load circuit that has a resistor R,
(Ω ) of the load circuit
inductor L, and capacitor C connected in series
Xs(k): Reactance observed by the kth order harmonic signal of the load circuit that has a resistor R,
inductor L, and capacitor C connected in series
Rp(k): Resistance observed by the kth order harmonic signal of the load circuit that has a resistor R,
inductor L, and capacitor C connected in parallel
Xp(k): Reactance observed by the kth order harmonic signal of the load circuit that has a resistor R,
inductor L, and capacitor C connected in parallel
Harmonic distortion
factor [%]
Uhdf(k): The ratio of the harmonic voltage U(k) to U(1) or U expressed as a percentage.
Ihdf(k): The ratio of the harmonic current I(k) to I(1) or I expressed as a percentage.
Phdf(k): The ratio of the active power P(k) of the harmonic signal to P(1) or P expressed as a
percentage.
Total harmonic
distortion [%]
Uthd: The ratio of the total harmonic voltage to U(1) or U*3 expressed as a percentage.
Ithd: The ratio of the total harmonic current to I(1) or I expressed as a percentage.
Pthd: The ratio of the active power of the total harmonic signal to P(1) or P expressed as a
percentage.
Telephone harmonic
Uthf: Telephone harmonic factor of voltage, Ithf: Telephone harmonic factor of current
factor*4 (Applicable standard IEC34-1(1996))
Telephone influence
Utif: Telephone influence factor of voltage, Itif: Telephone influence factor of current
factor*4 (Applicable standard IEC34-1(1996))
Harmonic voltage factor*4 hvf: harmonic voltage factor
(Applicable standard IEC34-1(1996))
Harmonic current factor*4 hcf: harmonic current factor
(Determined in the same way as hvf.)
Frequency (Hz)
fU (FreqU): voltage frequency, fI (FreqI): current frequency
The frequency of up to three signals including the signal selected for the PLL source can be measured
as fU or fI. You can also select to measure only three sets of voltage frequencies or only three sets of
current frequencies. The display of signals that are not selected shows [------] (no data).
Specifications
*1 k is an integer in the range from 0 to the upper limit of harmonic order under analysis. 0th order is the DC component. The
upper limit is determined automatically (maximum is 100) by the frequency of the PLL source.
*2 Total is a value determined according to the equation given in appendix 1 from the fundamental signal (1st order) and all
harmonic components (2nd to the upper limit). The DC component can also be included.
*3 Total harmonic is a value determined according to the equation given in appendix 1 from all harmonic components (2nd to the
upper limit).
*4 Measurement functions specific to the IEC or IEEE standard. For details, see appendix 1.
17
IM 760101-01E
17-5
17.4 Measurement Functions (Items) during Harmonic Measurement
Measurement functions indicating the phase difference of the fundamental voltage
and current between elements
These measurement functions express the phase difference of fundamental wave U(1)
and I(1) of other elements with respect to the fundamental wave U(1) of the element with
the smallest number of the input elements that are assigned to the wiring unit. The
following table indicates the measurement functions for a wiring unit that combines
elements 1, 2, and 3.
Item
Symbol and Meaning
Phase difference U1-U2 (° ) φU1-U2: Phase difference of the fundamental voltage (U2(1)) of element 2 with respect to the
fundamental voltage (U1(1)) of element 1.
Phase difference U1-U3 (° ) φU1-U3: Phase difference of the fundamental voltage (U3(1)) of element 3 with respect to U1(1).
Phase difference U1-I1 (° ) φU1-I1: Phase difference of the fundamental current (I1(1)) of element 1 with respect to U1(1).
Phase difference U1-I2 (° ) φU1-I2: Phase difference of the fundamental current (I2(1)) of element 2 with respect to U1(1).
Phase difference U1-I3 (° ) φU1-I3: Phase difference of the fundamental current (I3(1)) of element 3 with respect to U1(1).
Measurement Functions (Σ Functions) Determined for Each Wiring Unit (ΣA, ΣB, and ΣC)
For details on the determination and equations of Σ functions, see appendix 1.
Item
Symbol and Meaning
Voltage (V)
UΣ(1): rms value of the harmonic voltage of order 1*1, UΣ: total rms value of the voltage signal*2
Current (A)
IΣ(1): rms value of the harmonic current of order 1, IΣ: total rms value of the current signal
Active power (W)
PΣ(1): Active power of the harmonic signal of order 1, PΣ: total active power
Apparent power (VA)
SΣ(1): Apparent power of the harmonic signal of order 1, SΣ: total apparent power
Reactive power (var)
QΣ(1): Reactive power of the harmonic signal of order 1, QΣ: total reactive power
Power factor
λΣ(1): Power factor of the harmonic signal of order 1, λΣ: total power factor
*1 Total is a value determined according to the equation given in appendix 1 from the fundamental signal (1st order) and all
harmonic components (2nd to the upper limit). The DC component can also be included.
17-6
IM 760101-01E
17.5 Accuracy
Voltage and Current Accuracy
Item
Specification
Accuracy (3-month
accuracy)
Conditions
Temperature: 23±3° C. Humidity: 30 to 75%RH. Input waveform: Sine wave. Common-mode
voltage: 0 V. Line filter: OFF. λ(power factor): 1. Crest factor: 3. After warm-up time has
passed. Wired condition after zero-level compensation or measurement range change. f is the
frequency.
Frequency
Accuracy
±(reading error + measurement range error)
DC
0.1% of reading + 0.2% of range
0.5 Hz ≤ f < 10 Hz
0.1% of reading + 0.2% of range
10 Hz ≤ f < 45 Hz
0.1% of reading + 0.1% of range
45 Hz ≤ f ≤ 66 Hz
0.1% of reading + 0.05% of range
66 Hz < f ≤ 1 kHz
Voltage, current of a 5-A input element from direct input or current sensor input
0.1% of reading + 0.1% of range
Current of a 50-A input element from direct input
0.2% of reading + 0.1% of range
1 kHz < f ≤ 50 kHz
Voltage, current of a 5-A input element from direct input
0.3% of reading + 0.1% of range
Current sensor input
(0.015 × f + 0.3)% of reading+0.1% of range
Direct input using current from a 50-A input element
(0.1 × f+0.2)% of reading+0.1% of range
50 kHz < f ≤ 100 kHz
Voltage, current of a 5-A input element from direct input and external input
0.6% of reading + 0.2% of range
Current sensor input
(0.009 × f + 0.6)% of reading + 0.2% of range
Current of a 50-A input element from direct input
(0.1 × f + 0.2)% of reading + 0.2% of range
100 kHz < f ≤ 500 kHz Voltage, current of a 5-A input element from direct input
0.006 × f% of reading + 0.5% of range
Current sensor input
(0.03 × f – 1.5)% of reading + 0.5% of range
500 kHz < f ≤ 1 MHz
Voltage, current of a 5-A input element from direct input
(0.022 × f – 8)% of reading + 1% of range
* The unit of f in the reading error equation is kHz.
•
•
•
•
•
•
•
•
•
•
•
•
•
•
IM 760101-01E
17-7
Specifications
•
•
•
Add 20% of range to the above accuracy figure for the accuracy of the waveform display data,
Upk, and Ipk in the range up to 1 MHz. The effective input range is within ±300% of the range
(within ±600% of the range if the crest factor is set to 6). However, for 1000 V range, the range
is within ±200% (within ±400% for 500 V range if the crest factor is set to 6).
For a 5-A input element, add 20 µA to the DC accuracy of the current.
For a 50-A input element, add 1 mA to the DC accuracy of the current.
For current sensor input, add 0.05/(current sensor trans. ratio) A to the DC accuracy of the current.
For temperature changes after zero-level compensation and range change on a 5-A input
element, add 10 µA/°C to the DC accuracy of the current.
For temperature changes after zero-level compensation and range change on a 50-A input
element, add 1 mA/°C to the DC accuracy of the current.
For temperature changes after zero-level compensation and range change on a current sensor
input, add {0.05/(current sensor transformation ratio)} A/°C to the DC accuracy of the current.
For a 5-A input element, add 0.006 × I2 to the current accuracy.
For a 50-A input element, add 0.00006 × I2 to the current accuracy.
For Irms, Imean, and Iac on a 5-A input element, accuracy figures are specified with the line filter
turned ON for 2 mA or less.
For Irms, Imean, and Iac on a 50-A input element, accuracy figures are specified with the line
filter turned ON for 200 mA or less.
For Irms, Imean, and Iac on a current sensor input, accuracy figures are specified with the line
filter turned ON for 10/(current sensor transformation ratio) A or less.
When the data update rate is 50 ms, add 0.1% of range to all accuracy figures.
All accuracy figures for 0.5 to 10 Hz are reference values.
If f (Hz) × voltage (V) > 2.2 × 10⁷ for frequencies above 100 kHz, the voltage accuracy figures
are reference values.
For currents that exceed 20 AAC (excluding the range of 50 to 400 Hz), the current accuracy
figures are reference values.
For currents less than 5 mA with frequencies above 1 kHz, the current accuracy figures are
reference values.
17
17.5 Accuracy
Item
Specification
Effective input range
0 to ±110% of the measurement range for Udc and Idc.
1 to 110% of the measurement range for Urms, Uac, Irms, and Iac.
10 to ±110% of the measurement range for Umn and Imn.
Lower limit of measurement frequency
Data update rate
50 ms 100 ms 200 ms 500 ms
Lower limit of measurement frequency 45 Hz 25 Hz
15 Hz
5 Hz
1s
2s
5s
2.5 Hz 1.5 Hz 0.5 Hz
Line filter influence
When the cut-off frequency is 500 Hz
45 to 66 Hz: Add 0.2% of reading. Less than 45 Hz: Add 0.5% of reading.
When the cut-off frequency is 5.5 kHz
Less than 66 Hz: Add 0.2% of reading. 66 to 500 Hz: Add 0.5% of reading.
Conditions for detecting
lead and lag
Lead and lag are detected correctly when the voltage and current signals are both sine waves, the
amplitude is greater than or equal to 50% (greater than or equal to 100% if the crest factor is set to
6) of the measurement range, the frequency is between 20 Hz to 10 kHz, and the phase difference
is greater than or equal to ±5° .
Temperature coefficient
Add ±0.03% of reading/° C in the range 5 to 20° C or 26 to 40° C.
One year accuracy
±(reading error of the 3-month accuracy × 1.5).
Accuracy when the crest
factor is set to 6
Accuracy obtained by doubling the measurement range error for the accuracy when the crest factor
is set to 3
Power Accuracy
Item
Specification
Accuracy (3-months
accuracy)
Conditions
Same as the conditions for voltage and current.
Frequency
Accuracy
±(reading error + measurement range error)
DC
0.1% of reading + 0.2% of range
0.5 Hz ≤ f < 10 Hz
0.2% of reading + 0.3% of range
10 Hz ≤ f < 45 Hz
0.1% of reading + 0.2% of range
45 Hz ≤ f ≤ 66 Hz
0.1% of reading + 0.05% of range
66 Hz < f ≤ 1 kHz
0.2% of reading + 0.1% of range
1 kHz < f ≤ 50 kHz
5-A input element and the current is direct input
0.3% of reading + 0.2% of range
Current sensor input
(0.02 × f + 0.3)% of reading+0.2% of range
50-A input element and the current is direct input
(0.1 × f+0.2)% of reading+0.2% of range
50 kHz < f ≤ 100 kHz
5-A input element and the current is direct input
0.7% of reading + 0.3% of range
Current sensor input
(0.009 × f + 0.9)% of reading + 0.3% of range
50-A input element and the current is direct input
(0.3 × f – 9.5)% of reading + 0.3% of range
100 kHz < f ≤ 500 kHz
5-A input element and the current is direct input
0.008 × f% of reading + 1% of range
Current sensor input
(0.06 × f – 4)% of reading + 1% of range
500 kHz < f ≤ 1 MHz
5-A input element and the current is direct input
(0.048 × f – 20)% of reading + 2% of range
*
•
•
•
17-8
The unit of f in the read error equation is kHz.
For a 5-A input element, add 20 µ A × (voltage reading) to the DC accuracy.
For a 50-A input element, add 1 mA × (voltage reading) to the DC accuracy.
For a current sensor input, add {0.05/(current sensor transformation ratio) A} × (voltage reading)
to the DC accuracy.
IM 760101-01E
17.5 Accuracy
Item
Specification
•
•
•
•
•
•
•
•
Effective input range
For temperature changes after zero-level compensation and range change on a 5-A input
element, add (10 µA) × (voltage reading)/°C to the DC accuracy.
For temperature changes after zero-level compensation and range change on a 50-A input
element, add (1 mA) × (voltage reading)/∞C to the DC accuracy.
For temperature changes after zero-level compensation and range change on a current sensor
input, add {0.05/(current sensor transformation ratio) A} × (voltage reading)/°C to the DC
accuracy.
When the data update rate is 50 ms, add 0.1% of range to all accuracy figures.
All accuracy figures for 0.5 to 10 Hz are reference values.
If f (Hz) × voltage (V) > 2.2 × 10⁷ for frequencies above 100 kHz, the accuracy figures are
reference values.
For currents that exceed 20 AAC (excluding the range of 50 to 400 Hz), the accuracy figures are
reference values.
For currents less than 5 mA with frequencies above 1 kHz, the accuracy figures are reference
values.
0 to ±110% of the power range (see section 5.2) for DC measurement.
±110% of the power range for current measurement when the voltage and current are in the
range of 1 to 110% of the measurement range. Except, the signal level of the synchronization
source must be greater than or equal to 10% (greater than or equal to 20% if the crest factor is
set to 6) of the measurement range.
However, at a voltage of 1000 V, the range is up to 5 A, 50 A, and 10 V for a 5-A input element, 50A input element, and current sensor input, respectively.
•
•
Lower limit of measurement Same as the accuracy for voltage and current.
frequency
Power factor (λ) influence
•
•
When λ = 0
• Add apparent power reading × 0.15% in the range of 45 to 66 Hz.
• For other frequencies, see below. However, the figures are reference values.
• For a 5-A input element when the current is direct input, add the apparent power reading ×
(0.15 + 0.05 × f (kHz))%.
• For a 50-A input element when the current is direct input, add the apparent power reading
× (0.15 +0.3 × f (kHz))%.
• For a current sensor input, add the apparent power reading × (0.15 +0.1 × f (kHz))%.
When 0 < λ < 1
Add the power reading × {tanφ × (influence when λ = 0)}%.φ is the phase difference between the
voltage and current.
Line filter influence
When the cut-off frequency is 500 Hz
45 to 66 Hz: Add 0.3% of reading. Less than 45 Hz: Add 1% of reading.
When the cut-off frequency is 5.5 kHz
Less than 66 Hz: Add 0.3% of reading. 66 to 500 Hz: Add 1% of reading.
Temperature coefficient
Same as the temperature coeficient for voltage and current.
One year accuracy
±(reading error of the 3-month accuracy × 1.5).
Accuracy when the crest
factor is set to 6
Accuracy obtained by doubling the measurement range error for the accuracy when the crest factor
is set to 3
Accuracy of Other Parameters and Computation Accuracy
•
•
•
•
•
•
•
IM 760101-01E
17-9
Specifications
•
For the accuracy of frequency fU and fI, see “Frequency Measurement” in section 17.6,
“Functions.”
For the accuracy of measured values Wp, Wp+, Wp-, q, q+, and q- and the integration time, see
“Integration” in section 17.6, “Functions.”
For the accuracy of voltage, current and power during harmonic measurement, see “Harmonic
Measurement” in section 17.6, “Functions.”
For the accuracy of the rotating speed and torque, see “Motor Evaluation (Option)” in section
17.6, “Functions.”
For the D/A output accuracy, see “D/A Output (Option)” in section 17.6, “Functions.”
The computation accuracy of apparent power S and reactive power Q that can be determined
from the measured value is ± 0.001% of the power range.
The computation accuracy of power factor λ that can be determined from the measured value is
±0.0001.
The computation accuracy of phase difference φ that can be determined from the power factor is
±0.005.
17
17.6 Functions
Measurement Function and Measurement Conditions
Item
Specification
Method
Digital multiplier method
Crest factor
Select 3 or 6 (when rated value of the measurement range is input)
However, the actual crest factor is 2 for the 1000 V range if the crest factor is set to 3. The actual
crest factor is 4 for the 500 V range if the crest factor is set to 6.
Measurement period
Period used to determine and compute the measurement function.
• During normal measurement
Measurement period is set using the zero crossing points of the reference signal
(synchronization source).
• During harmonic measurement
Measurement period is equal to the selected FFT data length.
Wiring system
Select the wiring system from the following five types.
1P2W (single-phase, two-wire), 1P3W (single-phase, three-wire), 3P3W (three-phase, threewire), 3P4W (three-phase, four-wire), and 3V3A (three-voltage, three-current)
However, the selectable wiring systems vary depending on the number of input elements that are
installed. You may be able to select only a single type of wiring system or two or three types of
wiring systems.
Measurement range
See section 17.1.
Scaling
Set the current sensor transformation ratio, PT ratio, CT ratio, and power factor in the range of
0.0001 to 99999.9999 when inputting the external current sensor, PT, or CT output to the
instrument.
Input filter
Specify a line filter or a zero crossing filter. See section 17.1.
Averaging
•
•
During normal measurement
Select exponential average or moving average.
• Exponential average
Select the attenuation constant from 2, 4, 8, 16, 32, and 64.
• Moving average
Select the average count from 8, 16, 32, 64, 128, and 256.
During harmonic measurement
Exponential average only.
FFT data length
Fundamental frequency of the PLL source
Attenuation constant
8192
55 Hz ≤ f < 75 Hz
Outside the above range
5.625
4.6875
4096
55 Hz ≤ f < 75 Hz
Outside the above range
11.25
9.375
2048
55 Hz ≤ f < 75 Hz
Outside the above range
22.5
18.75
Data update rate
Select from 50 ms, 100 ms, 200 ms, 500 ms, 1 s, 2 s, and 5 s.
However, the data update rate is slower than the specified value when the waveform data
acquisition is ON or depending on the acquisition conditions of the waveform data. The display
update rate is 200 ms when the data update rate is 50, ms, 100 ms, and 200 ms.
Response time
Data update rate × 2 at the maximum. However, when retrieval of waveform display data is OFF.
Hold
Holds the data display.
Single measurement
Executes one measurement during the held condition.
MAX hold
Holds the maximum value of the numerical data.
Zero-level compensation/Null Performs zero-level compensation.
17-10
IM 760101-01E
17.6 Functions
Frequency Measurement
Item
Specification
Measured item
Select up to three of the frequencies of the voltage or current that is input to the input element.
During harmonic measurement, select up to three including the signal selected as the PLL source.
Method
Reciprocal method
Measurement range
Data Update Rate
Measurement Range*
50 ms
100 ms
200 ms
500 ms
1s
2s
5s
45 Hz ≤ f ≤ 1 MHz
25 Hz ≤ f ≤ 1 MHz
15 Hz ≤ f ≤ 500 kHz
5 Hz ≤ f ≤ 200 kHz
2.5 Hz ≤ f ≤ 100 kHz
1.5 Hz ≤ f ≤ 50 kHz
0.5 Hz ≤ f ≤ 20 kHz
*
However, the measurement range is up to 100 kHz for a 50-A input element and 500 kHz for
a current sensor input.
Accuracy
±(0.05% of reading + 1 digit)
When the input signal level is greater than or equal to 0.6 V (voltage input), 25 mV (current sensor
input), 5 mA (5-A input element), or 150 mA (50-A input element) and the signal is greater than or
equal to 30% (0.5 Hz to 440 Hz, with zero crossing filter ON), 10% (440 Hz to 500 kHz), or 30%
(500 kHz to 1 MHz) of the measurement range. Twice these values for the input signal level when
the crest factor is set to 6
Frequency measurement
filter
Zero crossing filter (see section 17.1)
Integration
Item
Specification
Mode
Select from manual, normal, repetitive, real-time normal, and real-time repetitive.
Measurement function
See section 17.3.
Individual element integration All element simultaneous or individual element integration is possible. However, the individual
element integration can be executed only through communication commands.
Integration timer
Automatic stop of integration by setting a timer.
0000h00m00s to 10000h00m00s
Count overflow
When the integration time reaches its maximum (10000 hours) or the integration value reaches its
maximum or minimum (±999999 MWh or ±999999 MAh), the integration is stopped and the
integration time and integration value at that point are held.
Accuracy
±(Power accuracy (or current accuracy) + 0.05% of reading)
Timer accuracy
±0.02%
*
Integration cannot be executed when waveform data acquisition is ON or during harmonic measurement.
Specifications
17
IM 760101-01E
17-11
17.6 Functions
Harmonic Measurement
Item
Specification
Measured item
Select a single wiring unit.
Method
PLL synchronization method or external sampling clock method
Frequency range
•
•
PLL synchronization method
Fundamental frequency of the PLL source is in the range of 10 Hz to 1 kHz.
External sampling clock method
Input a sampling clock signal having a frequency that is 2048 times the fundamental frequency
between 0.5 Hz and 100 Hz of the waveform on which to perform harmonic measurement. The
input level is TTL. The input waveform is a rectangular wave with a duty ratio of 50%.
PLL source
Select the voltage, current, or external clock of each input element.
Measurement function
See section 17.4.
FFT data length
Select from 8192, 4096, and 2048.
FFT processing word length 32 bits
Window function
Rectangular
Anti-aliasing
Filter
Set using a line filter (5.5 kHz).
Sample rate (sampling frequency), window width, and upper limit of harmonic order under analysis during PLL synchronization
Fundamental Freq.
of the PLL Source
(Hz)
Sample
Rate
(S/s)
Window Width against
the FFT Data Length
(Freq. of the Fundamental Wave)
8192
4096
2048
Upper Limit of
Harmonic Order
under Analysis
10 ≤ f < 20
20 ≤ f < 40
40 ≤ f < 75
75 ≤ f < 150
150 ≤ f < 440
440 ≤ f ≤ 1000
f × 2048
f × 1024
f × 512
f × 256
f × 128
f × 64
4
8
16
32
64
128
100
100
100
100
50
25
2
4
8
16
32
64
1
2
4
8
16
32
Sample rate, window width, and upper limit of harmonic order under analysis when using external sampling clock
Fundamental Freq.
of the PLL Source
(Hz)
Sample
Rate
(S/s)
Window Width against
the FFT Data Length
(Freq. of the Fundamental Wave)
8192
4096
2048
0.5 ≤ f ≤ 100
f × 2048
4
2
1
However, it is 1 ≤ f ≤ 100 when the FFT data length is 8192.
Accuracy
•
Upper Limit of
Harmonic Order
under Analysis
100
When line filter (5.5 kHz) is ON
Frequency
Voltage and Current
±(reading error + measurement
range error)
Power
±(reading error + measurement
range error)
0.5 Hz ≤ f < 10 Hz
10 Hz ≤ f < 45 Hz
45 Hz ≤ f ≤ 66 Hz
66 Hz < f ≤ 1 kHz
1 kHz < f ≤ 2.5 kHz
0.4% of reading + 0.2% of range
0.4% of reading + 0.1% of range
0.3% of reading + 0.05% of range
1% of reading + 0.1% of range
2% of reading + 0.1% of range
0.7% of reading + 0.3% of range
0.6% of reading + 0.2% of range
0.4% of reading + 0.05% of range
1.5% of reading + 0.1% of range
—
However, for nth order component input, add {n/(m+1)}50% of the nth order reading to n+mth
order and n–mth order. Accuracy obtained by doubling the measurement range error if the crest
factor is set to 6.
•
17-12
When line filter is OFF
Add the following value to the accuracy during normal measurement.
• For nth order component input, add {n/(m+1)}50% of the nth order reading to n+mth order and
n–mth order.
• For nth order component input, add (n/500)% of the nth order reading to the nth order
component.
IM 760101-01E
17.6 Functions
Motor Evaluation (Option)
Item
Specification
Measurement function
See section 17.3.
Revolution signal
•
When the revolution signal is DC voltage (analog input)
Item
Specification
Connector type
Input range
Effective input range
BNC connector
1 V, 2 V, 5 V, 10 V, and 20 V
±110% of the measurement range
However, ±20 V or less
Approx. 1 MΩ
±20 V
±42 Vpeak or less
±(0.1% of reading + 0.2% of range)
±0.03% of range/°C
Input resistance
Maximum allowable input
Continuous maximum common mode voltage
Accuracy
Temperature coefficient
•
Torque signal
For pulse input
Item
Specification
Connector type
Frequency range
Amplitude input range
Effective amplitude
Input waveform
Input resistance
Continuous maximum common mode voltage
Accuracy
BNC connector
2 Hz to 200 kHz
±5 Vpeak
1 V (peak-to-peak) or more
50% duty ratio rectangular wave
Approx. 1 MΩ
±42 Vpeak or less
±(0.05% of reading + 1 mHz + 1 digit)
Same as the DC voltage of the revolution signal.
*
Motor evaluation cannot be executed during harmonic measurement.
D/A output (option)
Item
Specification
Number of outputs
30 channels
Output item for each channel specifiable.
Accuracy
±(accuracy of each measurement function + 0.2% of FS)
Maximum output current
±0.1 mA
Temperature coefficient
±0.05% of FS/° C
Relationship between the
output items and D/A
output voltages
See section 15.1.
Computation
Specification
User-defined function
Compute numerical data of equations (up to four equations) that are created by combining the
measurement function symbols and operators.
Delta computation
Applicable only during normal measurement. Compute other numerical data of the measured circuit
from the computed results of the difference of the instantaneous values.
Equation for apparent power Applicable only during normal measurement. Select the equation from Urms × Irms, Umn × Imn,
Udc × Idc, and Umn × Irms.
Corrected Power
Correction of active power as defined by the applicable standard IEC76-1(1976), IEEE C57.12.901993, and IEC76-1(1993).
Phase difference display
Select whether to display the phase difference using lead and lag format or 360° format.
17
Equation for distortion factor Set the denominator of the equation to the total waveform or fundamental waveform.
IM 760101-01E
Specifications
Item
17-13
17.6 Functions
Numerical Display
Item
Specification
Displayed items
Displays the numerical data of the measurement functions of sections 17.3 or 17.4.
Display resolution
60000
Number of displayed items During normal measurement
Select from 4, 8, 16, 42, 78, and All.
During harmonic measurement
Select from 4, 8, 16, single list, dual list, and Σ list.
Scrolling of displayed items During normal measurement
Scroll to display the numerical data of measurement functions that cannot be displayed on one
screen. Page scrolling is also possible.
During harmonic measurement
Scroll to display the numerical data of measurement functions that cannot be displayed on one
screen. Page scrolling is also possible.
Resetting the display
Reset the display order of the numerical data to default.
Waveform Display
Item
Specification
Retrieval of waveform
display data
ON/OFF selectable.
Sample rate
Approx. 200 kS/s
Time axis
•
•
Trigger
•
•
•
•
•
During normal measurement
In the range of 0.5 ms/div to 500 ms/div. However, less than or equal to 1/10 of the data update rate.
During harmonic measurement
Automatically determined from the PLL source and window width
Trigger type
Edge type
Trigger mode
Select auto or normal.
Trigger source
Select from the voltage or current applied to the input element and external clock.
Trigger slope
Select from
(rising),
(falling), or
(rising and falling).
Trigger level
• When the trigger source is a voltage or current applied to the input element
Set in the range of ±100% from the screen center (measurement range × 3: the upper and
lower limits of the screen). Resolution: 0.1%.
• When the trigger source is Ext Clk (external clock)
TTL level. For the specifications of the external clock, see section 9.3.
Vertical zoom on the
waveform
Zoom in/out vertically for each voltage or current applied to the input element. Set the zoom rate in
the range from 0.1 to 100 times.
Turning ON/OFF the
waveform display
Select ON/OFF for each voltage or current applied to the input element.
Waveform display format
1, 2, 3, and 4 split window displays are possible.
Display interpolation of the Select dot or linear display.
waveform
Graticule
Select the grid and cross scale display.
Auxiliary display ON/OFF
Turn ON/OFF the upper and lower limits (scale value) and the waveform label.
Cursor measurement
Measure the value at the point where the cursor is placed on the waveform.
Vector Display and Bar Graph Display
Item
Specification
Vector display
Applicable during harmonic measurement. Displays vectors of the phase difference of the
fundamental waveforms.
Bar graph display
Applicable during harmonic measurement. Displays the bar graph of the amplitude of each
harmonic.
17-14
IM 760101-01E
17.6 Functions
Trend Display
Displays the trend of the numerical data of the measurement function on a line graph.
Simultaneous Display
Displays a combination of two displays from numerical, waveform, bar graph, and trend in the top and bottom halves of the
divided screen.
Data Store and Recall
Store the numerical data and waveform display data in the internal memory. Save the stored data to a storage medium*1
Recall*2 the stored data from the internal memory.
*1 Floppy disk, built-in hard disk, SCSI device, network drive, etc.
(Built-in hard disk, SCSI, and Ethernet interface are optional.)
*2 Cannot recall the data from a saved file.
Data Save and Load
Save setup parameters, waveform display data, numerical data, and screen image data to a storage medium*.
Load the saved setup parameters from the storage medium*.
*
Floppy disk, built-in hard disk, SCSI device, network drive, etc.
(Built-in hard disk, SCSI, and Ethernet interface are optional.)
Printing of the Screen Image, Numerical Data List, and Bar Graph
Print the screen image, numerical data list, and bar graph using the built-in printer*.
* The built-in printer is optional.
Ethernet Communications (Option)
Item
Specification
FTP client
Save setup parameters, waveform display data, numerical data, and screen image data to an FTP
server (network drive) on the network. Load the setup parameters that have been saved to the FTP
server.
FTP server
Access the WT1600 from a PC or workstation on the network and download files on the floppy disk,
built-in hard disk, and SCSI device connected to the WT1600. However, an FTP client software is
needed on the PC or workstation.
LPR client
Print the screen image on a network printer.
SMTP client
Periodically transmit the information of the WT1600 to a specified mail address.
Specifications
17
IM 760101-01E
17-15
17.7 Input/Output of the Master/Slave
Synchronization Signal
Item
Specification
Connector type
I/O level
BNC connector: Common to the master and slave
TTL: Common to the master and slave
Output logic
Measurement start delay time
Output hold time
Negative logic, falling edge: Applicable to the master
Within (100 ns + 1 sample period): Applicable to the master
Low level, 200 ns or more: Applicable to the master
Input logic
Minimum pulse width
Input delay time
Negative logic, falling edge: Applicable to the slave
Low level, 200 ns or more: Applicable to the slave
Within (100 ns + 1 sample period): Applicable to the slave
17.8 External Clock Input
Common
Item
Specification
Connector type
Input level
BNC connector
TTL
Synchronization source (Ext Clk) during normal measurement
Item
Specification
Frequency range
Input waveform
Same as the measurement range as indicated in “Frequency Measurement” in section 17.6.
50% duty ratio rectangular wave
PLL source (Ext Clk) during harmonic measurement
Item
Specification
Frequency range
Input waveform
10 Hz to 1 kHz
50% duty ratio rectangular wave
Sampling clock (Smp Clk) during harmonic measurement
Item
Specification
Frequency range
Input waveform
Frequency equal to 2048 times the fundamental frequency of 0.5 Hz to 100 Hz
50% duty ratio rectangular wave
Trigger
Item
Specification
Minimum pulse width
Trigger delay time
1µ s
Within (1 µ s + 1 sample period)
17-16
IM 760101-01E
17.9 RGB Video Signal (VGA) Output
Item
Specification
Connector type
Output type
D-sub 15 pin (receptacle)
VGA compatible
17.10 Built-in Floppy Disk
Item
Specification
Number of drives
1
Size
3.5"
Capacity
1.44 MB
17.11 Built-in Hard Disk (Option)
Item
Specification
Number of drives
1
Capacity
10 GB (IBM format)
17.12 SCSI (Option)
Item
Specification
Standard
SCSI (Small Computer System Interface) ANSI X3.131-1986
Connector type
Half pitch 50 pins (pin type)
Connector pin assignment Unbalanced (single-ended), built-in terminator
SCSI devices* that can
be used
*
For further information, please contact your nearest YOKOGAWA dealer.
Specifications
HD drive: MS-DOS version 3.3 or later, or SCSI HD drive that can be formatted using EZ-SCSI.
MO drive: 128/230/640 MB drive, MO medium uses semi-IBM format.
ZIP drive
PD drive
17
IM 760101-01E
17-17
17.13 Ethernet Interface (Option)
Item
Specification
Number of communication ports
1
Connector type
RJ-45 connector
Electrical and mechanical specifications Conforms to IEEE 802.3.
Transmission system
Ethernet 10BASE-T
Transmission rate
10 Mbps
Protocol
TCP/IP
17.14 Built-in Printer (Option)
Item
Specification
Printing system
Thermal line dot system
Dot density
8 dots/mm
Paper width
80 mm
Printing width
72 mm
17.15 GP-IB Interface
Item
Specification
Electrical and mechanical specifications Conforms to IEEE St’d 488-1978 (JIS C 1901-1987).
Functional specifications
SH1, AH1, T6, L4, SR1, RL1, PP0, DC1, DT1, and C0
Protocol
Conforms to IEEE St’d 488.2-1987
Code
ISO (ASCII) code
Mode
Addressable mode
Address
0 to 30
Clear remote mode
Remote mode can be cleared by pressing LOCAL (except during Local Lockout).
For details on the specifications of the GP-IB interface, see the Communications Interface User’s Manual IM760101-11E.
17-18
IM 760101-01E
17.16 Serial (RS-232) Interface
Item
Specification
Connector type
D-sub 9-pin (plug)
Electrical specifications
Conforms to EIA-574 (9-pin EIA-232(RS-232)
Connection format
Point-to-point
Transmission mode
Full-duplex
Synchronization
Start-stop synchronization
Baud rate
Select from the following rates.
1200, 2400, 4800, 9600, and 19200 bps
For details on the specifications of the serial interface, see the Communications Interface User’s Manual IM760101-11E.
17.17 General Specifications
Item
Specification
Warm-up time
Approximately 1 hour
Operating conditions
Temperature: 5 to 40° C
Humidity: 20 to 80% RH when not using the printer, 35 to 80% RH when using the printer.
(No condensation)
Operating altitude
2000 m or less
Storage environment
Temperature: –25 to 60° C
Humidity: 20 to 80%RH (no condensation)
Rated supply voltage
100 to 120 VAC, 200 to 240 VAC
Permitted supply voltage
range
90 to 132 VAC, 180 to 264 VAC
Rated supply voltage
frequency
50/60 Hz
Permitted supply voltage
frequency range
48 to 63 Hz
Maximum power
consumption
150 VA (when using the built-in printer)
Insulation resistance
50 MΩ or more at 500 VDC
Between power plug and case
Between all voltage input terminals and case
Between all current input terminals and case
Between all voltage terminals and all current input terminals
Between all torque and revolution signal input connectors and case
Between all the torque signal input connectors and all the revolution signal input connectors
Withstand voltage
•
External dimensions
(See section 17.18.)
Approx. 426 mm (W) × 177 mm (H) × 400 mm (D)
(Excludes the handle and other projections.)
Weight
Approx. 15 kg (main unit, 6 input elements, and option installed)
Installation position
Horizontal (however, the stand can be used). Vertical position and stacking not allowed.
Battery backup
Setup parameters and internal time clock are backed up with lithium batteries.
IM 760101-01E
Specifications
•
1500 VAC at 50/60 Hz for one minute
Between power plug and case
3700 VAC at 50/60 Hz for one minute
Between all voltage input terminals and case
Between all current input terminals and case
Between all voltage terminals and all current input terminals
17
17-19
17.17 General Specifications
Item
Specification
Fuse
Location
Max. Rated Voltage Max. Rated Current
Type
Standard
Power supply
250 V
Time lag
UL/VDE certified
6.3 A
Standard Accessories
•
•
•
•
•
•
•
•
Power cord: 1 piece
Spare power fuse: 1 piece (Attached to the fuse holder)
36-pin connector: 1 piece (for D/A output, only provided with option /DA)
Current input protective cover: 1 piece (with 4 attachment screws)
Printer roll paper: 2 rolls (only provided with option /B5)
Rubber feet: 2 sets
User’s manual: 1 piece, this manual
Communication interface user’s manual: 1 piece
Safety standard*1
Complying standard
EN61010-1
Overvoltage category (Installation category) II*2
Measurement Category CAT II*6
Pollution degree 2*3
Emission*1
Complying standard
Cable requirement
Immunity*1
EN61326 Class A
EN61000-3-2
EN61000-3-3
AS/NZS 2064 Class A
This product is a Class A (for commercial environment) product.
For operating of this product in a residential area, it may cause radio
interference in which case the user may be required to take adequate
measures.
• EXT CLK/EXT MEAS. START/EXT MEAS. STOP/TORQUE/SPEED
terminal
Use a BNC cable.*4
• SCSI connector
Use a SCSI shielded cable.*4
• Serial(RS-232) connector
Use a RS-232 shielded cable.*4
• GPIB connector
Use a GPIB shielded cable.*4
• DA output terminal
Use a shielded cable.*4
• RGB video signal output (VGA) connector
Use a D-sub 15 pin VGA shielded cable.*4
• When the measurement cable is connected, it may cause radio
interference in which case the user may be required to take adequate
measures.
Complying standard
EN61326 Annex A*5
Influence in the Immunity Environment
Measurement input : ±20% of range
(within ±40% of range if the crest factor is set to 6)
DA output
: ±40% of range
Cable requirement
Same as the above cable requirement about emission.
*1 Emission, immunity and safety standards apply to products having the CE Mark. For all other products, please contact your
nearest YOKOGAWA representative.
*2 Overvoltage Categories define transient overvoltage levels, including impulse withstand voltage levels. Overvoltage
Category II: Applies to equipment supplied with electricity from fixed installations like a distribution board.
*3 Pollution Degree: Applies to the degree of adhesion of a solid, liquid, or gas which deteriorates withstand voltage or surface
resistivity. Pollution Degree 1: Applies to closed atmospheres (with no, or only dry, non-conductive pollution). Pollution
Degree 2: Applies to normal indoor atmospheres (with only non-conductive pollution).
*4 The cable length is less than 3 m.
*5 Annex A (normative) : Immunity test requirements for equipment intended for use in industrial locations.
17-20
IM 760101-01E
17.18 External Dimensions
Unit: mm
Rear Panel
13
426
23
13
377
45
28
20
177
17
Dimensions with the JIS rack mount kit
29
Mounting surface
29
Mounting surface
0
199 –0.3
24.5
50
50
50
6
480 ±1
460
Specifications
101.6
0
177–0.3
481.1 ±0.4
465
7.1 ±0.3
Dimensions with the EIA rack mount kit
37.7
17
Unless otherwise specified, tolerance is ±3% (however, tolerance is ±0.3 mm when below 10 mm).
IM 760101-01E
17-21
Appendix
Appendix 1 Symbols and Determination of
Measurement Functions
Measurement Functions during Normal Measurement
(Table 1/3)
Measurement Functions
during Normal
Measurement
Voltage
U [V]
Current
I [A]
True rms value Urms
Rectified mean value calibrated
to the rms value Umn
Simple average Udc
AC component Uac
Maximum value U+pk
Minimum value U-pk
True rms value Irms
Rectified mean value calibrated
to the rms value Imn
Simple average Idc
AC component Iac
Maximum value I+pk
Minimum value I-pk
Voltage frequency fU
Current frequency fI
(FreqU) [Hz]
(FreqI) [Hz]
Voltage form factor Ffu
Current form factor FfI
Voltage crest factor CfU
Current crest factor CfI
Method of Determination, Equation
Urms
1
T
Umn
T
π
u(t)2 dt
2
0
1
2 T
Irms
1
T
π
i(t)2 dt
0
T
0
2
1
2 T
u(t) dt
Urms2 – Udc2 Maximum
Iac
0
I-pk
I+pk
T
1
T
i(t) dt
Minimum
0
Idc
T
U-pk
U+pk
T
1
T
u(t) dt
Imn
T
Uac
Udc
Irms2 – Idc2
i(t) dt
Maximum Minimum
0
The voltage frequency (fU) and current frequency (fI) are measured using
zero crossing detection.
Voltage form factor FfU =
Urms
2
Current form factor FfI =
Umn
π
Upk
Voltage crest factor CfU =
Urms
Upk = |U+pk| or |U-pk| whichever is larger
1
T
Active power P [W]
Irms
2
Imn
π
Ipk
Current crest factor CfI =
Irms
Ipk = |I+pk| or |I-pk| whichever is larger
2
2
T
u(t) • i(t) dt
0
Urms • Irms
(Umn • Imn)
(Udc • Idc)
(Umn • Irms)
Apparent power S [VA]
Combinations of rms, mn, and dc are selectable. See section 6.6.
Reactive power Q [var]
S2 – P2
Power factor λ
P
S
cos–1
Phase difference φ [°]
( PS )
The phase format can be displayed using Lead (D)/Lag (G) format
or 360° format. See section 6.7.
Urms
Irms
Impedance of the load circuit
Z [Ω]
P
Irms2
Series resistance of the load circuit
Rs [Ω]
Q
Irms2
Series reactance of the load circuit
Xs [Ω]
Urms2
P
Parallel resistance of the load circuit
Rp [Ω] (=1/G)
Xp [Ω] (=1/B)
Corrected power Pc [W]
IEC76-1(1976), IEEE C57.12.90-1993
P
Urms 2
P1 + P2
Umn
P1, P2: Coefficients as defined in the
applicable standard
(
)
Appendix
Urms2
Q
Parallel reactance of the load circuit
IEC76-1(1993)
P
– Urms
(1 + UmnUmn
)
App
(Continues to the next page)
IM 760101-01E
App-1
Appendix 1 Symbols and Determination of Measurement Functions
(Table 2/3)
Measurement Functions
during Normal
Measurement
Method of Determination, Equation
Integration time
[h:m:s]
Elapsed time from the start of integration to stop
Time
u(t) • i(t) dt
Wp
Wp+
Wp–
Watt
hour
[Wh]
0
Integration
Wp is the sum of positive and negative watt hours.
Wp+ is the sum of positive P (power consumed).
Wp– is the sum of negative P (returned to the power supply, regenerated energy)
n
I
N=0
q
q+
q–
Ampere
hour
[Ah]
q is the sum of positive and negative current hours.
q+ is the sum of positive I (current hour).
q– is the sum of negative I (current hour).
The selected item from Irms, Imn, Idc, and Iac is applied to I.
For the selection procedure, see section 6.10.
Wiring system
Single-phase,
three-wire (1P3W)
UrmsΣ
UmnΣ
UdcΣ
UacΣ
IrmsΣ
ImnΣ
IdcΣ
IacΣ
UΣ [V]
IΣ [A]
Σ Function
(Urms1 + Urms2) / 2
(Umn1 + Umn2) / 2
(Udc1 + Udc2) / 2
(Uac1 + Uac2) / 2
(Irms1 + Irms2) / 2
(Imn1 + Imn2) / 2
(Idc1 + Idc2) / 2
(Iac1 + Iac2) / 2
PΣ [W]
3
S1 + S2
SΣ [VA]
(S1 + S2)
2
Three-phase,
four-wire (3P4W)
(Urms1 + Urms2 + Urms3) / 3
(Umn1 + Umn2 + Umn3) / 3
(Udc1 + Udc2 + Udc3) / 3
(Uac1 + Uac2 + Uac3) / 3
(Irms1 + Irms2 + Irms3) / 3
(Imn1 + Imn2 + Imn3) / 3
(Idc1 + Idc2 + Idc3) / 3
(Iac1 + Iac2 + Iac3) / 3
P1 + P2 + P3
P1 + P2
3
(S1 + S2 + S3)
3
S1 + S2 + S3
QΣ [var]
Q1 + Q2
Q1 + Q2 + Q3
PcΣ [W]
Pc1 + Pc2
Pc1 + Pc2 + Pc3
WpΣ
Wp+Σ
Wp–Σ
qΣ
qΣ [Ah]
q+Σ
q–Σ
PΣ
λΣ =
SΣ
WpΣ [Wh]
XsΣ [Ω] =
QΣ
IrmsΣ2
Wp1 + Wp2
Wp+1 + Wp+2
Wp–1 + Wp–2
q1 + q2
q+1 + q+2
Note
•
•
•
•
•
•
Wp1 + Wp2 + Wp3
Wp+1 + Wp+2 + Wp+3
Wp–1 + Wp–2 + Wp–3
q1 + q 2 + q 3
q+1 + q+2 + q+3
q–1 + q–2
( )
PΣ
φΣ [°] = COS
SΣ
UrmsΣ2
RpΣ [Ω] =
PΣ
(= 1/G)
η (efficiency1) [%] = PΣB • 100
PΣA
App-2
Three-voltage,
Three-phase,
three-wire (3P3W) three-current (3V3A)
-1
q–1 + q–2 + q–3
ZΣ [Ω] = SΣ 2
IrmsΣ
2
XpΣ [Ω] = UrmsΣ
QΣ
(= 1/B)
RsΣ [Ω] =
PΣ
IrmsΣ2
1/η (efficiency 2) [%] = PΣA • 100
PΣB
(Continues to the next page)
Period T is the measurement period. For details on the measurement period, see section 1.2.
u(t) and i(t) denote the sampled data of the voltage signal and the current signal, respectively.
PΣA and PΣB denote the active power of the wiring units ΣA and ΣB, respectively. The assignment
of input elements to wiring units ΣA and ΣB is determined by the number of input elements that are
installed in the WT1600 and the selected wiring system pattern. For details, see section 1.3.
The numbers 1, 2, and 3 in the equations UΣ, IΣ, PΣ, SΣ, QΣ, PcΣ, WpΣ, and qΣ indicate the case
when input elements 1, 2, and 3 are set to the wiring system shown in the table. If elements 2, 3, and
4 are set to the wiring system shown in the table, replace the numbers 1, 2, and 3 with 2, 3, and 4,
respectively. The same also holds true when using elements 5 and 6.
For single phase models (one input element) and those with a 1P2W wiring system, the Σ functions’
numerical data are the same as that of the elements that were assigned to wiring units ΣA, ΣB, and ΣC.
With QΣ[var] calculation, the current at a given voltage is calculated as a negative value for a
leading phase, and a positive value for lagging phase.
IM 760101-01E
Appendix 1 Symbols and Determination of Measurement Functions
(Table 3/3)
Measurement Functions
during Normal
Measurement
Method of Determination, Equation
When the type of input signal from the revolution sensor is DC voltage (analog signal)
Input voltage from the revolution sensor • Scaling factor
Scaling factor: Number of rotations per volt of input voltage
Rotating Speed
Torque
When the type of input signal from the revolution sensor is pulse count
Number of input pulses from the revolution sensor per minute
• Scaling factor
Number of pulses per rotation
Scaling factor: When the signal of the gear ratio or revolution sensor is a
converted signal, you can specify the gear ratio for the scaling factor to
determine the rotating speed before the gear change.
Input voltage from the torque meter • Scaling factor
Scaling factor: torque per volt of input voltage
120 • Frequency of the frequency measurement source (Hz)
Motor Evaluation
Synchronized
speed (Sync)
Slip
[%]
Motor
output
Motor's number of poles
• The unit of synchronized speed is fixed to “min–1 (or rpm).”
• Normally, the frequency measurement source is set to the voltage or current
that is supplied to the motor. The synchronized speed may not be determined
correctly if a different signal is specified.
Sync – Speed
• 100
Sync
2π • Speed • Torque
60
Pm
•
Scaling factor
When the unit of Speed is “min–1 (or rpm),” the unit of Torque is “N•m,” and the
scaling factor is 1, the unit of motor output Pm is “W.”
For products with ROM version 1.05 or earlier, the equation for Pm is as follows:
Pm = Speed + Torque × Scaling factor
ηmA = Pm • 100
PΣA
ηmB = Pm • 100
PΣB
Motor efficiency [%]
or
total efficiency [%]
• Motor efficiency is the ratio of the motor output with respect to the power
consumed by the motor.
• Total efficiency is the ratio of the motor output versus the power consumed by
the motor as well as the converter through which power is fed to the motor.
• If PΣA is the power to the converter and the motor and PΣB is the power to
the motor, ηmA and ηmB are the total efficiency and motor efficiency,
respectively. Conversely, if PΣB is the power to the converter and the motor
and PΣA is the power to the motor, ηmB and ηmA are the total efficiency and
motor efficiency, respectively.
Appendix
App
IM 760101-01E
App-3
Appendix 1 Symbols and Determination of Measurement Functions
Measurement Functions during Harmonic Measurement
(Table 1/2)
Method of Determination, Equation
Measurement Functions
during Harmonic
Measurement
Characters/values inside the ( ) of the measurement function
dc
(When k = 0)
1
(When k = 1)
k
(When k = 2 to max)
Total {No ( )}
max
Voltage U( ) [V]
Ur(k)2 + Uj(k)2
U(k) =
U(dc) =Ur(0)
U(k)2
U=
k = min
max
Current I( ) [A]
2
=
Ir(k)2 + Ij(k)I(k)
I(dc) = Ir(0)
I(k)2
I=
k = min
max
Active power P( ) [W]
P(dc) = Ur(0) • Ir(0)
P=
P(k) = Ur(k) • Ir(k) + Uj(k) • Ij(k)
P(k)
k = min
Apparent power S( ) [VA]
S(dc) = P(dc)
Reactive power Q( ) [var]
Q(dc) = 0
S(k) =
P(k)2 + Q(k)2
P2 + Q2
S=
max
Q=
Q(k) = Ur(k) • Ij(k) – Uj(k) • Ir(k)
Q(k)
k = min
Power factor λ( )
λ(dc) =
Phase difference φ( ) [°]
P(dc)
S(dc)
Phase difference with respect to I(1)
φI( ) [°]
Serial resistance of the load circuit
Rs( ) [Ω]
Serial reactance of the load circuit
Xs( ) [Ω]
Parallel resistance of the load circuit
Rp( ) [Ω] (= 1/G)
Parallel reactance of the load circuit
Xp( ) [Ω] (= 1/B)
λ=
{ P(k)
S(k) }
φU( ) [°]
Z( ) [Ω]
P(k)
S(k)
P
S
( PS )
φ(k) = cos–1
—
Phase difference with respect to U(1)
Impedance of the load circuit
λ(k) =
φ = cos–1
—
Phase difference U(k) with
respect to φU(k) = U(1)
—
—
Phase difference I(k) with
respect to φI(k) = I(1)
—
Z(dc) =
U(dc)
I(dc)
Z(k) =
U(k)
I(k)
—
Rs(dc) =
P(dc)
I(dc)2
Rs(k) =
P(k)
I(k)2
—
Xs(dc) =
Q(dc)
I(dc)2
Xs(k) =
Q(k)
I(k)2
—
Rp(dc) =
U(dc)2
P(dc)
Rp(k) =
U(k)2
P(k)
—
Xp(dc) =
U(dc)2
Q(dc)
Xp(k) =
U(k)2
Q(k)
—
(Continues to the next page)
Note
•
•
•
App-4
k, r, and j denote the harmonic order, real part, and imaginary part, respectively.
min denotes the minimum order. You can select 0 (DC component) or 1 (fundamental signal
component) for the minimum order. For details, see section 7.5.
max denotes the upper limit of harmonic order under analysis (see section 17.6). The upper
limit is determined automatically (maximum is 100) by the frequency of the PLL source.
IM 760101-01E
Appendix 1 Symbols and Determination of Measurement Functions
(Table 2/2)
Method of Determination, Equation
Measurement Functions
during Harmonic
Measurement
Characters/values inside the ( ) of the measurement function are either
dc (k = 0) or k (k = 1 to max)
When the denominator of the equation
for the distortion factor is Total
When the denominator of the equation
for the distortion factor is Fundamental
U(k)
• 100
U
U(k)
• 100
U(1)
I(k)
I
• 100
I(k)
• 100
I(1)
P(k)
• 100
P
P(k)
• 100
P(1)
Harmonic distortion factor of voltage
Uhdf( ) [%]
Harmonic distortion factor of current
Ihdf( ) [%]
Harmonic distortion factor of active power
Phdf( ) [%]
max
max
Total harmonic distortion of voltage
U(k)
Uthd [%]
k=2
U
U(k)2
2
k=2
• 100
U(1)
max
max
I(k)2
I(k)2
Total harmonic distortion of current
Ithd [%]
k=2
k=2
• 100
I
I(1)
k=2
P
Telephone harmonic factor of voltage
Uthf =
Uthf [%]
Telephone harmonic factor of current
Telephone influence factor of voltage
Utif =
Utif
Telephone influence factor of current
Itif
P(1)
max
1
U
{λ(k) • U(k)}2 • 100
Ithf =
k=1
max
1
U
{T(k) • U(k)}2
• 100
max
1
I
{λ(k) • I(k)}2
• 100
k=1
Itif =
k=1
1
I
max
{T(k) • I(k)}2
k=1
T(k): Coefficient as defined by the applicable standard (IEEE Std 100(1992))
Harmonic voltage factor
hvf [%]
hvf =
Harmonic current factor
hcf [%]
Current frequency fI
k=2
• 100
λ(k): Coefficient as defined by the applicable standard (IEC34-1(1996))
Ithf [%]
Voltage frequency fU
P(k)
P(k)
Pthd [%]
• 100
max
max
Total harmonic distortion of active power
• 100
(FreqU) [Hz]
(FreqI) [Hz]
Wiring system
Σ Functions
UΣ [V]
1
U
max
U(k)2
• 100
k
k=2
hcf =
max
I(k)2
k
k=2
• 100
The frequency of up to three signals including the signals selected for the PLL source as
fU (voltage frequency) or fI (current frequency) can be measured. You can also select to
measure only three sets of voltage frequencies or only three sets of current frequencies.
Single-phase,
three-wire (1P3W)
Three-voltage,
Three-phase,
three-wire (3P3W) three-current(3V3A)
P1 + P2
SΣ [VA]
Three-phase,
four-wire (3P4W)
(U1 + U2 + U3) / 3
(I1 + I2 + I3) / 3
P1 + P2 + P3
(U1 + U2) / 2
(I1 + I2) / 2
IΣ [A]
PΣ [W]
1
I
PΣ2 + QΣ2
QΣ [var]
Q1 + Q2 + Q3
Q1 + Q2
PΣ
SΣ
λΣ
Note
•
•
Appendix
•
k, r, and j denote the harmonic order, real part, and imaginary part, respectively.
max denotes the upper limit of harmonic order under analysis (see section 17.6). The upper
limit is determined automatically (maximum is 100) by the frequency of the PLL source.
The numbers 1, 2, and 3 in the equations UΣ, IΣ, PΣ, SΣ, and QΣ indicate the case when
input elements 1, 2, and 3 are set to the wiring system shown in the table. If elements 2, 3,
and 4 are set to the wiring system shown in the table, replace the numbers 1, 2, and 3 with 2,
3, and 4, respectively. The same also holds true when using elements 5 and 6.
App
IM 760101-01E
App-5
Appendix 2 Determination of Delta Computation
Delta Computation Type, Sampled Data, and Measurement Function of Delta Computation
The sampled data in the table are substituted into the equations on the next page to
derive the computed results. The synchronization source for the delta computation is the
synchronization source (Sync Src) that is assigned to the first input element (smallest
number) of the wiring unit on which delta computation is to be performed.
Sampled Data That Are
Data Determined by the Delta
Delta
Substituted into the Equations
Computation and the Measurement
Computation
on the Next Page
Function Symbols Representing the Data
Type
i(t)
u(t)
3P3W
3V3A
u1 – u2
– i1 – i2
Line voltage of
the 3rd phase
∆Urms1 ∆Irms1
∆Umn1 ∆Imn1
∆Udc1 ∆Idc1
∆Uac1 ∆Iac1
u1 –
(u1+u2)
3
—
∆Urms1
∆Umn1
∆Udc1
∆Uac1
u2 –
(u1+u2)
3
—
∆Urms2
∆Umn2
∆Udc2
∆Uac2
Delta
Star
(u1+u2)
–
3
—
u1 – u2
u2 – u3
—
—
∆Urms1
∆Umn1
∆Udc1
∆Uac1
—
∆Urms2
∆Umn2
∆Udc2
∆Uac2
—
—
i1 + i2 + i3
Phase voltage
of each phase
Line current of
the neutral conductor
Presumption
u1 + u2 + u3 = 0
i1 + i2 + i3 = 0
∆Urms3
∆Umn3
∆Udc3
∆Uac3
∆Irms4
∆Imn4
∆Idc4
∆Iac4
i1 + i2 + i3
Star
Delta
u3 – u1
Phase voltage
of each phase
Line current of
the neutral conductor
Notes
Presumption
u1 + u2 + u3 = 0
∆Urms3
∆Umn3
∆Udc3
∆Uac3
∆Irms4
∆Imn4
∆Idc4
∆Iac4
Note
•
•
•
App-6
You can select the delta computation target from wiring units ΣA, ΣB, and ΣC. The input
element that is assigned to the selected element is the element on which delta computation is
performed. The numbers 1, 2, and 3 that are attached to sampled data u and i in the above
table indicate that elements 1, 2, and 3 are target elements on which delta computation is
performed. If the target elements of delta computation are 2, 3, and 4, replace the numbers
1, 2, and 3 that are attached to sampled data u and i with 2, 3, and 4, respectively. The same
also holds true when elements 5 and 6 are targets.
u1, u2, u3 denote the sampled data of voltage of elements 1, 2, and 3, respectively. i1, i2,
and i3 denote the sampled data of current of elements 1, 2, and 3, respectively.
The number (1, 2, 3, and 4) that is attached to the measurement function symbol of the delta
computation has no relation to the element number.
IM 760101-01E
Appendix 2 Determination of Delta Computation
Computed
Item
1
T
∆Urms
∆Umn
Computed
Item
Equation
π
2
∆Udc
∆Uac
T
1
T
∆Irms
{u(t)}2 dt
0
1
2 T
1
T
Equation
T
π
∆Imn
u(t) dt
2
0
T
0
∆Iac
∆Urms2 – ∆Udc2
{i(t)}2 dt
0
1
2 T
1
T
∆Idc
u(t) dt
T
T
i(t) dt
0
T
i(t) dt
0
∆Irms2 – ∆Idc2
Note
•
•
If the sampled data used in the computation does not exist (for example, when the input
element is not installed), the sampled data is considered to be 0 for the computation.
It is recommended that the measurement range and scaling (transformation ratio and
coefficients) of the elements on which delta computation is performed be set the same as
much as possible. Using a different measurement range or scaling causes the measurement
resolution of the sampled data to be different. In effect, the computation result will have
errors.
Display Format When Set to All Display
Delta
computation
[ 3P3W
3V3A ]
Measurement
functions
Delta
computation
[ Delta
Star ]
Measurement
functions
Delta
computation
[ Star
Delta ]
IM 760101-01E
∆Urms1 value
∆Umn1 value
∆Udc1 value
∆Uac1 value
1
∆Irm
∆Imn
∆Idc
∆Iac
∆Irms1 value
∆Imn1 value
∆Idc1 value
∆Iac1 value
∆Urm
∆Umn
∆Udc
∆Uac
∆Urms1 value
∆Umn1 value
∆Udc1 value
∆Uac1 value
∆Irm
∆Imn
∆Idc
∆Iac
∆Irms4 value
∆Imn4 value
∆Idc4 value
∆Iac4 value
∆Urm
∆Umn
∆Udc
∆Uac
∆Urms1 value
∆Umn1 value
∆Udc1 value
∆Uac1 value
∆Irm
∆Imn
∆Idc
∆Iac
∆Irms4 value
∆Imn4 value
∆Idc4 value
∆Iac4 value
1
Line voltage of the
3rd phase as
determined by the
delta computation
Line current of the
3rd phase as
determined by the
delta computation
2
∆Urms2 value
∆Umn2 value
∆Udc2 value
∆Uac2 value
3
∆Urms3 value
∆Umn3 value
∆Udc3 value
∆Uac3 value
4
1
Phase voltage of
each phase as
determined by the
delta computation
Line current of the neutral
conductor as determined
by the delta computation
2
∆Urms2 value
∆Umn2 value
∆Udc2 value
∆Uac2 value
3
∆Urms3 value
∆Umn3 value
∆Udc3 value
∆Uac3 value
4
Line voltage of
each phase as
determined by the
delta computation
Line current of the neutral
conductor as determined
by the delta computation
Appendix
Measurement
functions
1
∆Urm
∆Umn
∆Udc
∆Uac
App
App-7
Appendix 3 List of Initial Settings and Display Order
of Numerical Data
Initial Settings (Factory Default)
Item
Setting
RANGE
Element Object
U Range
Terminal
I Range
Sen Range
For a 5-A input element
Element1
1000 V
Direct
5A
10 V
SCALING
Element Object
Sensor Ratio
Scaling
Pt Ratio
Ct Ratio
Scaling Factor
Element1
10.0000 mV/A
Off
1.0000
1.0000
1.0000
WIRING
Pattern1
FILTER
Element Object
Line Filter
Zero Cross Filter
Element1
Off
Off
AVG
Averaging
Averaging Type
Exp. Count
Lin. Count
Off
Exp. (only during normal measurement)
2 (only during normal measurement)
8 (only during normal measurement)
For a 50-A input element
Element1
1000 V
Direct
50 A
10 V
MEASURE
Freq. Item
User Defined
Function1
Unit1
Expression1
Function2
Unit2
Expression2
Function3
Unit3
Expression3
Function4
Unit4
Expression4
∆Measure
Object
Type
S Formula
Pc Formula
P1 and P2 of IEC76-1
(1993)
Phase
Sync Measure
App-8
During normal measurement
U1, I1, U2
During harmonic measurement
U1, I1, U2
(up to 3 items including PLL Source)
Off
V
URMS(E1)
Off
A
IRMS(E1)
Off
V
UPPK(E1)
Off
A
IPPK(E1)
Off
V
U(E1,OR1)
Off
A
I(E1,OR1)
Off
W
P(E1,OR1)
Off
VA
S(E1,OR1)
ΣA
Off
Urms*Irms
IEC76-1(1976)
P1 = 0.5000, P2 = 0.5000
—
—
—
—
—
180 Lead/Lag
Master
—
Master
IM 760101-01E
Appendix 3 List of Initial Settings and Display Order of Numerical Data
Item
Setting
INTEGRATOR
Integrator Status
Reset status
INTEG SET
Mode
Timer Setting
Independent Mode
Start Time
End Time
Current Mode
Auto Cal
D/A Rated Time
SYNC SRC
Element Object
Sync Source
Normal
00000:00:00
Off
2001/01/01 00:00:00
2001/01/01 01:00:00
RMS
Off
00001:00:00T
(displayed when the optional D/A output is installed)
Element1
I1
DISPLAY-Numeric
Format
Item Amount
Norm Item No.
Harm Item No.
Function
Element
Order
DISPLAY-Wave Setting
Wave Display
On
Wave Format
Interpolate
Graticule
Scale Value
Trace Label
Wave Mapping
Mode
User Setting
During harmonic measurement
Numeric
4(2)
—
1
U
Element1
1
U1 to I6, Speed, Torque
Single
Line
Grid( )
On
Off
Auto
U1:0, I1:0, U2:1, I2:1, U3:2, I3:2, U4:3, I4:3, U5:0, I5:0, U6:1, I6:1,
Speed:2, Torque:2
DISPLAY-Bar Setting
Bar Format
Bar Item No.
Function
Element
Start Order
End Order
Single
1
U
Element1
1
100
DISPLAY-Vector Setting
Numeric
U Mag
I Mag
On
1.000
1.000
DISPLAY-Trend Setting
Trend Display
On
Trend Format
Trend Sampling
Trend T/div
Trend P/div
T1 to T8
Single
Off
3 s/div (during normal measurement)
50 (during harmonic measurement)
During normal measurement
T1
Urms
Element1
—
Auto
1.0000E+02
–1.0000E+02
During harmonic measurement
T1
U
Element1
1
Auto
1.0000E+02
–1.0000E+02
App-9
Appendix
Trend Object
Function
Element
Order
Scaling
Upper Scale
Lower Scale
IM 760101-01E
During normal measurement
Numeric
4(2)
1
—
Urms
Element1
—
App
Appendix 3 List of Initial Settings and Display Order of Numerical Data
Item
Setting
HOLD
Hold
Off
UPDATE RATE
Update Rate
500 ms
WAVE
Wave Sampling
Time/div
Trigger
Mode
Source
Slope
Level
V Zoom & Position
Element Object
(U) V Zoom
(U) Position
(I) V Zoom
(I) Position
Trend Sampling
CURSOR (for Wave)
Wave Cursor
Wave C1 Trace
Wave C2 Trace
Cursor Path
Wave C1 +
Wave C2 ×
App-10
Off
0.5 ms (only during normal measurement)
Auto
U1
Rise
0.0%
Element1
×1
0.00%
×1
0.00%
Off
Off
U1
I1
Max
During normal measurement
2.00 ms
8.00ms
CURSOR (for Bar)
Bar Cursor
Bar C1 +
Bar C2 ×
Off
1 order
15 order
CURSOR (for Trend)
Trend Cursor
Trend C1 Trace
Trend C2 Trace
Trend C1 +
Trend C2 ×
Off
T1
T2
6
54
HARMONICS
Mode
Object
PLL Source
Min Order
Max Order
Thd Formula
Window Width
Off
ΣA
U1
1
100
1/Total
8192
STORE
Store Status
Off
STORE SET
Mode
Store To
Store Setting
Mode
Count
Store Interval
Store Item
List Item
Manual
100
00:00:00
Numeric
Element1:On, U:On
MAX HOLD
Max Hold
Off
NULL
Null
Off
During harmonic measurement
10
490
Store
Memory
IM 760101-01E
Appendix 3 List of Initial Settings and Display Order of Numerical Data
Item
Setting
MOTOR SET (displayed when the optional motor evaluation function is installed)
Range (Speed)
20 V
Range (Torque)
20 V
Sense Type
Analog
Pulse Range
10000.0000
Line Filter
Off
Scaling(Speed)
1.0000
Scaling(Torque)
1.0000
Scaling(Pm)
1.0000
Unit (Speed)
rpm
Unit (Torque)
Nm
Unit (Pm)
W
Pulse N
60
Pole
2
Sync Speed
I1
Sync Source
None
Settings That Are Not Initialized through Initialization (MISC-Initialize Settings)
Item
FILE
File Item
Data Type
COPY MENU
Copy To
Format
Color
Information
Format
Color
MISC
Communication
GP-IB
Address
RS232
Band Rate
Format
Rx-Tx
Terminator
Date/Time
Display
Config
Message
LCD Brightness
Crest Factor
Key Lock
Graph Color
Mode
Text Color
Mode
SCSI
Own ID
HDD Motor
Setting
Setup
Binary (when File Item is Wave)
ASCII (when File Item is Numeric)
File
TIFF (when Copy To is File)
Off (when Copy To is File)
Off (when Copy To is Printer)
ESC-P2 (when Copy To is Net Print)
Off (when Copy To is Net Print)
1
19200
8-No-1
No-No
Cr+Lf
On
ENG
2
CF3
OFF
Default
Preset 1
6 (the optional built-in hard disk is fixed to 4)
On (displayed when the optional built-in hard disk is installed)
Appendix
App
IM 760101-01E
App-11
Appendix 3 List of Initial Settings and Display Order of Numerical Data
Display Order of the Numerical Data
• When the order of the numerical data is reset, the measurement function data are
displayed in the order given in the next table.
• The measurement function data of element 1 is displayed.
During Normal Measurement
App-12
Order
Measurement Function
1
2
3
4
5
6
7
8
9
10
11
12
13
14
15
16
17
18
19
20
21
22
23
24
25
26
27
28
29
30
31
32
33
34
35
36
37
38
39
40
41
42
43
44
45
46
47
48
49
50
51 to 100
Urms1
Umn(mean)1
Udc1
Uac1
Irms1
Imn(mean)1
Idc1
Iac1
P1
S1
Q1
λ1
φ1
fU(FreqU)1
fI(FreqI)1
U+pk1
U-pk1
I+pk1
I-pk1
CfU1
CfI1
FfU1
FfI1
Z1
Rs1
Xs1
Rp1
Xp1
Pc1
Time1
Wp1
WP+1
WP-1
q1
q+1
q-1
η
1/η
F1
F2
F3
F4
∆Urms1
∆Umn(mean)1
∆Udc1
∆Uac1
∆Irms1
∆Imn(mean)1
∆Idc1
∆Iac1
----------
IM 760101-01E
Appendix 3 List of Initial Settings and Display Order of Numerical Data
The following data is displayed on models with the motor evaluation function.
Order
Measurement Function
51
52
53
54
55
56
57
Speed
Torque
Sync
Slip
Pm
ηmA
ηmB
During Harmonic Measurement
Order
Measurement Functions (Order*)
1
2
3
4
5
6
7
8
9
10
11
12
13
14
15
16
17
18
19
20
21
22
23
24
25
26
27
28
29
30
31
32
33
34
35
36
37
38
39
40
41
42
43 to 100
U1
I1
P1
S1
Q1
U1(1)
I1(1)
P1(1)
S1(1)
Q1(1)
λ1(1)
φ1(1)
φU1(2)
φI1(2)
fU1(1)
fI1(1)
Z1(1)
Rs1(1)
Xs1(1)
Rp1(1)
Xp1(1)
Uhdf1(1)
Ihdf1(1)
Phdf1(1)
Uthd1
Ithd1
Pthd1
Uthf1
Ithf1
Utif1
Itif1
hvf1
hcf1
φU1-U2
φU1-U3
φU1-I1
φU1-I2
φU1-I3
F1
F2
F3
F4
----------
Harmonic orders are displayed inside parentheses.
Appendix
*
App
IM 760101-01E
App-13
Appendix 4 ASCII Header File Format
When waveform display data (Wave) is saved, the following two files are automatically
created in the directory.
• Waveform display data file (.wvf)
• ASCII header file (.hdr)
The ASCII header files explained here cannot be viewed on the WT1600. Use the data
such as when analyzing the waveforms on your PC.
//YOKOGAWA ASCII FILE FORMAT
$PublicInfo
App-14
FormatVersion
Model
Endian
DataFormat
GroupNumber
TraceTotalNumber
DataOffset
1.11
WT1600
Big
Trace
3
12
4096
$Group1
TraceNumber
BlockNumber
TraceName
BlockSize
VResolution
VOffset
VDataType
VUnit
VPlusOverData
VMinusOverData
VIllegalData
VMaxData
VMinData
HResolution
HOffset
HUnit
Date
Time
4
1
U1
1002
1.0000000E+00
0.0000000E+00
FS4
V
?
?
?
9.000000e+02
–9.000000e+02
2.0000000E–05
0.0000000E+00
sec
2001/06/30
07:03:03
I1
1002
1.0000000E+00
0.0000000E+00
FS4
A
?
?
?
3.000000e+03
–3.000000e+03
2.0000000E–05
0.0000000E+00
sec
2001/06/30
07:03:03
U2
1002
1.0000000E+00
0.0000000E+00
FS4
V
?
?
?
3.000000e+03
–3.000000e+03
2.0000000E–05
0.0000000E+00
sec
2001/06/30
07:03:03
I2
1002
1.0000000E+00
0.0000000E+00
FS4
A
?
?
?
1.500000e+02
–1.500000e+02
2.0000000E–05
0.0000000E+00
sec
2001/06/30
07:03:03
$Group2
TraceNumber
BlockNumber
TraceName
BlockSize
VResolution
4
1
U3
1002
1.0000000E+00
I3
1002
1.0000000E+00
U4
1002
1.0000000E+00
I4
1002
1.0000000E+00
IM 760101-01E
Appendix 4 ASCII Header File Format
VOffset
VDataType
VUnit
VPlusOverData
VMinusOverData
VIllegalData
VMaxData
VMinData
HResolution
HOffset
HUnit
Date
Time
0.0000000E+00
FS4
V
?
?
?
3.000000e+03
–3.000000e+03
2.0000000E–05
0.0000000E+00
sec
2001/06/30
07:03:03
0.0000000E+00
FS4
A
?
?
?
1.500000e+01
–1.500000e+01
2.0000000E–05
0.0000000E+00
sec
2001/06/30
07:03:03
0.0000000E+00
FS4
V
?
?
?
3.000000e+03
–3.000000e+03
2.0000000E–05
0.0000000E+00
sec
2001/06/30
07:03:03
0.0000000E+00
FS4
A
?
?
?
1.500000e+01
–1.500000e+01
2.0000000E–05
0.0000000E+00
sec
2001/06/30
07:03:03
$Group3
TraceNumber
BlockNumber
TraceName
BlockSize
VResolution
VOffset
VDataType
VUnit
VPlusOverData
VMinusOverData
VIllegalData
VMaxData
VMinData
HResolution
HOffset
HUnit
Date
Time
4
1
U5
1002
1.0000000E+00
0.0000000E+00
FS4
V
?
?
?
3.000000e+03
–3.000000e+03
2.0000000E–05
0.0000000E+00
sec
2001/08/30
07:03:03
I5
1002
1.0000000E+00
0.0000000E+00
FS4
A
?
?
?
1.500000e+02
–1.500000e+02
2.0000000E–05
0.0000000E+00
sec
2001/08/30
07:03:03
U6
1002
1.0000000E+00
0.0000000E+00
FS4
V
?
?
?
3.000000e+03
–3.000000e+03
2.0000000E–05
0.0000000E+00
sec
2001/08/30
07:03:03
I6
1002
1.0000000E+00
0.0000000E+00
FS4
A
?
?
?
1.500000e+02
–1.500000e+02
2.0000000E–05
0.0000000E+00
sec
2001/08/30
07:03:03
$PrivateInfo
Mode
ModelVersion
Wave Normal
1.01
(Note) The header file is a common file used by YOKOGAWA’s measuring
instruments. Therefore, data that is not required by the WT1600 (0s) is also
included.
Appendix
App
IM 760101-01E
App-15
Appendix 4 ASCII Header File Format
$PublicInfo (Common Information)
FormatVersion: Header file version No. (common to YOKOGAWA’s header files)
Model: Model name
Endian: Endian mode when saving data (Big)*1
DataFormat: Storage format of the binary waveform display data (Trace)*2
GroupNumber: The number of “$Group”s indicated below
TraceTotalNumber: Total number of target waveforms
DataOffset: Start position of the binary waveform display data*3
$Group1 (Group Information)
TraceNumber: Number of waveforms in this group
BlockNumber: Number of blocks in this group*4
TraceName: Name of each waveform
BlockSize: Number of data points in a single block of each waveform
VResolution: Value of coefficient VResolution of the Y-axis conversion equation of
each waveform*5
VOffset: Value of coefficient VOffset of the Y-axis conversion equation of each
waveform*5
VDataType: Type of binary waveform display data of each waveform*6
VUnit: Unit used on the Y-axis of each waveform (no effect on the data)
VPlusOverData: Error data when the binary data of each waveform is greater than or
equal to this value
VMinusOverData: Error data when the binary data of each waveform is less than or
equal to this value
VMaxData: Maximum value of the binary data of each waveform
VMinData: Minimum value of the binary data of each waveform
HResolution: Value of coefficient HResolution of the X-axis conversion equation of
each waveform
HOffset: Value of coefficient HOffset of the X-axis conversion equation of each waveform
HUnit: Unit used on the X-axis of each waveform (no effect on the data)
Date: Date when the trigger occurred
Time: Time when the trigger occurred
$PrivateInfo (Model-Specific Information)
Mode: Two types available, Wave Normal and Wave Harmonics.
ModelVersion: Version No. of the instrument
*1 Endian mode when saving data
Big: Motorola 68000-family data
*2 Storage format of the binary waveform display data
Trace: Format in which each block contains a waveform
*3 Start position of the binary waveform display data
Offset from the beginning of the file. Always 4096 on the WT1600
*4 Maximum number of blocks in the group
Maximum number of blocks when the number of blocks varies for each waveform. Always 1
on the WT1600.
*5 Conversion equation of the Y-axis of each waveform
Y-axis value = VResolution × raw data + VOffset
*6 Data type
ISn: n-byte signed integer
IUn: n-byte unsigned integer
FSn: n-byte signed real number
FSn: n-byte unsigned real number
Bm: m-bit data
App-16
IM 760101-01E
Appendix 5 Power Basics (Power/Harmonics/Three
Constants Related to the AC Circuit)
This section describes the basic concepts of power, harmonics, and the three constants
related to the AC circuit.
Power
Electrical energy is transformed and used in different forms such as heat in an electric
heater or an electric furnace, rotational power to drive motors, and light in fluorescent
and mercury lamps. Power (electric power) represents the amount of work that the
electricity (electrical energy) performs on these types of loads over a unit amount of time.
The unit of power is W (watts). When 1 joule of work is done over a period of 1 second,
the electrical power is equal to 1 W.
DC power
DC power P[W] can be determined by the product of the applied voltage U(V) and the
current I[A].
P = UI [W]
In the following figure, electrical energy indicated in the above equation is taken from
the power source and dissipated at R[Ω] (load).
I
U
R
AC (alternating current)
The electricity supplied by the power company is an alternating current. The
waveform is sinusoidal. The amplitude of an AC signal an be expressed in terms of
the instantaneous values, maximum values, rms values, and mean values. In
general, it is expressed in terms of rms values.
The instantaneous value of the current of a sine wave, i, is expressed as Imsinωt (Im :
max. value of current, ω : angular velocity where ω = 2πf, f : frequency of the AC
signal). The heating effect of the AC signal is proportional to i2 and varies as shown in
the following figure.
*
Refers to the electrical energy being converted to heat energy due to current flowing
through the resistor.
i2
Im
2
Same area
Im
Rms value I
π
Mean of i2
2π
ωt
i = Imsinωt
The rms value (effective value) is the value of the DC signal that generates the same
heating effect as the AC signal. If the value of the DC signal that generates the same
heating effect is expressed as I, then
Mean over one period of i
1
=
2π
2π
2
i dωt
0
=
Im
2
Because this value is equal to the square root of the mean of the square of the
instantaneous values (i) over one period (in short, rms), the symbol “rms” is generally
used to denote the effective value.
IM 760101-01E
App-17
Appendix
I=
2
App
Appendix 5 Power Basics (Power/Harmonics/Three Constants Related to the AC Circuit)
For the mean value, since taking the average over one period of a sine wave results
in zero, the mean is determined using the absolute value over one period of the
signal. As with the rms value, if the mean value of the current of the instantaneous
value i = Imsinωt is expressed as Imn, then,
Imn = Mean over one period of i =
1
2π
2π
i dωt =
0
2
Im
π
This relationship is the same for the voltage of the sine wave.
The maximum value, rms value, and mean value of an AC sine wave are related in
the following way. These values are used to calculate the crest factor and the form
factor which are used to determine the trend of an AC signal.
App-18
Crest factor =
Maximum value
Rms value
Form factor =
Rms value
Mean value
IM 760101-01E
Appendix 5 Power Basics (Power/Harmonics/Three Constants Related to the AC Circuit)
Vector Display of an AC signal
In general, the instantaneous values of voltage and current are expressed by the
following equations.
Voltage : u = Umsinωt
Current : i = Imsin(ωt – φ)
The time offset of the voltage and current is called the phase difference, and φ is
called the phase angle. This time offset is mainly created by the load that is supplied
with power. In general, when there is only resistance in the load, the phase difference
is zero; when there is inductance (coil) in the load, the current lags behind the voltage;
when there is capacitance in the load, the current leads the voltage.
When the current lags the voltage
u
When the current leads the voltage
u
i
i
π
0
2π
ωt
π
0
φ
2π
ωt
φ
The vector display is used to show the amplitude and phase relationships of the
voltage and current. Taking the positive vertical axis to be the reference, an angle in
the counter clockwise direction is taken to be positive.
To clearly indicate that the graph is showing a vector, a dot is placed on the top of the
symbol representing the value. The amplitude of the vector represents the rms value.
When the current lags the voltage
When the current leads the voltage
U
U
φ
φ
I
I
The vector display of the voltage and current of a three-phase AC signal would look
something like the following figure.
U1
I1
φ
I3
φ
φ
U2
Appendix
U3
I2
App
IM 760101-01E
App-19
Appendix 5 Power Basics (Power/Harmonics/Three Constants Related to the AC Circuit)
AC power
Because a phase difference depending on the load exists between the voltage and
current, AC power is not as easily determined as DC power.
When the instantaneous voltage is u = Umsinωt and the instantaneous current is
i = Imsin(ωt – φ), the instantaneous power, p, is
p = u × i = Umsinωt × Imsin(ωt – φ) = UIcosφ – UIcos(2ωt – φ)
where U and I represent the rms values of the voltage and current, respectively.
p becomes the sum of the time-independent term, “UIcosφ” and the AC component of
twice the frequency of the voltage or current, “–UIcos(2ωt – φ).”
The mean value of power over one period is called the AC power. Taking the mean
over one period, the AC power, P, becomes
P = UIcosφ [W]
The power varies depending on the phase difference, φ, even when the voltage and
current are the same. As shown in the figure below, the section above the horizontal
axis represents positive power (power supplied to the load) and the section below the
horizontal axis represents negative power (power delivered from the load). The
difference between the two is the power dissipated by the load. As the phase
difference between the voltage and current increases, negative power increases.
At φ = π/2, the positive and negative powers become equal and no power is dissipated
in the load.
When the phase difference between the voltage and current is 0
Positive power
p
u
Mean power P = UI
π
0
2π
i
ωt
When the phase difference between the voltage and current is φ
u
Positive power
p
i
Mean power P = UIcosφ
π
0
2π
ωt
Negative power
φ
When the phase difference between the voltage and current is
π
2
u
p
π
2
0
i
Mean power P = UIcos
π
2π
π
=0
2
ωt
Positive and negative powers are equal
App-20
IM 760101-01E
Appendix 5 Power Basics (Power/Harmonics/Three Constants Related to the AC Circuit)
Active power and the power factor
Not all of the power represented by the product of the voltage and current, UI, is
dissipated. The product, UI, is called the apparent power (S). The unit is VA (voltampere). Apparent power is used to express the electrical capacity of the devices
that run under AC power.
Of the apparent power, the true power that is dissipated by the device is called the
active power or effective power (P). This power is the same as the AC power
described earlier.
S = UI [VA]
P = UIcosφ [W]
cosφ represents the ratio of the true power with respect to the apparent power and
this ratio is called the power factor (λ).
Reactive power
When the current I lags the voltage U by φ, the component of the power in the same
direction as the voltage U is expressed as Icosφ and the component of the power
perpendicular to the voltage U is expressed as Isinφ. The active power P=UIcosφ is
the product of the voltage U and the current component Icosφ. Conversely, the
product of the voltage U and the current component Isinφ is called reactive power (Q)
and its unit is var.
Q = UIsinφ [var]
U
Isinφ
Icosφ
I
φ
Apparent power S, active power P, and reactive power Q are related in the following
way.
S2 = P2 + Q2
Appendix
App
IM 760101-01E
App-21
Appendix 5 Power Basics (Power/Harmonics/Three Constants Related to the AC Circuit)
Harmonics
Harmonics are sine waves that have frequencies that are integer multiples of the frequency of a
fundamental signal (generally a 50/60-Hz sinusoid in the field of power). The current power that
flows through the power rectification circuit, phase control circuit, and other circuits that are used
in various electrical devices, generates harmonic voltages and currents on the power line. When
the fundamental signal and harmonic signals are combined, the waveform is distorted, and this
can cause interference to devices that are connected to the power line.
Terminology
The following terms are related to harmonics.
• Fundamental wave (fundamental component)
Periodic complex waves are divided into different sinusoid groups. The
fundamental wave is the signal with the longest period. It is the sinusoid that has
the fundamental frequency among the periodic complex wave.
• Fundamental frequency
This is the frequency corresponding to the period of the periodic complex wave. It
is the frequency of the fundamental wave.
• Distorted wave
The distorted wave has a waveform that is different from the fundamental wave.
• Higher harmonic
Sinusoids that have frequencies that are integer multiples (2 or greater) of the
fundamental frequency.
• Harmonic component
The signal component of the waves that have frequencies that are integer multiples
(2 or greater) of the fundamental frequency.
• Harmonic distortion factor
The ratio of the rms value of the nth harmonic signal contained in the distorted
waveform to the rms value of the fundamental signal or total signal.
• Harmonic order
The integer ratio of the harmonic frequency with respect to the fundamental frequency.
• Total harmonic distortion
The ratio of the rms value of all harmonics to the rms value of the fundamental
signal or total signal.
Interference caused by harmonic signals
Harmonic signals that adversely affect electric devices and facilities are as follows:
• Phase advance capacitor or series reactor
The reduction of circuit impedance caused by the harmonic current causes excessive
current to flow resulting in vibration, humming, overheating, and burnouts.
• Cable
Overheating of the neutral conductor caused by harmonic currents flowing through
it in a three-phase four-wire system.
• Potential transformer
Causes magnetostrictive noise of the iron core which leads to increased iron and
copper losses.
• Breaker and fuse
Erroneous operation caused by excessive harmonic current. Causes fuse to blow.
• Communication
Causes noise voltage from electro-magnetic induction.
• Control device
Erroneous operation caused by distorted control signals.
• Audio-visual equipment
Deterioration of performance and life span. Flicker caused by video noise.
Malfunction of parts.
App-22
IM 760101-01E
Appendix 5 Power Basics (Power/Harmonics/Three Constants Related to the AC Circuit)
Three Constants Related to the AC Circuit
Resistance
Current i when the instantaneous value of u = Umsinωt of AC voltage is applied to load
resister R[Ω] is expressed by the following equation. Im denotes the maximum value
of the current.
Um
i=
sinωt = Im sinωt
R
If expressed in terms of the rms value, the equation becomes I = U / R.
The current flowing through a resistive circuit has no phase difference with respect to
the voltage.
U
I
R
I
U
Inductance
Current i when the instantaneous value of u = Umsinωt of AC voltage is applied to the
load inductance L[H] is expressed by the following equation.
i=
Um
π
sin ωt –
2
XL
π
2
= Im sin ωt –
If expressed in terms of the rms value, the equation becomes I = U / XL where XL =
ωL. XL is called inductive reactance and its unit is Ω.
Inductance has the effect of inhibiting the current from changing, and consequently
the current phase lags that of the voltage.
I
L
U
π
U
2
I
Static capacitance
Current i when the instantaneous value of u = Umsinωt of AC voltage is applied to the
load capacitance C[F] is expressed by the following equation.
i=
Um
π
sin ωt +
2
XC
π
2
= Im sin ωt +
If expressed in terms of the rms value, the equation becomes I = U / XC, where XC = 1
/ ωC. XC is called capacitive reactance and its unit is Ω.
When the polarity of the voltage changes, the maximum charge current that has the
same polarity as the voltage flows through the capacitor. When the voltage
decreases, discharge current that has the opposite polarity as the voltage flows
through the capacitor. Thus, the current phase advances with respect to the voltage.
I
C
U
I
π
2
Appendix
U
App
IM 760101-01E
App-23
Appendix 5 Power Basics (Power/Harmonics/Three Constants Related to the AC Circuit)
R, L, C series circuit
The voltage when resistance RS[Ω], inductance L[H], and static capacitance C[F] are
connected in series is expressed by the following equation.
U=
(URS)2 + (UL – UC)2 =
(IRS)2 + (IXL – IXC)2
= I (RS)2 + (XL – XC)2 = I RS2 + XS2
U
I=
RS2 + XS2
XS
RS
, φ = tan–1
UL
RS
L
C
URS
UL
UC
I
I
UC
U
URS
φ
U
The relationships between resistance RS, reactance XS, and impedance Z are
expressed as follows :
XS = XL – XC
Z=
RS2 + XS2
R, L, C parallel circuit
The current when resistance RP[Ω], inductance L[H], and static capacitance C[F] are
connected in parallel is expressed by the following equation.
I=
=U
U=
(IRP)2 + (IL – IC)2 =
1
RP
2
+
1
1
–
XL
XC
IRPXP
2
RP + XP
IC
C
IL
L
IRP
RP
2
U
RP
2
2
1
RP
= U
, φ = tan–1
2
U
U
–
XL
XC
+
2
+
1
XP
2
RP
XP
IL
U
IRP
I
IC
φ
I
U
The relationship between resistance RP, reactance XP, and impedance Z are
expressed as follows :
XP =
Z=
XLXC
XC – XL
RPXP
RP2 + XP2
App-24
IM 760101-01E
Index
Symbols
C
(I) Position ........................................................................... 9-9
(I) V Zoom ........................................................................... 9-9
(U) Position ......................................................................... 9-9
(U) V Zoom ......................................................................... 9-9
1/Fundamental .................................................................. 7-13
1/Total ............................................................................... 7-13
180 Lead/Lag .................................................................... 6-18
180dpi ............................................................................. 13-13
2048 .................................................................................. 7-14
3-month accuracy ............................................................. 17-7
360 degrees ...................................................................... 6-18
360dpi ............................................................................. 13-13
CAL ................................................................................. 15-12
circuit with voltage input exceeding 600 V ........................ 3-19
clear .................................................................... 11-10, 11-18
color .................................................................... 12-21, 13-13
color output ......................................................... 13-13, 13-14
comment ............... 11-14, 11-18, 12-14, 12-18, 13-13, 14-5
Config .............................................................................. 15-14
Connect Log List ............................................................. 13-21
Continuous ........................................................................ 6-20
Convert Memory ............................................................. 11-14
Convert Memory Exec .................................................... 11-15
copy .................................................................... 12-32, 13-13
copy destination .............................................................. 12-34
copy source ..................................................................... 12-33
Copy to .................................. 12-20, 13-12, 14-2, 14-5, 14-7
corrected power ................................................................ 1-18
corrected power, equation of ............................................ 6-16
count ................................................................................. 5-19
crest factor ............................................. 5-29, 17-10, App-18
CT ratio ............................................................................. 5-15
CT ratio, setting of ............................................................. 5-15
current, determination of ..................................................... 1-4
current input terminal .......................................................... 2-1
current input terminal, construction of .................................... ii
current mode ........................................................... 6-29, 6-30
current range, list of ............................................................ 5-8
current range, setting of ...................................................... 5-5
current sensor input connector ................................. 2-1, 5-10
current sensor input connector, connection to .................. 3-12
current sensor range, copying of ...................................... 5-11
current sensor range, setting of ........................................ 5-10
current sensor transformation ratio, copying of ................. 5-12
current sensor transformation ratio, setting of .................. 5-11
cursor .......................................................... 7-21, 9-21, 10-14
cursor measurements ................................. 1-28, 9-21, 10-14
cursor path ........................................................................ 9-22
A
abort ............................................ 11-15, 12-15, 12-24, 13-13
AC circuit, three constants ........................................... App-23
AC power ..................................................................... App-20
AC signal, vector display of .......................................... App-19
accessories, optional ............................................................. v
accessories, standard ........................................................... iv
accuracy ............................................................................ 17-7
active power ................................................................. App-21
aliasing .............................................................................. 1-24
All ........................................................................................ 4-7
All Reset .............................................................. 12-30, 12-33
All Set .................................................................. 12-30, 12-33
ambient humidity ................................................................. 3-2
ambient temperature ........................................................... 3-2
angular velocity ............................................................ App-17
apparent power ............................................................ App-21
apparent power, equation for .................................. 1-18, 6-15
ASCII ................................................................... 12-16, 12-17
attenuation constant .......................................................... 5-19
attribute ........................................................................... 12-27
Auto Cal ............................................................................ 6-30
auto naming .................................................................... 12-14
auto naming function ........................................... 11-18, 12-19
auto range ......................................................................... 1-10
auto scaling ..................................................................... 10-13
average count ................................................................... 5-19
averaging ................................................................ 1-12, 5-19
averaging type, selection of .............................................. 5-19
AVG .................................................................................. 5-19
Avg Type ........................................................................... 5-19
B
Bar .................................................................................... 4-12
Bar C1 + ............................................................................ 7-21
bar cursor .......................................................................... 7-21
bar graph ................................................................. 1-29, 4-12
bar graphs, print format of ............................................... 14-11
Bar Item No. ...................................................................... 7-20
binary .................................................................. 12-12, 12-16
block diagram ...................................................................... 1-2
BMP ................................................................................ 12-22
D/A output ......................................................................... 1-33
D/A output connector .......................................................... 2-1
D/A output connector, pin arrangement of ........................ 15-5
D/A output items ..................................................... 15-1, 15-5
D/A Output Rated Time ..................................................... 15-4
D/A output voltage ............................................................ 15-7
data compression ............................................................ 12-21
data length ...................................................................... 17-12
data points ........................................................................ 1-24
data size ...................................... 11-17, 12-16, 12-17, 12-22
data type ............. 11-14, 11-17, 12-12, 12-13, 12-16, 12-17
data update interval ............................................................ 1-8
data update rate ...................................................... 1-13, 5-22
date/time ................................................................. 3-22, 3-23
default gateway ....................................................... 13-3, 13-6
delete .................................................................. 12-26, 12-29
Delete Exec ..................................................................... 12-30
delta computation .................................................... 1-18, 6-12
delta computation, determination of ............................... App-6
DMeasure ......................................................................... 6-12
DHCP ................................................................................ 13-3
directory .......................................................................... 11-18
Index-1
Index
IM 760101-01E
D
Index
Index
directory, creation of ....................................................... 12-39
directory, renaming of ..................................................... 12-39
directory, selection of ...................................................... 12-18
disk, formatting of .................................................... 12-6, 12-9
display ................................................................................. 4-1
display colors .................................................................... 1-34
display format ................................ 4-7, 4-8, 4-11, 4-13, 4-16
display interpolation ................................................ 1-27, 9-16
display resolution .............................................................. 1-14
display segments .............................................................. 1-24
displayed items, number of ......................................... 4-7, 4-8
distorted wave .............................................................. App-22
distortion factor, equation for ............................................ 1-19
DNS ........................................................................ 13-3, 13-6
DNS server address .......................................................... 13-6
domain name .......................................................... 13-4, 13-6
domain suffix ..................................................................... 13-6
dual list .............................................................. 1-17, 4-9, 7-4
FTP client function ............................................................ 1-32
FTP passive .................................................................... 13-25
FTP server ........................................................................ 13-9
FTP server function ........................................................... 1-33
function ........ 6-2, 7-3, 7-4, 7-20, 10-3, 10-4, 12-6, 12-26,
12-29, 12-32, 12-36, 15-2, 15-3
fundamental frequency ................................................ App-22
fundamental wave ........................................................ App-22
fuse rating ......................................................................... 16-9
G
GP-IB ................................................................................ 1-33
graph color ...................................................................... 15-16
graphic color ....................................................... 15-16, 15-18
graticule .................................................................. 1-27, 9-17
H
E
efficiency ............................................................................. 1-4
element ...... 1-4, 1-7, 2-1, 6-2, 7-3, 7-4, 7-20, 10-3, 10-4,
15-2, 15-3
Element Object ........... 5-4, 5-10, 5-11, 5-14, 5-17, 6-4, 9-8
element, selection of ..................... 5-4, 5-10, 5-14, 5-17, 6-4
End Order ......................................................................... 7-20
equation ................................................ 6-9, 6-10, 7-16, 7-17
error messages ................................................................. 16-2
ESC-P ............................................................................. 13-12
Ethernet .................................................................. 1-32, 13-1
Ethernet connector .............................................................. 2-1
Ethernet interface .............................................................. 13-2
expendable items ............................................................ 16-10
Ext Clk ................................................................................. 7-9
extension ................................................. 12-16, 12-17, 12-22
extensions of numerical data .......................................... 11-17
external clock input connector ............................................ 2-1
external dimensions ............................................ 17-19, 17-21
external start/stop signal
input/output connector ........................................................ 2-1
F
FFT processing word length ........................................... 17-12
file . 12-6, 12-11, 12-20, 12-23, 12-26, 12-29, 12-32, 12-36
file attributes ........................................................ 12-27, 12-28
File Item .............................................................. 12-11, 12-23
file list .................................................................. 11-14, 12-20
File List dialog box .......................................................... 11-18
file name ..................................... 11-14, 11-18, 12-14, 12-18
file properties .................................................................. 12-26
files, copying of ............................................................... 12-32
files, deleting of ............................................................... 12-29
files, renaming of ............................................................. 12-39
filter ........................................................... 5-17, 11-15, 12-27
Filter Copy Exec ................................................................ 5-18
float ......................................................... 12-12, 12-16, 12-17
floppy disk drive ................................................................ 12-1
floppy disk, formatting of ................................................... 12-9
form factor .................................................................... App-18
format ............................ 4-1, 12-6, 12-7, 12-8, 12-21, 13-12
Format Exec ...................................................................... 12-8
format type ........................................................................ 12-8
Freq Item ............................................................................. 6-7
frequency measurement target ........................................... 6-7
front panel ........................................................................... 2-1
Index-2
hard disk, formatting of ..................................................... 12-9
Harm Item No. ........................................................... 7-3, 15-3
Harmonic component ................................................... App-22
harmonic distortion factor ............................................. App-22
Harmonic order ............................................................ App-22
harmonics ............................. 7-1, 7-7, 7-8, 7-11, 7-13, 7-14
HDD Motor ........................................................................ 12-2
higher harmonic ........................................................... App-22
hold ......................................................................... 1-13, 5-24
horizontal axis ....................................................... 1-23, 10-11
humidity (ambient) .............................................................. 3-2
I
I Range Down Exec .................................................. 5-5, 5-10
I Range Up Exec ....................................................... 5-5, 5-10
independent control ................................................ 6-20, 6-23
inductance .................................................................... App-23
information ........................................ 4-17, 13-23, 14-7, 16-8
initial settings ................................................................. App-8
initialization ........................................................... 1-33, 15-10
Initialize Memory Exec .................................................... 11-10
Initialize SCSI .................................................................... 12-4
Initialize Settings ............................................................. 15-10
input filter ...................................................... 1-11, 5-17, 5-18
input filter, copying of ........................................................ 5-18
input terminal, connection to ..................................... 3-9, 3-16
installation conditions .......................................................... 3-2
installation position .............................................................. 3-3
instantaneous value ..................................................... App-17
Instrument No. ...................................................................... iii
insulation resistance ....................................................... 17-19
INTEG SET ......................................... 6-20, 6-23, 6-29, 15-4
Integ Sync ......................................................................... 11-1
integrated D/A output, rated time of .................................. 15-7
Integration, Allowable Frequency Range .......................... 6-35
integration auto calibration ................................................ 6-30
integration, holding of ........................................................ 6-31
integration mode ............................................................... 1-20
integration overflow ........................................................... 6-35
integration, resetting of ..................................................... 6-31
integration, resolution of .................................................... 6-35
integration, starting of ....................................................... 6-31
integration, stopping of ...................................................... 6-31
integration timer ...................................................... 6-22, 6-27
internal memory, initialization of .......................... 11-10, 11-18
interpolate ......................................................................... 9-16
IM 760101-01E
Index
interval ............................................................................ 13-17
Interval Setting .................................................................. 11-3
IP address ............................................................... 13-3, 13-5
Item Amount ................................................................ 4-2, 4-4
Item Copy Exec ................................................................... 6-5
Item Down Exec .................................................................. 6-4
Item Up Exec ...................................................................... 6-4
items not covered by warranty ........................................ 16-10
J
jog shuttle ............................................................................ 2-3
K
key lock ........................................................................... 15-19
keyboard ........................................................................... 16-6
keyboard, testing of ........................................................... 16-7
keys ..................................................................................... 2-3
keys, testing of .................................................................. 16-7
measurement functions, determination of ...................... App-1
measurement functions, symbols of .............................. App-1
measurement method ..................................................... 17-10
measurement period ........................................................... 1-8
measurement range .................................................. 1-10, 5-4
media .................................................................. 11-14, 11-18
media information ................................................... 12-7, 12-9
medium, selection of ....................................................... 12-18
memory ............................................................................. 16-6
memory test ...................................................................... 16-7
menu ..................................... 12-20, 13-12, 14-2, 14-5, 14-7
message ......................................................................... 15-14
message language ................................................ 1-34, 15-14
Mid .................................................................................... 9-22
Min Order .......................................................................... 7-11
minimum harmonic order to be analyzed .......................... 7-11
MISC 12-2, 12-4, 13-2, 13-8, 13-11, 13-15, 13-19, 13-23,
13-24, 15-1, 15-10, 15-14, 15-16, 16-6, 16-8
mode ..................................................... 6-20, 6-23, 7-1, 11-1
MODEL .................................................................................. ii
motor efficiency ................................................................. 8-16
MOTOR SET ......................... 8-3, 8-6, 8-7, 8-10, 8-12, 8-14
L
labels ....................................................................... 1-28, 9-19
line filter ..................................................................... 5-17, 8-6
line filter, selection of ........................................................ 5-17
list display ................................................................. 1-16, 4-8
list item ................................................ 7-4, 11-7, 12-13, 14-8
List Item No. ........................................................................ 7-4
load ....................................................................... 1-32, 12-24
Load Exec ....................................................................... 12-24
logging list ....................................................................... 13-21
logical format ................................................................... 12-10
login name ............................................................ 13-9, 13-10
lower limit ........................................................................ 10-13
Lower Scale .................................................................... 10-13
LPR client function ............................................................ 1-33
LPR Name ...................................................................... 13-12
LPR Server ..................................................................... 13-12
LPR Time Out ................................................................. 13-25
M
IM 760101-01E
Net Drive Setup ................................................................. 13-8
Net Print .......................................................................... 13-12
Net Print Setup ................................................................ 13-11
network ................... 13-2, 13-8, 13-11, 13-15, 13-19, 13-24
network connection ........................................................... 13-1
network printer ................................................................ 13-12
NO. ........................................................................................ iii
normal ............................................................................... 6-20
normal integration mode ................................................... 6-22
NULL ............................................................................... 15-13
NULL function ................................................................... 1-34
numeric ............................................... 4-1, 7-23, 11-6, 12-11
Numeric Disp Items ..................................................... 6-2, 7-3
Numeric+Wave ................................................................. 11-6
numerical data, display order of ................................... App-12
numerical data list, printing of ......................................... 14-10
numerical data, saving of ................................................ 12-17
numerical display (harmonic measurement) ..................... 1-15
numerical display (normal measurement) ......................... 1-14
O
object .................................................................................. 7-7
one year accuracy ............................................................. 17-8
one-to-one connection ...................................................... 13-1
operating altitude ............................................................ 17-19
operating conditions ........................................................ 17-19
operation keys ..................................................................... 2-3
operators ................................................................. 6-11, 7-18
options .................................................................................. iii
order ................................................................ 7-3, 10-4, 15-3
others .............................................................................. 13-24
output command ................................................. 13-12, 13-14
Own ID .............................................................................. 12-4
P
P-P compression ............................................................... 1-24
package, contents of .............................................................. ii
paper feed ......................................................................... 14-2
partitions ............................................................... 12-8, 12-10
password ....................................... 13-9, 13-10, 13-20, 13-21
Index-3
Index
MAC address .................................................................. 13-23
mail address .................................................................... 13-16
mail server .......................................................... 13-16, 13-17
mail setup ........................................................................ 13-15
mail test ........................................................................... 13-17
mail, transmission of ....................................................... 13-15
MailBaseTime ................................................................. 13-16
manual .............................................................................. 11-1
manual scaling ................................................................ 10-13
master ............................................................................... 5-26
master/slave synchronized measurement ........................ 1-13
Max ................................................................................... 9-22
MAX hold ................................................................ 1-13, 5-25
maximum harmonic order to be analyzed ......................... 7-11
maximum output current ................................................. 17-13
maximum power consumption ........................................ 17-19
maximum value ............................................................ App-17
mean value .................................................................. App-18
measure ............................ 5-26, 6-7, 6-12, 6-15, 6-18, 7-15
measurement function symbols, meanings of ............. 4-6, 4-8
measurement function types (harmonic measurement) ...... 1-5
measurement function types (motor evaluation funct ......... 1-7
measurement function types (normal measurement) ......... 1-3
measurement functions (of integration) ............................ 1-20
N
Index
Index
pattern ................................................................................. 5-1
phase ................................................................................ 6-18
phase angle ................................................................. App-19
phase difference ............................................................... 1-19
physical format ................................................................ 12-10
pin arrangement ...................................................... 15-5, 15-9
PLL source .......................................................................... 1-7
PLL Source Down Exec ...................................................... 7-8
PLL Source Up Exec ........................................................... 7-8
Pm, scaling of ................................................................... 8-14
pole ................................................................................... 8-12
PostScript ................................................ 12-21, 12-22, 13-12
power ........................................................................... App-17
power coefficient, setting of .............................................. 5-15
power connector ................................................................. 2-1
power cord ............................................................................ iii
power factor ................................................................. App-21
power fuse ................................................................ 2-1, 16-9
power loss ........................................................................... 3-6
power, mean value of ................................................... App-20
power range ...................................................................... 1-10
power supply ....................................................................... 3-8
power switch, turning ON/OFF of ...................................... 3-20
precautions, use of the instrument ...................................... 3-1
Preset1 ........................................................ 11-7, 12-13, 14-8
Preset2 ........................................................ 11-7, 12-13, 14-8
primary .............................................................................. 13-4
print ................................................................................... 1-32
printer ............................................................ 14-2, 14-5, 14-7
printer cover ...................................................................... 14-1
printer name ........................................................ 13-12, 13-14
printer roll paper ................................................................ 14-4
printer server ....................................................... 13-12, 13-14
properties .................................... 11-15, 11-19, 12-27, 12-28
protective earth ground ....................................................... 3-8
PT ratio ............................................................................. 5-14
PT ratio, setting of ............................................................. 5-14
pulse input range, setting of ................................................ 8-4
Pulse N ............................................................................... 8-8
Pulse Range ....................................................................... 8-4
push .................................................................................. 14-1
Q
Quad ....................................................................... 9-13, 10-8
R
R ..................................................................................... 12-28
R-Continuous .................................................................... 6-23
R-Normal ........................................................................... 6-23
R/W ................................................................................. 12-28
rack mount .......................................................................... 3-3
range ......................................................................... 5-4, 5-10
Range Copy Exec ..................................................... 5-5, 5-11
range, copying of ................................................................ 5-5
rasters ............................................................................... 1-24
rated supply voltage ........................................................ 17-19
rated supply voltage frequency ....................................... 17-19
reactive power .............................................................. App-21
real-time .................................................................. 11-2, 11-4
real-time control ...................................................... 6-24, 11-4
real-time normal integration mode .................................... 6-27
real-time repetitive integration mode ................................. 6-27
rear panel ............................................................................ 2-1
recall ..................................................................... 1-32, 11-20
Recall No. ....................................................................... 11-20
Index-4
recipient mail address ..................................................... 13-17
release lever ..................................................................... 14-1
repetitive integration mode ...................................... 6-22, 6-27
reservation time ................................................................ 6-28
Reset List Exec ................................................................... 6-2
resistance ..................................................................... App-23
resolution ........................................................................ 13-13
response time ................................................................. 17-10
Restart Trend Exec ......................................................... 10-18
revolution signal input connector ................................ 2-1, 8-1
revolution signal, input range of .......................................... 8-3
revolution signal type, selection of ...................................... 8-4
RGB video signal .................................................... 1-33, 15-9
RGB video signal (VGA) output connector ......................... 2-1
rms ............................................................................... App-17
rms value ..................................................................... App-17
roll paper ........................................................................... 14-4
S
S Formula ......................................................................... 6-15
sample rate ......................................................... 17-12, 17-14
sampling frequency ......................................................... 17-12
save ...................................................................... 1-32, 12-12
Save Exec ....................................................................... 12-15
saved items ..................................................................... 12-11
scale values ............................................................ 1-27, 9-19
scaling ............................................... 1-11, 5-11, 5-14, 10-13
Scaling Copy Exec .................................................. 5-12, 5-15
scaling factor ..................................................................... 5-15
scaling function, operation of ............................................ 5-14
screen brightness .................................................. 1-34, 15-14
screen image data, saving of ......................................... 12-22
SCSI .................................................................................. 12-3
SCSI connector ................................................................... 2-1
SCSI ID ............................................................................. 12-4
SCSI setting ............................................................ 12-2, 12-4
secondary ......................................................................... 13-4
self-test ................................................................... 1-34, 16-6
Sense Type ......................................................................... 8-4
Sensor Ratio(mV/A) .......................................................... 5-11
serial ................................................................................. 1-33
Set/Reset ............................................................ 12-30, 12-33
setup ................................................................... 12-11, 12-23
setup parameters, listing of ............................................... 4-17
setup parameters, saving of ............................................ 12-16
S functions (during harmonic measurement) ...................... 1-3
S functions (during normal measurement) .......................... 1-6
S list .......................................................................... 1-17, 4-9
signal assignment ................................................... 15-5, 15-9
signal flow and process ....................................................... 1-2
single ............................................................. 5-24, 9-13, 10-8
single list ........................................................... 1-16, 4-9, 7-4
single measurement ................................................ 1-13, 5-24
slave .................................................................................. 5-26
Smp Clk .............................................................................. 7-9
SMTP Time Out .............................................................. 13-25
SMTP timeout time ......................................................... 13-25
soft key .............................................................................. 16-7
spare fuse ......................................................................... 16-9
spare parts ............................................................................. v
speed .......................................................................... 8-1, 8-3
speed, scaling of ................................................................. 8-7
split screen ........................................................................ 1-27
split windows, number of ................................................... 9-13
standard accessories ............................................................ iv
Start Order ........................................................................ 7-20
IM 760101-01E
Index
static capacitance ........................................................ App-23
storage environment ....................................................... 17-19
storage location ................................................................... 3-2
store ................................................................................ 11-11
store count ........................................................................ 11-3
store interval ..................................................................... 11-3
Store Item ......................................................................... 11-6
store item, selection of ...................................................... 11-6
store mode ........................................................................ 11-1
store operation, automatically stopping of ...................... 11-11
store operation, starting of .............................................. 11-11
store operation, stopping of ............................................ 11-11
store reservation time ....................................................... 11-4
STORE SET .............. 11-1, 11-3, 11-6, 11-10, 11-13, 11-20
Store Setting ................................................. 11-1, 11-3, 11-6
Store to ............................................................... 11-10, 11-13
stored data, saving of ...................................................... 11-13
storing ............................................................................... 1-32
stray capacitance ................................................................ 3-7
strings, entry of ................................................................. 3-24
subnet mask ............................................................ 13-3, 13-6
SUFFIX .................................................................................. ii
symbols ................................................................................. vi
Sync Measure ................................................................... 5-26
sync source ................................................................. 6-4, 8-4
Sync Speed ....................................................................... 8-13
synchronization source ....................................................... 1-8
synchronization source, copying of ..................................... 6-5
synchronization source, selection of ................................... 8-4
synchronization source, setting of ....................................... 6-4
synchronized measurement .................................... 1-13, 5-26
system condition ..................................................... 1-34, 16-8
system configuration ........................................................... 1-1
T
IM 760101-01E
U
U Range Down Exec ........................................................... 5-4
U Range Up Exec ............................................................... 5-4
Umean*Irms ...................................................................... 6-15
update rate ........................................................................ 5-22
Update Rate Down Exec ................................................... 5-22
Update Rate Up Exec ....................................................... 5-22
upper limit ....................................................................... 10-13
upper limit of harmonic order under analysis .................. 17-12
Upper Scale .................................................................... 10-13
Urms*Irms ......................................................................... 6-15
user account ................................................................... 13-19
user defined ...................................................................... 7-15
user name ........................................................... 13-20, 13-21
user-defined function ................................................ 1-18, 6-8
utility .................................. 12-6, 12-26, 12-29, 12-32, 12-36
V
V Zoom & Position .............................................................. 9-8
values, entry of .................................................................. 3-24
vectors .................................................................... 1-29, 4-14
vertical axis ....................................................................... 1-23
vertical position ................................................................. 1-26
VGA ........................................................................ 1-33, 15-9
video signal output connector, pin arrangement of ........... 15-9
voltage, determination of ..................................................... 1-4
voltage input terminal .......................................................... 2-1
voltage range, setting of ...................................................... 5-4
W
warm-up time .................................................................. 17-19
wave .................................................. 4-10, 9-1, 9-2, 9-4, 9-8
Wave C1 + ........................................................................ 9-22
wave cursor ....................................................................... 9-21
wave display ..................................................................... 9-12
wave format ...................................................................... 9-13
wave mapping ................................................................... 9-14
wave sampling .................................................................... 9-1
wave setting ........................................ 9-11, 9-13, 9-16, 9-19
wave trace ......................................................................... 11-8
WaveC1 Trace .................................................................. 9-22
WaveC2 Trace .................................................................. 9-22
waveform display data, extension of ............................... 11-17
waveform display data, retrieval of ........................... 1-24, 9-1
waveform display data, saving of .................................... 12-16
waveform mapping ........................................ 1-27, 9-14, 10-9
Index-5
Index
TCP/IP .............................................................................. 13-2
TCP/IP Setup .................................................................... 13-2
temperature (ambient) ........................................................ 3-2
temperature coefficient ......................................... 17-8, 17-13
terminal ..................................................................... 5-5, 5-10
Test Exec .......................................................................... 16-7
Test Item ........................................................................... 16-6
test transmission ............................................................. 13-17
text color ............................................................. 15-17, 15-18
Thd Formula ...................................................................... 7-13
TIFF .................................................................... 12-21, 12-22
time ................................................................................... 3-23
time axis ................................................................ 1-23, 10-10
time axis, setting of ............................................................. 9-2
time lag ............................................................................. 16-9
timeout ............................................................................ 13-20
timeout time .................................. 13-9, 13-10, 13-20, 13-21
timer accuracy ................................................................. 17-11
timer setting ............................................................ 6-21, 6-24
top view ............................................................................... 2-2
torque .......................................................................... 8-2, 8-4
torque meter signal input connector ............................ 2-1, 8-2
torque, scaling of ............................................................... 8-10
torque signal, input range of ............................................... 8-4
total efficiency ................................................................... 8-16
total harmonic distortion ............................................... App-22
trace ................................................................................ 12-12
trace label ......................................................................... 9-19
transmission interval ....................................................... 13-17
transmission, time of ........................................... 13-16, 13-17
trend ........................................................................ 1-31, 4-15
Trend C1 + ...................................................................... 10-15
trend cursor ..................................................................... 10-14
trend data, retrieval of ....................................................... 10-1
Trend Disp Items ............................................................... 10-2
trend display ...................................................................... 10-7
trend format ....................................................................... 10-8
trend object ........................................................... 10-4, 10-13
trend sampling .................................................................. 10-1
trend scale ...................................................................... 10-12
trend setting .... 10-1, 10-2, 10-6, 10-8, 10-10, 10-12, 10-18
TrendC1 Trace ................................................................ 10-15
TrendC2 Trace ................................................................ 10-15
trigger .................................................................................. 9-4
trigger level ............................................................... 1-25, 9-5
trigger mode .............................................................. 1-25, 9-5
trigger slope .............................................................. 1-25, 9-5
trigger source ............................................................ 1-25, 9-5
Index
Index
waveform, zooming of ....................................................... 1-26
waveforms ......................................................................... 4-10
weight .............................................................................. 17-19
window function .............................................................. 17-12
window width ......................................................... 7-14, 17-12
windows, number of .......................................................... 9-13
wiring ................................................................................... 5-1
wiring example (current sensor) ........................................ 3-14
wiring example (direct wiring) ........................................... 3-10
wiring example (PT and CT) ............................................. 3-17
wiring precautions ............................................................... 3-4
wiring system .............................................. 1-4, 1-7, 1-9, 5-2
wiring system pattern .................................................. 1-9, 5-1
withstand voltage ............................................................ 17-19
WT1600 ................................................................................. ii
Z
zero crossing filter ............................................................. 5-17
zero crossing filter, selection of ......................................... 5-17
zero-level compensation ....................................... 1-34, 15-12
zoom ................................................................................. 1-26
zoom (vectors) .................................................................. 7-24
Index-6
IM 760101-01E