1
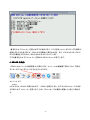
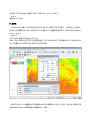
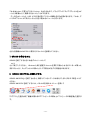
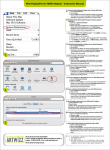
(社)日本写真測量学会関西支部主催
GIS 講習会
「GIS フリーソフト GRASS を体験しよう」
2006年7月31日
会場:近畿測量専門学校
講師:(有)画像計測研究所 小野 徹
体験用 CD-R GRASS-KNOPPIX 日本語対応版 配布
日本測量協会「測量 CPD」単位認定
Powored by
GRASS 6.0.2
Geographic Resources Analysis Support System
Quantum GIS 0.7.4
KNOPPIX 5.0.1 日本語版
資料目次
1. 講演会の内容
…………………………………………… 2
2. 配布 CD-R “GRASS-KINOPPIXjp” について ………… 3
3. GRASS-KNOPPIX の使い方
…………………………… 4
4. GRASS6 に関する情報 ………………………………… 12
5. GRASS コマンド一覧 …………………………………… 15
6. Spearfish データセット解説 ……………………………….29
-1-
日本写真測量学会関西支部 講習会
「GIS フリーソフト GRASS を体験しよう」
概
要
GRASS は、フリーのソフトウェアでありながら、多数の強力な機能を持ち合わせていることもあっ
て世界中で使われている GIS ソフトです。しかし、UNIX 系の OS で育ったソフトであるため、使い
始めるまでのハードルが高く、入り口で断念した方も多いでしょう。
日本写真測量学会関西支部では、GIS について初歩的な知識を持ち合わせている方々を対象として、
OS などの予備知識がなくても簡単に GRASS を体験できる本講習会を企画いたしました。体験版の
CD-R などを基に、実際に PC を使った講習内容としており、講習会を受ければすぐに GRASS を使い
始めることができるよう配慮しています。また、GRASS のさまざまな機能を活かした適用例の実演を
通して、その魅力もあわせて紹介していきます。
■ 日
時
平成 18 年 7 月 31 日(月) 13:00~18:00(12:45 受付開始)
■ 場
所
近畿測量専門学校
3階
演習室
(住所: 大阪市東住吉区矢田 1-5-9)
■ 主
催:社団法人日本写真測量学会関西支部
■ 講
師:小野
徹(画像計測研究所)
■ プログラム
13:00~13:05 開会挨拶
13:05~14:00 GRASS の紹介
14:00~14:30 GRASS を用いた応用例の実演
14:30~14:40 休憩
14:40~15:40 実習(1) 基本操作とデモプログラムの実行
15:40~15:50 休憩
15:50~16:50 実習(2) ラスターデータを用いた実習
16:50~17:00 休憩
17:00~17:55 実習(3) ベクターデータを用いた実習
17:55~18:00 閉会挨拶
■ 連絡先
(社)日本写真測量学会関西支部
〒572-8508
大阪府寝屋川市池田中町 17-8
摂南大学工学部都市環境システム工学科
熊谷研究室内
TEL&FAX: 072-839-3301
E-mail: [email protected]
-2-
配布 CD-R ”GRASS-KNOPPIXjp”について
この CD-R は産業技術総合研究所によって開発された KNOPPIX5.0 日本語版をベースに
GRASS 6.0.2 と関連ソフトウェアやデータをインストールしたものです。日本写真測量学会関西
支部の GRASS 講習会(2006/7/31)のために作られたものですが、自由にコピーして利用したり
配布することができます。
この CD-R からブートすることで、インストールやセットアップすることなく GRASS を体験すること
ができます。
また、全くの初心者でも GRASS を手軽に体験することができるよう、デモスクリプトが用意されて
います。もちろん、通常の手順で GRASS を利用することもできます。
体験用とはいえ、フルスペックの GRASS がインストールされており、ほとんど全ての機能が利用
できます。ただし、ユーザが作ったデータは、外部メモリなどに保存しない限り、リブートやシャッ
トダウンをした時点で消滅しますので御注意ください。
動作環境
Windows が動作する PC であれば動作するはずです。必要なスペックなどは KNOPPIX のドキュ
メントをご覧ください。この CD-R に入っているサンプルデータのみを用いる限りにおいては、多く
のメモリは消費しないはずです。とはいえ、RAMDISK を利用するので、メモリは少なくとも 256MB
はあった方がよいでしょう。512MB 以上を推奨します。 GRASS そのものはあまり重いソフトでは
ないので、CPU は遅くても問題ありません。 CD-ROM ドライブは高速な方がよいでしょう。
モニターの解像度は 1024x768 以上であることを想定しています。それより低くても動作しないわ
けではありませんが、使いにくいのは間違いありません。
PC によっては正しく動作しないことがあります。これは KNOPPIX の問題です。また、CD-ROM ド
ライブ(DVD なども含む)が搭載されていない PC や搭載されていても、 CD-ROM ドライブからブ
ートできない PC では利用できません。
免責事項
この CD-R を利用したことで、何らかの不都合が生じたとしても作者は全く責任を負いません。ま
た、問い合わせやクレームについても対処しかねます。このことを十分理解したうえで御利用く
ださい。
(有)画像計測研究所 小野 徹 2006 年 7 月 31 日
-3-
GRASS-KNOPPIXjpの使い方
1. GRASS-KNOPPIXjpの起動方法
KNOPPIX5.0.1 日本語版をベースにしているので、KNOPPIX の起動方法に準じます。
(1)
(2)
(3)
DVD-RAM/DVD-R/DVD-ROM/CD-ROM ドライブに配布 CD-R を入れて、PC を再
起動してください。
もし、再起動したときに、KNOPPIX が起動しない場合は、PCを CD-ROM から起動で
きるよう設定してください。通常、BIOS の設定(boot setup などのメニューがあるはず
です)を変更して、CD-ROM を一番目にアクセスするようにします。具体的な方法は
機種ごとに異なるので、お持ちの PC の取扱説明書をご覧下さい。
Boot メニューが現れたら Enter キーを押して起動します。
2. GRASS を知る
まず、GRASS や GIS がどんなものなのか知らなければ話になりません。 GRASS や GIS につ
いて知るためのとてもよくできた教材として、大阪市立大学の升本先生とラガワン先生の
「 GRASS を用いた地理情報システム入門」を参照するとよいでしょう。ただし、GRASS5 での利
用を前提としているので、本 CD-R に入っている GRASS6とは GUI と一部のコマンドが異なりま
すので、注意が必要です。
英語のドキュメントを読むのが苦痛でないなら、GRASS の オフィシャルサイト をぜひ覗いて
みましょう。沢山の優れたチュートリアルも紹介されています。
この CD-R の中には、大阪市立大学の実習でも使われている GRASS SEED のデータや他の多
くのチュートリアルで使われている spearfish というデータも入っています。そのため、ダウンロー
ドやインストールの手間なく、すぐに試してみることができます。
GRASS のサンプルデータは/home/knoppix/data に入っています。
3. GRASS Demo
GRASS でどんなことができるのかを手っ取り早く知るには、GRASS Demo を実行するのがよ
いでしょう。デスクトップ上に"grass-demo"と書かれたアイコンがあるので、それをクリックしてみ
ましょう。以下のような画面が現れるはずです。
-4-
番号を入れて Enter キーを押せばデモが始まります。マウスを使ったインタラクティブな操作が
必要となるデモもありますが、ほとんどは自動的に実行されます。また、どのようなコマンドがど
のような働きをするのかが、おおよそわかるようになっています。
デモの番号を入れずに Enter キーを押せば GRASS Demo が終了します。
4. GRASS の実行
GRASS はコンソール(仮想端末)から実行します。コンソールは画面最下部のパネル(下図)の
モニターのアイコンをクリックすると立ち上がります。
コンソール上で
grass
と入力すると、GRASS が実行されます。 GRASS を実行すると、以下のようなメッセージが出ま
すが気にせず、Enter キーを押します。なお、このメッセージは最初に起動したときだけ現れま
す。
-5-
次に、以下のような画面が出てきます。
ここでは、まずサンプルデータが置いてあるフォルダ(Database)を指定する必要があります。サ
ンプルデータは/home/knoppix/data にありますから、 "/home/knoppix"に"/data"を追加する
だけです。そして Enter を押すと、下図のようにいくつかの Location が現れます。ここでは下図の
-6-
ように spearfish を選んでください。
また、Mapset は user のような新たなものを作って、それを選択してください。
[Enter GRASS]をクリックすると、以下のような GUI(GIS Manager)が現れます。
この GUI を使ってほとんどの操作を行うことができます。
-7-
もし誤って GIS Manager を終了させてしまったら、コンソール上で
d.m &
を実行してください。
5. QGIS
Quantum GIS 略して QGIS を GRASS の GUI として使うこともできます。 QGIS から GRASS
のコマンドを利用するには、GRASS のパスが通っている必要があるので、GRASS をたちあげた
コンソールから
qgis &
として QGIS を実行するとよいでしょう。
QGIS では、GRASS のプラグインを読み込むことで GRASS のデータを表示したり GRASS のコ
マンドを実行したりすることができるようになります。
QGIS ではメニューも最初から日本語化されており操作もしやすいですが、QGIS から実行でき
る GRASS のコマンドは現時点では限られています。
-8-
6. データの保存方法
データを保存する方法はいくつかありますが、ここでは USB メモリなど外部メ
ディアを用いる方法について説明します。PC に内蔵している HDD にもアクセス
可能ですが、Windows 2000 や XP の場合 NTFS というファイルシステムになって
いることが多く、KNOPPIX からは簡単には書き込めないようになっています。
そのため USB メモリなど NTFS ではない外部メディアに保存することにしましょう。
KNOPPIX のデスクトップを見ると、Floppy や Hard Disk というアイコンがあり
ます(右図)。USB メモリを差し込むと、ここに新たな Hard Disk が加わります。
これが [sda1] というデバイス名であるとします(PC のハードウェア構成によっ
てはデバイス名が異なることがあります)。これらのデバイスは最初は書き込み
不可となっているので、書き込み可となるよう変更が必要です。
このデバイスのアイコン上で右クリックすると、下図のようなメニューが現れます。
ここで、[Change read/write mode] というメニューをクリックして、書き込み可にします。
次に、アイコンを左クリックすると下図のような、Konqueror というウィンドウが起動します。
-9-
これは Windows で言うところの Explorer のようなもので、ドラッグアンドドロップでファイルをコピ
ーしたり移動したり、削除するといったことができます。
データをコピーしたら、USB メモリを抜く前に「マウント解除」を行う必要があります。これは、デ
バイスのアイコン上で右クリックしたときに現れるメニューから行います。
さらなる詳細は KNOPPIX に関するドキュメントを参照してください。
7. GRASS の終らせかた
GRASS を終了するときには必ずコンソール上で
exit
として終了してください。 Windows と同じ感覚で Konsole を閉じて終わらせるとモニターが残った
ままになったり、ロックファイルが残ったりして不具合が生ずる可能性があります。
8. GRASS-KNOPPIXjp の終らせかた
GRASS-KNOPPIXjp を終了させると、保存していないデータは消えてしまいますので気をつけて
ください。
GRASS-KNOPPIX を終了するには、パネルの左端の K メニューを押して
「ログアウト」を選ぶと終了画面が現れるので「コンピュータの停止」か「コンピュータの再起動」を選びま
す。
- 10 -
GRASS6 に関する情報
1. GRASS について
GRASS は Geographical Resources Analysis Support System の略称であり、あえて訳すなら
地理資源解析支援システムとなります。GRASS は米国陸軍 CERL(Construction Engineering
Research Laboratory)を中心として開発された地理情報システム(GIS)のソフトウェアであり、そ
の後世界中のさまざまな組織によりメンテナンスが継承されています。2006 年 7 月現在では、世
界中の有志より成る GRASS Development Team によって開発が進められ、配布などのホ
ストをイタリアの ITC(Istituto Trentino di Cultura:敢えて訳せばトレント文化協会)が
請け負っています。
GRASS は以下の特徴を持ちます。
• パブリックドメインであり、自由に配布され無料または安価に入手できる
• オープンソースであり、ライブラリも整備されているため独自プログラム作成が容易である
• 非常に多くの強力なツールを持ち、ドキュメントも豊富である
• ラスターデータ、ベクターデータともに充実した機能を持つが、特にラスターデータの処理
が得意である
• サンプルのデータベースが無料で提供されており、他形式からのインポートも容易である
• 世界中に多くのユーザを持ち、独自のコミュニティを形成している
• 様々な OS 上で動作する
2.GRASS6について
2006 年7月現在の GRASS の最新公式バージョンは 6.0.2 であり、開発中の 6.1 のβバージョ
ンも入手可能である。GRASS6 では主に以下のような新機能の追加や改良が行われた。
•
•
•
•
•
•
ベクターデータの扱いの強化 : 3D データの利用, DBMS での管理など
GIS Manager と呼ばれる新しい GUI : レイヤーを使った表示など
新バージョンの NVIZ(3D 表示ツール) : 3D ベクター、voxel データへの対応など
国際化正式対応 : 日本語などマルチバイト文字の表示、TrueType フォント対応
GDAL/OGC ライブラリに対応 : 各種データの変換が容易になった
EPGS コードに対応 : Location の設定が容易になった
さらに、QGIS が GRASS6 をサポートし、これを用いることで GRASS 独自の表示関連の扱いにく
さからも解放されることになりました。
これにより、これまで GRASS の弱点と言われていたベクターデータの扱いや使いにくさ、国際
化への非対応といった問題はほぼ全て解決されたことになります。
- 11 -
3. GRASS に関する情報源と入手方法
GRASSのホームページはイタリアITCの http://grass.itc.it です。このページは様々なところ
でミラー(全く同じ内容をコピーして公開)されており、日本においては大阪市立大学の
http://wgrass.media.osaka-cu.ac.jp/grassh/index.php にあります。これらがオフィシャルサイトと
いうことになります。GRASS における最新情報や各種ドキュメント、GRASS のダウンロードなど
はここから辿ることができます。
GRASS の日本語版については、FOSS4G のサイト(http://www.grass-japan.org/FOSS4G/)で
フォント付きの国際化版が入手可能なほか、株式会社オークニーにより日本語版が販売されて
います。
4. ドキュメント
GRASS には多数のドキュメントが存在しますが、初めて利用しようという方にはチュートリアル
形式のものを利用することをお薦めします。日本語で書かれたものとしては、大阪市立大学の
升本先生とラガワン先生によって書かれた「GRASS を用いた地理情報システム入門」がよくでき
ており、独学で高度な演習が可能です。ただし、GRASS6 については対応していないので、本文
書などと併用することをお薦めします。
英語で書かれた GRASS6 のドキュメントとして代表的なものには以下のものがあります。
•
•
•
リファレンスマニュアル(いわゆる map page) (HTML 形式) ← homepage より
プログラマーズマニュアル (HTML 形式, PDF 形式) ← homepage より
Die GDF Hannover のチュートリアル
http://www.gdf-hannover.de/media.php?id=0&lg=en
•
Open Source Geospatial '05 Conference のチュートリアル
http://mpa.itc.it/markus/osg05/
GRASS5 以前のものですが良くできたチュートリアルとして、
•
Tutrial GRASS5 http://www.ing.unitn.it/~grass/docs/tutorial/english/index_en.htm
•
GRASS Seeds Beginner's Tutorial http://www.geog.le.ac.uk/assist/grass/seeds/
などがあります。なお、GRASS Seeds については、上記の大阪市立大学のサイトの実習中で
扱っており、日本語訳されたものがあるので、そちらを参照するとよいでしょう。
5. 使用できるハードウェア
ほとんど全てのパソコンやワークステーションで利用可能です。
OSとしては、Linux/Mac OSX/MS Windows(Cygwin)についてはオフィシャルサイトにてバイナ
リ形式で提供されています。ソースからコンパイルすれば、上記以外の OS でも UNIX 系の OS
- 12 -
であれば利用可能です。オフィシャルサイト以外のところでバイナリファイルが提供されているこ
ともあるので、検索してみるとよいでしょう。PC だけでなく、iPAQや Zaurus といった PDAでも利
用可能です。
また、OS レベルでサポートされている周辺機器であれば、GRASS からも利用可能です。ただ
し、Windows 用のドライバーしか提供されていない場合には、Linux や Mac OSX 上から利用する
ことはできないことがあるので注意が必要です。一部のデジタイザーなど GRASS がドライバーを
用意しているものもありますが、バイナリファイルでドライバーが提供されているとは限りません。
GRASS のデータをプリンタやプロッタで印刷したい場合は、画像ファイルや Postscript ファイル、
テキストファイルなどに落として、印刷すればよいでしょう。
6. インストールの方法
GRASS を利用する方法としては以下の3つの方法があります。
(1) バイナリファイルをインストールする
(2) ソースファイルをコンパイルしてインストールする
(3) Live CD-ROM を利用する (PC にインストールせずに利用する)
利用するプラットフォームによって、インストール方法が異なります。それぞれの詳細について
はオフィシャルページからリンクされているので参照してください。ここでは、Windows ユーザが
PC 上で利用する場合について説明します。
GRASS を触ったことも見たこともないというユーザは、まず最初に Live CD-ROM を入手して
使ってみることをお薦めします。Live CD-ROM を提供しているサイトにはオフィシャルサイトから
リンクが張ってあるので、そこから CD-ROM を購入するか ISO ファイルをダウンロードして、自分
で CD-R や CD-RW に焼きます。
インストールする手間がないので、とても簡単に GRASS を体験することができます。
Windows マシンに GRASS をインストールする方法には、
(a) Cygwin を入れて Cygwin 用の GRASS をインストールする
(b) Cygwin と coLinux を入れて、Linux 用の GRASS をインストールする
(c) VMWare やVirtual PC,Bochsなどの仮想 PC 上に Linux を入れて、Linux 用の GRASS
をインストールする
(d) winGRASS(QGIS with GRASS)をインストールする。
という4つの方法があります。このうち最も簡単なのが(d)であるが、QGIS がβバージョンなの
で、本格的な利用についてはいまのところお薦めできませんが、試してみるだけならインストー
ルも簡単なのでよいでしょう。将来的にはメインの環境となる可能性もあるので、今後の動向
が注目されるところです。
次に簡単なのが(a)です。Cygwin とは、Windows で動く UNIX エミュレート環境です。動作がい
まひとつ安定していないこと、Cygwin 用のバイナリしか動かせないので Cygwin 用のバイナリが
用意されていないツールは自分でコンパイルしない限り利用できないこと、動作がやや遅いこ
- 13 -
と、などいくつか問題もありますが、(b),(c)と比べるとずっと利用が簡単です。Cygwin のインスト
ール自体はとても簡単で、Cygwin のサイトにある setup プログラムを実行するだけです。そして、
あとは説明書の通りに Cygwin 用の GRASS をインストールするだけです。しかし、Cygwin のバ
ージョンや Cygwin に入れたライブラリのバージョンなどによっては、GRASS が正常に動かない
こともあるようです。
Cygwin よりも安定した環境で GRASS に関連する全てのソフトを高速に動かしたいのなら、
(b),(c)のような仮想PC上で Linux を動かす方法もあります。この方法は Linux をインストールし
たうえで、さらに GRASS をインストールする必要があるなど、インストールの手間と利用の際に
必要な知識が多く、Windows ユーザにはあまりお薦めできません。
6. 日本語への対応
GRASS6 は国際化されており、日本語でのデータ入力や表示にも対応しています。日本語の
データを表示するには日本語 TrueType フォントを指定する必要があります。メニューやメッセー
ジも日本語用の翻訳ファイル(.po)があれば日本語化が可能です。翻訳ファイルの最新版はオフ
ィシャルサイト GRASS5 に対応した日本語翻訳ファイルはありますが、残念ながら現時点では
GRASS6 に対応したものはないようです。とはいえ、QGIS という GUI のメニューは日本語化され
ているため、QGIS を使うならば特に使用上の不都合はあまりないでしょう。
- 14 -
GRASS コマンド一覧
種別
d.* display commands (表示)
db.* database commands (データベース)
g.* general commands (一般)
g3.* general3D commands (一般3D関係)
i.*
imagery commands (衛星画像など画像セットの扱い)
p.* paint commands (画像出力関係)
pg.* postGRASS commands (データベース postgress)
ps.* postscript commands (Postscript 出力)
r.* raster commands (ラスターデータの処理)
r3.* raster3D commands (ラスターデータの3D関連の処理)
v.* vector commands (ベクターデータの処理)
Nviz visualization command (3D 表示)
コマンドリスト
d.ask
Prompts the user to select a GRASS data base file from among files displayed in
a menu on the graphics monitor.
d.barscale
Displays a barscale on GRASS monitor.
d.colorlist
Output a list of all available display colors with a configurable separator (default
is comma).
d.colors
Allows the user to interactively change the color table
d.colortable
To display the color table associated with a raster map layer.
d.erase
Erase the contents of the active display frame with user defined color
d.extend
Set window region so that all currently displayed raster, vector and sites maps
can be shown in a monitor.
d.font.freetype Selects the font in which text will be displayed on the user's graphics monitor.
d.font
Selects the font in which text will be displayed on the user's graphics monitor.
d.frame
Manages display frames on the user's graphics monitor.
d.geodesic
Displays a geodesic line, tracing the shortest distance between two geographic
points along a great circle, in a longitude/latitude data set.
- 15 -
d.graph
Program for generating and displaying simple graphics to the graphics display
monitor.
d.grid
Overlays a user-specified grid in the active display frame on the graphics
monitor.
d.his
Displays the result obtained by combining hue, intensity, and saturation (his)
values from user-specified input raster map layers.
d.histogram
Displays a histogram in the form of a pie or bar chart for a user-specified raster
file.
d.info
Display information about the active display monitor
d.legend
Displays a legend for a raster map layer in the active frame on the graphics
monitor.
d.linegraph
Generates and displays simple line graphs in the active graphics monitor display
frame.
d.mapgraph
Generates and displays simple graphics on map layers drawn in the active
graphics monitor display frame.
d.measure
Measures the lengths and areas of features drawn by the user in the active
display frame on the graphics monitor.
d.m
d.mon
To establish and control use of a graphics display monitor.
d.monsize
Selects/starts specified monitor at specified size
d.nviz
Create fly-through script to run in NVIZ
d.out.png
Saves active display monitor to PNG file in home directory
d.paint.labels
Displays text labels formatted for use with GRASS paint (p.labels, p.map) output
to the active frame on the graphics monitor.
d.path
Find shortest path for selected starting and ending node
d.profile
Interactive profile plotting utility with optional output.
d.rast.arrow
Draws arrows representing cell aspect direction for a raster map containing
aspect data.
d.rast.edit
d.rast.edit
d.rast
Displays and overlays raster map layers in the active display frame on the
graphics monitor.
d.rast.leg
Displays a raster map and its legend on a graphics window
d.rast.num
Overlays cell category values on a raster map layer displayed to the graphics
monitor.
- 16 -
d.redraw
d.redraw
d.resize
Resizes active display monitor
d.rgb
Displays three user-specified raster map layers as red, green, and blue overlays
in the active graphics frame.
d.rhumbline
Displays the rhumbline joining two user-specified points, in the active frame on
the user's graphics monitor.
d.save
Create a list of commands for recreating screen graphics.
d.slide.show
Slide show of GRASS raster/vector maps
d.split
Divides active display into 2 frames & displays maps/executes commands in each
frame.
d.text.freetype Draws text in the graphics monitor's active display frame using TrueType fonts.
d.text
Draws text in the active display frame on the graphics monitor using the current
font.
d.title
Outputs a TITLE for a raster map layer in a form suitable for display by d.text.
d.vect.chart
Displays charts of GRASS vector data in the active frame on the graphics
monitor.
d.vect
Displays GRASS vector data in the active frame on the graphics monitor.
d.what.rast
Allows the user to interactively query the category contents of multiple raster
map layers at user specified locations within the current geographic region.
d.what.vect
Allows the user to interactively query a vector map layer at user-selected
locations within the current geographic region.
d.where
Identifies the geographic coordinates associated with point locations in the
active frame on the graphics monitor.
d.zoom
Allows the user to change the current geographic region settings interactively,
with a mouse.
db.* commands:
db.columns list all columns for a given table.
db.connect Connect to the database through DBMI.
db.copy
Copy a table. Either 'from_table' (optionaly with 'where') can be used or 'select'
option, but not 'from_table' and 'select' at the same time.
db.describe Describe a table (in detail).
db.drivers
List all database drivers.
db.droptable
- 17 -
db.execute Execute any SQL statement.
db.login
Set user/password for driver/database.
db.select
Select data from database.
db.tables
List all tables for a given database.
db.test
Test database driver, database must exist and set by db.connect.
g.* commands:
g.access
g.ask
Prompts the user for the names of GRASS data base files.
g.copy
Copies available data files in the user's current mapset search path and location to
the appropriate element directories under the user's current mapset.
g.filename Prints GRASS data base file names.
g.findfile
Searches for GRASS data base files and sets variables for the shell.
g.gisenv
Outputs and modifies the user's current GRASS variable settings.
g.list
Lists available GRASS data base files of the user-specified data type to standard
output.
g.manual
display the HTML man pages of GRASS
g.mapset
Change current mapset
g.mapsets Modifies the user's current mapset search path, affecting the user's access to data
existing under the other GRASS mapsets in the current location.
g.mlist
Apply regular expressions and wildcards to g.list
g.mremove Apply regular expressions and wildcards to g.remove
g.parser
g.parser
g.proj
Prints and manipulates GRASS projection information files.
g.region
Program to manage the boundary definitions for the geographic region.
g.remove Removes data base element files from the user's current mapset.
g.rename To rename data base element files in the user's current mapset.
g.setproj
g.setproj
g.tempfile Creates a temporary file and prints the file name.
g.version
Displays version and copyright information.
i.* commands:
i.cca
Canonical components analysis (cca) program for image processing.
- 18 -
i.class
i.class
i.cluster
An imagery function that generates spectral signatures for land cover types in an
image using a clustering algorithm. The resulting signature file is used as input for
i.maxlik, to generate an unsupervised image classification.
i.fft
Fast Fourier Transform (FFT) for image processing.
i.fusion.brovey Brovey transform to merge multispectral and high-res panchromatic channels
i.gensig
Generates statistics for i.maxlik from raster map layer.
i.gensigset
Generate statistics for i.smap from raster map layer.
i.group
Creates and edits groups and subgroups of imagery files.
i.his.rgb
Hue-intensity-saturation (his) to red-green-blue (rgb) raster map color
transformation function.
i.ifft
Inverse Fast Fourier Transform (ifft) for image processing.
i.image.mosaic Mosaics up to 4 images and extends colormap; creates map *.mosaic
i.maxlik
An imagery function that classifies the cell spectral reflectances in imagery data
based on the spectral signature information generated by either i.cluster, i.class,
or i.gensig.
i.oif
Calculates Optimum-Index-Factor table for LANDSAT TM bands 1-5, & 7
i.ortho.photo i.ortho.photo
i.pca
Principal components analysis (pca) program for image processing.
i.points
i.rectify
Rectifies an image by computing a coordinate transformation for each pixel in the
image based on the control points
i.rgb.his
Red-green-blue (rgb) to hue-intensity-saturation (his) raster map color
transformation function.
i.smap
Performs contextual image classification using sequential maximum a posteriori
(SMAP) estimation.
i.spectral
displays spectral response at user specified locations in images
i.target
Targets an imagery group to a GRASS location and mapset.
i.tasscap
Tasseled Cap (Kauth Thomas) transformation for LANDSAT-TM data
i.vpoints
i.vpoints
i.zc
Zero-crossing "edge detection" raster function for image processing.
p.* commands:
p.out.vrml module to output GRASS data in the format of Virtual Reality Modeling Language
- 19 -
(VRML)
pg.* commands:
pg.postgisdb pg.postgisdb
photo.* commands:
photo.2image photo.2image
photo.2target photo.2target
photo.camera
photo.init
photo.init
photo.rectify photo.rectify
ps.* commands:
ps.map Hardcopy PostScript map output utility.
r.* commands:
r.average
Finds the average of values in a cover map within areas assigned the same
category value in a user-specified base map.
r.basins.fill
Generates a raster map layer showing watershed subbasins.
r.bilinear
Bilinear interpolation utility for raster map layers.
r.blend
Blends color components of 2 raster maps by a given % first map'
r.buffer
Creates a raster map layer showing buffer zones surrounding cells that contain
non-NULL category values.
r.cats
Prints category values and labels associated with user-specified raster map
layers.
r.circle
Creates a raster map containing concentric rings around a given point.
r.clump
Recategorizes data in a raster map layer by grouping cells that form physically
discrete areas into unique categories.
r.coin
Tabulates the mutual occurrence (coincidence) of categories for two raster
map layers.
r.colors
Creates/Modifies the color table associated with a raster map layer.
r.composite
Combines red, green and blue map layers into a single composite map layer.
- 20 -
r.compress
Compresses and decompresses raster files.
r.contour
Produces a GRASS binary vector map of specified contours from GRASS
raster map layer.
r.cost
Outputs a raster map layer showing the cumulative cost of moving between
different geographic locations on an input raster map layer whose cell category
values represent cost.
r.covar
Outputs a covariance/correlation matrix for user-specified raster map layer(s).
r.cross
Creates a cross product of the category values from multiple raster map
layers.
r.describe
Prints terse list of category values found in a raster map layer.
r.digit
r.digit
r.distance
Locates the closest points between objects in two raster maps.
r.drain
Traces a flow through an elevation model on a raster map layer.
r.fill.dir
Filters and generates a depressionless elevation map and a flow direction map
from a given elevation layer
r.fillnulls
Fills no-data areas in raster maps using v.surf.rst splines interpolation
r.flow
Construction of slope curves (flowlines), flowpath lengths, and flowline
densities (upslope areas) from a raster digital elevation model(DEM).
r.grow
Generates a raster map layerwith contiguous areas grown by one cell.
r.his
Generates red, green and blue raster map layers combining hue, intensity, and
saturation (his) values from user-specified input raster map layers.
r.in.arc
Convert an ESRI ARC/INFO ascii raster file (GRID) into a (binary) raster map
layer.
r.in.ascii
Convert an ASCII raster text file into a (binary) raster map layer.
r.in.bin
Import a binary raster file into a GRASS raster map layer.
r.info
Outputs basic information about a user-specified raster map layer.
r.in.gdal
Import GDAL supported raster file into a binary raster map layer.
r.in.gridatb
Imports GRIDATB.FOR map file (TOPMODEL) into GRASS raster map
r.in.mat
Import a binary MAT-File(v4) to a GRASS raster.
r.in.poly
Create raster maps from ascii polygon/line data files in the current directory.
r.in.srtm
Import SRTM HGT files into GRASS
r.kappa
Calculate error matrix and kappa parameter for accuracy assessment of
classification result.
r.le.patch
- 21 -
r.le.pixel
r.le.setup
r.le.setup
r.le.trace
r.los
Line-of-sight raster analysis program.
r.mapcalc
r.mapcalc
r.mapcalculator r.mapcalculator - Calculates new raster map from r.mapcalc expression
r.median
Finds the median of values in a cover map within areas assigned the same
category value in a user-specified base map.
r.mfilter
Raster file matrix filter.
r.mode
Finds the mode of values in a cover map within areas assigned the same
category value in a user-specified base map.
r.neighbors
Makes each cell category value a function of the category values assigned to
the cells around it, and stores new cell values in an output raster map layer.
r.null
The function of r.null is to explicitly create the NULL-value bitmap file.
r.out.arc
Converts a raster map layer into an ESRI ARCGRID file.
r.out.ascii
Converts a raster map layer into an ASCII text file.
r.out.bin
Exports a GRASS raster to a binary array.
r.out.gdal
Exports GRASS raster data into various formats (requires GDAL)
r.out.gridatb
Exports GRASS raster map to GRIDATB.FOR map file (TOPMODEL)
r.out.mat
Exports a GRASS raster to a binary MAT-File.
r.out.mpeg
Raster File Series to MPEG Conversion Program.
r.out.png
Export GRASS raster as non-georeferenced PNG image format.
r.out.pov
Converts a raster map layer into a height-field file for POVRAY.
r.out.ppm3
Converts 3 GRASS raster layers (R,G,B) to a PPM image file at the pixel
resolution of the CURRENTLY DEFINED REGION.
r.out.ppm
Converts a GRASS raster file to a PPM image file at the pixel resolution of the
CURRENTLY DEFINED REGION.
r.out.tiff
Exports a GRASS raster file to a 8/24bit TIFF image file at the pixel resolution
of the currently defined region.
r.param.scale
Extracts terrain parameters from a DEM. Uses a multi-scalar approach by
taking fitting quadratic parameters to any size window (via least squares)
r.patch
Creates a composite raster map layer by using known category values from
one (or more) map layer(s) to fill in areas of "no data" in another map layer.
r.plane
Creates raster plane map given dip (inclination), aspect (azimuth), and one
- 22 -
point
r.profile
Outputs the raster map layer values lying on user-defined line(s).
r.proj
Re-project a raster map from one location to the current location.
r.quant
This routine produces the quantization file for a floating-point map.
r.random
Creates a raster map layer and vector point map containing randomly located
sites.
r.random.surface Generates random surface(s) with spatial dependence.
r.reclass.area
Reclasses a raster map greater or less than user specified area size (in
hectares)
r.reclass
Creates a new map layer whose category values are based upon the user's
reclassification of categories in an existing raster map layer.
r.recode
Recode raster maps.
r.region
Sets the boundary definitions for a raster map.
r.regression.line Calculates linear regression from two raster maps: y = a + b*x
r.report
Reports statistics for raster map layers.
r.resample
GRASS raster map layer data resampling capability.
r.resamp.rst
Reinterpolates and computes topographic analysis from input raster file to a
new raster file (possibly with different resolution) using regularized spline with
tension and smoothing.
r.rescale.eq
Rescales histogram equalized the range of categoryvalues in a raster map
layer.
r.rescale
Rescales the range of category values in a raster map layer.
r.series
Makes each output cell value a function of the values assigned to the
corresponding cells in the input raster map layers.
r.shaded.relief
Creates shaded relief map from an elevation map (DEM).
r.slope.aspect
Generates raster map layers of slope, aspect, curvatures and partial
derivatives from a raster map layer of true elevation values. Aspect is
calculated counterclockwise from east.
r.spread
Simulates elliptically anisotropic spread on a graphics window and generates a
raster map of the cumulative time of spread, given raster maps containing the
rates of spread (ROS), the ROS directions and the spread origins. It optionally
produces raster maps to contain backlink UTM coordinates for tracing spread
paths.
r.spreadpath
Recursively traces the least cost path backwards to cells from which the
cumulative cost was determined.
- 23 -
r.statistics
Category or object oriented statistics.
r.stats
Generates area statistics for raster map layers.
r.sum
Sums up the raster cell values.
r.sun
Computes direct (beam), diffuse and reflected solar irradiation raster maps for
given day, latitude, surface and atmospheric conditions. Solar parameters (e.g.
sunrise, sunset times, declination, extraterrestrial irradiance, daylight length)
are saved in the map history file. Alternatively, a local time can be specified to
compute solar incidence angle and/or irradiance raster maps. The shadowing
effect of the topography is optionally incorporated.
r.sunmask
Calculates cast shadow areas from sun position and DEM. Either A: exact sun
position is specified, or B: date/time to calculate the sun position by r.sunmask
itself.
r.surf.area
Surface area estimation for rasters.
r.surf.contour
Surface generation program from rasterized contours.
r.surf.fractal
GRASS module to create a fractal surface of a given fractal dimension. Uses
spectral synthesis method. Can create intermediate layers showing the build up
of different spectral coefficients (see Saupe, pp.106-107 for an example of
this). Use this module to generate naturally looking synthetical elevation
models (DEM).
r.surf.gauss
GRASS module to produce a raster map layer of gaussian deviates whose
mean and standard deviation can be expressed by the user. It uses a gaussian
random number generator.
r.surf.idw2
Surface generation program.
r.surf.idw
Surface interpolation utility for raster map layers.
r.surf.random
Produces a raster map layer of uniform random deviates whose range can be
expressed by the user.
r.terraflow
Flow computation for massive grids (Float version).
r.texture
Generate images with textural features from a raster map
r.thin
Thins non-zero cells that denote linear features in a raster map layer.
r.timestamp
Print/add/remove a timestamp for a raster map.
r.topidx
Creates topographic index, ln(a/tan(beta)), map from elevation map.
r.topmodel
Simulates TOPMODEL which is a physically based hydrologic model.
r.to.vect
Converts a raster map into a vector map layer.
r.transect
Outputs raster map layer values lying along user defined transect line(s).
r.univar
Calculates univariate statistics from the non-null cells of a raster map.
- 24 -
r.univar.sh
calculates univariate statistics from a GRASS raster map
r.water.outlet
Watershed basin creation program.
r.watershed
Watershed basin analysis program.
r.what
Queries raster map layers on their category values and category labels.
r3.* commands:
r3.in.ascii
Convert a 3D ASCII raster text file into a (binary) 3D raster map layer
r3.info
Outputs basic information about a user-specified 3D raster map layer.
r3.in.v5d
import of 3-dimensional Vis5D files (i.e. the v5d file with 1 variable and 1 time step)
r3.mapcalc
r3.mapcalc
r3.mask
Establishes or removes the current working 3D raster mask.
r3.mkdspf
r3.null
Explicitly create the 3D NULL-value bitmap file.
r3.out.ascii
Converts a 3D raster map layer into an ASCII text file
r3.out.v5d
Export of GRASS 3D raster file to 3-dimensional Vis5D file.
r3.timestamp print/add/remove a timestamp for a 3D raster map
v.* commands:
v.buffer
Create a buffer around features of given type (areas must contain centroid).
v.build.all
v.build.all
v.build
Creates topology for GRASS vector data.
v.build.polylines Build polylines from lines.
v.category
Attach, delete or report vector categories to map geometry.
v.clean
Toolset to clean vector topology.
v.convert.all
v.convert
Imports older versions of GRASS vectors.
v.db.connect
prints/sets DB connection for a vector map
v.db.select
Print vector attributes
v.delaunay
Create a Delaunay triangulation from an input vector of points or centroids.
v.digit
v.distance
Find the nearest element in vector 'to' for elements in vector 'from'. Various
information about this relation may be uploaded to the attribute table of input
- 25 -
vector 'from' or printed to stdout.
v.external
Create a new vector as a read-only link to OGR layer. Available drivers:
v.extract
Selects vector objects from an existing vector map and creates a new map
containing only the selected objects. If 'list', 'file' and 'where' options are not
specified, all features of given type and layer are extracted, categories are not
changed in that case.
v.hull
Uses a GRASS vector points map to produce a convex hull vector map
v.in.ascii
Convert GRASS ascii file or points file to binary vector.
v.in.db
Create new vector (points) from database table containing coordinates.
v.in.e00
Import of E00 file into a vector map.
v.info
Outputs basic information about a user-specified vector map layer.
v.in.garmin
Upload Waypoints, Routes, and Tracks from a Garmin GPS receiver into a vector
map.
v.in.ogr
Convert OGR vectors to GRASS. Available drivers:
v.in.region
Create a new vector from current region.
v.in.sites.all
v.in.sites
Converts a GRASS site_lists file into a vector file.
v.kcv
Randomly partition points into test/train sets.
v.kernel
Generates a raster density map from vector points data using a moving 2D
isotropic Gaussian kernel or optionally generates a vector density map on vector
network with a 1D kernel
v.label
Create paint labels for GRASS vector file and attached attributes.
v.mkgrid
Creates a (binary) GRASS vector map of a user-defined grid.
v.neighbors
Makes each cell value a function of the attribute values assigned to the vector
points or centroids around it, and stores new cell values in an output raster map
layer.
v.net.alloc
Allocate subnets for nearest centres (direction from centre). Centre node must
be opened (costs >= 0). Costs of centre node are used in calculation
v.net
Network maintenance.
v.net.iso
Split net to bands between cost isolines (direction from centre). Centre node
must be opened (costs >= 0). Costs of centre node are used in calculation
v.net.path
Find shortest path on vector network. Reads start/end pointsfrom standard
input in 2 possible formats:
v.net.salesman Create a cycle connecting given nodes (Traveling salesman problem). Note that
- 26 -
TSP is NP-hard, heuristic algorithm is used by this module and created cycle
may be sub optimal.
v.net.steiner
Create Steiner tree for the network and given terminals. Note that 'Minimum
Steiner Tree' problem is NP-hard and heuristic algorithm is used in this module
so the the result may be sub optimal.
v.normal
tests for normality for points.
v.out.ascii
Convert a GRASS binary vector map to a GRASS ASCII vector map
v.out.dxf
Exports GRASS vector files to DXF file format.
v.out.ogr
Convert to OGR format.
v.out.pov
Convert to POV-Ray format, GRASS x,y,z -> POV-Ray x,z,y
v.overlay
Overlay 2 vector maps.
v.patch
Creates a new binary vector map layer by combining other binary vector map
layers.
v.perturb
Random location perturbations of GRASS sites.
v.proj
Allows projection conversion of vector files.
v.qcount
indices for quadrat counts of sites lists
v.random
Randomly generate a GRASS vector points map.
v.reclass
Changes vector category values for an existing vector map according to results
of SQL queries or a value in attribute table column.
v.sample
Sample a raster file at site locations.
v.segment
Create points/segments from input lines, and positions read from stdin in
format:
v.select
Select features from ainput by features from binput.
v.surf.idw
Surface interpolation from sites data by Inverse Distance Squared Weighting.
v.surf.rst
Interpolation and topographic analysis from given point or contour data in vector
format to GRASS floating point raster format using regularized spline with
tension.
v.to.db
Load values from vector to database. In uploaded/printed category values '-1' is
used for 'no category' and 'null'/'-' if category cannot be found or multiple
categories were found.
v.to.points
Create points along input lines.
v.to.rast
Converts a binary GRASS vector map layer into a GRASS raster map layer.
v.transform
Transforms an vector map layer from one coordinate system into another
coordinate system.
- 27 -
v.type
Change the type of geometry elements.
v.univar
Calculates univariate statistics for attribute. Variance and standard deviation is
calculated only for points.
v.vol.rst
Interpolates point data to a G3D grid volume using regularized spline with
tension (RST) algorithm
v.voronoi
Create a Voronoi triangulation from an input vector of points or centroids.
v.what.rast
Upload raster values at positions of vector points to the table.
- 28 -
Spearfish データセット解説
配布 CD-R には、GRASS のサンプルデータとして spearfish と imagery, leics を用意していま
す。このうち、spearfish と imagery は、米国サウスダコダ州に位置する spearfish という地域のデ
ータで、前者はラスター形式の主題図とベクターマップ、後者は衛星画像データです。
ラスターデータの一覧
- 29 -
ベクターデータの一覧
t. で始まるデータは TIGER データですが、t.9961.で始まるのがオリジナルのもので、その後に続
く 100 や 200 というのはブロック番号です。その後に all や bks、あるいは何もないものがあります
- 30 -
が、何もないのはブロックの境界だけを示すエリアデータです。all はそのブロック内の全ての
TIGER データ、bks はブロック内部の境界線です。t.country や t.hydro などのデータは spearfish
における TIGER データから様々な主題のデータを取り出したものです。
Imagery データ
Imagery データは spearfish と同じ場所ですが座標系が異なり、x-y 座標系となっています。
- 31 -