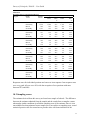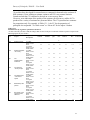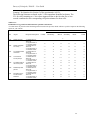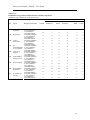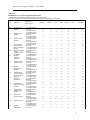
1
Microdata User Guide
Survey of Principals
2004/05
December 2006
Survey of Principals, 2004/05 – User Guide
Table of Contents
1.0 Administration ............................................................................................................. 3
2.0 Authority ...................................................................................................................... 3
3.0 Background .................................................................................................................. 3
4.0 Objectives .................................................................................................................... 4
5.0 Content......................................................................................................................... 4
6.0 Uses.............................................................................................................................. 5
7.0 Data collection ............................................................................................................ 5
8.0 Data processing.............................................................................................................6
8.1 Data capture .............................................................................................................. 6
8.2 Data editing and outlier detection.............................................................................. 6
9.0 Survey methodology.................................................................................................... 7
9.1 Target population....................................................................................................... 7
9.1.1 Frame……............................................................................................................ 7
9.2 Sample design ........................................................................................................... 8
10.0 Data quality ............................................................................................................. 10
10.1 Response rates…………………………………………………………………….10
10.2 Sampling errors……………………………………………………………………11
10.3 Non-sampling errors………………………………………………………………12
10.4 Coverage………………………………………………………………………......12
10.5 Data capture ........................................................................................................... 13
10.6 Data editing and outlier detection....................................................................... …13
11.0 Weighting………………………………………………………………………..…13
11.1 Base weight……………………………………………………………………….13
11.2 Non-response adjustment…………………………………………………………14
11.3 Calibration…………………………………………………………………….…..15
11.4 Final weight……………………………………………………………….…..…..15
12.0 Guidelines for tabulation, analysis and release ....................................................... 15
12.1 Rounding guidelines .............................................................................................. 15
12.2 Weighting guidelines ............................................................................................. 16
12.3 Categorical vs. quantitative estimates .................................................................... 17
12.3.1 Categorical estimates......................................................................................... 18
12.3.2 Quantitative estimates ............................................................. ......................... 18
12.3.3 Tabulation of categorical estimates………………………………….................18
12.3.4 Tabulation of quantitative estimates…………………………………………...19
12.4 Coefficient of variation release guidelines ............................................................ .21
13.0 Variance calculation...................................................................................................22
13.1 Importance of the variance...................................................................................... 22
13.2 Calculating variance and CV of an estimate.....................................……..……….22
13.3 Using the coefficient of variation to obtain confidence limits................................ 30
13.4 Hypothesis tests ..................................................................................................... 31
13.5 Coefficients of variations for quantitative estimates ............................................ .32
Appendix A: Questionnaire ..............................................................................................32
Appendix B: School characteristics ..................................................................................32
2
Survey of Principals, 2004/05 – User Guide
1.0 Administration
The Survey of Principals (SOP) was conducted jointly by Statistics Canada and a team of
researchers from Faculties of Education in universities across the country (Université de
Montréal, University of Toronto, Simon Fraser University and Université de Sherbrooke).
The survey is part of a research project sponsored by the Social Sciences and Humanities
Research Council of Canada (SSHRC). SSHRC is an arms-length federal agency that
promotes and supports university-based research and training in the social sciences and
humanities.
Any questions about the data set or its use should be directed to:
Statistics Canada
Client Services
Centre for Education Statistics
Telephone: (613) 951-7608 or call toll free 1 800 307-3382
Fax: (613) 951-9040
E-mail: [email protected]
2.0 Authority
The SOP was conducted under the authority of the Statistics Act, Chapter S-19, Revised
Statutes of Canada 1985. Collection plans for the survey conformed with the requirement
of Treasury Board Circular 1986-19, Government Information Collection and Public
Opinion Research, and were registered under collection registration number STC/ECT165-75359.
3.0 Background
The SOP, the first survey of its kind in Canada, was conducted in 2004/2005 to collect
data on the impact of different changes observed in education such as curriculum
changes, budget reductions, new policy directives on teaching and the work of principals
in elementary and secondary schools across Canada. The drive for the SOP came from a
group of university researchers. The survey was conducted jointly by Statistics Canada
and a team of researchers from Faculties of Education in universities across the country
and is part of a research program sponsored by the Social Sciences and Humanities
Research Council of Canada (SSHRC). The research program is titled “Current Trends
in the Evolution of School Personnel in Canadian Elementary and Secondary Schools”.
To learn more, please visit the project’s website:
www.teachcan.ca
3
Survey of Principals, 2004/05 – User Guide
4.0 Objectives
The main objective of this survey is to evaluate the impact of different changes observed
in education such as curriculum changes, budget reductions, new policy directives on
teaching and the work of principals in Canadian schools. The survey data includes
information on principals, their situations and professional practices, the transformations
which affect their training, their competencies, as well as their daily work and their
interactions with students and other educational partners.
The data will be useful to researchers, policy-makers, provincial and territorial
departments or ministries of education, school boards and districts, principals and
teachers and will help shape the future of education policy.
5.0 Content
The target population of the Survey of Principals consists of all principals of elementary
and secondary schools in Canada who held their jobs at the start of the 2004-05 school
year, excluding principals of continuing education/adult day schools, trade/vocational
schools, language and cultural educational schools, home schools, community education
centres, social service centres, distance education centres, virtual schools and schools
located in First Nations communities. It includes schools in all provinces and territories.
A sample of 4,800 schools was invited to participate in the survey. Participation in the
survey was voluntary. Questionnaires were mailed out to school principals in late
October 2004.
A reproduction of the questionnaire is available in Appendix A.
The questionnaire was divided in six sections:
1) Socio-demographic information and characteristics of the school (questions
concerning the social characteristics of the principals such as age, level of education,
years of experience, etc.; questions concerning the personnel and the public at the school,
such as the social origin of the students, the percentage of students who drop out, the
ethnicity of the teaching personnel, etc.);
2) Perception of change and its impact (questions concerning the way principals
perceive the changes that have happened in the school setting these past ten years and the
repercussions of these changes on their work and on the working of the school);
3) Duties and responsibilities (questions aimed at describing principals’ work: not only
the work that they say they actually accomplish but they work that ideally they would like
to accomplish);
4) Social relations in schools (questions aimed at describing the relationships between
the different actors present in the school);
4
Survey of Principals, 2004/05 – User Guide
5) Professional integration and development (questions looking at the recruitment,
integration and professional development of new teachers and new principals. For
example, we ask principals in what way new teachers at the school are welcomed into the
school and in what way they also benefited from this welcome when they became
principal);
6) Projects and educational goals (questions aimed at understanding the educational
orientation of the school from the perspective of the educational objectives that are
valued).
6.0 Uses
The microdata file has been made available to researchers from the Faculties of
Education at the Université de Montréal, University of Toronto, Simon Fraser University
and Université de Sherbrooke. The information will be used to evaluate the impact of
different changes observed in education such as curriculum changes, budget reductions,
new policy directives on teaching and the work of principals in Canadian schools. Plans
are in place to eventually make the data available through the RDC’s (Research Data
Centres).
This survey will result in the publication of analytical studies related to the impact of
different changes observed in education and will provide information that will help shape
the future of education policy.
7.0 Data collection
Data collection took place from October 2003 to February 2004. Questionnaires were
mailed to principals directly. The principals provided both the data available to them as
well as their views on teaching conditions. They were asked to complete the
questionnaire and mail it back using the envelope provided.
Although participation in the survey was voluntary, a reminder fax was sent to
respondents, followed by telephone calls to encourage their participation. For cases in
which the timing of the interviewer's call was inconvenient, an appointment was arranged
to call back at a more convenient time.
If respondents were adamant about not having the time to complete the questionnaire,
then they were offered the option of responding to as many of the six sections of the
questionnaire as possible, based on a ranking in order of importance.
5
Survey of Principals, 2004/05 – User Guide
8.0 Data processing
This chapter presents a brief summary of the processing steps involved in producing the
microdata file.
8.1 Data capture
Responses to survey questions were captured using Intelligent Character Recognition
(ICR). The ICR technology combines automated data entry (which uses optical
character, mark and image recognition) with supplementary manual capture by operators
who ‘key from image’ some of the survey information using a heads-up data capture
approach.
To ensure the quality of the captured data using ICR, all write-in fields were double
keyed for accuracy and a 20% quality control procedure was employed. For every batch
of captured questionnaires processed by the quality control operation, 20% of the
questionnaires were sampled and the images of these selected questionnaires were
compared to the actual data.
Range edits were programmed for the capture of the data. If information entered was
outside of the range (too large or small) of expected values, or produced an inconsistency,
then the data would have been verified and changed or not accepted.
8.2 Data editing and outlier detection
The data editing and outlier detection phases of processing involve the identification of
erroneous or inconsistent values in the survey data, and the modification of such
conditions.
The first type of error treated involved editing the survey records according to prespecified edit rules to check for logical inconsistencies in the survey data. In these cases a
strategy was designed to eliminate the minimum amount of data, establishing priorities so
as to eliminate the values that were most likely to be in error. Several questions had
multiple parts that should have added up to a total provided in another question or
alternatively to a total of 100% in questions that asked for a breakdown by proportion.
These questions were checked by a simple summing of responses. In other cases it was
possible to infer that a response had to be less than a quantity provided for a related
question. For these cases, errors were flagged whenever the second value was greater
than the first. For example, the number of students in a specific school with access to
special services cannot exceed that specific school’s enrolment. In the example
mentioned, it was discovered that some principals had mistakenly reported in percentages
and the proper value could be imputed based on the responses given; so, if the school’s
enrolment is two hundred and the principal mistakenly reported that 50% of students had
6
Survey of Principals, 2004/05 – User Guide
access to special services instead of providing a number than the value of 100= 50%*200
could be imputed.
The second component of the editing process targeted the resolution of multiple answers
to the Likert-type scale questions (Questions 1-3 in Section 4 for example). In
responding to these questions, some respondents marked multiple categories. For each of
these records with multiple responses, the leftmost or first answer was selected.
The third type of error treated involved editing the records with unusual values. Error
detection was done both through pre-specified rules such as ratio checks and by a check
of largest and smallest values. As an example of a specified rule, a flag was set up to
highlight schools indicating that more than half of their student body arrived in Canada
less than a year ago. Editing was based both on type of school and nearby similar schools.
9.0 Survey methodology
This chapter defines the population of interest, how it is identified and contacted as well
as the method by which it will be surveyed.
9.1 Target population
The target population of the Survey of Principals (SOP) consists of all principals of
elementary and secondary schools in Canada who held their jobs at the start of the
2004/05 school year, excluding principals of continuing education/adult day schools,
trade/vocational schools, language and cultural educational schools, home schools,
community education centres, social service centres, distance education centres, virtual
schools and schools located in First Nations communities. It includes schools in all
provinces and territories.
9.1.1 Frame
The target population is accessed through the survey frame. For the 2005 SOP the frame
was a list of schools, not a list of principals, as a list of principals was not available. The
frame used is the 2002 Institution File: an administrative database of all Canadian
elementary and secondary schools maintained by the Centre for Education Statistics
(CES) of Statistics Canada. The Institution File contains a variety of information about
each school including contact information, the minimum and maximum grades of the
school, how the school is funded, and the number of students in the school. CES gathers
information from the most up to date sources reporting on elementary and secondary
schools in Canada every year in order to update the previous year’s Institution File.
Requests are then sent out to provincial ministries and/or school principals to update each
school’s information on the file. The Institution File that was used to create the survey
frame for the SOP contained all updates received through to the summer of 2004 for
those schools already on the frame. The SOP frame was also modified to eliminate out of
7
Survey of Principals, 2004/05 – User Guide
scope schools that were identified during work on the Information and Communications
Technologies in Schools Survey (ICTSS) of 2003-2004, which used an earlier version of
the same Institution File as its frame.
9.2 Sample design
Based on the objectives, constraints and budget for this survey, it was decided to select a
sample of schools as opposed to a census of schools. In order to obtain reliable estimates
within certain subpopulations of interest for this survey, the list of schools was stratified
based on the region and grade level of the schools. The following six regions and three
grade levels were considered for stratification:
Six regions
• Atlantic Provinces: Newfoundland and Labrador, New Brunswick, Nova Scotia
and Prince Edward Island
• Quebec
• Ontario
• Prairie Provinces: Manitoba, Saskatchewan and Alberta
• British Columbia
• Territories: Yukon , North West Territories and Nunavut
Three grade levels
• Elementary
• Secondary
• Mixed
In the end, there were 16 strata: three grade levels per region for all regions except the
territories, where all schools were considered together.
Table 9.1
Stratification
1- Atlantic-Elementary
2- Atlantic-Secondary
3- Atlantic Mixed
4- Quebec-Elementary
5- Quebec-Secondary
6- Quebec-Mixed
7- Ontario-Elementary
8- Ontario-Secondary
9- Ontario-Mixed
10- Prairies-Elementary
11- Prairies-Secondary
12- Prairies-Mixed
13- B.C.-Elementary
14- B.C.-Secondary
15- B.C.-Mixed
16- Territories
8
Survey of Principals, 2004/05 – User Guide
For this survey, a sample of 2,000 respondents was targeted. Using the regional response
rates from ICTSS, it was determined that a sample of 4,800 schools would likely be
enough to provide the desired 2,000 respondents.
The sample of 4,800 schools was allocated to the 16 strata in order to aim to obtain
coefficients of variation (CVs) less than or equal to 16% for proportions as small as 10%
in as many strata as possible. Considering the small number of schools in the territories, a
census of the schools was taken in that stratum. The remaining schools were allocated to
the other 15 strata using a two-phase approach. A first phase of allocation, proportional to
the square-root of the number of schools in each region, was followed by a second phase
proportional to the number of schools in each grade level within each region. Compared
to the other potential allocations, this one provided better overall CVs at the regional and
national level without having any significant impact on the reliability of the estimates in
the smaller strata. Tables 9.2 and 9.3 show the population size and the sample allocated
by region and grade level.
Table 9.2
Number of schools by region and grade level
Population
Elementary
Atlantic
689
Quebec
2,216
Ontario
4,182
Prairies
1,525
British Columbia
1,305
Territories
47
Total
9,964
Secondary
317
604
1,134
745
494
20
3,314
Table 9.3
Sample size by region and grade level
Sample
Elementary
Atlantic
349
Quebec
716
Ontario
981
Prairies
455
British Columbia
518
Territories
47
Total
3,066
Secondary
161
195
266
223
196
20
1,061
Mixed
202
139
231
1,165
175
54
1,966
Mixed
102
45
54
348
70
54
673
Total
1,208
2,959
5,547
3,435
1,974
121
15,244
Total
612
956
1,301
1,026
784
121
4,800
Sample selection
Within each of the 16 strata created by region and grade level, the schools were sorted by
the key auxiliary variables: language of instruction, funding type (public/private), size (of
enrolment) and location (urban/rural), in that order. The sample was then obtained using a
systematic sampling of schools within each stratum. This method of sample selection
ensures that the schools chosen are representative of the explicit main variables (region
and grade level), as well as the implicit key variables that were used to sort the frame
prior to selection.
9
Survey of Principals, 2004/05 – User Guide
The user should note that the schools listed on the frame were the sampled units but the
school principals were the responding units. In the case where a principal was in charge
of multiple schools selected in the sample, the principal had to respond for each of his or
her chosen schools given that certain questions are school specific.
10.0 Data quality
This chapter provides the user with information about the various factors affecting the
quality of the survey data. In a standard sample survey, there are two main types of
errors: sampling errors and non-sampling errors. A sampling error is the difference
between an estimate derived from a sample and the estimate that would have been
obtained from a census that used the same collection procedures. All other types of errors
are referred to as non-sampling errors. These include frame coverage problems, nonresponse and processing errors, which are discussed in the sections below.
10.1 Response rates
Survey response rates are measures of the effectiveness of the collection process and are
also good indicators of the quality of the estimates produced. With the time constraints of
the job and the volume of surveys confronting them it is difficult to achieve high response
rates when the respondents are school principals. Therefore, several methods were put in
place to encourage response. School boards were notified in advance of the survey and a
fax reminder was sent 21 days after sending out questionnaires for those schools which
had not yet responded. Telephone follow-ups were started 10 days after the fax reminder
follow-ups were done. Submission of answers via facsimile machine, as opposed to the
required mail-back option, was offered at this time in order to increase the response rate.
The final resolved rate was 56%, where resolved cases are those where contact with the
potential respondent has been made or the out-of-scope status of the schools was
determined. A respondent was defined as anyone who had completed at least Section 1 of
the survey. There were 2,230 responding principals out of the 4,658 in-scope principals in
the sample for a response rate of 47.9%. There were 2144 principals out of the 2230 who
responded that allowed their data to be shared with the universities sponsoring this study
for a sharing rate of 96.1%.
Table 10.1
Number of resolved cases
Sample
Resolved cases
Sent
Out-of-scope
Refusals
4,800
142
329
Responses
2,230
Unresolved cases
(no answer)
Resolved
Rate
2,099
56%
10
Survey of Principals, 2004/05 – User Guide
Table 10.2
Response rates by region and grade level
Grade
Inscope
Region
Level
Schools
Canada
Atlantic
Quebec
Ontario
Prairies
British Columbia
Territories
Total
Elementary
Mixed
Secondary
Total
Elementary
Mixed
Secondary
Total
Elementary
Mixed
Secondary
Total
Elementary
Mixed
Secondary
Total
Elementary
Mixed
Secondary
Total
Elementary
Mixed
Secondary
Total
Elementary
Mixed
Secondary
4,658
2,978
649
1,031
596
341
99
156
939
705
44
190
1,260
950
49
261
998
446
336
216
749
493
67
189
116
43
54
19
Respondents
Count
Rate
%
2,230
47.9
1,408
47.3
297
45.8
525
50.9
345
57.9
199
58.4
50
50.5
96
61.5
437
46.5
320
45.4
19
43.2
98
51.6
575
45.6
426
44.8
22
44.9
127
48.7
501
50.2
229
51.3
152
45.2
120
55.6
315
42.1
211
42.8
28
41.8
76
40.2
57
49.1
23
53.5
26
48.1
8
42.1
Sharers
Count
Rate
%
2,144
96.1
1,352
96.0
283
95.3
509
97.0
330
95.7
192
96.5
48
96.0
90
93.8
421
96.3
306
95.6
19
100.0
96
98.0
546
95.0
406
95.3
19
86.4
121
95.3
482
96.2
220
96.1
144
94.7
118
98.3
309
98.1
205
97.2
28
100.0
76
100.0
56
98.2
23
100.0
25
96.2
8
100.0
Responses rates for individual questions are known as item response. Item response rates
were very good; all were over 96% with the exception of two questions with rates
between 85% and 90%.
10.2 Sampling errors
The estimates derived from this survey are based on a sample of schools. The difference
between the estimates obtained from the sample and the results from a complete census
taken under similar conditions is called the sampling error of the estimate. Since it is an
unavoidable fact that estimates from a sample survey are subject to sampling error, sound
statistical practice calls for researchers to provide users with some indication of the
11
Survey of Principals, 2004/05 – User Guide
magnitude of this sampling error. This section of the documentation outlines the
measures of sampling error which Statistics Canada commonly uses and which it urges
users producing estimates from this microdata file to use also.
The basis for measuring the potential size of sampling errors is the standard error of the
estimates derived from survey results. However, because of the large variety of estimates
that can be produced from a survey, the standard error of an estimate is usually expressed
relative to the estimate to which it pertains. The commonly used CV of an estimate is
obtained by expressing the standard error of the estimate as a percentage of the estimate
itself. For more information on CVs please refer to Section 12.4 and chapter 13.
10.3 Non-sampling errors
There are many sources of non-sampling errors and these may occur at almost any phase
of a survey operation. Employees responsible for collection may misunderstand survey
instructions, respondents may misunderstand questions, or answers may have been
marked incorrectly on the questionnaire. Errors may also be introduced at any point when
the data is manipulated, including during the processing and tabulation of data.
For the SOP, quality assurance measures were established in order to reduce the presence
of non-sampling errors as much as possible. Consultations took place in the fall of 2003
with 30 principals (individually and through focus groups) to test the questionnaire.
These consultations took place in Moncton, Montreal and Toronto. The sample
composition of the focus groups took the following characteristics into consideration:
language of school, school level, schools with a high concentration of visible minorities,
school funding, gender and years of experience of the principal. In addition, about 200
principals from different locations in Canada were invited to participate in a pilot survey
in the spring of 2004. Changes to the questionnaire were made following the focus
groups and pilot test. These changes focused on reducing respondent burden and
improving data quality.
For more information on collection and processing procedures, refer to Chapters 7.0 and
8.0. Some of these measures provide indicators of the extent of non-sampling errors
associated with the survey and are outlined below.
10.4 Coverage
The quality of the frame was assessed by examining undercoverage and overcoverage, as
well as duplication of records. Difficulties arose in assessing the undercoverage of the
frame as it was determined that most of the other lists to which the Institution File could
be compared were either closely linked to the administrative files used to create the SOP
frame, related to a previous version of these files, or lacking a common unique key.
While the school frame was up-to-date for schools open at the start of the 2003-2004
school year with information for those schools being updated in the summer of 2004,
there was some undetermined degree of undercoverage of schools that may have opened
12
Survey of Principals, 2004/05 – User Guide
during the period between the start of the 2003-2004 school year and the start of the
2004-2005 school year.
10.5 Data capture
The answers provided on the questionnaire by the principals were captured using
electronic imaging. The only exceptions were questions where the principals could write
in their own answers as text or on certain questionnaires where there were problems with
the electronic capture of the data such as for some faxed questionnaires; in these cases
data were captured with traditional keying on microcomputers. Text recognition software
was used to capture the data and all answers captured, either manually or electronically,
were subject to double verification.
10.6 Data editing and outlier detection
The data editing and outlier detection processes were described in Chapter 8.0.
A large portion of editing centered on Section 1 of the questionnaire as this section had
the most problem areas. Questions 10 to 13 and 15 received extensive editing.
Given the poor quality of the data regarding part-time employees in question 9 and
question 14 in section 1, the data in these questions were not corrected and should not be
used for analytical purposes. Approximately 80% of the records in Section 1 of the
questionnaire had at least one correction made to the data.
The final question concerning sharing of data was also examined in depth. Some capture
errors were detected including cases for which there were marks either outside of the box,
in the box and not captured or alternatively missing when the signature was present.
These records were adjusted manually after consideration on a case by case basis.
11.0 Weighting
11.1 Base weight
In a probability sample, the sample design itself determines initial weights which must be
used to produce unbiased estimates of the population. Each unit must be weighted by the
inverse of its probability of selection. In the case of a 2% simple random sample, this
probability would be 0.02 for each unit and so the initial weights would be 1/0.02=50.
For this survey, the probability of selection varied by stratum (region by grade level) and
the initial weights were calculated as follows:
13
Survey of Principals, 2004/05 – User Guide
Base weight W(1):
Number of schools in the stratum on the frame
W(1) = ______________________________________
Number of schools in the stratum in the sample
11.2 Non-response adjustment
Non-response is a major source of error for a survey such as the SOP. As this class of
errors is not generally random, it is important that it be minimized and also that a proper
adjustment strategy be derived to compensate for the presence of systematic non-response
patterns that would otherwise result in severely biased estimates. Various strategies such
as refinement of the questionnaire following a field pre-test, initiating contact through a
letter of introduction, non-respondent follow-up and allowing the return of surveys via
mail or fax were put in place during data collection to improve response.
Several methods of treating non-response were examined and compared. Logistic
regression indicated that the variables most closely related to non-response were region,
grade level and size. Different manual groupings and probabilistic clusters of schools
were compared using (CVs) to assess which would best reduce non-response bias. A
diagnostic measure presented in the paper “A Better Understanding of Weight
Transformation through a Measure of Change”1 was used to assess the differences
between the leading methods. This diagnostic measure produces a particular quantity
indicating the relative reduction in non-response bias achieved by a weight-assignment
model. In the end, a model that created 54 classes from the intersection of the three
significant variables: region (Atlantic, Quebec, Ontario, Prairies, British Columbia, and
Territories), grade level (Elementary, Secondary and Mixed) and size (Small, Medium
and Large) was determined to be the best option for adjusting the weights to compensate
for non-response. This model had the added bonus that no additional calibration was
required as outlined in the next section. Therefore, the non-response adjustment for
respondents in a given adjustment class is as follows:
Non-response adjustment W(2):
Number of sample units in that adjustment class in the sample
W(2) = __________________________________________________
Number of responding sample units in that adjustment class
1 Dufour, J., Gagnon, F., Morin, Y., Renaud, M. and C.-E. Särndal (2001). A Better Understanding of
Weight Transformation Through a Measure of Change. Survey Methodology, 27, 97-108.
14
Survey of Principals, 2004/05 – User Guide
11.3 Calibration
Calibration estimation techniques are widely used in social surveys. They produce
estimates of totals for key variables that are consistent with known population counts.
This approach can also improve the quality of survey estimates if a relationship exists
between the key variables used in the calibration and the variables used for the
estimation. For this survey, the requirements were that totals match to the population
counts by region and grade level. Since the sample was stratified at these levels and nonresponse classes were also defined at these levels as outlined above, no additional
calibration was required.
11.4 Final weight
In general the final weight is the product of the factors that correspond to different sample
selection steps or adjustments such as initial weights, non-response adjustments and
calibration. In this survey, specifically, there are only the base weights and non-response
adjustments, as no calibration was necessary. Therefore the final weight variable, named
“cw” on the file, is calculated as follows:
Final Weight = W(1) x W(2)
12.0 Guidelines for tabulation, analysis and release
This chapter provides an overview of the guidelines to be observed by users tabulating,
analysing, publishing or otherwise releasing any data derived from the SOP microdata
file. In particular, users of microdata following these guidelines should be able to
produce the same figures as those produced by Statistics Canada.
12.1 Rounding guidelines
In order that estimates for publication or other release derived from the SOP microdata
files correspond to those produced by Statistics Canada, users are urged to adhere to the
following guidelines regarding the rounding of such estimates.
Estimates in the main body of a statistical table are to be rounded to the nearest hundred
units using the normal rounding technique. In normal rounding, if the first digit to be
dropped is from 0 to 4, the last digit to be kept is not changed. If the first digit to be
dropped is from 5 to 9, the last digit to be retained is increased by one. For example, in
normal rounding to the nearest hundred, if the last two digits are between 00 and 49, they
are changed to 00 and the preceding digit (the hundreds digit) is left unchanged. If the last
digits are between 50 and 99 they are changed to 00 and the preceding digit is
incremented by 1.
15
Survey of Principals, 2004/05 – User Guide
Marginal sub-totals and totals in statistical tables are to be derived from their
corresponding unrounded components and are then to be rounded themselves to the
nearest 100 units using normal rounding.
Averages, proportions, rates and percentages are to be computed from unrounded
components (i.e. numerators and/or denominators) and then are themselves to be
rounded to one decimal using normal rounding. In normal rounding to a single digit, if
the final or only digit to be dropped is 0 to 4, the last digit to be retained is not changed. If
the first or only digit to be dropped is 5 to 9, the last digit to be retained is increased by 1.
Sums and differences of aggregates (or ratios) are to be derived from their corresponding
unrounded components and then are to be rounded themselves to the nearest 100 units (or
the nearest one decimal) using normal rounding.
In instances where, due to technical or other limitations, a rounding technique other than
normal rounding is used, resulting in estimates to be published or otherwise released that
differ from corresponding estimates published by Statistics Canada, users are urged to
note the reason for such differences in the publication or release document(s).
Under no circumstances are unrounded estimates to be published or otherwise released by
users.
12.2 Weighting guidelines
For the SOP, a sample of schools was selected using a stratified design (see Section 9.2
for more details) and a response rate of 48% was obtained at collection. Consequently,
base weighting as well as non-response weighting must be taken into account when
producing estimates. The base weight and the non-response adjustment are combined to
form the final weight variable, called “Final Weight”, that is available to users.
When producing point estimates, including the production of ordinary statistical tables,
users must apply the survey weight as outlined in Chapter 11. If the survey weight is not
used, the estimates derived from the microdata cannot be considered to be representative
of the target population and will not correspond to those produced by Statistics Canada.
The weight assigned to each principal (school) can be viewed as the number of principals
(schools) on the frame represented by that particular respondent.
For some analysis techniques, for example linear regression, logistic regression, analysis
of variance or any other analysis where a measure of significance is required, it is
recommended that an adjusted weight be used. The method used to adjust weights
rescales them so that the average weight is 1 and the sum of all weights is equal to the
number of respondents.
For example, suppose that analysis of all secondary school principals is required. The
steps to re-scale the weights are as follows:
16
Survey of Principals, 2004/05 – User Guide
•
Select all respondents from the file who have been classified as secondary school
principals
•
Calculate the average weight for these records by summing the final principal
weights from the microdata file for these records and then dividing by the number
of respondents who were classified as secondary school principals.
•
For each of these respondents, calculate a rescaled weight equal to the final
principal weight, divided by the average principal weight
•
Perform the analysis for these respondents using the rescaled weight.
This method of rescaling weights can be useful for interpreting results provided by
standard statistical software. While many analysis procedures found in statistical
packages allow weights to be used, the meaning or definition of the weight in these
procedures differs from that which is appropriate in the framework of a survey such as
the SOP. The result is that while in many cases the point estimates produced by the
packages are correct, the variance estimates that are calculated are poor. Furthermore,
these estimates might not match those available from Statistics Canada due to the way
certain software packages treat the weight field. Re-scaling weights can make the
variances calculated by standard software packages more meaningful. One benefit of
rescaling the weights is that an overestimation of a level of significance, which is very
sensitive to sample size, is avoided while maintaining the same distributions as those
obtained when using the final weight.
When using some standard statistical software to calculate estimates based on rescaled
weights, the variability of the estimates inherent in the selection probabilities and nonresponse mechanism may not be taken into account. Therefore the variance estimates
calculated in this way may underestimate the true variance. The calculation of precise
variance estimates requires detailed knowledge of the survey stratification and assumed
non-response behaviour of the survey population as well as the corresponding adjustment
procedure adopted. For in depth information on calculating variance estimates for the
SOP, refer to Chapter 13.0.
12.3 Categorical vs. quantitative estimates:
The unit of analysis in the SOP file is the principal. Although other estimates can be
derived from the SOP, the weights attached to each record were designed to provide
reliable estimates of proportions based on counts of principals (that is, counts of schools).
For example the estimated proportion of principals who report being born in a certain
year is more reliable then the estimated proportion of students in schools with a principal
born in that year.
Before discussing how the SOP data can be tabulated and analysed, it is useful to
describe the two main types of point estimates of population characteristics that can be
17
Survey of Principals, 2004/05 – User Guide
generated from the SOP microdata file. To simplify the discussion, it is assumed in the
following descriptions that the proper set of respondents is used. In addition, the
reference to a domain in the following discussion refers to a group of principals for
which an estimate is to be generated (for example, one such domain would be the set of
French speaking principals located in a particular province or territory).
12.3.1 Categorical estimates
Categorical estimates are estimates of the number or percentage of the surveyed
population possessing certain characteristics or falling into some defined category.
Examples of categorical questions:
Q:
What language do you speak most often at home?
R:
English / French / Other-Specify
Q:
R:
Does your school have a written student evaluation policy?
Yes / No
12.3.2 Quantitative estimates
Quantitative estimates include estimates of totals or of means, medians and other
measures of central tendency of quantities based upon some or all of the members of the
surveyed population. They also specifically involve estimates of the form Xˆ / Yˆ , where
Xˆ is an estimate of the surveyed population quantity total and Yˆ is an estimate of the
number of principals in the surveyed population contributing to that total quantity, or
other more complex estimates such as regression coefficients.
An example of a quantitative estimate is the average number of years of experience as an
elementary school principal. The numerator is an estimate of the total years of experience
of all principals as an elementary school principal and the denominator is an estimate of
the total number of elementary school principals.
Examples of quantitative questions:
Q:
What is the approximate total school enrolment (number of students)?
R:
Total |_|_|_|_|
Q:
Among your school’s students and teaching staff (full-time and part-time)
approximately how many of them have a mother tongue other than English or French?
R:
Students |_|_|_|_| Teaching Staff |_|_|_|_|
12.3.3 Tabulation of categorical estimates
Number of principals possessing a certain characteristic
When all respondents in the domain answered the question related to the characteristic of
interest (i.e. no item non-response is observed), the estimate can be obtained from the
18
Survey of Principals, 2004/05 – User Guide
microdata file by summing the final weights of all records in the domain possessing this
characteristic.
If item non-response exists in the domain for the relevant question, the estimate can be
derived in two steps, as described below. This approach is appropriate only if the
observed item non-response is small (preferably less than 5%).
Step 1: Calculate the proportion of responding principals in the domain with this property
(see procedure below for proportions).
Step 2: Multiply this proportion by the sum of weights for all principals in the domain.
Proportions of principals possessing a certain characteristic
(a) Add up the final weights of principals in the domain having the characteristic of
interest ( Xˆ ),
(b) Add up the final weights of all principals in the domain ( Yˆ ), excluding those who did
not respond to the question used to identify the characteristic,
(c) Divide estimate a) by estimate b) ( Xˆ / Yˆ ).
12.3.4 Tabulation of quantitative estimates
Estimating population totals
Population totals of quantitative variables refer to values such as the total number of
students or total number of teachers. When there is no item non-response for the variable
of interest for all the respondents (principals) in the domain, estimates of population
totals can be obtained from the microdata file as follows:
(a) Multiply the value of the variable of interest by the final weight for each principal in
the domain.
(b) Sum this quantity over all principals in the domain.
As is the case of categorical estimates, if item non-response exists in a particular domain
for the variable of interest, then the estimate must be derived in two steps, as described
below.
Step 1: Obtain the average value of the quantity of interest for responding principals in
the domain by using the procedure below for ratios.
Step 2: Multiply this average by the sum of weights for all principals (responding and
non-responding) in the domain.
19
Survey of Principals, 2004/05 – User Guide
Also note that this two step approach is only appropriate if the item non-response
pertaining to the relevant question in the domain of interest is small.
Ratios of the form Xˆ Yˆ :
Ratio estimates represent several types of estimates. They include proportions, means
(e.g., mean age of principals) and ratios of two quantitative variables (e.g., ratio of the
number of students divided by the number of teachers). Ratio estimates can be obtained
in the following way:
(a) Multiply the value of the variable of interest for the numerator by the final weight and
sum this quantity over all records in the domain to obtain the numerator ( Xˆ ), excluding
those who did not respond to the variables of interest that define the numerator and the
denominator.
(b) Multiply the value of the variable of interest for the denominator by the final weight
and sum this quantity over all records in the domain to obtain the denominator ( Yˆ ),
excluding those who did not respond to the variables of interest that define the numerator
and the denominator.
(c) Divide estimate a) by estimate b) ( Xˆ / Yˆ ).
For example, to estimate the average age of principals for elementary schools:
•
•
•
Multiply the age of each elementary school principal by the final weight, then
sum up this quantity over all elementary school principals ( Xˆ ), excluding
principals that did not provide their year of birth.
Sum up the final weights of all elementary school principals ( Yˆ ), excluding
principals that did not provide their year of birth.
Divide the first estimate by the second estimate ( Xˆ / Yˆ ).
Another example is the estimation of the ratio of years of experience as a principal over
the total years of experience as a teacher, vice principal, principal or pedagogical
consultant:
•
•
•
Multiply the number of years of experience as a principal by the final weight, then
sum up this quantity over all principals ( Xˆ ), excluding principals that did not
respond to the question regarding their years of experience.
Multiply the total number of years of experience in the entire career as a teacher,
vice principal, principal or pedagogical consultant by the final weight, then sum
up this quantity over all principals ( Yˆ ), excluding principals that did not respond
to the question regarding their years of experience.
Divide the first estimate by the second estimate ( Xˆ / Yˆ ).
20
Survey of Principals, 2004/05 – User Guide
12.4 Coefficient of variation release guidelines
Before releasing and/or publishing any estimate from the SOP, users should first
determine the quality level of the estimate. The standard quality levels are: acceptable,
marginal and unacceptable. Data quality is typically affected by both sampling and nonsampling errors.
In establishing the standard quality level of an estimate, the user should first determine
the number of respondents that contributed to the calculation of the estimate. If this
number is five or less, the weighted estimate should not be released, in order to respect
policies regarding confidentiality. For weighted estimates, based on greater than five,
respondents, users should determine the CV of the estimate as described in Chapter 13
and follow the guidelines below. These quality level guidelines should be applied to
weighted rounded estimates. Any estimate of marginal or unacceptable quality level must
be accompanied by a warning to caution subsequent users.
Table 12.1
Quality level guidelines based on the CV of a particular estimate
Quality Level of
Estimate
1) Acceptable
Guidelines
Estimates are based on more than 5 respondents and CVs in the range of
0.0% to 16.5%.
No warning is required.
2) Marginal
Estimates are based on more than 5 respondents and CVs in the range of
16.6% to 33.3%.
Estimates should be flagged with the letter M (or some similar identifier).
They should be accompanied by a warning to caution subsequent users
about the high level of error associated with the estimates.
3) Unacceptable
Estimates based on 5 or fewer respondents should not be released, in order
to respect Agency policies regarding confidentiality.
For estimates based on more than 5 respondents, but with very high CVs in
excess of 33.3%, Statistics Canada recommends not releasing these
estimates, due to their unacceptable level of quality. However, if the user
chooses to do so, then these estimates should be flagged with the letter U
(or some similar identifier) and the following warning should accompany
the estimates:
“Please be warned that these estimates [flagged with the letter U] do not
meet Statistics Canada’s quality standards. Conclusions based on these data
will be unreliable and, most likely, invalid. These data and any consequent
findings should not be published. If the user chooses to publish these data or
findings, then this disclaimer must be published with the data.”
21
Survey of Principals, 2004/05 – User Guide
13.0 Variance calculation
As mentioned in Chapter 10 the SOP is a sample survey and estimates are subject to both
sampling error and non-sampling error. Sampling error causes variability, it measures the
extent to which an estimate from different possible samples of the same size and design,
using the same estimator, differ from one another. The purpose of this chapter is to
illustrate how the sampling variance is measured for the SOP and the importance of
correctly incorporating the sample design.
13.1 Importance of the variance
The variance of an estimate is a good indicator of the estimate’s quality. An estimate
accompanied by a high variance is considered to be unreliable. In order to quantify the
degree of variance, a relative measure of the variability is used, namely the CV.
The CV is defined as the ratio of the square root of the variance of the estimate (also
known as the standard error) to the estimate itself. Suppose we have an estimate Yˆ then
the CV of this estimate is:
αYˆ =
VAR (Yˆ )
Yˆ
The CV, as opposed to the variance, allows the analyst to compare estimates of different
magnitudes on a common scale. As a result, it is possible to assess the quality of any
estimate using the CV.
13.2 Calculating variance and CV of an estimate
In order to calculate the variance of estimates for this survey, the user has to take into
account the survey design (stratified random sample) and the non-response adjustment.
This is equivalent to calculating the variance for a two-phase design where the nonresponse is considered the second phase. The Generalized Estimation System (GES), a
program developed at Statistics Canada, was used to compute the variance of all
estimates released for this survey. It should be noted that the text, tables and equations
refer to estimated variances and CVs even if this is not stated explicitly.
22
Survey of Principals, 2004/05 – User Guide
No tool has been developed for external users to compute for themselves the variance of
SOP estimates. Users wishing to estimate variances and CVs may contact Statistics
Canada and ask that CV estimates be derived on a cost-recovery basis.
However, as an indication of the quality of the estimates for this survey, tables of CVs
produced for a variety of estimates are presented below. The CVs presented are estimates
for proportions only. For example, in Table 13.1.1, the CV for the proportion of
principals who responded “To a little extent” or “Not at all” for the aspect “Student
Table 13.1.1
Estimated CVs by region for question 4 in Section 2.
"To what extent do you believe that the changes that occurred in the previous decade will have a positive impact on the
following aspects at your school?"
Box
Aspect
2245
Student Learning
Response
Description
Canada
Atlantic
Que.
Ont.
Prairies
B.C.
Territories
%
2246
2247
2248
2249
2250
2251
Student Integration
into society
The
professionalism
of teachers
Your duties as
school principal
The effectiveness
of the school
system
Relationships with
parents
Recognition of the
school's mission
statement
“To a little
extent” or “Not
at all”
“To a great
extent” or “To a
certain extent”
“To a little
extent” or “Not
at all”
“To a great
extent” or “To a
certain extent”
“To a little
extent” or “Not
at all”
“To a great
extent” or “To a
certain extent”
“To a little
extent” or “Not
at all”
“To a great
extent” or “To a
certain extent”
“To a little
extent” or “Not
at all”
“To a great
extent” or “To a
certain extent”
“To a little
extent” or “Not
at all”
“To a great
extent” or “To a
certain extent”
“To a little
extent” or “Not
at all”
“To a great
extent” or “To a
certain extent”
4.8
9.5
13.2
8.7
9.7
11.0
17.9
1.0
2.4
1.7
2.2
2.1
2.7
5.9
3.3
7.2
11.4
5.3
6.6
8.3
13.8
1.5
3.3
2.0
3.6
3.2
3.5
8.1
3.1
9.6
8.4
5.6
6.8
5.7
18.5
1.6
2.5
2.7
3.3
3.0
5.1
7.7
3.8
8.9
9.5
6.6
8.1
8.4
22.5
1.3
2.6
2.4
2.8
2.5
3.5
6.2
3.2
7.4
7.2
6.1
6.4
7.4
14.8
1.6
3.1
3.1
3.1
3.1
4.0
8.9
3.1
7.7
8.6
5.2
6.5
7.8
13.7
1.6
3.0
2.6
3.5
3.0
3.7
9.2
3.1
7.6
10.0
5.3
5.9
7.4
14.1
1.5
3.1
2.2
3.5
3.4
3.9
9.3
23
Survey of Principals, 2004/05 – User Guide
Learning” for Question 4 in Section 2 of the questionnaire is 4.8%.
The following estimates are based on the 2,144 respondents identified as sharers. The
CVs for cells containing an ‘x’ have been suppressed due to the fact that five or less
records contributed to the corresponding cell point estimates for these cells.
Table 13.1.2
Estimated CVs by grade level and location for question 4 in Section 2.
"To what extent do you believe that the changes that occurred in the previous decade will have a positive impact on the following
aspects at your school?"
Grade Level
Location
Box
Aspect
Response Description
2245
Student Learning
2246
Student Integration
into society
“To a little extent” or
“Not at all”
“To a great extent” or
“To a certain extent”
“To a little extent” or
“Not at all”
“To a great extent” or
“To a certain extent”
“To a little extent” or
“Not at all”
“To a great extent” or
“To a certain extent”
“To a little extent” or
“Not at all”
“To a great extent” or
“To a certain extent”
“To a little extent” or
“Not at all”
“To a great extent” or
“To a certain extent”
“To a little extent” or
“Not at all”
“To a great extent” or
“To a certain extent”
“To a little extent” or
“Not at all”
“To a great extent” or
“To a certain extent”
Canada
Elementary
Mixed
Secondary
Rural
Urban
%
2247
2248
The professionalism
of teachers
Your duties as
school principal
2249
The effectiveness of
the school system
2250
Relationships with
parents
2251
Recognition of the
school's mission
statement
4.8
6.4
12.2
8.6
9.3
5.6
1.0
1.2
3.6
2.3
1.8
1.3
3.3
4.2
9.3
6.4
6.2
3.9
1.5
1.9
4.8
3.1
2.9
1.8
3.1
4.1
9.7
5.6
6.4
3.6
1.6
1.9
4.5
3.4
2.7
1.9
3.8
4.8
11.5
7.1
7.1
4.5
1.3
1.6
3.9
2.8
2.4
1.6
3.2
4.2
8.9
5.8
6.2
3.7
1.6
1.9
5.0
3.4
2.7
1.9
3.1
4.2
8.2
5.8
5.8
3.8
1.6
1.8
5.3
3.5
2.9
1.9
3.1
4.0
8.4
6.1
6.1
3.7
1.5
1.9
4.9
3.2
2.8
1.9
24
Survey of Principals, 2004/05 – User Guide
Table 13.2.1
Estimated CVs by region for question 2 in Section 3.
"Please rate your overall level of satisfaction with: "
Box
Topic
Response Description
3262
Support from
my supervisors
“Somewhat unsatisfied”
or “Very unsatisfied”
“Very satisfied” or
“Somewhat satisfied”
“Somewhat unsatisfied”
or “Very unsatisfied”
“Very satisfied” or
“Somewhat satisfied”
“Somewhat unsatisfied”
or “Very unsatisfied”
“Very satisfied” or
“Somewhat satisfied”
“Somewhat unsatisfied”
or “Very unsatisfied”
“Very satisfied” or
“Somewhat satisfied”
“Somewhat unsatisfied”
or “Very unsatisfied”
“Very satisfied” or
“Somewhat satisfied”
“Somewhat unsatisfied”
or “Very unsatisfied”
“Very satisfied” or
“Somewhat satisfied”
“Somewhat unsatisfied”
or “Very unsatisfied”
“Very satisfied” or
“Somewhat satisfied”
“Somewhat unsatisfied”
or “Very unsatisfied”
“Very satisfied” or
“Somewhat satisfied”
“Somewhat unsatisfied”
or “Very unsatisfied”
“Very satisfied” or
“Somewhat satisfied”
Canada
Atlantic
Que.
Ont.
Prairies
B.C.
Territories
%
3263
3264
3265
3266
3267
3268
3269
3270
My workload
Level of
remuneration
The
acknowledgement
of my occupation
Impact on my
family life
Legal standards
framing my work
My accountability
My professional
development
My professional
autonomy
5.4
11.8
11.3
12.9
10.3
11.7
29.0
0.9
2.0
2.1
1.7
2.0
2.6
4.8
2.0
4.1
4.1
3.6
4.9
5.4
12.2
2.3
5.5
5.2
4.9
3.9
5.3
8.4
2.3
4.0
4.2
5.1
4.6
6.8
18.9
2.0
5.9
5.0
3.5
4.1
4.1
5.5
2.7
5.3
4.9
5.8
5.2
8.2
14.5
1.7
4.2
4.4
3.1
3.8
3.4
7.7
1.7
3.6
3.8
3.2
3.4
4.4
10.5
2.9
6.6
5.9
5.6
6.0
6.6
11.6
2.9
5.0
7.3
5.1
5.8
8.2
14.0
1.8
4.8
3.2
3.7
3.5
3.8
9.9
4.8
9.0
10.4
8.4
10.9
14.6
19.2
1.0
2.6
2.1
2.1
1.6
1.9
5.6
6.0
11.3
14.6
10.7
13.1
15.8
24.9
0.8
2.0
1.5
1.7
1.5
1.8
6.2
4.5
9.4
11.0
7.6
11.2
11.1
14.6
1.0
2.4
2.0
2.3
1.7
2.6
5.7
25
Survey of Principals, 2004/05 – User Guide
Table 13.2.2
Estimated CVs by grade level and location for question 2 in Section 3.
"Please rate your overall level of satisfaction with: "
Grade Level
Box
Aspect
Response Description
3262
Support from my
supervisors
3263
My workload
“Somewhat unsatisfied”
or “Very unsatisfied”
“Very satisfied” or
“Somewhat satisfied”
“Somewhat unsatisfied”
or “Very unsatisfied”
“Very satisfied” or
“Somewhat satisfied”
“Somewhat unsatisfied”
or “Very unsatisfied”
“Very satisfied” or
“Somewhat satisfied”
“Somewhat unsatisfied”
or “Very unsatisfied”
“Very satisfied” or
“Somewhat satisfied”
“Somewhat unsatisfied”
or “Very unsatisfied”
“Very satisfied” or
“Somewhat satisfied”
“Somewhat unsatisfied”
or “Very unsatisfied”
“Very satisfied” or
“Somewhat satisfied”
“Somewhat unsatisfied”
or “Very unsatisfied”
“Very satisfied” or
“Somewhat satisfied”
“Somewhat unsatisfied”
or “Very unsatisfied”
“Very satisfied” or
“Somewhat satisfied”
“Somewhat unsatisfied”
or “Very unsatisfied”
“Very satisfied” or
“Somewhat satisfied”
Canada
Elementary
Mixed
Location
Secondary
Rural
Urban
%
3264
3265
Level of
remuneration
The
acknowledgement
of my occupation
3266
Impact on my
family life
3267
Legal standards
framing my work
3268
My accountability
3269
3270
My professional
development
My professional
autonomy
5.4
7.0
14.6
10.7
10.0
6.5
0.9
1.1
3.2
1.8
1.7
1.1
2.0
2.5
7.0
4.1
3.8
2.4
2.3
3.0
5.4
4.6
4.3
2.7
2.3
2.9
7.5
4.8
4.4
2.8
2.0
2.6
5.2
3.9
3.7
2.4
2.7
3.3
7.6
6.0
5.3
3.2
1.7
2.3
4.2
3.3
3.0
2.1
1.7
2.1
5.3
3.3
3.0
2.1
2.9
3.6
7.8
6.1
5.8
3.3
2.9
3.7
9.3
5.2
5.6
3.3
1.8
2.2
4.7
3.9
3.1
2.1
4.8
6.0
16.0
9.3
8.8
5.8
1.0
1.3
2.0
2.0
1.8
1.2
6.0
8.0
15.0
11.3
11.7
7.0
0.8
0.9
2.8
1.6
1.5
0.9
4.5
5.8
13.6
8.4
8.2
5.5
1.0
1.3
2.8
2.2
2.1
1.2
26
Survey of Principals, 2004/05 – User Guide
Table 13.3
Estimated CVs by region for question 6 in Section 4.
"Listed below are different problems that may occur in a school.
To what extent does each of the following hinder the proper functioning of your school?"
Box
Problem
4224
Conflicts among
students
Response
Description
Canada
Atlantic
Que.
Ont.
Prairies
B.C.
Territories
%
4225
4226
4227
4228
4229
4230
4231
4232
4233
4234
4235
4236
4237
4238
Bullying among
students
Health problems
students
Deterioration of
socio-economic
status of student's
families
Infractions against
property
(vandalism, theft)
by students
Students
possessing
weapons
Students' use of
alcohol or drugs
Students'
disrespect for
teachers
Verbal abuse of
physical assault of
a staff member by
a student
Student
absenteeism
Sexism/Sexual
harassment among
students
Racism/Racial
conflicts among
students
Staff's use of
alcohol or drugs
Teacher turnover
Teacher
absenteeism
“To a little extent” or
“Not at all”
“To a great extent” or
“To a certain extent”
“To a little extent” or
“Not at all”
“To a great extent” or
“To a certain extent”
“To a little extent” or
“Not at all”
“To a great extent” or
“To a certain extent”
“To a little extent” or
“Not at all”
“To a great extent” or
“To a certain extent”
“To a little extent” or
“Not at all”
“To a great extent” or
“To a certain extent”
“To a little extent” or
“Not at all”
“To a great extent” or
“To a certain extent”
“To a little extent” or
“Not at all”
“To a great extent” or
“To a certain extent”
“To a little extent” or
“Not at all”
“To a great extent” or
“To a certain extent”
“To a little extent” or
“Not at all”
“To a great extent” or
“To a certain extent”
“To a little extent” or
“Not at all”
“To a great extent” or
“To a certain extent”
“To a little extent” or
“Not at all”
“To a great extent” or
“To a certain extent”
“To a little extent” or
“Not at all”
“To a great extent” or
“To a certain extent”
“To a little extent” or
“Not at all”
“To a great extent” or
“To a certain extent”
“To a little extent” or
“Not at all”
“To a great extent” or
“To a certain extent”
“To a little extent” or
“Not at all”
2.0
4.5
5.4
4.1
3.6
3.5
10.2
2.3
5.1
4.0
4.2
5.4
7.8
9.3
1.9
4.5
5.2
4.1
3.4
2.8
9.1
2.4
5.2
4.2
4.2
5.7
9.2
10.5
1.2
2.4
2.4
2.3
2.4
2.6
7.2
4.2
9.7
9.2
7.8
8.4
11.0
16.3
2.2
4.9
6.3
3.8
4.2
5.2
15.8
2.2
4.6
3.5
4.8
4.8
5.6
6.7
1.1
2.4
3.0
2.1
2.3
2.3
8.8
4.3
10.0
7.6
8.7
9.4
13.2
13.1
0.9
1.8
2.8
1.6
1.7
2.2
3.4
10.9
26.7
23.1
19.1
21.3
32.3
x
1.2
2.6
3.5
2.1
2.4
3.1
6.1
3.7
8.8
7.5
7.3
7.8
10.2
10.5
1.6
3.6
4.3
3.6
2.8
2.9
7.0
2.9
6.2
5.5
5.0
6.7
9.9
11.8
1.1
2.5
3.0
2.2
2.0
2.1
6.1
5.1
10.5
8.6
9.8
11.7
19.2
18.6
1.5
3.1
3.0
2.9
3.2
3.7
16.2
2.9
6.8
7.0
5.3
5.6
7.2
6.5
1.0
2.0
2.5
1.9
1.7
2.0
4.3
6.4
13.9
12.9
10.9
13.4
23.0
27.6
1.0
2.1
2.5
1.8
2.1
2.0
3.3
6.9
17.9
17.0
11.5
12.4
20.1
x
0.9
1.9
2.6
1.6
1.6
2.1
3.1
13.5
28.3
29.5
23.6
27.7
x
x
1.4
2.9
5.1
2.5
2.1
3.2
9.1
3.4
8.8
4.7
7.3
9.6
9.6
11.5
1.1
1.9
3.6
2.1
1.9
2.6
3.6
27
Survey of Principals, 2004/05 – User Guide
4239
4240
4241
4242
4243
4244
Disruption of
classes by students
Student tardiness
Students dropping
out
Student apathy
Conflicts between
parents and
teachers
Complaints from
parents students
“To a great extent” or
“To a certain extent”
“To a little extent” or
“Not at all”
“To a great extent” or
“To a certain extent”
“To a little extent” or
“Not at all”
“To a great extent” or
“To a certain extent”
“To a little extent” or
“Not at all”
“To a great extent” or
“To a certain extent”
“To a little extent” or
“Not at all”
“To a great extent” or
“To a certain extent”
“To a little extent” or
“Not at all”
“To a great extent” or
“To a certain extent”
“To a little extent” or
“Not at all”
“To a great extent” or
“To a certain extent”
4.2
13.3
6.2
9.1
10.1
11.5
21.1
1.5
3.5
3.1
3.2
2.9
3.0
10.9
3.3
6.5
8.0
5.6
6.7
9.4
11.0
1.4
3.1
3.1
2.9
2.7
3.5
12.9
3.2
7.5
7.8
5.7
6.7
8.2
7.2
1.4
2.4
3.7
2.9
2.5
2.8
6.1
5.2
16.7
8.3
11.5
10.1
19.2
10.3
1.5
3.0
4.1
2.8
2.9
3.1
8.0
3.2
7.2
5.7
6.5
6.6
9.5
8.9
1.1
2.1
2.8
2.1
2.3
2.3
4.4
4.4
11.5
8.6
8.2
8.4
12.3
20.6
1.1
2.1
3.2
2.3
2.1
2.1
3.6
4.2
11.3
7.3
7.8
8.8
12.6
19.0
In general, the following rules should be applied when calculating and using CVs.
Rule 1: Estimates of proportions or percentages of principals possessing a characteristic
The CVs given in the preceding tables are for proportions. Hence, they can be used
directly as they are given. For other similar estimates of proportions (e.g., for other
questions), the CVs in the tables above could be used as an indication but the user should
contact Statistics Canada to obtain CVs calculated for those specific characteristics. Note
that all CV estimates for proportions are only valid if the item non-response is small.
Rule 2: Estimates of number of principals possessing a characteristic (aggregates)
The estimated CV for the number of principals possessing a characteristic is in theory the
same as that of the proportion it represents (the corresponding proportion of principals
possessing a characteristic) and very close but slightly greater if item non-response is
small. This relationship should not be utilised when the item non-response for the
question relating to the characteristic is large and/or the size of the domain of interest is
relatively small.
For example, suppose we have an estimate Yˆ = 1,000 principals possessing a certain
characteristic out of the estimated total Xˆ = 5,000 principals in the domain of interest,
Yˆ
then the CV for Yˆ should be close to the CV of the proportion .
Xˆ
28
Survey of Principals, 2004/05 – User Guide
Rule 3: Estimates of differences between aggregates, percentages and ratios
The standard error of a difference between two estimates is approximately equal to the
square root of the sum of squares of each standard error considered separately. In other
words, the standard error of the difference dˆ = Xˆ 1 − Xˆ 2 is approximated by:
σˆ dˆ = ( Xˆ 1αˆ 1 ) 2 + ( Xˆ 2αˆ 2 ) 2
where αˆ 1 and αˆ 2 are the CVs of Xˆ 1 and Xˆ 2 respectively. The CV of dˆ is given by
dividing its standard error by dˆ itself:
αˆ dˆ =
σˆ dˆ
dˆ
This is a good approximation for the CV of a difference between separate and
uncorrelated characteristics, but it will tend to overstate the CV if Xˆ 1 and Xˆ 2 are
positively correlated and understate the CV if Xˆ and Xˆ are negatively correlated.
1
2
Estimates of CVs for correlated Xˆ 1 and Xˆ 2 may be obtained from Statistics Canada on a
cost-recovery basis.
Rule 4: Estimates of ratios
The standard error of the ratio of the estimates is approximately equal to the square root
of the sum of squares of each CV considered separately, multiplied by the ratio itself.
That is, the CV of such a ratio Rˆ = Xˆ 1 / Xˆ 2 is:
αˆ Rˆ = αˆ 1 2 + αˆ 2 2
where αˆ 1 and αˆ 2 are the CVs of Xˆ 1 and Xˆ 2 respectively. As with the CV estimate of
Rule 3, this estimate will tend to overstate the CV if Xˆ and Xˆ are positively correlated
1
2
and understate the CV if Xˆ 1 and Xˆ 2 are negatively correlated.
Rule 5: Estimates of differences of ratios
This is simply a combination of Rules 3 and 4. The CVs for the two ratios are first
determined using Rule 4 and then the CV of their difference is found using Rule 3.
29
Survey of Principals, 2004/05 – User Guide
13.3 Using the coefficient of variation to obtain confidence limits
Although CVs are widely used, a more intuitively meaningful measure of sampling error
is the confidence interval of an estimate. A confidence interval constitutes a statement on
the level of confidence that the true value for the population lies within a specified range
of values. The interpretation of a 95% confidence interval is that if the survey were
carried out an infinite number of times with the same sampling and non-response rates,
then 95% of the response sets would generate estimates whose confidence intervals
would contain the true value.
Confidence intervals for an estimate, Xˆ , are generally expressed as two numbers, one
below and one above the estimate, as in ( Xˆ ± k ), where k is determined depending upon
the level of confidence desired and the standard error of the estimate. As the true standard
error of the estimates is unknown, confidence intervals are estimated based on the set of
respondents.
Using the standard error of an estimate, confidence intervals for estimates may be
obtained under the assumption that with a large enough sample size, large enough
population size and large enough difference between these two numbers (N-n) the various
estimates obtained for a population characteristic are normally distributed about the true
population value. Under these assumptions, the chances are about 68 in 100 that the
difference between a sample estimate and the true population value would be less than
one standard error, about 95 out of 100 that the difference would be less than two
standard errors, and about 99 out of 100 that the differences would be less than three
standard errors. These different degrees of confidence are referred to as the confidence
levels.
If the user wants to determine confidence intervals, the following formula will convert to
a confidence interval (CI Xˆ ):
CI Xˆ = ( Xˆ ± zXˆαˆ Xˆ )
where αˆ Xˆ is the determined CV for Xˆ and
z = 1 if a 68% confidence interval is desired;
z = 1.65 if a 90% confidence interval is desired;
z = 1.96 if a 95% confidence interval is desired;
z = 2.58 if a 99% confidence interval is desired.
Example of using the coefficient of variation to obtain confidence limits
The following example refers to Question 4 in Section 2. (See Table 13.1.1)
A 95% confidence interval for the estimated proportion of principals in Canada who
believe that changes in the previous decade would have a positive impact on student
learning to a little extent or not at all would be calculated as follows:
30
Survey of Principals, 2004/05 – User Guide
Xˆ = 17.4% (or 0.174 expressed as a proportion)
z = 1.96
The coefficient of variation of Xˆ is 4.8% (or 0.048, expressed as a proportion).
CI Xˆ = {0.174 - (1.96) (0.174) (0.048), 0.174 + (1.96) (0.174) (0.048)}
CI Xˆ = {0.174 - 0.016, 0.174 + 0.016}
CI Xˆ = {0.158, 0.190}
Hence, with a 95% level of confidence, it can be said that between 15.8% and 19.0% of
principals nationally believe that changes in the previous decade would have a positive
impact on student learning to a little extent or not at all.
13.4 Hypothesis tests
Standard errors may also be used to perform hypothesis testing, a procedure for making
inferences about possible differences between population parameters using sample
estimates. The sample estimates can be counts, averages, percentages, ratios, etc. Tests
may be performed at various levels of significance, where a level of significance is the
probability of concluding that the characteristics are different when, in fact, they are
identical.
Let Xˆ 1 and Xˆ 2 be sample estimates for two characteristics of interest. As in Rule 3 of
Section 13.2, let the standard error for the difference Xˆ − Xˆ be σˆ d . If the quantity
1
2
( Xˆ 1 − Xˆ 2 ) / σˆ d is between -1.96 and +1.96, then there is no significant difference between
the characteristics at the 5% level of significance. However, if this ratio is smaller than 1.96 or larger than +1.96, the observed difference is significant at the 5% level of
significance. Recall from Rule 3 of Section 13.2 that this method can only be reliably
applied when the two characteristics of interest are uncorrelated, otherwise the quantity
( Xˆ 1 − Xˆ 2 ) / σˆ d may be inaccurate.
An alternative way to determine whether two estimates are significantly different is to
compare the confidence intervals surrounding the two estimates. When two confidence
intervals overlap, it can be concluded that there is no significant difference reported
between the corresponding estimates (although in theory there could be a significant
difference in that case). It should be noted that this method is fairly approximate as it
corresponds to approximating the confidence interval for the difference of the two
estimates. The resulting approximated confidence interval will be slightly larger than the
one derived in Section 13.3. As a result, by using this conservative convention, there is a
small risk that, according to the level of confidence used cases where the difference is
significant (but very small) will not be identified.
31
Survey of Principals, 2004/05 – User Guide
13.5 Coefficients of variations for quantitative estimates
Only a few quantitative variables could be estimated from this survey (see Section 12.3.2
for the definition of a quantitative estimate). Only Questions 8 to 15 in Section 1 could be
potentially used to compute quantitative estimates. However, no analyses should be done
using Questions 9 and 14 (see Section 10.6 for more details).
As a general rule the coefficient of variation of a quantitative total will be larger than the
coefficient of variation of the corresponding category estimate. If the corresponding
category estimate is not releasable, the quantitative estimate will not be either. For
example, when considering only the principals in elementary schools, the CV for the
average number of years of experience as an elementary teacher likely would be greater
than the CV of the proportion of principals that have teaching experience in elementary
schools. Hence if the coefficient of variation of the proportion is not releasable, then the
coefficient of variation of the corresponding quantitative estimate probably will not be
releasable.
Appendix A: Questionnaire
This appendix contains a copy of the SOP questionnaire, which was intended for the
principals of the schools.
The questionnaire reproduced in the appendix is in English. Please refer to the French
version of the User’s Guide to obtain a French copy of the questionnaire.
Appendix B: School characteristics
This appendix gives an overview of the definitions used to derive the school
characteristics variables.
Instructional level of the school – Elementary, secondary and mixed
elementary and secondary schools
Elementary and secondary schools in Canada have been classed as elementary if they
provide Grade 6 and under or a majority of elementary grades; secondary, if they offer
Grade 7 and over or a majority of secondary grades. Mixed elementary and secondary
schools are schools offering a combination of elementary and secondary grades.
School location – Urban and rural
Rural schools are those located in rural areas and small towns (RST) as well as those
within the rural fringes of a larger centre (census metropolitan areas (CMAs) or census
agglomerations (CAs)). Urban schools are those located in a CMA or CA, but not in the
rural fringe.
32
Survey of Principals, 2004/05 – User Guide
Funding of school – Public and private
A school was classified as either public or private according to whether a public agency
or a private entity had the ultimate power to make decisions concerning its affairs. A
school was classified as public if the school principal reported that it was: controlled and
managed directly by a public education authority or agency; or controlled and managed
either by a government agency directly or by a governing body (council, committee, etc.),
most of whose members were either appointed by a public authority or elected by public
franchise. A school was classified as private if the school principal reported that it was
controlled and managed by a non-governmental organisation (e.g., a church, a trade union
or a business enterprise) or if its governing board consisted mostly of members not
selected by a public agency.
School size – Small, medium and large
Size of school is established based on the distribution of the number of students enrolled
in Elementary, Secondary and Mixed elementary and secondary schools. Schools for
which their number of students fall in the bottom third (<33.3%) of the distribution are
defined as “small-size schools”. “Medium-size schools” are defined as those for which
their number of students is falling between the bottom third (≥33.3%) and the top third
(≤66.6%) of the distribution, while “large-size schools” represent those for which their
number of students is falling at the top of the distribution (>66.6%). Size of school is
given as follows:
Small
Medium
Large
Elementary
Secondary
Less than 200 students
200 to 350 students
More than 350 students
Less than 300 students
300 to 700 students
More than 700 students
Mixed elementary and
secondary
Less than 60 students
60 to 200 students
More than 200 students
33