1
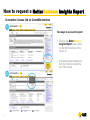
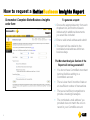
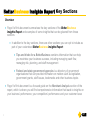
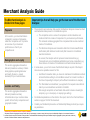
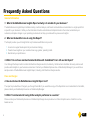
User Guide Contents 2 ♦ Welcome to the new BetterBusiness Insights Report 3-4 ♦ How to request a BetterBusiness Insights Report 5-6 ♦ BetterBusiness Insights Report key sections 7-9 ♦ Frequently asked questions 10-14 ♦ Chart definitions 15-20 Welcome to the BetterBusiness Insights Report ♦ The BetterBusiness Insights Report collates industry, merchant analysis, catchment and Australian economic data in a single report that is tailored for your business. It offers you the information to better understand and anticipate trends in the market, understand your customers, anticipate changes in your operating environment and stay up-to-date with key issues and insights. The report is provided free of charge to you through CommBiz. ♦ This User Guide is divided into four sections that will help you get the most out of the BetterBusiness Insights Report: 1. How to request the BetterBusiness Insights Report Includes detailed instructions on how to access the report through CommBiz 2. BetterBusiness Insights Report Key Sections Summarises the main sections of the report and how they relate to your business 3. Frequently asked questions Contains answers to our most commonly encountered questions 4. Chart definitions Provides detailed definitions for all charts included in the report DISCLAIMER: This report has been produced by Commonwealth Bank of Australia ABN 48 123 123 124 based on information available at the time of publishing. We believe that the information in this report is correct and any opinions, conclusions or recommendations are reasonably held or made at the time of its compilation, but no warranty is made to accuracy, reliability or completeness. To the extent permitted by law, neither Commonwealth Bank of Australia nor any of its subsidiaries accept liability to any person for loss or damage arising from the use of this report. No person should act on the basis of this report without considering and if necessary taking appropriate professional advice upon their own particular circumstances. We are under no obligation to, and do not, update or keep current the information contained in this report. Past performance is not a reliable indicator of future performance. If you receive this report in error, please do not use or disclose the contents, please delete and destroy all copies. 3 Welcome to the BetterBusiness Insights Report ♦ Your Relationship Executive or Relationship Manager is your key contact for any information or assistance you require regarding the BetterBusiness Insights Report including, but not limited to: ♦ Questions you may have about the report and its data ♦ Technical issues in accessing the report ♦ Feedback on the report ♦ In addition to being available to assist you, your Relationship Executive or Relationship Manager will welcome the opportunity to discuss the BetterBusiness Insights Report with you. ♦ Alternatively, you can email the BetterBusiness Insights team at [email protected] DISCLAIMER: This report has been produced by Commonwealth Bank of Australia ABN 48 123 123 124 based on information available at the time of publishing. We believe that the information in this report is correct and any opinions, conclusions or recommendations are reasonably held or made at the time of its compilation, but no warranty is made to accuracy, reliability or completeness. To the extent permitted by law, neither Commonwealth Bank of Australia nor any of its subsidiaries accept liability to any person for loss or damage arising from the use of this report. No person should act on the basis of this report without considering and if necessary taking appropriate professional advice upon their own particular circumstances. We are under no obligation to, and do not, update or keep current the information contained in this report. Past performance is not a reliable indicator of future performance. If you receive this report in error, please do not use or disclose the contents, please delete and destroy all copies. 4 How to request a BetterBusiness Insights Report Screenshot: Access link on CommBiz interface 1 Two ways to access the report: 1. Click on the BetterBusiness Insights Report menu option on the right hand side of the screen; or 2. Choose Business Intelligence from the Functions tab at the top of the screen 2 5 How to request a BetterBusiness Insights Report Screenshot: Complete BetterBusiness Insights order form To generate a report: 1. Choose the appropriate entry from each dropdown list, and tick the boxes to indicate which additional documents you would like included 2. Enter a valid email address and submit 3. The report will be emailed to the nominated email address within two business days The Merchant Analysis Section of the Report will not be generated if: 6 You do not have CommBank merchant terminal facilities settling to a CommBank account There is less than 6 months of data or an insufficient number of transactions There are insufficient competitors to provide a meaningful analysis The nominated e-mail address’ you provided does not match the one on record in your CommBiz account BetterBusiness Insights Report Key Sections Overview ♦ Page 8 of this document summarises the key sections of the BetterBusiness Insights Report and examples of some insights that can be gleaned from these sections ♦ In addition to the key sections, there are other sections you can opt to include as part of your customised BetterBusiness Insights Report: ♦ Tips and tricks for a BetterBusiness contains information that can help you maximise your business success, including managing cash flow, managing risk, planning, and staff management ♦ Federal and state government agencies is a directory of government organisations that can provide information on matters such as legislation, government grants, staff issues, trademarks and other business topics ♦ Page 9 of this document is a focused guide on the Merchant Analysis section of the report, which is where you will find comprehensive information that leads to insights on your business’ performance, your competitors’ performance and your customer base 7 BetterBusiness Insights Report Key Sections 01 Industry Key message Chart data and key insights ♦ Key issues and success factors Understand your industry, key challenges and growth outlook ♦ Challenges facing industry players ♦ Turnover, growth and employment statistics ♦ Industry target market 02 Merchant Analysis Benchmark comparison with competitors and gain an insight into customers ♦ Analyse sales growth and monthly transactions for merchant data compared to industry competitors ♦ Gain insights into customer demographics, loyalty and spend patterns 03 Catchment Understand the geographic segments of customer business including population and employment ♦ Review population and employment insights for the catchment ♦ Understand resident and working population profiles 04 Australian Economy Understanding drivers of the local economy 8 ♦ Determine the impact of fiscal and monetary policy on your business Merchant Analysis Guide The Merchant Analysis is divided into three pages: Payments Important tips that will help you get the best out of the Merchant Analysis: ♦ In this section, your merchant data is compared to a series of companies called the “competitive set” to provide an overview of your business’ performance vs. that of your competitive set Demographics and Loyalty This section aggregates transaction data and presents a summary of basic demographics, spending behaviour and loyalty figures (i.e. repeat business) for your customer base ♦ The competitor and customer data used in the Merchant Analysis is based on client and transaction data present in CommBank’s system. ♦ The competitive set is a series of companies in similar industries and locations that form a basis of comparison for your business’ performance. This is based on data aggregated from companies that are also merchant clients of CommBank. ♦ The Merchant Analysis uses transaction data from Commonwealth Bank cardholders (both debit and credit cards) that transact on CommBank merchant terminals ♦ As a result, the Analysis will not represent some transactions (e.g Transactions by non-CommBank cardholders) and some competitors (e.g. those that are not clients of CommBank’s merchant terminal services) In some cases, you will not receive the Merchant Analysis as part of the Report. Here are some possible reasons for this: ♦ Insufficient transaction data: you have not maintained CommBank merchant terminal facilities settling to a CommBank account for at least 6 months at the time of requesting the Report (with sufficient transactions to analyse) ♦ The ‘Nominated e-mail address’ you supplied in the request screen did not match your e-mail address recorded in CommBiz ♦ Not enough competitors or benchmark data exists to make a meaningful analysis (e.g. in a monopoly- or duopoly-type setting) Location and Family This section aggregates transaction data and presents summary information about your customer base specific to their family composition and geographic location 9 ♦ For detailed explanations on the charts in the report, refer to the Chart definitions section on pages 15-20 of this document ♦ Contact your Relationship Executive or Relationship Manager should you require any assistance Confidentiality of CommBank Customer Proprietary Information We present information in aggregated summary format, often only in percentages, to ensure we comply with our privacy and confidentiality obligations. In concentrated industries or locations information may not be disclosed. All data provided to Commonwealth Bank clients through the report's Merchant Analysis is aggregated by industry and location, without any indication of individual merchants' transactions and performance. Frequently Asked Questions General information 1. What is the BetterBusiness Insights Report and why is it valuable for your business? The BetterBusiness Insights Report collates industry, merchant analysis, catchment and Australian economic data in a single report that is specific to your business. It offers you the information to better understand and anticipate trends in the market, understand your customers, anticipate changes in your operating environment and stay up-to-date with key issues and insights. 2. What are the benefits to me in using this Report? The Report provides you with insights that only Commonwealth Bank can provide: 1. A service to support development of your business strategy 2. Powerful new insights on your customer base: age, gender, spending habits 3. Benchmark your performance 3. What if I do not have merchant terminal facilities with CommBank? Can I still use this Report? Yes. Although the Report will not contain the Merchant Analysis section, the Industry, Catchment and Australian Economy sections will provide useful insights on your business environment. Contact your Relationship Executive or Relationship Manager if you would like a sample version of the BetterBusiness Insights Report, including a full Merchant Analysis section. Fees and charges 4. How much does the BetterBusiness Insights Report cost? The report is provided free of charge to you through CommBiz. If you would like a copy of the Report but are not subscribed to CommBiz, please contact your Relationship Executive or Relationship Manager. 5. What if I am interested in having further analytics performed as a service? Please contact your Relationship Executive or Relationship Manager to enquire about our Client Analytics service. Note this is a feebased service. 10 Frequently Asked Questions Requesting the Report 6. How do I request a BetterBusiness Insights Report? You can request a copy of the BetterBusiness Insights Report through CommBiz. Please refer to the section of this guide titled “How to request a BetterBusiness Insights Report” on page 6 of this guide. Report data and security 7. Where does the data come from? There are multiple sources of data: ♦ Industry data – Based on information from IBISWorld who is Australia’s largest provider of industry-based research ♦ Merchant Analysis data – Sourced from businesses within the competitive set who have CommBank merchant terminal facilities. ♦ Customer demographics data – Sourced from CommBank cardholders transacting on CommBank merchant terminals. ♦ Population data – Sourced from the Australian Bureau of Statistics (ABS) ♦ Australian economic data – Sourced from CommBank Economic Analysis 8. What is a competitive set? A set of companies in similar industries and similar locations to form a basis of comparison for your business’ performance. The industry is what is recorded in the CommBank merchant system. 9. How often is the data in the BetterBusiness Insights Report updated? You can access the report mid-month to find new Merchant Analysis data. However, given the Report collates data from multiple sources, the data is updated according to the table below. We recommend requesting a Report every 6-12 months to allow enough time for new data to provide a meaningful analysis of your business environment. 11 Data Updated Industry data from IBISWorld Bi-annually (timing varies by industry) Unemployment data Mid-month Merchant Analysis data Mid-month Population data from census 5 Years Australian economic data Weekly Frequently Asked Questions Report data and security (cont’d) 10. What do the some of the terms in the industry data mean? ♦ Constant prices: The dollar figures in the Key Statistics table, including forecasts, are adjusted for inflation using 2012-13 as the base year. This removes the impact of changes in the purchasing power of the dollar, leaving only the ‘real’ growth or decline in industry metrics. The inflation adjustments in IBISWorld’s reports are made using the Australian Bureau of Statistics’ implicit GDP price deflator. ♦ Employment: The number of working proprietors, partners, permanent, part-time, temporary and casual employees, and managerial and executive employees. ♦ Enterprise: A division that is separately managed and keeps management accounts. The most relevant measure of the number of firms in an industry. ♦ Industry concentration: IBISWorld bases concentration on the top four firms. Concentration is identified as High, Medium or Low. High means the top four players account for over 70% of revenue; Medium is 40 –70% of revenue; Low is less than 40%. ♦ Industry revenue: The total sales revenue of the industry at the end of the Financial Year, including sales (exclusive of excise and sales tax) of goods and services; plus transfers to other firms of the same business; plus subsidies on production; plus all other operating income from outside the firm (such as commission income, repair and service income, and rent, leasing and hiring income); plus capital work done by rental or lease. Receipts from interest royalties, dividends and the sale of fixed tangible assets are excluded. ♦ Target market: Refers to the major market segments defined by industry or customer groups to which this industry caters 11. Why does my copy of the BetterBusiness Insights Report not include a Merchant Analysis section? There are a few possible reasons for this: 1. There is insufficient data to generate the Merchant Analysis section (you must be an existing client of CommBank’s merchant services for at least 6 months at the time of requesting the Report (provided there are sufficient transactions to analyse) 2. The ‘Nominated e-mail address’ you supplied in the request screen did not match your e-mail address recorded in CommBiz 3. Not enough competitors or benchmark data exists to make a meaningful analysis (e.g. in a monopoly- or duopoly-type setting) 4. Your merchant services must settle with the Commonwealth Bank to be eligible for this report. 12 Frequently Asked Questions Report data and security (cont’d) 12. Can competitors and/or other companies see my business’ data? No. All data provided to Commonwealth Bank business clients through the BetterBusiness Insights Report‘s Merchant Analysis are aggregated by catchment and industry, without any indication of individual merchants’ transactions and performance. 13. Why does the data published in the Report seem to differ from my understanding of my business’ performance? Please contact your Relationship Executive or Relationship Manager should you have any concerns about how the BetterBusiness Insights Report aligns with your understanding of your business’ performance. Please note that the Merchant Analysis section provides an indication of relative performance only. It is important to understand that the data used to generate this analysis only covers card transactions completed by CommBank cardholders on CommBank merchant terminals. The Merchant Analysis Guide (see page 9 of this document) provides examples of data that the BetterBusiness Insights Report does not cover, which may contribute to perceivable difference between the Merchant Analysis and your overall business performance. The BetterBusiness Insights Report is subject to the following disclaimer: This report has been produced by Commonwealth Bank of Australia ABN 48 123 123 124 based on information available at the time of publishing. We believe that the information in this report is correct and any opinions, conclusions or recommendations are reasonably held or made at the time of its compilation, but no warranty is made to accuracy, reliability or completeness. To the extent permitted by law, neither Commonwealth Bank of Australia nor any of its subsidiaries accept liability to any person for loss or damage arising from the use of this report. No person should act on the basis of this report without considering and if necessary taking appropriate professional advice upon their own particular circumstances. We are under no obligation to, and do not, update or keep current the information contained in this report. Past performance is not a reliable indicator of future performance. If you receive this report in error, please do not use or disclose the contents, please delete and destroy all copies. 13 Frequently Asked Questions System and technical 14. Do I need to install any software or hardware to access the BetterBusiness Insights Report? As long as you have an existing Internet connection and access to your CommBiz service, you should be able to request and access the BetterBusiness Insights Report. The Report file is delivered in PDF format. If you are unable to open the file on your computer, you must install a PDF reader on your system (available for free from www.adobe.com/products/reader.html) 15. Can I view the Report on my tablet or other mobile device? Yes. iPad users are able to view PDF files as attachments in the Mail application, or through a dedicated PDF reader. Users of Androidbased tablets should ensure that they have installed a PDF reader in order to view the BetterBusiness Insights Report. The Report also can be accessed through any smartphone that can open PDF files. However, for maximum readability, we recommend accessing the Report through devices with larger screens. Further information 16. How can I get additional assistance, provide feedback or discuss any questions on the BetterBusiness Insights Report? Please contact your Relationship Executive or Relationship Manager should you require any assistance on the BetterBusiness Insights Report, including but not limited to: ♦ Questions you may have about the Report and its data ♦ Technical issues in accessing the Report ♦ Feedback on the Report Alternatively, please email [email protected] 14 Chart Definitions Industry Overview Revenue Growth ♦ Chart depicts growth in total industry revenue as a percentage, calculated from June 2008 as baseline and forecasted out to 2015 ♦ Data is sourced from IBISWorld industry revenue and is based on financial year (June end) data Revenue Market Segmentation Target Market 15 ♦ Chart depicts percentage split of total industry revenue by target market and represents current financial year data sourced from IBISWorld ♦ Target market categories can be defined by industry categories for business-to-business enterprises and age group for business-to-customer enterprises ♦ Customer groups are ordered highest to lowest, totalling 100% Chart Definitions Merchant Analysis Payments Percentage Growth versus Industry Competitors Sales Growth and Monthly Transactions ♦ Chart depicts three-monthly merchant terminal sales percentage growth compared to a baseline quarter sales ♦ Merchant performance is compared to the competitive set Monthly Sales versus Industry Competitors Sales Growth and Monthly Transactions ♦ Chart depicts the percentage of total merchant terminal sales ($ value) for each month and the percentage of total merchant terminal transactions (transaction volume) for each month ♦ This data can be used to view seasonality of sales across a 12 month period ♦ Merchant performance is compared to the competitive set Merchant versus Industry Competitors Card Type ♦ Chart depicts the percentage of each merchant terminal method of payment over 12 months ♦ Merchant performance is compared to the competitive set Relative Size of your Business to Industry Competitors Competition 16 ♦ Chart depicts the merchant terminal sales over 12 months compared to industry competitors within a specific geographic region ♦ The percentage of competitors with sales, significantly less, less, similar, greater and significantly greater sales when compared to the merchant are shown across the scale Chart Definitions Customer Demographics and Loyalty Customers by Age Group and Gender Customer Demographics ♦ Icons depict male and female customer base split who are using their CommBank card to undertake transactions at the merchant ♦ Chart depicts percentage of unique customers who transacted at the merchant, by age group, over 12 months Percentage Value and Average Spend Customer Spend ♦ Chart depicts percentage representation of total sales by customer age group of CommBank card holders at the merchant over 12 months ♦ The average annual spend and average spend per transaction at the merchant are plotted by age group for CommBank card holders Customer Profile ♦ Socioeconomic Background Consumer profiles are defined by Consumer Profile definitions in the Report Appendix: ♦ % of Customers – percentage of unique CommBank card holders from each ABS recognised demographic that transact at the merchant terminal (sorted from high to low) ♦ % of Volume – percentage of annual merchant transactions volume by demographic ♦ % of Value – percentage of annual merchant transaction value by demographic ♦ Avg. per Trans – the average spend per transaction by demographic Customer Loyalty ♦ Loyalty 17 The top table identifies repeat business from CommBank cardholders as defined by repeat business at a singular merchant terminal. The bottom table identifies cardholders who transact across any of the client’s merchant terminals over 12 months: ♦ % of Customers – percentage of unique CommBank card holders who transact at the merchant terminal by annual patronage (sorted from high to low) ♦ % of Volume – percentage of annual merchant transaction volume by annual patronage ♦ % of Value – percentage of annual merchant transaction value by annual patronage ♦ Avg. per Trans – the average spend per transaction by annual patronage Chart Definitions Customer Location and Family Customer Travel Distance Distance from Store ♦ Chart depicts the percentage split of unique CommBank card holders by distance from their place of residence and the merchant ♦ Represents 12 months of data Estimated Family Composition of your Customers Estimated Family Composition of your Customers ♦ ‘Customers’ Chart (left) depicts the estimated percentage by family composition of unique CommBank card holders who transact at the Merchant ♦ ‘Sales Value by Family Composition’ Chart (right) depicts the estimated percentage of CommBank card holders’ sales value at the Merchant by family composition ♦ Supporting data table presents average spend per unique CommBank card holder and average spend per transaction for a CommBank card holder by family composition ♦ Data captured at the merchant terminal over 12 months Where your Customers Live ♦ Top Catchments Chart depicts where the Merchant's customers live (residential suburb) for 12 months data: ♦ Percentage of unique CommBank card customers, ♦ Percentage of merchant transaction value ♦ Percentage of merchant transaction volume Top Postcodes ♦ Top Postcodes 18 Chart depicts CommBank card holders by residential suburb and postcode for 12 months data: ♦ Percentage of unique CommBank card holders who transacted at the merchant terminal ♦ Percentage of annual merchant terminal transaction volume ♦ Percentage of annual merchant terminal transaction value ♦ Average of each transaction value Chart Definitions State and Catchment Overview Top Catchments Business Profile ♦ Chart depicts the top five catchment areas where businesses trade as a percentage of total businesses in the state ♦ The chart distinguishes the split of businesses with greater or less than $2 million dollars annual sales Top Industries Business Profile ♦ Chart depicts the top five industries in the state as a percentage of total business industries in the state i.e. ~25% of all NSW businesses operate in Property and Business Services ♦ The chart distinguishes the split of industries with greater or less than $2 million annual sales Unemployment Trend Financial Health Indicators ♦ Chart depicts the state unemployment and the catchment area unemployment over six months Estimated Sales and Transaction Volume for Merchants in this Catchment Financial Health Indicators 19 ♦ Chart depicts estimated sales and transaction volume (in millions) for merchants in this catchment over six months Chart Definitions Catchment Key Statistics Estimated Population by Age Resident Population Profile ♦ Chart depicts percentage total catchment population by age group ♦ The percentage of catchment population by age group is compared to the national average benchmark of people in the same state and region type (metro, major regional or regional) Household Income Distribution and Dwelling Value Resident Population Profile ♦ ‘Household Income Distribution compared to benchmark’ Chart (left) depicts the percentage change of household income distribution (low, average, high, very high) compared to national average benchmark. ♦ ‘Cultural Distribution compared to benchmark’ Chart (right) depicts the percentage change of cultural groups compared to the national average benchmark. Age, Income and Gender Distribution Working Population Profile ♦ ‘Age and Income’ Chart (left) depicts combinations of age band (Young/Older) and income classification (Low, Average, High) as percentages of the total catchment population compared with the national average. ♦ ‘Gender Distribution’ Chart (right) depicts the percentage distribution of gender in the catchment area compared with the national average Working Population by Occupation Working Population Profile 20 ♦ ‘Working Population by Occupation’ Chart (top) depicts the percentage distribution of the working population by occupation within the catchment area compared with the national average ♦ The bottom chart depicts the percentage of working population by industry