1
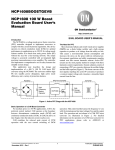
NCP1631PFCGEVB
Interleaved PFC Stage
Driven by the NCP1631
Evaluation Board User's
Manual
http://onsemi.com
Interleaved PFC is an emerging solution that becomes
particularly popular in applications where a strict form
factor has to be met like for instance, in slim notebook
adapters or in LCD TVs. Interleaving consists in paralleling
two “small” stages in lieu of a bigger one, which may be
more difficult to design. Practically, two 150−W PFC stages
are combined to form our 300−W PFC pre−regulator. This
approach has several merits like the ease of implementation,
the use of more but smaller components or a better heat
distribution.
Also, Interleaving extends the power range of Critical
Conduction Mode (CrM) that is an efficient and
cost−effective technique (no need for low trr diodes). Even,
as reported by NCP1631EVB/D [3], when associated to the
Frequency Clamped Critical conduction Mode (FCCrM),
this technique yields particularly high efficiency levels
(about 95% over a large load range at 90 Vrms in a 300−W
application).
Furthermore, if the two stages are operated out−of−phase,
the current ripple is significantly reduced. In particular, the
input current looks like that of a Continuous Conduction
Mode (CCM) one and the rms current within the bulk
capacitor is dramatically reduced. These characteristics are
detailed in application note AND8355 [1].
This paper gives the main equations that are useful to
design an interleaved PFC stage driven by the NCP1631.
The process is illustrated by the following 300−W, universal
mains application:
− Maximum output power: 300 W
EVAL BOARD USER’S MANUAL
Figure 1. Evaluation Board Photo
− Input voltage range: from 90 Vrms to 265 Vrms
− Regulation output voltage: 390 V
The computations relevant to the power components are
based on the assumption that the current is perfectly shared
between the two branches. This assumption is valid if the
two coil inductances properly match [2].
Vin
Vout
The “pfcOK” signal
enables the downstream converter
when the PFC is
ready
Rbo1
Rovp1
Vaux2
Rzcd2
1
Rfb1
Rfb2
OVPin
Ac line
Rbo2
Rovp2
EMI
F ilte r
Cbo2
Cin
Cosc
Cp
Rz
2
3
Rt
4
5
RFF
6
7
8
Cz
OVPin
Iin
L2
Icoil1
16
15
14
13
12
11
10
9
Rzcd1
pfcOK
Vcc
Rocp
Rsense
L1
Vaux2
D1
Icoil2
Vout
D2
M1
LOAD
M2
Cbulk
Figure 2. Generic Application Schematic
© Semiconductor Components Industries, LLC, 2012
November, 2012 − Rev. 2
1
Publication Order Number:
EVBUM2163/D
NCP1631PFCGEVB
Introduction
The NCP1631 integrates a dual MOSFET driver for
interleaved, 2−phase PFC applications. It drives the two
branches in so−called Frequency Clamped Critical
conduction Mode (FCCrM) where each phase operates in
Critical conduction Mode (CrM) in the most stressful
conditions and in Discontinuous Conduction Mode (DCM)
otherwise, acting as a CrM controller with a frequency
clamp (given by the oscillator). According to the conditions,
the PFC stage actually jumps from DCM to CrM (and vice
versa) with no discontinuity in operation and without
degradation of the current shape.
Furthermore, the circuit incorporates protection features
for a rugged operation together with some special circuitry
to lower the power consumed by the PFC stage in no−load
conditions. More generally, the NCP1631 is ideal in systems
where cost−effectiveness, reliability, low stand−by power
and high power factor are the key parameters:
A “pfcOK” Signal.
The circuit detects when the PFC stage is in steady state or
if on the contrary, it is in a start−up or fault condition. In the
first case, the “pfcOK” pin (pin15) is in high state and low
otherwise. This signal is to disable the downstream
converter unless the bulk capacitor is charged and no fault
is detected. Finally, the downstream converter can be
optimally designed for the narrow voltage provided by the
PFC stage in normal operation.
Safety Protections.
The NCP1631 permanently monitors the input and output
voltages, the input current and the die temperature to protect
the system from possible over−stresses and make the PFC
stage extremely robust and reliable. In addition to the
aforementioned OVP protection, one can list:
Maximum Current Limit: the circuit permanently
senses the total input current and prevents it
from exceeding the preset current limit, still
maintaining the out−of−phase operation.
In−rush Detection: the NCP1631 prevents the power
switches turn on for the large in−rush currents
sequence that occurs during the start−up phase.
Under−Voltage Protection: this feature is mainly to
prevent operation in case of a failure in the
OVP monitoring network (e.g., bad
connection).
Brown−Out Detection: the circuit stops operating if
the line magnitude is too low to protect the PFC
stage from the excessive stress that could
damage it in such conditions.
Thermal Shutdown: the circuit stops pulsing when
its junction temperature exceeds 150°C
typically and resumes operation once it drops
below about 100°C (50°C hysteresis).
Fully Stable FCCrM and Out−Of−Phase Operation.
Unlike master/slave controllers, the NCP1631 utilizes an
interactive−phase approach where the two branches operate
independently. Hence, the two phases necessarily operate in
FCCrM, preventing risks of undesired dead−times or
continuous conduction mode sequences. In addition, the
circuit makes them interact so that they run out−of−phase.
The NCP1631 unique interleaving technique substantially
maintains the wished 180° phase shift between the 2
branches, in all conditions including start−up, fault or
transient sequences.
Optimized Efficiency Over the Full Power Range.
The NCP1631 optimizes the efficiency of your PFC stage in
the whole line/load range. Its clamp frequency is a major
contributor at nominal load. For medium and light load, the
clamp frequency linearly decays as a function of the power
to maintain high efficiency levels even in very light load.
The power threshold under which frequency reduces is
programmed by the resistor placed between pin 6 and
ground. To prevent any risk of regulation loss at no load, the
circuit further skips cycles when the error amplifier reaches
its low clamp level.
Power Components
Defining the oscillator frequency of the NCP1631 is a
prerequisite step before dimensioning the PFC stage. In the
presented application, we choose to clamp the switching
frequency at around 120 kHz in each phase, because this
frequency is generally a good trade−off when considering
the following aspects:
• A high switching frequency reduces the size of the
storage elements. In particular, it is well known that the
higher the switching frequency, the lower the inductor
core. That is why, one should set the switching
frequency as high as possible,
• On the other hand, increasing the switching frequency
has two major drawbacks:
1. The switching rate increasing, the associated
losses grow up. In addition, all parasitic capacitors
charge at a higher frequency and generate more
heat...
2. EMI filtering is tougher: the switching generates
high EMI rays at the switching frequency and
Fast Line / Load Transient Compensation.
Characterized by the low bandwidth of their regulation loop,
PFC stages exhibit large over and under−shoots when abrupt
load or line transients occur (e.g. at start−up). The NCP1631
dramatically narrows the output voltage range. First, the
controller dedicates one pin to set an accurate Over−Voltage
Protection level and interrupts the power delivery as long as
the output voltage exceeds this threshold. Also, the
NCP1631 dynamic response enhancer drastically
speeds−up the regulation loop when the output voltage is
4.5% below its desired level. As a matter of fact, a PFC stage
provides the downstream converter with a very narrow
voltage range.
http://onsemi.com
2
NCP1631PFCGEVB
close harmonic levels. Most power supplies have
to meet the CISPR22 standard that applies to
frequencies above 150 kHz. That is why SMPS
designers often select FSW = 130 kHz so that the
fundamental keeps below 150 kHz and then out of
the regulation scope. Often, 65 kHz is also chosen
to not to have to damp harmonic 2 too.
The oscillator frequency is the double of the clamp
frequency in each phase. The oscillator frequency is then set
to approximately 240 kHz .
Basically, Two 150−W FCCrM PFC stages are to be
designed. This chapter will not detail the dimensioning of
the power components in very deep details since their
computation is traditional. However, the main selection
criteria and equations are reminded.
1. Inductor Selection
In CrM and in FCCrM (assuming CrM operation at low
line, full load), the (maximum) peak and rms inductor
currents within one branch are:
• Vout,nom is the nominal output voltage (regulation level)
(Pin,avg) max
Finally, a 150 mH / 6 Apk / 2.5 Arms coil was selected.
2. Power Semiconductors
The bridge diode should be selected based on the peak
current rating and the power dissipation given by:
2 Ǹ2 @
ǒIL(pk)Ǔ
MAX
+
ǒ
Ǔ
2
ǒVin(rms)Ǔ
In our application,
• (Vin,rms)LL = 90 V
• Vout,nom = 390 V
• (Pin,avg)max = 325 W (assuming a 92 % global efficiency
that is a conservative value that offers some margin)
As aforementioned, the frequency clamp for the two
branches is set to about 120 kHz. The inductor must be large
enough so that Critical conduction Mode is obtained at low
line, full load where the conditions are the most severe.
This constraint leads to the equation below (where
fsw(max) is the 120−kHz clamp frequency):
Lw
Lw
Ǹ2 @ 325
^ 5.1 A
90
LL
MAX
+
ǒIL(pk)Ǔ
Ǹ6
MAX
^ 5.1 + 2.1 A
Ǹ6
(eq. 2)
Ǔ
(Pin,avg) max
I M(rms) + 2 @
Ǹ3
2
(V in(rms)) LL
@
Ǹ
1*
8 @ Ǹ2 @ (V in(rms)) LL
3 @ p @ V out,nom
Using a 600−V, 0.4−W FET (SPP11N60), will give
conduction losses of (assuming that RDS(on) increases by
80% due to temperature effects):
DRV
325 @ 390 @ 120 @ 10 3
+
325 @
Ǹ3 @ 90
^ 139 mH
R2
Ǹ1 * 38 @@ pǸ2@@39090 ^ 1.8 A
D2
R1
1N4148
(eq. 7)
2
90 2 @ ǒ390 * (Ǹ2 @ 90)Ǔ
(eq. 4)
Assuming a 1−V forward voltage per diode (Vf = 1 V), the
bridge approximately dissipates 6.5 W.
For each branch, the MOSFET is selected based on the
peak voltage stress (Vout(max)+margin) and on the rms
current flowing through it (IM(rms)):
Where:
• (Vin,rms)LL is the lowest line rms voltage
• (Pin,avg)max is the maximum level of the input average
power
ǒ
(eq. 3)
(eq. 5)
(P in,avg) max
4 Ǹ2
325
P bridge + p @ V f @
^ 1.8 @ V f @
^ 6.5 @ V f
90
(V in(rms)) LL
And:
ǒIL(rms)Ǔ
(P in,avg) max @ V out,nom @ f sw(max)
In our application, this leads to:
(eq. 1)
+
(V in,rms) LL 2 @ (V out * Ǹ2 @ (V in,rms) LL)
2
P cond + I M(rms) @ R DS(on) + 1.8 @ 0.4 @ 1.8 ^ 2.3 W
Q1
This computation is valid for one branch. As there are two
phases to consider, the total MOSFETs conduction losses are
actually twice (4.6 W).
Switching losses are hard to predict. They are not
computed here. As a rule of the thumb, we generally reserve
a loss budget equal to that of the conduction ones. One can
anyway note that the NCP1631 limits this source of
dissipation by clamping the switching frequency (that can
never exceed the oscillator one – 120 kHz in each branch in
our case). To further improve the efficiency, the MOSFET
opening can be accelerated using the schematic of Figure 3,
where the Q1 small npn transistor (TO92) amplifies the
MOSFET turn off gate current.
(eq. 6)
M1
R10
10k
Figure 3. Q1 Speeds Up the MOSFET Turn Off
The input bridge that rectifies the line voltage and the
MOSFETs of the two branches share the same heat−sink.
Based on above computations, the total power to be
dissipated is in the range of: (6.5 + 4.6 + 4.6 ^ 16 W). A
2.9−°C/W heat−sink (ref. 437479 from AAVID
THERMALLOY) is implemented. It limits the rise of the
case temperature (of the input bridge and MOSFETs applied
to it) to about 50° compared to the ambient temperature.
http://onsemi.com
3
NCP1631PFCGEVB
Interleaved PFC requires two boost diodes (one per
branch). No reverse recovery issues to worry about. Simply,
they must meet the correct voltage rating (Vout(max) +
margin) and exhibit a low forward voltage drop. Supposing
a perfect current sharing, the average diode current is the
half of the load one:
ǒ
ǒ
Ǔ
Finally the following equation expresses the hold−up
time:
t hold−up +
Ǔ
So, the losses are about
Ǔ
I LOAD @ V f
2
f sw(max)1 + f sw(max)2 + f sw(max) +
(f sw(max)) nom +
Ǹ
Ǔ
f OSC(nom)
2
^ 26 @ 10
C pin4
−6
−6
(f sw(max)) nom ^ 26 @ 10 −9 ^ 118 kHz
220 @ 10
(eq. 12)
(eq. 13)
Frequency Fold−back:
The NCP1631 features the frequency fold−back function
to improve the light load efficiency. Practically, the
oscillator charge and discharge currents are not constant but
proportional to power when the load drops below a
programmable level, as shown by Figure 4.
(eq. 9)
ǒ
(eq. 11)
For instance, a 220−pF capacitor leads to the following
clamp frequency:
The capacitor rms current is given by (assuming a
resistive load):
I C(rms) +
f OSC
2
Where:
• fsw(max)1 is the frequency clamp for the first branch of
the interleaved PFC and fsw(max)2, that of the second
one
• fsw(max)1 and fsw(max)2 being equal, fsw(max) stands
for the clamp frequency for any of the two phases
• fOSC is the oscillator frequency
In the absence of frequency foldback (heavy load in
general), the oscillator swings at its nominal frequency
fOSC(nom) and each branch operates with a nominal clamp
frequency (fsw(max))nom given by:
(eq. 8)
P out
16 @ Ǹ2 @ P out 2
*
V out,nom
9 @ p @ (V in(rms)) LL @ V out @ h 2
(eq. 10)
Oscillator Frequency Setting
The NCP1631 clamps the maximum frequency of the PFC
stage without power factor degradation. This feature
prevents the switching frequency from reaching excessive
levels at light load. As detailed in the NCP1631 data sheet,
the clamp frequency in each phase is actually half the
oscillator one.
Hence:
per diode, i.e., less than 500 mW per diode using MUR550
rectifiers. For each phase, the peak current seen by the diode
will be the same as the corresponding inductor peak current.
Two axial MUR550 are selected.
3. Bulk Capacitor Design
The output capacitor is generally designed considering
three factors:
1. The maximum permissible low frequency ripple of
the output voltage. The input current and voltage
being both sinusoidal, PFC stages deliver a
squared sinusoidal power that matches the load
power demand in average only. As a consequence,
the output voltage exhibits a low frequency ripple
(e.g., 100 Hz ripple in Europe or 120 Hz in USA)
that is inherent to the PFC function.
2. The rms magnitude of the current flowing through
the bulk capacitor. Based on this computation, one
must estimate the maximal permissible ESR not to
cause an excessive heating.
3. The hold−up time. It can be specified that the
power supply must provide the full power for a
short mains interruption that is the so called
hold−up time. The hold−up time is generally in the
range of 10 or 20 ms.
The output voltage ripple is given by:
P out
DV out(p−p) +
2p @ f line @ C bulk @ V out,nom
2 @ P out
Where Vout(min) is the minimal bulk voltage necessary to the
downstream converter to keep properly feeding the load.
The hold−time being not considered here, a 100−mF
capacitor was chosen to satisfy the other above conditions.
The peak−peak ripple is 25 V (±3% of Vout ) and the rms
current is 1.4 A.
I D(tot)
I
I D(tot)
I D(tot) (avg)
I LOADI LOADP out P out
P out
(avg)
(avg)
I D1(avg)
+ + I D2(avg)
++LOAD
++ +
+ + +
^ 0.39 A
2
2 2 2 @2 V out2
2 2 @ V out
2 @ V out
ǒ
C bulk @ (V out 2 * V out(min) 2)
2
http://onsemi.com
4
fOSC (kHz)
NCP1631PFCGEVB
150
140
130
120
110
100
90
80
70
60
50
40
30
20
10
0
fOSC(nom) = 118 kHz
0
0.1
0.2
0.3
0.4
0.5
0.6
0.7
0.8
0.9
1
Vregul (V)
Figure 4. Frequency Fold−back
Programming the Power Threshold for Frequency
Foldback:
adjustment” section) and is generally set 25% or 30%
higher than the application maximum power to offer
some margin.
In our application, a 4.7−kW resistor is implemented on
pin 6 (RFF = 4.7 kW). Hence, the frequency folds back when
the input power drops below the following (Pin)FF threshold:
Pin6 of the NCP1631 pins out the signal VREGUL that is
proportional to the power that is delivered. The resistor
(RFF ) placed between pin 6 and ground, adjusts the pin6
current (IFF ) as follows:
I FF +
V REGUL
R FF
If
ǒ
V REGUL
v 105 mA
R FF
Ǔ
(P in) FF + 4.7 @ 10 @ (P in) HL ^ 30% @ (P in) HL (eq. 15)
15810
3
In our application, the maximum input power is 325 W. It
is recommended to design the PFC stage so that it can
produce at least 25% more than the maximum power it
targets. In practice, ((Pin)HL ^ 494 W) has been selected. As
a matter of fact, the frequency folds back when the input
power goes below (30% x (Pin)HL) that is about 147 W.
I FF + 105 mA otherwise
As a matter of fact, the clamp frequency is also an
increasing function of VREGUL until it reaches a maximum
value for (IOSC = 105 mA):
If ǒV REGUL w R FF @ 105 mAǓ
f OSC + f OSC(nom)
f OSC +
V REGUL
R FF @ 105 m
@ f OSC(nom)
Forcing a Minimum Frequency
If ǒV REGUL v R FF @ 105 mAǓ
The NCP1631 reduces the frequency down to virtually
zero. As detailed in the data sheet and shown by the
simplified oscillator representation of Figure 5, the circuit
lowers the frequency by diminishing the IFF current. When
this current is near zero, a 35−mA current source is still
available for charging the oscillator capacitor but the
discharge current is near zero leading to an extremely long
discharge time and a very low frequency.
It is wise to prevent the frequency from dropping below
16 kHz to avoid audible noise issues. A simple means
consists of placing a resistor (RFmin ) between the “OSC” pin
and ground to force a minimum oscillator discharge current
(see Figure 5).
VREGUL varies between 0 and 1.66 V. Since the power that
can be delivered is proportional to VREGUL, the power
threshold for frequency fold−back is:
(P in) FF +
R FF @ 105 mA
R FF
(eq. 14)
@ (P in) HL ^
@ (P in) HL
15810
1.66 V
Where:
• (Pin)FF is the input power below which the frequency
reduces
• (Pin)HL is the power highest level that can virtually be
delivered by the PFC stage. This value results from the
timing resistor selection (see the “maximum power
http://onsemi.com
5
NCP1631PFCGEVB
35 μA
IFF
CLK1
CLK2
OSC
RFmin
Oscillator
Control
Block
(pin4)
COSC
IFF
DRV1
DRV2
Figure 5. Adjustment of the Minimum Frequency
Assuming that the internal IFF current is zero, the
oscillator period can be computed considering the 35−mA
charge current, the permanent leakage current generated by
ǒfsw(max)Ǔ
min
+
f OSC(min)
2
RFmin and the 1 V swing across COSC (swing when the
oscillator is clamping the switching frequency).
Doing this calculation, we can deduce the minimum
clamp frequency (for each branch) forced by RFmin :
+
2 @ R Fmin @ C OSC @
ǒ
1
ǓǓ
ǒ
Brown−out Circuitry
The brown−out terminal (pin7) typically receives a
portion of the PFC input voltage (VIN). As during the PFC
operation, VIN is a rectified sinusoid, a capacitor must
integrate the ac line ripple so that a portion of the (VIN)
average value is applied to the brown−out pin.
In our application, (RFmin = 270 kW) forces a minimum
frequency of about 20 kHz.
Remark: Ground pin6 to inhibit the frequency foldback. If
pin6 is grounded (accidently or not), the circuit operates
with the nominal clamp frequency over the whole load
range.
Fe e d−forward
circuitry
Rt
Curre nt
Mirror
IBO
Vbo (BO pin v oltage )
Rt
Vbo
Vin
IBO
IBO charges the timing
capacitor for both phases
Ac line
EMI
Filte r
Rbo1
Cin
BO
Vbo
1V
OPAM P
BO_NOK
LBO
Cbo
Rcs
Rbo2
S
R
Vdd
7 mA
(eq. 16)
R Fmin*114000
0.22 ) In
R Fmin*143000
Q
Tdelay
100−ms
de lay
re se t
re se t
100−ms
de lay
re se t
Circuitry for
brown−out de te ction
Figure 6. Brown−out Block
http://onsemi.com
6
NCP1631PFCGEVB
As sketched by Figure 6, the brown−out block has two functions:
1. Feed−forward: The brown−out pin voltage is buffered to generate an internal current IBO proportional to the input
voltage average value in conjunction with the pin3 resistor (Rt ). This current is squared to form the current that
charges the internal timing capacitors that control the on−time in the two branches. As a matter of fact, the on−time is
inversely proportional to the square of the line magnitude. This feed−forward feature makes the transfer function and
the power delivery independent of the ac line level.
2. Detection of the line magnitude being too low. A 7−mA current source lowers the BO pin voltage when a brown−out
condition is detected, for hysteresis purpose as required by this function. In traditional applications, the sensed
voltage dramatically varies depending on the PFC stage state:
− Before operation, the PFC stage is off and the input bridge acts as a peak detector (refer to Figure 7). As a
consequence, the input voltage is approximately flat and nearly equates the ac line amplitude:
V IN + Ǹ2 @ V in,rms
where Vin,rms is the rms voltage of the line. Hence, the voltage applied to pin7 is:
V pin7 + Ǹ2 @ V in,rms @
R bo2
R bo1 ) R bo2
− After the PFC stage has started operation, the input voltage becomes a rectified sinusoid and the voltage applied to
pin7 is:
V pin7 +
2 @ Ǹ2 @ V in,rms
R bo2
p
R bo1 ) R bo2
i.e., about 64% of the previous value.
Therefore, in traditional applications, the same line magnitude leads to a BO pin voltage that is 36% lower when the PFC
is working. That is why a large hysteresis is required.
ǸVt
2 @@
sin @ sin(wt)
V rm
2@
s
in , in,rms
V in(t)
Vt in
( )
Ǹ22 @@VV
in,rms
,
in
rm s
Figure 7. Typical Input Voltage of a PFC Stage
Computing Cbo, Rbo1 and Rbo2 of Figure 6:
1. Define the line levels at which the circuit should detect a brown−out and recover operation:
Our application being specified to operate from 90 Vrms, it can make sense to select the following thresholds:
• The system starts operating when the line voltage is above (Vin,rms)boH = 81 V (90% of 90 V)
• The system detects a fault when the line voltage goes below (Vin,rms)boL = 72 V (80% of 90 V)
1. Define the average input voltage when Vpin7 (BO pin voltage) crosses the BO thresholds (Vpin7 rising and falling):
When the line voltage is below the BO threshold, the internal current source (IHYST = 7 mA, typically) is activated to offer
some hysteresis and the circuit recovers operation when:
R bo2
R bo1 ) R bo2
ǒ
@ V in,avg
Ǔ
boH
*
ǒ
R bo1 @ R bo2
R bo1 ) R bo2
Ǔ
@ I HYST
(eq. 17)
+ V bo(th)
Where (Vin,avg)boH is the average input voltage above which the circuit turns on and Vbo(th) is the BO internal threshold (1 V
typically).
Hence:
ǒVin,avgǓ
boH
+
ǒ
R bo1 ) R bo2
R bo2
Ǔ
(eq. 18)
@ V bo(th) ) ǒR bo1 @ I HYSTǓ
http://onsemi.com
7
NCP1631PFCGEVB
As long as the line is above the BO threshold, the internal current source (IHYST = 7 mA typically) is off and the BO pin voltage
is:
ǒ
Ǔ
f BO
3 @ f line
V pin7 + k BO @ V in,avg @ 1 *
(eq. 19)
Where:
• (Vin,avg) is the average input voltage
• fline is the line frequency
• fBO is the sensing network pole frequency
ǒ
Ǔ
R bo1 ) R bo2
2p @ R bo1 @ R bo2 @ C bo
f BO +
• kBO is scale down factor of the BO sensing network
ǒ
The term
k BO +
ǒ
1*
Ǔ
R bo2
R bo1 ) R bo2
Ǔ
f BO
3 @ f line
of Equation 19 enables to take into account the BO pin voltage ripple (first harmonic approximation).
A brown−out fault is detected when the BO pin voltage goes below Vbo(th) (BO internal threshold that is 1 V typically).
Hence, the BO protection triggers when the average voltage goes below the (Vin,avg)boL level expressed by the following
equation:
ǒVin,avgǓ
boL
+
V BO(th)
ǒ
Ǔ
(eq. 20)
f
k BO @ 1 * BO
3@fline
Where (Vin,avg)boL is the average input voltage below which the circuit turns off, fBO is the sensing network pole frequency
ǒ
f BO +
Ǔ
R bo1 ) R bo2
2p @ R bo1 @ R bo2 @ C bo
and fline is the line frequency.
2. Calculation
From Equation 20, we can deduce the following expression of the brown−out scale down factor:
K BO +
R bo2
+
R bo1 ) R bo2
V BO(th)
ǒ
(V in,avg) boL @ 1 *
Substitution of Equation 21 into Equation 18 leads to:
(V in,avg) boH +
ǒ
ǒ
(V in,avg) boL @ 1 *
f BO
ǓǓ
3 @ f line
Ǔ
fBO
3@f line
(eq. 22)
) (R bo1 @ I HYST)
We can then deduce the following expression of Rbo1:
(V in,avg) boH *
ǒ
(V in,avg) boL @
R bo1 +
ǒ
1*
(eq. 21)
ǓǓ
f BO
3@fline
(eq. 23)
I HYST
Re−using the above Rbo1 expression, one can deduce Rbo2 from Equation 21:
R bo2 +
ǒ
R bo1
(Vin,avg)boL
V BO(th)
ǒ
ǓǓ
f
@ 1 * BO
3@fline
http://onsemi.com
8
(eq. 24)
*1
NCP1631PFCGEVB
If as a rule of the thumb, we will assume that
ǒf
BO
+
Ǔ
f line
10
that is 6 Hz in the case of a 60−Hz line, we obtain:
(V in,avg) boH
R bo1 +
R bo2 +
ȡ
*ȧ(V
Ȣ
f
ȣȣ
ȧ
ȧ
@ 1 * 10 ȧȧ
ȧ 3@f
ȧ
ȤȤ
line
in,avg) boL
line
^
I HYST
ǒ
R bo1
(V in,avg)boL
VBO(th)
ǓǓ
ǒ
f
@ 1 * BO
3@f line
^
*1
(V in,avg) boH * ǒ0.967 @ (V in,avg) boLǓ
I HYST
R bo1
ǒ
0.967 @
Ǔ
(Vin,avg) boL
VBO(th)
(eq. 25)
(eq. 26)
*1
As an example, we will consider the traditional PFC stage where the average value of the input voltage is 36% lower when
the circuit operates (as illustrated by Figure 7).
So if we select:
• The system starts operating when the line voltage is above
(V in,rms) boH + 81 V
• The system detects a fault when the line voltage goes below
(V in,rms) boL + 72 V
The corresponding average input voltage thresholds are:
(V in,avg) boH + Ǹ2 @ (V in,rms) boH + Ǹ2 @ 81
(eq. 27)
And:
2 Ǹ2
2 Ǹ2
(V in,avg) boL + p @ (V in,rms) boL + p @ 72 (eq. 28)
We have then to solve:
ǒǸ2 @ 81Ǔ *
R bo1 ^
R bo2 ^
Ǔ
2Ǹ2
0.967 @ p @ 72
7 @ 10 −6
(eq. 29)
^ 7410 kW
7410 @ 10 3
^ 120 kW
2Ǹ2
0.967@ p @72
*1
1
ȡ
ȧ
Ȣ
C bo +
ǒ
ȣ
ȧ
Ȥ
R bo1 ) R bo2
f
2p @ R bo1 @ R bo2 @ line
10
^
(eq. 30)
7410 k ) 120 k
2p @ 7410 k @ 120 k @ 60
10
^ 225 nF
(eq. 31)
In practice, four 1.8−MW resistors are placed in series for Rbo1 (for a global 7.2−MW resistor) and we use a 120−kW resistor
for Rbo2 and 220−nF capacitor for Cbo .
One should note that the NCP1631 brown−out circuitry incorporates a 50−ms blanking delay to help meet hold−up times
requirement (see data sheet).
Maximum Power Adjustment
The instantaneous line current is the averaged value (over the switching frequency) of the total current absorbed by the two
branches of the PFC stage. It is given by the following formula:
I in(t) +
(R t) 2 @ V REGUL
V in(t)
@
L
26.9 @ 10 12 @ k BO 2 @ V in,rms 2
http://onsemi.com
9
(eq. 32)
NCP1631PFCGEVB
Where:
•
ǒ
(R t) 2 @ V REGUL
26.9 @ 10 12 @ k BO 2 @ V in,rms 2
Ǔ
is the expression of the on−time in each branch
(VREGUL ) is an internal signal linearly dependent of the output of the regulation block (VCONTROL). (VREGUL ) varies
between 0 and 1.66 V.
Iin(t) and Vin(t) are the instantaneous line current and voltage respectively.
•
• Vin,rms is the line rms voltage
• L is the coil inductance
• kBO is scale down factor of the BO sensing network
ǒ
k BO +
Ǔ
R bo2
R bo1 ) R bo2
Multiplying Iin by Vin, one can deduce the instantaneous power:
P in(t) +
(R t) 2 @ V REGUL @ V in 2(t)
26.9 @ 10 12 @ L @ k BO 2 @ V in,rms 2
(eq. 33)
And averaging the instantaneous power over the line period gives the following expression of the mean input power:
P in,avg +
(R t) 2 @ V REGUL
26.9 @ 10 12 @ L @ k BO 2
(eq. 34)
As a result of the feed−forward, the delivered power does not depend on the line magnitude but is the only function of the
coil inductance, of the input voltage sensing network (used and dimensioned for the brown−out detection) and of Rt capacitor,
that is, the timing resistor that is applied to pin3.
Since VREGUL is clamped to 1.66 V, the maximum power ((Pin)HL) that can be virtually delivered by the PFC stage is:
(P in) HL +
(R t) 2 @ 1.66
(R t) 2
^
12
2
26.9 @ 10 @ L @ k BO
16.2 @ 10 12 @ L @ k BO 2
(eq. 35)
Hence:
R t ^ 4025 @ 10 3 @ k BO @ ǸL @ (P in) HL
(eq. 36)
For the sake of a welcome margin, ((Pin)HL) should be selected about 25% higher than the expected maximal input power
that is: (125% x 325 W ^ 400 W) in the application of interest.
In our case,
• L = 150 mH
• Since Rbo1 = 7200 kW and Rbo2 = 120 kW,
ǒ
k BO +
R bo2
+ 1
61
R bo1 ) R bo2
Ǔ
Hence:
R t ^ 4025 @ 10 3 @ 1 @ Ǹ150 @ 10 −6 @ 400 ^ 16 @ 2 kW
61
(eq. 37)
A 18−kW resistor is selected that leads to
(P in) HL +
(18 @ 10 3) 2 @ 61 2
^ 496 W
16.2 @ 10 12 @ 150 @ 10 −6
Feed−back Network
The NCP1631 embeds a trans−conductance error amplifier that typically features a 200−mS trans−conductance gain and a
±20−mA maximum capability (see Figure 8). The output voltage of the PFC stage is externally scaled down by a resistors
divider and monitored by the feed−back input (pin2). The bias current is minimized (less than 500 nA) to allow the use of a
high impedance feed−back network. The output of the error amplifier is pinned out for external loop compensation (pin5).
http://onsemi.com
10
NCP1631PFCGEVB
Computation of the Feed−back / Regulation External Components
A resistor divider consisting of Rfb1 and Rfb2 of Figure 8 must provide pin2 with a voltage proportional to the PFC output
voltage so that Vpin2 equates the internal reference voltage (VREF = 2.5 V) when the PFC output voltage is nominal. In other
words:
R fb2
@ V out,nom + V REF
R fb1 ) R fb2
(eq. 38)
V out,nom
R fb1
+
*1
R fb2
V REF
(eq. 39)
Or:
Another constraint on the feed−back resistors is the power it dissipates. Rfb1 and Rfb2 being biased by the PFC output high
voltage (in the range of 390 V typically), they can easily consume several hundreds of mW if their resistance is low. Targeting
a bias current in the range of 100 mA generally gives a good trade−off between losses and noise immunity.
This criterion leads to:
R fb2 +
V REF
+ 25 kW
100 mA
In practice, (Rfb2 = 27 kW) was selected for our application.
Following Equation 39, Rfb1 is given by:
R fb1 + R fb2 @
ǒ
(eq. 40)
Ǔ
V out,nom
*1
V REF
(eq. 41)
We target a 390−V regulation level, hence:
ǒ
Ǔ
R fb1 + 27 kW @ 390 * 1 + 4185 kW
2.5
(eq. 42)
Like for the input voltage sensing network, several resistors should be placed in series instead of a single Rfb1 resistor. In
our application, we choose a (1800 kW + 1800 kW + 560 kW) network. This selection together with (Rfb2 = 27 kW) leads to:
V out,nom +
R fb1 ) R fb2
1800 k ) 1800 k ) 560 k ) 27 k
@ V REF +
@ 2.5 V ^ 388 V
R fb2
27 k
(eq. 43)
Compensation:
The NCP1631 uses the brown−out input voltage to provide some feed−forward. This allows the small−signal transfer
function of PFC stage to be independent of the ac line amplitude. More specifically, the bulk capacitor ESR being neglected:
^
V out
^
V REGUL
+
(R t) 2 @ R out
@
53.8 @ 10 12 @ L @ k BO 2 @ V out,nom
1
R out@Cbulk
1) s@
2
ǒ
Ǔ
(eq. 44)
Where:
• Cbulk is the bulk capacitor.
•
•
•
•
•
Rout is the load equivalent resistance.
Rt is the pin3 external capacitor.
L is the PFC coil inductance.
KBO is the brown−out scale−down factor.
Vout,nom is the regulation level of the PFC output.
However, PFC stages must exhibit a very low regulation bandwidth, in the range of or lower than 20 Hz to yield high power
factor ratios. Hence, sharp variations of the load generally result in excessive over and under−shoots. The NCP1631 limits
over−shoots by the Over−Voltage Protection (see OVP section). To contain under−shoots, an internal comparator monitors the
feed−back (Vpin2) and when Vpin2 is lower than 95.5% of its nominal value, it connects a 220−mA current source to speed−up
the charge of the compensation capacitors. Finally, it is like if the comparator multiplied the error amplifier gain by about 10
(Note 1).
The implementation of this dynamic response enhancer together with the accurate and programmable over−voltage
protection, guarantees a reduced spread of the output voltage in all conditions included sharp line / load transients.
http://onsemi.com
11
NCP1631PFCGEVB
Hence, in most applications, it can be sufficient to place a low frequency pole that drastically limits the bandwidth. However,
it is recommended to implement a type2 compensation as represented by the following figure:
Vout
Rfb1
FB
(Pin2)
Rfb2
2R
Vcontrol
Cz
Rz
GEA = 200 mS
+
OTA
+
VREF
2.5 V
R
(Pin5)
Cp
VREGUL
Figure 8. Regulation Trans−conductance Error Amplifier, Feed−back and Compensation Network
1. The circuit disables this capability (dynamic response enhancer) until the PFC stage output voltage has reached its target level (that is when
the “pfcOK” signal of the block diagram, is high). This is because, at the beginning of operation, the pin5 compensation network must charge
slowly and gradually for a soft start−up.
The output to control transfer function brought by the type−2 compensator is:
^
V control
^
V out
Where
1 ) sR zC z
+
ǒ
sR o(C z ) C p) 1 ) sR z
R0 +
V out,nom
V ref @ G EA
Ǔ
(eq. 45)
C z@Cp
C z)Cp
,
GEA being the gain of the trans−conductance error amplifier (OTA), Vout,nom , the output nominal voltage (Vout regulation level)
and VREF, the OTA 2.5−V voltage reference.
Actually, The NCP1631 PWM section does not directly use Vcontrol but VREGUL . Taking into the (5/9) resistors divider that
links Vcontrol and VREGUL , it comes:
^
V REGUL
^
V out
+
1 ) sR zC z
ǒ
Ǔ
Cz@Cp
9@Ro
s
@ (C z ) C p) 1 ) sR z
5
Cz)Cp
(eq. 46)
Hence, we have:
1)
^
V REGUL
^
V out
+
ǒ
s
2p@fz
Where:
• fz is the frequency of the compensator zero:
fz +
1
2p @ R z @ C z
• fp1 is the frequency of the compensator high frequency pole:
1
f p1 +
2p @ R z @
ǒ
Cp@Cz
Cp)Cz
Ǔ
• fp0 is the frequency of the origin pole:
f p0 +
Ǔ
s
1) s
2p@fp0
2p@fp1
5
18p @ R 0 @ ǒC p ) C zǓ
http://onsemi.com
12
(eq. 47)
NCP1631PFCGEVB
•
R0 +
V out,nom
V ref @ G EA
Place the zero and the high frequency pole
We can obtain a 60° phase boost and hence, a 60° phase margin by placing the compensation zero at (fc/4) and the high
frequency pole at (4 x fc), where fc is the selected crossover frequency.
From this, it comes that:
f p1 + 4 2 @ f z
(eq. 48)
Substitution of the fp1 and fz expressions into Equation 48 leads to:
Cp @ Cz
C
+ z
16
Cp ) Cz
(eq. 49)
C z + 15 @ C p
(eq. 50)
Hence:
Place the pole at the origin to have the proper bandwidth:
Equation 44 instructs that the static gain of the PFC boost is:
Go +
53.8 @
(R t) 2 @ R out
@ L @ k BO 2 @ V out,nom
10 12
(eq. 51)
If fc is the desired crossover frequency, the pole at the origin must be placed at the load that would set the boost converter
pole at the selected compensation zero. Hence:
ǒ Ǔ
−20 @ log
fc
f p0
ǒ |ǒ
+ −20 @ log G
R out +
4
p @ C bulk @ f c
ǓǓ
(eq. 52)
Or:
f p0 +
|R
G0
fc
out +
4
(eq. 53)
p@Cbulk@f c
This leads to:
f p0 +
fc
4@Rt 2
(eq. 54)
p @ 53.8 @ 10 12 @ L @ C bulk @ k BO 2 @ f c @ V out,nom
This expression simplifies as follows:
f p0 +
p @ 53.8 @ 10 12 @ L @ C bulk @ k BO 2 @ f c 2 @ V out,nom
Where:
kBO is scale down factor of the BO sensing network
ǒ
(eq. 55)
4 @ Rt 2
k BO +
Ǔ
R bo2
R bo1 ) R bo2
Replacing fp0 by its expression of Equation 55, it comes:
5
+
18p @ R 0 @ (C p ) C z)
18p @
ǒ
5
V out,nom
Ǔ
Vref@GEA
+
p @ 53.8 @ 10 12 @ L @ C bulk @ k BO 2 @ f c 2 @ V out,nom
4 @ Rt 2
@ (16 @ C p)
(eq. 56)
Replacing GEA and Vref by their typical value (200 mS and 2.5 V, respectively, we can write the following equation that gives
Cp :
Cp ^
7646.2 @
10 12
V ref @ G EA @ R t 2
@ L @ C bulk @ k BO 2 @ f c 2 @ (V out,nom) 2
Replacing Rt by this expression of Equation 36, the precedent equation simplifies:
Cp ^
1.06 @ 10 −6 @ (P in) HL
C bulk @ f c 2 @ (V out,nom) 2
http://onsemi.com
13
(eq. 58)
(eq. 57)
NCP1631PFCGEVB
Computing Rz:
The compensation zero being placed at (fc/4), it comes:
fz +
f
1
+ c
4
2p @ R z @ C z
(eq. 59)
Finally, from the above computations, we can deduce the following equations to design the compensation network.
Cp ^
1.06 @ 10 −6 @ (P in) HL
C bulk @ f c 2 @ (V out,nom) 2
(eq. 60)
C z + 15 @ C p
Rz +
(eq. 61)
2
p @ Cz @ fc
(eq. 62)
In our application,
Cp +
1.06 @ 10 −6 @ 497
^ 86 nF
100 @ 10 −6 @ 20 2 @ 390 2
(eq. 63)
Practically, we will use 68−nF capacitor that is a close standard value.
C z + 15 @ C p + 1020 nF
(eq. 64)
In practice, a 1−mF standard capacitor is selected.
Finally,
Rz +
2
^ 31.8 kW
p @ 1 @ 10 −6 @ 20
(eq. 65)
A 33−kW resistor is implemented.
The compensation is computed to have a phase margin in the range of 60°. The high frequency pole can be set at a lower
frequency. Practically, Cp can be increased up to 4 times the proposed value (without changing Rz and Cz ) to reduce the ripple
on the Vcontrol pin and further improve the THD. The crossover frequency is unchanged. This is just at the cost of a diminution
of the phase margin that can drop as low as 30°. More specifically:
ǒff Ǔ * arctanǒff
F m + arc tan
c
c
z
p1
Ǔ
(eq. 66)
Where:
• fz is the frequency of the compensator zero:
fz +
1
2p @ R z @ C z
• fp1 is the frequency of the compensator high frequency pole:
1
f p1 +
2p @ R z @
ǒ
Cp@Cz
Cp)Cz
Ǔ
Finally, a 150−nF capacitor is selected for Cp , leading to:
(f z ^ 5 Hz), (f p1 ^ 37 Hz), (F m ^ 76 o * 28 o + 48 o)
http://onsemi.com
14
NCP1631PFCGEVB
Current Sense Network
Ac line
VIN
Vaux2
IIN
Vaux1
EMI
Filter
Curre nt M irror
CIN
ICS
OCP
D1
9
ROCP
RCS
Negative
Clamp
M1
In − r u s h
Qzcd1
Qzcd2
(from ZCD block)
IZCD = 20 mA
DRV2
DRV1
CBULK
LOAD
ICS
ICS
L2
M2
ICS (ICS is proportional to the coil current)
CS
VOUT
L1
IOCP = 200 mA
ICS
D2
IIN
The CS block performs the over−current protection and detects the in−rush currents
Figure 9. Current Sense Block
The NCP1631 is designed to monitor a negative voltage proportional to the coil current. Practically, a current sense resistor
(RCS of Figure 9) is inserted in the return path to generate a negative voltage proportional to the total current absorbed by the
two branches. The circuit incorporates an operational amplifier that sources the current necessary to maintain the CS pin
voltage null (refer to Figure 9). By inserting a resistor ROCP between the CS pin and RCS , we adjust the pin9 current as follows:
* (R CS @ I in) ) (R OCP @ I pin9) + V pin9 ^ 0
(eq. 67)
Which leads to:
I CS + I pin9 +
R CS
I
R OCP in
(eq. 68)
Where Iin is the total current drawn by the two phases of the interleaved PFC stage.
The circuit compares ICS to an internal 210−mA current reference for a cycle by cycle current limitation. Hence, the
maximum coil current is:
I in,max +
R OCP
@ 210 mA
R CS
(eq. 69)
Finally, the ratio (ROCP / RCS ) sets the over−current limit in accordance with the following equation:
I in,max
R OCP
+
R CS
210 mA
(eq. 70)
As we have two external components to set the current limit (ROCP and RCS ), the current sense resistor can be optimized
to have the best trade−off between losses and noise immunity.
• Maximum current drawn by the two branches:
As shown in [1], the following equations give the total current that is absorbed by the interleaved PFC.
I in,max + 2 Ǹ2 @
(P in,avg) max
(V in,rms) LL
I in,max + 2 Ǹ2 @
ȡ
ȧ
Ȣ
@ 1*
(P in,avg) max
(V in,rms) LL
V out,nom
ǒ
4 @ V out,nom * ǒǸ2 @ (V in,rms) LL
@
ǒ
1*
V out,nom
4 @ Ǹ2 @ (V in,rms) LL
Ǔ
ȣ
ȧif (V
ǓǓȤ
if (V in,rms) LL w
Where:
• (Vin,rms )LL is the lowest level of the line rms voltage.
• (Pin,avg )max is the maximum level of the input power.
• Vout,nom is the nominal level of the output voltage (or the output regulation voltage)
In our case,
ǒ
(V in,rms) LL + 90 v
Ǔ
V out,nom
+ 390 ^ 138
2 Ǹ2
2 Ǹ2
http://onsemi.com
15
in,rms) LL
v
V out,nom
2 Ǹ2
V out,nom
2 Ǹ2
(eq. 71)
(eq. 72)
NCP1631PFCGEVB
Hence:
I in,max + 2 Ǹ2 @
(P in,avg) max
(V in,rms) LL
ȡ
ȧ
Ȣ
@ 1*
ȡ
ȧ
Ȣ
I in,max + 2 Ǹ2 @ 325 @ 1 *
90
• Selecting ROCP and RCS :
V out,nom
ǒ
4 @ V out,nom * ǒǸ2 @ (V in,rms) LL
390
4 @ 390 * ǒǸ2 @ 90Ǔ
ǒ
ȣ
ȧ
ǓǓȤ
ȣ
^ 6.4 A
Ǔȧ
Ȥ
(eq. 73)
(eq. 74)
If we neglect the input current ripple, the RCS losses are given by the following simplified equation:
P Rcs + R CS @
ǒ Ǔ
P in,avg
2
(eq. 75)
V in,rms
One can choose RCS as a function of its relative impact on the PFC stage efficiency at low line and full power. If α is the
relative percentage of the power that can be consumed by RCS , this criterion leads to:
ǒ
T @ (P in,avg) max + R CS @
(P in,avg) max
(V in,rms) min
Ǔ
2
(eq. 76)
Finally:
R CS +T @
(V in,rms) min 2
(P in,avg) max
(eq. 77)
And:
R OCP + R CS @
I in,max
210 mA
(eq. 78)
Generally (α = 0.2%) gives a good trade−off between losses and noise immunity (0.2% of the power is lost in the RCS at low
line).
This criterion leads to the following RCS value:
R cs + 0.2% @ 90 ^ 50 mW
325
2
(eq. 79)
This selection results in the following ROCP resistor:
R OCP + 50 m @
6.4 A
^ 1.5 kW
210 mA
(eq. 80)
Zero Current Detection (ZCD)
For each phase, a winding taken off of the boost inductor gives the zero current detection (ZCD) information. When the
switch is on, the ZCD pin voltage is equal to:
V zcd + *
V in
N
(eq. 81)
Where Vin is the instantaneous ac line voltage and N, the turns ratio (ratio number of turns of the primary winding over the
number of turns of the ZCD auxiliary winding)
When the switch is off, the ZCD pin voltage is equal to:
V zcd +
V out * V in
N
(eq. 82)
The NCP1631 incorporates two ZCD comparators:
1. A first one senses pin1 that is to receive the ZCD voltage from branch 2
2. A second one monitors pin16 that receives the ZCD signal for branch1.
The ZCD comparators have a 0.5−V threshold (rising, with a 250−mV hysteresis). Therefore, N must be sized such that at
least 0.5 V is obtained on the ZCD pin during the demagnetization in all operating conditions. The voltage obtained on the ZCD
pin is minimal in high line and at the top of the sinusoid, leading to:
Nv
V out * ǒǸ2 @ (V in,rms) HLǓ
0.5
http://onsemi.com
16
NCP1631PFCGEVB
With ((Vin,rms)HL = 265 V) and (Vout = 390 V), N must be lower than 30. A turns ratio of 10 was selected for this design.
A resistor, RZCD1 is to be added between the phase 1 ZCD winding and pin 16 for branch 1 and another one RZCD2 between
the phase 2 ZCD winding and pin1 for branch 2. RZCD1 and RZCD2 limit the current into or out of pins 1 and 16. This current
is preferably set in the range of 2 mA (sink and source). In general, the pins are the most stressed by the sink current obtained
at high line. Hence, RZCD1 and RZCD2 must be selected high enough so that:
R ZCD1 + R ZCD2 w
Ǹ2 @ (V
in,rms) HL
I ZCD @ N
+
Ǹ2 @ 265
^ 19 kW
2 m @ 10
(eq. 83)
A 22−kW was selected.
However, the value of this resistor and the small parasitic capacitance of the ZCD pin also determine when the ZCD winding
information is detected and the next drive pulse begins. Ideally, the ZCD resistor will restart the drive at its valley. This will
minimize switching losses by turning the MOSFET back on when its drain voltage is at a minimum. The value of RZCD1 and
RZCD2 to accomplish this is best found experimentally. Too high of a value could create a significant delay in detecting the
ZCD event. In this case, the controller would operate in discontinuous conduction mode (DCM) and the power factor would
suffer. Conversely, if the ZCD resistor is too low, then the next driver pulse would start when the voltage is still high and
switching efficiency would suffer.
Over−Voltage Protection
The NCP1631 dedicates one specific pin for the under−voltage and over−voltage protections. The NCP1631 configuration
allows the implementation of two separate feed−back networks (see Figure 11):
• One for regulation applied to pin 4 (feed−back input).
• Another one for the OVP function.
Vout (bulk voltage)
Vout (bulk voltage)
Rout1
Rout3
Rout2
FB
1
2
3
4
5
6
7
8
OVP
16
15
14
13
12
11
10
9
Figure 10. Configuration with
One Feed−back Network for
Both OVP and Regulation
1
FB 2
Rfb1
Rovp1
Rfb2
Rovp2
3
4
5
6
OVP 7
8
Vout (bulk voltage)
16
15
14
13
12
11
10
9
Figure 11. Configuration with Two
Separate Feed−back Networks
Rovp
Rfb1
Rfb1
Rfb2
Rfb2
1
FB 2
OVP
3
4
3
4
7
8
16
15
14
13
12
11
10
9
Figure 12. Another Configuration
with Two Separate Feed−back
Networks
The double feed−back configuration offers some redundancy and hence, an up−graded safety level as it protects the PFC
stage even if there is a failure of one of the two feed−back arrangements.
However, the regulation and the OVP function have the same reference voltage (VREF = 2.5 V) so that if wished, one single
feed−back arrangement is possible as portrayed by Figure 9. The regulation and OVP blocks having the same reference voltage,
the resistance ratio Rout2 over Rout3 adjusts the OVP threshold. More specifically,
• The bulk regulation voltage is:
V out,nom +
R out1 ) R out2 ) R out3
@ V REF
R out2 ) R out3
(eq. 84)
V out,ovp +
R out1 ) R out2 ) R out3
@ V REF
R out2
(eq. 85)
• The (bulk) OVP level is:
• The ratio OVP level over regulation level is:
V out,ovp
V out,nom
+1)
R out3
R out2
(eq. 86)
For instance, (Rout3 = 5% x Rout2) leads to (Vout,ovp = 105% x Vout,nom).
As soon and as long as the circuit detects that the output voltage exceeds the OVP level, the power switch is turned off to
stop the power delivery.
http://onsemi.com
17
NCP1631PFCGEVB
In our application, the option that consists of two separate Vout sensing networks is chosen (configuration of Figure 10). Like
for the regulation network, the impedance of the monitoring resistors must be:
1. high enough to limit the losses that if excessive, may not allow to comply with the stand−by requirements to be met
by most power supplies
2. low enough for a good noise immunity
Again, a bias current in the range of 100 mA generally gives a good trade−off.
R ovp2 +
Hence:
V ref
+ 25 kW
100 mA
In practice, (Rovp2 = 27 kW) was selected and as a consequence:
R ovp1 + R ovp2 @
ǒ
V out,ovp
V REF
(eq. 87)
Ǔ
*1
(eq. 88)
In our application, our 410−V target leads to:
ǒ
Ǔ
R ovp1 + 27 kW @ 410 * 1 + 4401 kW
2.5
(eq. 89)
For safety reason, several resistors should be placed in series instead of a single Rovp1 one. In our application, we choose
a (1800 kW + 1800 kW + 820 kW) network.
The exact OVP level is then:
V out,ovp +
R ovp1 ) R ovp2
R ovp2
@ V REF +
1800 k ) 1800 k ) 820 k ) 27 k
@ 2.5 V ^ 412 V
27 k
(eq. 90)
Remark:
As illustrated by Figure 11, another effective means to dimension the OVP sensing network is, to select:
• Rovp2 = Rfb2
• Rovp1 = Rfb1 + Rovp, where Rovp is a part of the upper resistor of the OVP sensing network.
Note that:
V out,nom +
V out,ovp +
R fb1 ) R fb2
@ V REF
R fb2
R ovp1 ) R ovp2
R ovp2
R fb1 ) R ovp ) R fb2
@ V REF +
R fb2
@ V REF
Combining two precedent equations, it comes:
V out,ovp + V out,nom )
R ovp
@ V REF
R fb2
In other words, the OVP protection trips when the overshoot exceeds:
ǒ
Ǔ
R ovp
@ V REF
R fb2
Conclusions
This application note proposes a systematic approach for the eased design of an efficient 2−phase, interleaved PFC. More
specifically, this paper provides the key equations and design criteria necessary to dimension the PFC stage. The practical
implementation of a 300−W, wide mains application illustrates the process.
For detailed information on the performance of a 300−W interleaved PFC designed according to the proposed method, you
can refer to NCP1631EVB/D [3]. This application note shows that the efficiency can remain as high as almost 95% at 90 Vrms
from 20% to 100% of the load, despite the relatively high switching frequency range that was selected (120−kHz nominal clamp
frequency).
The following table summarizes the key equations useful to design a NCP1631 driven interleaved PFC. Another table reports
the results of these computations for our 300−W application of interest.
http://onsemi.com
18
NCP1631PFCGEVB
References
[3] Stephanie Conseil, “Performance of a 300−W, wide
mains interleaved PFC driven by the NCP1631”,
NCP1631EVB/D,
http://www.onsemi.com/pub/Collateral/NCP1631EVB−D.
PDF
[1] Joel Turchi, “Characteristics of Interleaved PFC Stages”,
Application Note AND8355,
http://www.onsemi.com/pub/Collateral/AND8355−D.PDF
[2] Joel Turchi, “Designing a high−efficiency, 300−W, wide
mains interleaved PFC”, Application Note AND8354,
http://www.onsemi.com/pub/Collateral/AND8354−D.PDF
Table 1. GENERAL EQUATIONS − SUMMARY
Lw
(V in,rms) LL 2 @ ǒV out,nom * Ǹ2 @ (V in,rms) LLǓ
(P in,avg) max @ V out,nom @ f OSC(nom)
Coil Selection
(I L,pk) max + Ǹ2 @
(P in,avg) max
(V in,rms) LL
(P in,avg) max
(I L,rms) max + 1 @
Ǹ3 (V in,rms) LL
Power
Components
MOSFET
Conduction Losses
(P on) max + 1 @ R DS(on) @
3
ǒ
(P in,avg) max
(V in,rms) LL
(dV out) pk−pk +
C bulk w
Bulk Capacitor
(I C,rms) max +
Ǹǒ
BO Filtering Capacitor
Timing Resistor
ƫ
P out,max
C bulk @ w @ V out,nom
Ǔ ǒ
ǒ
ǒ
(V in,avg) boL @ 1 *
Ǔ
2
ǓǓ
fBO
3@fline
ǒ
R bo1
(V in,avg)boL
V BO(th)
ǒ
@ 1*
ǓǓ
fBO
3@fline
*1
R bo1 ) R bo2
2p @ R bo1 @ R bo2 @ f BO
R t + 4026 @ 10 3 @ k BO @ ǸL @ (P in) HL
Pin3 Resistor
f OSC(nom) ^ 52 @ 10
C OSC
Clamp Frequency
per Branch
ǒfsw(max)Ǔ
Fold−Forward
Power Threshold
Minimum Frequency
(per Branch)
3p @ V out,nom
(P in,avg) max 2
(P out) max
16 Ǹ2
@
*
9p
(V in,rms) LL @ V out,nom
V out,nom
C bo +
Oscillator Frequency
(No Frequency Foldback)
Oscillator
8 Ǹ2 @ (V in,rms) LL
I HYST
R bo2 +
BO Bottom Resistor
1*
V out,nom 2 * V out,min 2
R bo1 +
Brown−out Block
@
2 @ P out,max @ t HOLD−UP
(V in,avg) boH *
BO Upper Resistor
Ǔ ƪ
2
nom
+
(P in) FF +
ǒfsw(max)Ǔ
min
f OSC(nom)
2 @ R Fmin @ C OSC @
19
^ 26 @ 10
C OSC
−6
R FF
@ (P in) HL
15810 W
+
http://onsemi.com
2
−6
ǒ
1
ǒ
0.22 ) In
ǓǓ
RFmin*114000
RFmin*143000
NCP1631PFCGEVB
Table 1. GENERAL EQUATIONS − SUMMARY
Feedback Bottom Resistor
R fb2 +
Feedback
Resistors
Feedback Upper Resistor
R fb1 + R fb2 @
OVP Bottom Resistor
ǒ
OVP Upper Resistor
R ovp1 + R ovp2 @
Cp Capacitor of the
Type2 Compensation
Cp ^
V REF
I FB
ǒ
V out,ovp
V REF
Ǔ
*1
1.06 @ 10 −6 @ (P in) HL
C bulk @ f c 2 @ (V out,nom) 2
Cz Capacitor of the
Type2 Compensation
C z + 15 @ C p
Rz Resistor of the
Type2 Compensation
Rz +
I in,max + 2 Ǹ2 @
(P in,avg) max
(V in,rms) LL
ȡ
ȧ
Ȣ
2
p @ Cz @ fc
@ 1*
V out,nom
ǒ
4 @ V out,nom * ǒǸ2 @ (V in,rms) LL
if (V in,rms) LL v
Maximum Level of the
Input Current
I in,max + 2 Ǹ2 @
Current Limitation
Ǔ
V out,nom
*1
V REF
R ovp2 +
OVP Resistors
Loop
Compensation
V REF
I FB
(P in,avg) max
(V in,rms) LL
@
ǒ
1*
V out,nom
4 @ Ǹ2 @ (V in,rms) LL
if (V in,rms) LL w
R CS +
Current Sense Resistor
Over Current Resistor
P Rcs @ (V in,rms) LL 2
R OCP +
http://onsemi.com
20
V out,nom
2 Ǹ2
(P in,avg) max 2
R CS @ I in,max
210 @ 10 −6
Ǔ
V out,nom
2 Ǹ2
ȣ
ȧ
ǓǓȤ
NCP1631PFCGEVB
• fOSC(nom) is the oscillator frequency without frequency
•
• kBO is the brown−out scaling down factor
ǒ
foldback
(fsw(max)) is the nominal clamp frequency for each
branch (in the absence of frequency foldback), that is
ǒ
Ǔ
external capacitor (Cbo) together with Rbo1 and Rbo2
• IHYST is the internal 7−mA internal current source used
• (fsw(max))min is the minimum clamp frequency for each
•
•
•
•
•
•
•
•
•
•
•
•
•
•
•
•
branch resulting from frequency foldback
Vout,nom is the nominal output voltage of the PFC stage
(regulation level)
(Vin,rms)LL is the lowest level of the line rms voltage
(Pin,avg)max is the maximum level of the average input
power
(IL,pk)max is the maximum peak current absorbed by
one branch of the interleaved PFC (normal operation)
(IL,rms)max is the maximum rms current drawn by one
branch of the interleaved PFC (normal operation)
Pon are the MOSFET conduction losses (in one branch)
RDS(on) is the MOSFET on−time resistor (for one branch)
(dVout)pk−pk is the output peak to peak ripple
w is the line angular frequency (w = 2p x fline)
fline is the line frequency
Cbulk is the bulk capacitor
tHOLD−UP is the specified hold−up time
(IC,rms)max is the rms current of the bulk capacitor. Its
given computation assumes a resistive load.
Vout,min is the minimum level of the output voltage that
is acceptable for the downstream converter
(Pin)HL is the maximum level that can be virtually
delivered by the PFC stage as allowed by the timing
resistor selection. For the sake of a welcome margin,
((Pin)HL) should be selected about 30% higher than the
expected maximal input power that is:
•
•
•
•
•
in a traditional PFC stage.
• (Vin,avg)boL is the averaged input voltage below which
the Brown−out protection trips.
ǒ
•
•
•
•
•
•
2 Ǹ2
(V in,avg) boH + p @ V in,rms
Ǔ in a traditional PFC stage.
VBO(th) is the internal 1−V brown−out voltage reference.
Rz, Cz and Cp are the compensation components.
fc is the crossover frequency.
RCS is the current sense resistor.
PRcs are the losses across Rsense. 0.2% of the maximum
power generally gives a good trade−off between noise
immunity and efficiency.
ROCP is the resistor that placed between the CS pin and
RCS, sets the maximum level of the input current (total
current absorbed by the two branches).
Remark Regarding the Compensation:
The compensation is computed to have a phase margin in
the range of 60°. The high frequency pole can be set at a
lower frequency. Practically, Cp can be increased up to 4
times the proposed value (without changing Rz and Cz ) to
reduce the ripple on the Vcontrol pin and further improve the
THD. This is at the cost of a diminution of the phase margin
that can drop as low as 30°.
Example 1: 300−W, Wide Mains Application
We select a 120−kHz frequency clamp per branch.
The maximum output power being 300 W, we estimate
that the input power can be as high as around 325 W (92%
efficiency at the lowest line – conservative figure that offers
some margin). The power capability ((Pin)HL) is set 125%
higher at 400 W.
The minimum input voltage being 90 Vrms, the brown−out
block is dimensioned so that the circuit starts operating when
the line rms voltage exceeds 81 V and a brown−out fault is
detected when the line magnitude goes below 72 V.
The regulation level is set to 390 V (Vout,nom = 390 V) and
the OVP level to 410 V (Vout,ovp = 410 V).
A 100−mF bulk capacitor is implemented.
The current resistor is selected so that it does not consume
more than about 0.2% of the maximum power (PRsense =
0.2% x (Pin,avg)max).
• (Pin)FF is the input power level below which the circuit
•
for hysteresis
(Vin,avg)boH is the averaged input voltage at which the
circuit starts operation.
ǒ(Vin,avg)boH + Ǹ2 @ Vin,rmsǓ
ǒ(Pin)HL + 130% @ (Pin,avg)maxǓ
•
Ǔ
R bo2
R bo1 ) R bo2
• fBO is the frequency pole created by the BO pin
f OSC(nom)
2
k BO +
starts to reduce the switching frequency (Frequency
Fold−back)
RFF is the resistor to be placed between pin6 and
ground to control the frequency fold−back
characteristic
RFmin is the resistor that can be placed between the
oscillator pin and ground to adjust a minimum
frequency. The moderate impact on the fOSC(nom) value
is not taken into account in the given fOSC(nom)
computation equation.
Rfb1 and Rfb2 are the feedback sensing resistors.
Rovp1 and Rovp2 are the OVP sensing resistors.
Vout,ovp is the OVP output voltage.
VREF is the internal 2.5−V voltage reference.
Rbo1 and Rbo2 are the Brown−Out sensing resistors.
http://onsemi.com
21
NCP1631PFCGEVB
Table 2.
Lw
90 2 @ ǒ390 * Ǹ2 @ 90Ǔ
^ 140 mH
320 @ 390 @ 120 k
(I L,pk) max + Ǹ2 @ 320 ^ 5.0 A
90
320
1
@
^ 2.1 A
(I L,rms) max +
Ǹ3 90
Coil Selection
A 150−mH ń 6 Apk ń 2.5 A rms coil was selected
Power
Components
MOSFET
Conduction Losses
ǒ Ǔ
(P on) max + 1 @ R DS(on) @ 320
90
3
(dV out) pk−pk +
Brown−out Block
BO Bottom Resistor
Ǹǒ
BO Filtering Capacitor
ǒ
Ǔ
2
16 Ǹ2
@ 325
* 300
9p
90 @ 390
390
ǓǓ
ǒ
115 * 65 @ 1 * 10%
3
R bo1 +
7 @ 10 −6
R bo2 +
C bo +
ǒ
ƫ
8 Ǹ2 @ 90
^ 3 @ R DS(on)
3p @ 390
(f line + 60 Hz)
2 @ 300 @ t HOLD−UP
^ 0.014 @ t HOLD−UP
390 2 * 330 2
(I C,rms) max +
BO Upper Resistor
ƪ
@ 1*
300
^ 20 V
100 m @ 2p @ 60 @ 390
C bulk w
Bulk Capacitor
2
ǒ Ǔ
2
^ 1.3 A
^ 7450 kW
7200 @ 10 3
^ 116 kW
65 @ 1 * 10% * 1
1
3
ǓǓ
ǒ
å 7200 kW
å 120 kW
−6
7200 k ) 120 k
^ 13.5 @ 10 ^ 220 nF
f line
2p @ 7200 k @ 120 k @ 10% @ f line
(f line + 60 Hz)
Timing Resistor
Pin3 Resistor
R t + 4026 @ 10 3 @
Oscillator Frequency
(No Frequency Foldback)
−6
f OSC(nom) ^ 52 @ 10 −12 ^ 236 kHz
220 @ 10
Clamp Frequency
per Branch
Oscillator
Fold−Forward
Power Threshold
Minimum Frequency
(per Branch)
Feedback
Resistors
120 k
@ Ǹ150 m @ 400 ^ 16.2 kW å 18 kW
7200 k ) 120 k
å (P in) HL + 494 W
ǒfsw(max)Ǔ
(P in) FF +
ǒfsw(max)Ǔ
min
+
nom
+
f OSC(nom)
2
^ 118 kHz
R FF
4700 W
@ (P in) HL +
@ 494 ^ 147 W
15810 W
15810 W
ǒ
1
ǒ
270 k*114 k
2 @ 270 k @ 220 p @ 0.22 ) In
270 k*143 k
Feedback Bottom Resistor
R fb2 + 2.5 ^ 27 kW
92 m
Feedback Upper Resistor
R fb1 + 27 k @ 390 * 1 + 4185 kW
2.5
OVP Bottom Resistor
R ovp2 + 2.5 ^ 27 kW
92 m
OVP Upper Resistor
R ovp1 + 27 k @ 410 * 1 ^ 4400 kW
2.5
ǒ
OVP Resistors
ǒ
http://onsemi.com
22
Ǔ
Ǔ
ǓǓ
^ 19.8 kHz
NCP1631PFCGEVB
Table 2.
Loop
Compensation
Cp Capacitor of the
Type2 Compensation
Cp ^
Cz Capacitor of the
Type2 Compensation
C z + 15 @ 68 n ^ 1.02 mF
Rz Resistor of the
Type2 Compensation
Rz +
Maximum Level of the
Input Current
I in,max + 2 Ǹ2 @ 325 @ 1 *
90
1.06 @ 10 −6 @ 494
^ 86 nF
100 @ 10 −6 @ 20 2 @ 390 2
Current Limitation
å 1.0 mF
2
^ 31.8 kW
p @ 1.0 m @ 20
ȡ
ȧ
Ȣ
å 33 kW
390
4 @ 390 * ǒǸ2 @ 90Ǔ
ǒ
ȣ
^ 6.4 A
Ǔȧ
Ȥ
@ 90 + 49.8 mW
R CS + 0.2% @ 325
325 2
å 50 mW
−3
R OCP + 50 @ 10 @−66.4 ^ 1.52 kW
210 @ 10
å 1.5 kW
2
Current Sense Resistor
Over Current Resistor
å 68 nF
BILL OF MATERIALS
Table 3. BILL OF MATERIALS*
Designator
Qty
Description
Value
CM1
1
CM Filter, 4 A
2*6.8 mH
C2
1
Electrolytic capacitor
C5
1
X2 capacitor
Tolerance
Substitution
Allowed
Footprint
Manufacturer
Manufacturer Part
Number
4A/
250 V
through-hole
EPCOS
B82725-A2402-N1
NO
100 mF
450 V
through-hole
BC
Components
2.22216E+11
NO
100 nF
275 V
through-hole
RIFA
PHE840MB6100MB05R17
NO
C6
1
X2 capacitor
1 mF
275 V
through-hole
RIFA
PHE840MD7100MD20R06L2
NO
C10, C16
2
Y capacitor
4.7 nF
275 V
through-hole
Murata
DE1E3KX472MA5B
NO
C15
1
Ceramic capacitor
220 pF
5%,
50 V
SMD, 1206
C18
1
X2 capacitor
680 nF
275 V
through-hole
C20
1
Ceramic capacitor
150 nF
10%,
50 V
SMD, 1206
YES
C22, C27
2
Ceramic capacitor
1 nF
10%,
50 V
SMD, 1206
YES
C25
1
Ceramic capacitor
1 mF
10%,
50 V
SMD, 1206
YES
C28
1
Ceramic capacitor
220 nF
10%,
50 V
SMD, 1206
YES
C30, C33
2
Ceramic capacitor
100 nF
10%,
50 V
SMD, 1206
YES
C32
1
Electrolytic capacitor
100 uF
25 V
through-hole
YES
C34
1
Ceramic capacitor
10 nF
10%,
50 V
SMD, 1206
YES
D6, D14,
D15
3
Diode
D1N4148
through-hole
Philips
1N4148
YES
D3
1
LED 3mm
2.4V/2mA
through-hole
Vishay
TLLG4400
YES
D4, D5
2
Boost diode
MUR550
5 A,
500 V
Axial
ON
Semiconductor
MUR550APFG
NO
D16
1
Standard recovery diode,
600 V
1N5406
3 A,
600 V
Axial
ON
Semiconductor
1N5406G
NO
D21
1
Zener diode, 18 V
18 V
through-hole
NXP
BZX79-C18
NO
*All products listed are Pb−free.
http://onsemi.com
23
YES
EPCOS
B32923A2684M
NO
NCP1631PFCGEVB
Table 3. BILL OF MATERIALS*
Tolerance
Manufacturer Part
Number
Substitution
Allowed
AAVID
THERMALLOY
437479
NO
through-hole
Wurth
Electronics
7447076
NO
TO92
ON
Semiconductor
MPS2907AG
NO
Designator
Qty
Description
Value
HS1
1
Heatsink, 2.9 °C/W
2.9 °C/W
L4
1
DM Choke, WI-FI series
150 mH/ 5 A
Q1, Q2
2
PNP transistor
2N2907
R2, R6
2
Axial resistor, 1/4 W
1 kW
1%
through-hole
YES
R1
1
Axial resistor, 1/4 W
1.8 kW
1%
through-hole
YES
R7, R17
2
Axial resistor, 1/4 W
2.2 W
1%
through-hole
YES
Footprint
20%,
5A
Manufacturer
R11, R20
3
SMD resistor, 1206, 1/4 W
10 kW
1%
SMD, 1206
YES
R14, R15
2
SMD resistor, 1206, 1/4 W
22 kW
1%
SMD, 1206
YES
R16, R21
2
Axial resistor, 1/4 W
0W
1%
through-hole
YES
R18
1
Axial resistor, 1/4 W
560 kW
0.01
through-hole
YES
R23
1
Axial resistor, 1/4 W
820 kW
0.01
through-hole
YES
R24
1
Axial resistor, 3 W, ±1%
50 mW
0.01
through-hole
R25, R40
2
SMD resistor, 1206, 1/4 W
27 kW
0.01
SMD, 1206
Vishay
RLP3 0R050
YES
NO
R31, R32,
R38, R39,
R41, R42,
R43, R44
8
Axial resistor, 1/4 W
1800 kW
1%,
1/4 W
through-hole
YES
R33
1
SMD resistor, 1206, 1/4 W
18 kW
0.01
SMD, 1206
YES
R34
1
SMD resistor, 1206, 1/4 W
270 kW
0.01
SMD, 1206
YES
R36
1
SMD resistor, 1206, 1/4 W
33 kW
0.01
SMD, 1206
YES
R37
1
SMD resistor, 1206, 1/4 W
4.7 kW
0.01
SMD, 1206
YES
R45
1
SMD resistor, 1206, 1/4 W
0W
0.01
SMD, 1206
YES
R46
1
SMD resistor, 1206, 1/4 W
120 kW
0.01
SMD, 1206
YES
R121,
R122,
R123
3
SMD resistor, 1206, 1/4 W
680 kW
0.01
SMD, 1206
YES
U1
1
Diode Bridge
KBU6K
U2
1
Interleaved PFC
controller, SOIC-16
NCP1631
-
X1, X5
2
PFC coil
150 mH
-
X4, X6
2
MOSFET
IPP50N250
CP
550 V
2
5
F1
1
Fuse
4A
Temporised
250 V
X4, X6
2
MOSFET
IPP50N250
CP
550 V
VOUT
1
Connector
-
GND
1
Connector
-
J1
1
Connector
J2
1
Connector
General
Semiconductor
KBU6K
NO
ON
Semiconductor
NCP1631
NO
CME
OF9120
NO
Infineon
IPP50N250CP
NO
TO220 isolators
Bergquist
3223-07FR-43
YES
Board “legs”
RICHCO
TCBS-801
YES
Shurter
34.3123
YES
TO220
Infineon
IPP50N250CP
NO
-
-
Multi Contact
23.3200-22
YES
-
-
Multi Contact
23.3200-21
YES
-
-
-
Schurter
GSF1.1201.31
YES
-
-
-
Weidmuller
PM 5.08/2/90 3.5 SW
YES
SO16
TO220
*All products listed are Pb−free.
http://onsemi.com
24
NCP1631PFCGEVB
Figure 13. Evaluation Board Schematic
http://onsemi.com
25
NCP1631PFCGEVB
TEST PROCEDURE FOR THE NCP1631PFCGEVB EVALUATION BOARD
• The board contains high voltage, hot, live parts.
• Be very cautious when manipulating or testing it.
• It is the responsibility of those who utilize the board,
•
•
•
• Brown-out levels:
Starts operation when the line voltage exceeds about
84 Vrms.
♦ Stops operation when the line voltage drops below
72 Vrms.
The NCP1631 is to be supplied by an external power
source ranging from 13 V to 20 Vdc.
The board PCB offers the option where NCP1631 is
self-supplied. For that, some components are to be
added (see relevant application note).
♦
to take all the precautions to avoid that themselves
or other people are injured by electric hazards or
are victim of any other pains caused by the board.
Input Range: 85 to 265 Vrms.
Output Voltage: 390 Vdc
Output Power Range: 0 to 300 W
•
•
390 Vdc
Output
Voltage
The external
Vcc voltage
(from 13 to
20 V) is to
be applied
here
Line
Connector
(The input
voltage
range is
from 85 V to
265 Vrms)
NCP1631
Figure 14. NCP1631GEVB Evaluation Board
http://onsemi.com
26
NCP1631PFCGEVB
Load
(0.8 A max)
VOUT
GND
NCP1631 Board
GND
Vcc
Input Socket
V
Oscilloscope
A
Isolated current
probe
390 Vdc
High voltage probe
Voltage source
(13 to 20 Vdc)
Power
analyzer
NOTE: The resistive or
active load must be
able to sustain 450 V
(including transients)
Input Voltage
(85 to 265 Vrms)
Figure 15. Test Setup
Test 1
Test 3: OCP
1. Apply the input voltage 115 Vrms to the input
socket.
2. Connect a load between the (Vout;GND)
terminals. Set the output current (Iout) to 0.8 A.
3. Place a power analyser able to measure: the input
power (Pin),the power factor (PF), the total
harmonic distorsion (THD)
4. Apply the VCC voltage 15 Vdc.
5. Verify that:
Parameters
Comments
Limits
VOUT
Voltage measured between
“VOUT” and “GND”
370 V < VOUT <
409 V
PF
Power Factor
> 0.980
THD
Total Harmonic Distortion
< 13 %
Efficiency
VoutIout / Pin
> 96 %
9. Set the input voltage to 90 Vrms and the output
current to 0.8 A.
10. Gradually decrease the input voltage while
observing the input current with the oscilloscope
until the top of the sinusoid becomes flat as in the
blue curve in Figure 16.
11. Measure the plateau: it must be between 7.27 and
8.13 A
Test 4: OVP
12. Observe the output voltage with an oscilloscope.
Set the triggering level at about 200 V, the trigger
position being set at 10% of the screen. Program
the scope to observe 50 or 100 ms in single
acquisition mode.
13. Set the input voltage to 115 Vrms and apply it to
the board.
14. Abruptly apply the VCC voltage (15 V). Check
that the output voltage keeps below 424 V.
Test 2
6. Observe the input current using an oscilloscope
and a current probe. The current is nearly
sinusoidal.
7. Increase the input voltage to 230 Vrms
8. Verify that:
Parameters
Comments
Limits
VOUT
Voltage measured between
“VOUT” and “GND”
370 V < VOUT <
409 V
PF
Power Factor
> 0.970
THD
Total Harmonic Distortion
< 13 %
Efficiency
VoutIout / Pin
> 97.5 %
Test 5: Frequency Foldback
15. Set the output current to 0.07 A and the input
voltage to 115 Vrms.
16. Connect a voltage probe to the test point DRV1 on
the board and a current probe to observe the input
current.
17. Set the trigger at the top of input current sinusoid
and zoom in to see the DRV pulses.
18. Measure the switching frequency: it should be
between 35 kHz and 50 kHz.
http://onsemi.com
27
NCP1631PFCGEVB
Iin (2 A/ div)
Vcontrol (1 V/div)
Iline (2 A/div)
Figure 16.
Figure 17.
ON Semiconductor and
are registered trademarks of Semiconductor Components Industries, LLC (SCILLC). SCILLC owns the rights to a number of patents, trademarks,
copyrights, trade secrets, and other intellectual property. A listing of SCILLC’s product/patent coverage may be accessed at www.onsemi.com/site/pdf/Patent−Marking.pdf. SCILLC
reserves the right to make changes without further notice to any products herein. SCILLC makes no warranty, representation or guarantee regarding the suitability of its products for any
particular purpose, nor does SCILLC assume any liability arising out of the application or use of any product or circuit, and specifically disclaims any and all liability, including without
limitation special, consequential or incidental damages. “Typical” parameters which may be provided in SCILLC data sheets and/or specifications can and do vary in different applications
and actual performance may vary over time. All operating parameters, including “Typicals” must be validated for each customer application by customer’s technical experts. SCILLC
does not convey any license under its patent rights nor the rights of others. SCILLC products are not designed, intended, or authorized for use as components in systems intended for
surgical implant into the body, or other applications intended to support or sustain life, or for any other application in which the failure of the SCILLC product could create a situation where
personal injury or death may occur. Should Buyer purchase or use SCILLC products for any such unintended or unauthorized application, Buyer shall indemnify and hold SCILLC and
its officers, employees, subsidiaries, affiliates, and distributors harmless against all claims, costs, damages, and expenses, and reasonable attorney fees arising out of, directly or indirectly,
any claim of personal injury or death associated with such unintended or unauthorized use, even if such claim alleges that SCILLC was negligent regarding the design or manufacture
of the part. SCILLC is an Equal Opportunity/Affirmative Action Employer. This literature is subject to all applicable copyright laws and is not for resale in any manner.
PUBLICATION ORDERING INFORMATION
LITERATURE FULFILLMENT:
Literature Distribution Center for ON Semiconductor
P.O. Box 5163, Denver, Colorado 80217 USA
Phone: 303−675−2175 or 800−344−3860 Toll Free USA/Canada
Fax: 303−675−2176 or 800−344−3867 Toll Free USA/Canada
Email: [email protected]
N. American Technical Support: 800−282−9855 Toll Free
USA/Canada
Europe, Middle East and Africa Technical Support:
Phone: 421 33 790 2910
Japan Customer Focus Center
Phone: 81−3−5817−1050
http://onsemi.com
28
ON Semiconductor Website: www.onsemi.com
Order Literature: http://www.onsemi.com/orderlit
For additional information, please contact your local
Sales Representative
EVBUM2163/D