1
M3T-PD308 V.5.00
M3T-PD30 V.8.00
Emulator Debugger for PC4701 System
User’s Manual
Rev. 1.00
May 1, 2003
REJ10J0024-0100Z
Active X, Microsoft, MS-DOS, Visual Basic, Visual C++, Windows and Windows NT are either registered trademarks or trademarks of
Microsoft Corporation in the United States and other countries.
Keep safety first in your circuit designs!
z Renesas Technology Corporation and Renesas Solutions Corporation put the maximum effort into making semiconductor products
better and more reliable, but there is always the possibility that trouble may occur with them. Trouble with semiconductors may lead to
personal injury, fire or property damage. Remember to give due consideration to safety when making your circuit designs, with
appropriate measures such as (i) placement of substitutive, auxiliary circuits, (ii) use of nonflammable material or (iii) prevention
against any malfunction or mishap.
Notes regarding these materials
z These materials are intended as a reference to assist our customers in the selection of the Renesas Technology product best suited to
the customer's application; they do not convey any license under any intellectual property rights, or any other rights, belonging to
Renesas Technology Corporation, Renesas Solutions Corporation or a third party.
z Renesas Technology Corporation and Renesas Solutions Corporation assume no responsibility for any damage, or infringement of any
third-party's rights, originating in the use of any product data, diagrams, charts, programs, algorithms, or circuit application examples
contained in these materials.
z All information contained in these materials, including product data, diagrams, charts, programs and algorithms represents information
on products at the time of publication of these materials, and are subject to change by Renesas Technology Corporation and Renesas
Solutions Corporation without notice due to product improvements or other reasons. It is therefore recommended that customers
contact Renesas Technology Corporation, Renesas Solutions Corporation or an authorized Renesas Technology product distributor
for the latest product information before purchasing a product listed herein. The information described here may contain technical
inaccuracies or typographical errors. Renesas Technology Corporation and Renesas Solutions Corporation assume no responsibility
for any damage, liability, or other loss rising from these inaccuracies or errors. Please also pay attention to information published by
Renesas Technology Corporation and Renesas Solutions Corporation by various means, including the Renesas home page
(http://www.renesas.com).
z When using any or all of the information contained in these materials, including product data, diagrams, charts, programs, and
algorithms, please be sure to evaluate all information as a total system before making a final decision on the applicability of the
information and products. Renesas Technology Corporation and Renesas Solutions Corporation assume no responsibility for any
damage, liability or other loss resulting from the information contained herein.
z Renesas Technology semiconductors are not designed or manufactured for use in a device or system that is used under
circumstances in which human life is potentially at stake. Please contact Renesas Technology Corporation, Renesas Solutions
Corporation or an authorized Renesas Technology product distributor when considering the use of a product contained herein for any
specific purposes, such as apparatus or systems for transportation, vehicular, medical, aerospace, nuclear, or undersea repeater use.
z The prior written approval of Renesas Technology Corporation and Renesas Solutions Corporation is necessary to reprint or reproduce
in whole or in part these materials.
z If these products or technologies are subject to the Japanese export control restrictions, they must be exported under a license from
the Japanese government and cannot be imported into a country other than the approved destination. Any diversion or reexport
contrary to the export control laws and regulations of Japan and/or the country of destination is prohibited.
z Please contact Renesas Technology Corporation or Renesas Solutions Corporation for further details on these materials or the
products contained therein.
For inquiries about the contents of this document or product, fill in the text file the installer generates in the following directory and email
to your local distributor.
¥SUPPORT¥Product-name¥SUPPORT.TXT
Renesas Tools Homepage http://www.renesas.com/en/tools
Contents
Contents
Setup
1.
1
STARTTING THE DEBUGGER
3
1.1 FEATURES OF PDXX .............................................................................................. 3
1.2 ABOUT PC4701 EMULATOR .................................................................................. 4
1.3 BEFORE STARTING THE DEBUGGER ................................................................ 4
1.4 STARTING THE DEBUGGER ................................................................................. 9
2.
SETUP DEBUGGER
10
2.1 MCU TAB................................................................................................................. 10
2.2 DEBUGGING INFORMATION TAB ..................................................................... 16
2.3 CLOCK TAB ............................................................................................................ 17
2.4 F/W AND WORK AREA TAB ................................................................................. 17
2.5 MEMORY EXTENSION MODE TAB .................................................................... 18
2.6 RESET TAB ............................................................................................................. 20
2.7 RESUME TAB ......................................................................................................... 21
2.8 METHOD OF MAKING MCU FILE ...................................................................... 22
3.
SET THE TARGET INFORMATION
24
3.1 PD308 ....................................................................................................................... 24
3.2 PD30 ......................................................................................................................... 28
4.
ENVIRONMENTAL SETTING OF DEBUGGER
29
4.1 SHORTCUT KEY TAB............................................................................................ 30
4.2 DOWNLOAD TAB ................................................................................................... 32
4.3 FONT TAB ............................................................................................................... 33
4.4 PATH TAB ............................................................................................................... 34
4.5 TOOL ENTRY TAB ................................................................................................. 35
4.6 OTHER TAB ............................................................................................................ 36
4.7 CUSTOMIZING OF TOOLBAR ............................................................................. 39
5.
ENDING THE DEBUGGER
41
Reference
43
i
1. WINDOWS/DIALOGS
45
1.1 PDXX WINDOW ...................................................................................................... 46
1.2 PROGRAM WINDOW ............................................................................................. 50
1.3 SOURCE WINDOW ................................................................................................ 55
1.4 REGISTER WINDOW............................................................................................. 55
1.5 RAM MONITOR WINDOW .................................................................................... 58
1.6 ASM WATCH WINDOW......................................................................................... 60
1.7 CALL STACK WINDOW......................................................................................... 64
1.8 SCRIPT WINDOW .................................................................................................. 65
1.9 PROTECT WINDOW .............................................................................................. 66
1.10 TRACE POINT SETTING WINDOW .................................................................. 67
1.11 H/W BREAK POINT SETTING WINDOW ......................................................... 73
1.12 TRACE WINDOW ................................................................................................. 74
1.13 DATA TRACE WINDOW ...................................................................................... 80
1.14 COVERAGE WINDOW ......................................................................................... 82
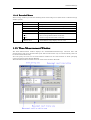
1.15 TIME MEASUREMENT WINDOW ..................................................................... 83
1.16 MR WINDOW ........................................................................................................ 85
1.17 MR TRACE WINDOW .......................................................................................... 86
1.18 MR ANALYZE WINDOW ..................................................................................... 89
1.19 MR TASK PAUSE WINDOW ............................................................................... 91
1.20 TASK TRACE WINDOW ...................................................................................... 92
1.21 TASK ANALYZE WINDOW ................................................................................. 94
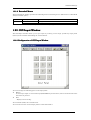
1.22 GUI INPUT WINDOW.......................................................................................... 95
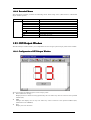
1.23 GUI OUTPUT WINDOW ...................................................................................... 96
1.24 S/W BREAK POINT SETTING WINDOW .......................................................... 97
1.25 H/W BREAK POINT SETTING DIALOG BOX(PC4701L) ................................. 99
2. TABLE OF SCRIPT COMMANDS
100
2.1 TABLE OF SCRIPT COMMANDS ....................................................................... 100
2.2 TABLE OF SCRIPT COMMANDS (ALPHABETICAL ORDER) ....................... 103
3. ERROR MESSAGES
106
ii
Set Up
1
2
1 Startting the Debugger
1. Startting the Debugger
1.1 Features of PDxx
The PD308 and PD30 have the following functions.
1.1.1 Real-Time RAM Monitor Function
This function allows changes of memory contents to be inspected without impairing the realtime
capability of the target program execution. The PC4701 emulator system contains a 1-Kbyte RAM
monitor area (which cannot be divided into smaller areas).
1.1.2 Break Functions
•
Software Break
This function causes the target program to stop immediately before executing the instruction at a
specified address. Up to 64 breakpoints can be set. If multiple breakpoints are set, the program
breaks at one of the breakpoints that is reached.
•
Hardware Break
This function causes the target program to stop upon detecting a data read/write to memory,
instruction execution, or the rising/falling edge of the input signal fed from an external trace
cable. The contents of events that can be set vary with each target MCU. Specified hardware
break events can be used in one of the following combinations:
- Break when all specified break points are effected.(And)
- Break when all specified break points are effected simultaneously.(And(Same Time))
- Break when any one of the specified break points is effected.(Or)
- Break on transition in state to a break state.(State Transition)
Protect Break
This function causes the target program to stop upon detecting a data write to the ROM area or
an access to an unused area (read/write or instruction execution).
•
1.1.3 Real-Time Trace Function
This function records a target program execution history. Up to 32K cycles of execution history can be
recorded. This record allows inspecting the bus information, executed instructions, and source
program execution path for each cycle.
1.1.4 Time Measurement Function
This function measures the minimum, maximum, and average execution time and the number of
executions performed in a specified interval. Measurements can be taken in up to four intervals at the
same time.
1.1.5 Coverage Function
This function records the addresses executed (accessed) by the target program (C0 coverage). This
3
function helps to keep track of unexecuted addresses after the program has stopped running. Use of
this coverage measurement function in the test process makes it possible to keep track of the test
items that have been omitted.
1.1.6 Real-Time OS Debugging Function
This function debugs the realtime OS-dependent parts of the target program that uses the realtime OS.
This function helps to show the status of the realtime OS and inspect a task execution history, etc.
1.1.7 GUI Input/Output Function
This function simulates the user target system's key input panel (buttons) and output panel on a
window. Buttons can be used for the input panel, and labels (strings) and LEDs can be used for the
output panel.
1.1.8 Customize Function
This function adds the user-exclusive functions (custom commands or custom windows) to the PDxx.
To create these custom commands and custom windows, use the CBxx (Customer Builder for PDxx)
included with the PDxx.
1.2 About PC4701 Emulator
The PC4701 emulator system is a generic term used for the 8/16-bit MCU emulators. It can be used in
combination with the emulation pod for the PC4701 to debug application programs for each MCU.
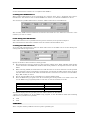
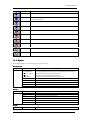
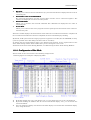
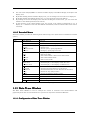
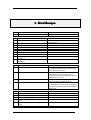
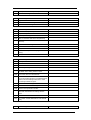
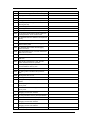
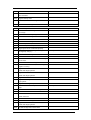
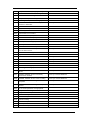
1.2.1 Function table
The supported functions vary with the type of emulator used.
Function
RAM Monitor
S/W Break
H/W Break
Real-Time Trace
C0 Coverage
Time Measurement
Protect Break
Emulator
PC4701U/M/HS
PC4701L
1K bytes area
64 points
6 points
32K Cycles
256K bytes area
Go to Stop / 4 points interval
Access Protect
1.3 Before starting the Debugger
Before you can start the Debugger, the following tasks must be completed.
4
1 point
G0 to Stop
-
1 Startting the Debugger
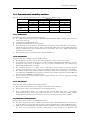
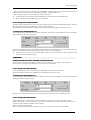
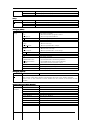
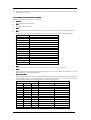
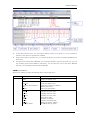
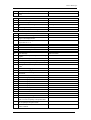
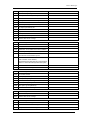
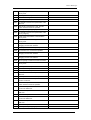
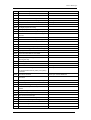
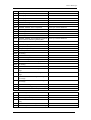
1.3.1 Communication method by emulator
The supported communication methods vary with the type of emulator used.
Emulator
I/F
PC4701U
PC4701M
PC4701HS
PC4701L
USB
O
X
X
X
LAN
O
X
O
X
LPT
O
O
X
X
Proprietary
X
X
O
O
parallel
Serial
X
O
O
O
1.3.1.1 USB Interface
Supported only when using the PC4701U emulator.
• The supported host computer OS is Windows Me/98/2000/XP. USB communication cannot be
used in any other OS.
• Compliant with USB Standard 1.1.
• Connections via USB hub are not supported.
• By connecting the host computer and the PC4701U emulator with USB cable, it is possible to
install the supported device drivers using a wizard (The PDxx that supports USB connections
must be installed before this installation can be performed.). See “1.3.3.1 USB communication
with PC4701U” for details.
• The necessary cable is included with the PC4701U emulator.
1.3.1.2 LAN Interface
Supported only when using the PC4701U/HS emulator.
The IP address, etc. must be set in the emulator before it can be connected in a LAN.
To communicate with the emulator via a LAN on Windows Me/98/2000/XP, Windows' registry
information must partly be modified. See “1.3.3.4 LAN communication with emulators by
Windows Me/98/2000/XP” for details.
• The PC4701U emulator in a LAN can be connected to the PC4701Us on another network
connected to the LAN via a router. See “1.3.3.2 LAN communication with PC4701U” for details.
• The emulators PC4701U and PC4701HS use different LAN cables. Specifically, the PC4701U
uses LAN cable (10BASE-T only) generally available on the market, whereas the PC4701HS uses
the LAN cable (10BASE-T/5) included with it.
• The host computer and the emulator can be connected directly. See “2.1.2.5 Setting of the LAN
Interface” for details.
•
•
1.3.1.3 LPT Interface
Supported only when using the PC4701U/M emulator.
•
•
•
This communication uses the host computer's parallel (printer) interface.
The necessary cable is included with the PC4701U/M emulator.
Four communication modes are supported that include ECP, EPP, Byte, and Nibble.
Communication modes that can be supported depend on the host computer's BIOS settings.
(Communication modes may not always be used even when they are supported by BIOS.)
1.3.1.4Proprietary Parallel Interface
Supported only when using the PC4701HS/L emulator.
The host computer must have a dedicated interface board, the PCA4202G02, incorporated in it
(only the ISA bus is supported). The necessary cable is included with the PC4701HS/L emulator.
• When using this communication on Windows NT 4.0/2000/XP, a device driver must separately be
set. See “1.3.3.3 Proprietary parallel communication with emulators by Windows NT
•
5
4.0/2000/XP” for details.
1.3.1.5 Serial Interface
Supported only when using the PC4701M/HS/L emulator.
•
•
This communication uses the host computer's serial interface.
The necessary cable is included with the PC4701HS/L emulator.
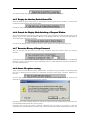
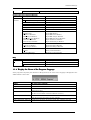
1.3.2 Download of Firmware
It is necessary to down-load the firmware which corresponds to connected Emulation Pod when the
debugger is started to the emulator.
•
•
•
You have changed your emulation pod.
You have setup PDxx for the first time.
You have upgraded emulator debugger PDxx.
Press the system reset switch within two seconds after powering up the PC4701 to establish the
maintenance mode.
PDxx searches the version of the firmware downloaded to the emulator at start. Also when the
firmware downloaded to the emulator is of old version, a mode which drives PDxx to download
firmware is set.
When PDxx gets started while the emulator is set in the mode which drives PDxx to download
firmware forcedly, the following dialog is opened at start.
Click the OK button to download the firmware.
ATTENTION
It is only the PC4701U that the firmware can be downloaded in a LAN connection. Before the firmware
can be downloaded by the PC4701U in a LAN connection, the IP address, etc. must first be registered
in the PC4701U. (Setup method)
If the emulator being used is the PC4701HS, use other communication methods (dedicated parallel or
serial) to download the firmware.
1.3.3Setting before emulator starts
1.3.3.1 USB communication with PC4701U
Connection of USB devices is detected by Windows' Plug & Play function. The device driver needed for
the connected USB device is automatically installed. For details, see "Installing USB Device Driver".
<< Install of USB device driver >>
The USB devices connected are detected by Windows' Plug & Play function. The installation wizard for
USB device drivers starts after the device had been detected. The following shows the procedure for
installing the USB device drivers.
1.
2.
Connect the host computer and the PC4701U emulator with USB cable.
Set the PC4701U emulator's communication interface switch (on the rear panel) to the "USB"
6
1 Startting the Debugger
3.
position. Then turn on the power to the emulator.
The dialog box shown below appears.
Go on following the wizard, and a dialog box for specifying the setup information file (inf file)
is displayed. Specify the musbdrv.inf file stored in a location below the directory where the
PDxx is installed (e.g., c:¥mtool¥pdxx¥drivers).
ATTENTION
•
•
•
•
Before the USB device drivers can be installed, the PDxx you use must already be installed.
Install the PDxx first.
USB communication can be used only in Windows Me/98/2000/XP, and cannot be used in any
other OSs.
When using Windows 2000/XP, a user who install the USB device driver need administrator
rights.
During installation, a message may be output indicating that the device driver proper
musbdrv.sys cannot be found. In this case, specify the musbdrv.sys which is stored in the same
directory as is the musbdrv.inf file.
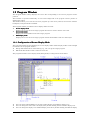
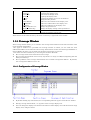
1.3.3.2 LAN communication with PC4701U
Before the emulator can be connected in a LAN, the IP address, etc. must first be registered in the
emulator. For the PC4701U emulator in default settings, the utility "setip.exe" included with the PDxx
may be used to set the IP address, etc. in the emulator. For details, see "Setting of the LAN Interface
using the SETIP.EXE"
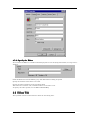
<< Setting of the LAN Interface using the SETIP.EXE >>
The utility "SETIP" included with the PDxx may be used to set the IP address, etc. in the PC4701U
emulator while in default settings. SETIP detects the PC4701Us in default settings that are connected
to the same network. SETIP is stored in a location below the directory where the PDxx is installed (e.g.,
c:¥mtool¥pdxx¥utility). The file name is "setip.exe".
To register the IP address in the PC4701U, follow the procedure described below.
1. Connect the PC4701U emulator with LAN cable to the same network (same subnet) as the
host computer is connected.
2. Set the PC4701U emulator's communication interface switch (on the rear panel) to the "LAN"
position. Then turn on the power to the emulator.
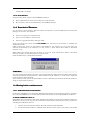
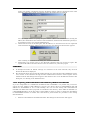
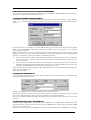
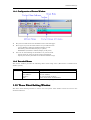
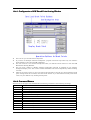
3. Start SETIP. When SETIP has started up, the dialog box shown below appears, showing
information on the PC4701U connected to the network. (This information consists of the MAC
address followed by the PC4701U serial number.)
4.
To register the IP address, click the Next button. To cancel registration, click the Close button.
If not displayed, check whether the communication interface switch is set correctly and after
temporarily turning off the power, turn it back on again. Then click the Search button.
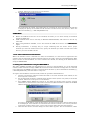
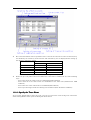
Click the Next button, and the dialog box shown below appears. Set the IP address, subnet
7
mask, port number, and default gateway IP address. When using the PC4701U on the same
network's same subnet mask, the default gateway IP address may be omitted.
5.
6.
Use any 4-digit number to specify the port number. (Enter that number when starting the
PDxx.) For details about the contents of the IP address, subnet mask, and default gateway to
be specified, contact your network administrator.
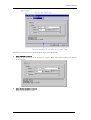
Click the Set button on the dialog box. The IP address, etc. that have been set are registered
in the PC4701U emulator. When registered correctly, the dialog box shown below appears.
After checking the contents of the dialog box, click the OK button.
Temporarily turn off the power to the PC4701U emulator and turn it back on again. The
registered IP address becomes effective after the emulator is powered up again.
ATTENTION
•
•
If multiple PC4701Us in default settings are connected on the same network, only the first
PC4701U detected is displayed.
The PC4701Us which have had an IP address already set cannot be detected by SETIP. In such a
case, connect to the emulator through another communication interface and re-register the IP
address from the Init dialog box that appears. For details on how to set IP addresses from the Init
dialog box, see "Setting of the LAN Interface."
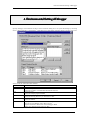
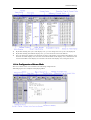
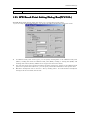
1.3.3.3 Proprietary parallel communication with emulators by Windows NT 4.0/2000/XP
If you are using PDxx in a combination of Windows NT 4.0/2000/XP + the parallel I/F, you need to
specify the start address of I/O addresses (7 bytes) to the device driver for PCA4202G02, (The I/O
address for PCA4202G02 is set to 100h initially.) You can set this setting with setPca4202.exe
included with PDxx. The above programs are installed in the directory where PDxx is installed. (ex.
c:¥mtool¥PDxx¥utility) At the first time of using PDxx,or when you want to change the I/O address
for PCA4202G02 because of conflict with other devices, please follow the procedure of the setting
described below.
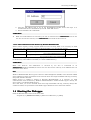
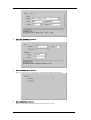
1.
Execute setPca4202.exe included with PDxx. The dialog box shown below will appear.
8
1 Startting the Debugger
2.
3.
Find the I/O address that is set on the PCA4202G02 parallel board and input it in
hexadecimal into the I/O Address input field. Click "OK" button.
Restart Windows NT 4.0/2000/XP.
ATTENTION
•
Make sure setPca4202.exe is executed by one who is authorized as an Administrator.
Administrator No one but
the user who has the authority of an Administrator can install the device driver.
1.3.3.4 LAN communication with emulators by Windows Me/98/2000/XP
Please exexute registry setting program (Sack.exe) before starting PDxx. It is necessary for LAN
communication with emulators by Windows Me/98/2000/XP to set the following registry.
OS
Key
Data
Windows Me/98
HKEY_LOCAL_MACHINE¥System¥CurrentControlSet¥
0(REG_SZ)
Services¥VxD¥MSTCP¥SackOpts
Windows 2000/XP HKEY_LOCAL_MACHINE¥SYSTEM¥CurrentControlSet¥ 0(REG_DWORD)
Services¥Tcpip¥Parameters¥SackOpts
You can clear the registry with executing the program "UnSack.exe". The above programs are installed
in the directory where PDxx is installed. (ex. c:¥mtool¥PDxx¥utility)
ATTENTION
Make sure Sack.exe and UnSack.exe is executed by one who is authorized as an
Administrator.(Windows
2000/XP) No one but the user who has the authority of an Administrator can
Administrator
install the device driver.
Note
Windows Me/98/2000/XP TCP supports "Selective Acknowledgments (SACK)" as documented in RFC
2018. SACK gives higher performance in the network which have high bandwidth and long round-trip
delays like satellite channels.
SACK support is enabled by default in Windows Me/98/2000/XP. It is necessary for LAN
communication with emulators by Windows Me/98/2000/XP to disable SACK support. Setting the
above registry can disable SACK support.
Note that when you use the network which have high bandwidth and long round-trip delays like
satellite channels, the performance with SACK support disabled is lower than with enabled.
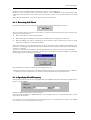
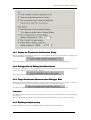
1.4 Starting the Debugger
Click the Windows start button, then select menu
Program (P) -> [RENESAS-TOOLS] -> [PDxx V.x.xx Release x] -> [PDxx]
9
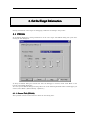
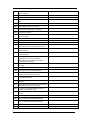
2. Setup Debugger
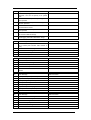
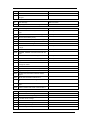
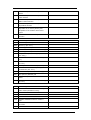
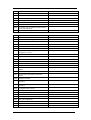
The Init dialog box is provided for setting the items that need to be set when the debugger starts up.
The contents set from this dialog box are also effective the next time the debugger starts. The data set
in this dialog remains effective for the next start.
Tab Name
MCU
Debugging Information
Reset
Clock
Resume
F/W and Work Area
Memory Extention Mode
Product Name
PD308
PD30
O
O
O
O
O
O
O
O
O
O
X
O
X
O
To keep the Init dialog closed next time the debugger is started, check "Next Hide" at the bottom of the
Init dialog.
You can open the Init dialog using either one of the following methods:
•
•
After the debugger gets started, select Menu - [Environment] -> [Init...].
Start PDxx while holding down the Ctrl key.
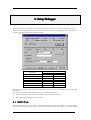
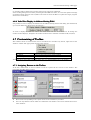
2.1 MCU Tab
The specified content becomes effective when the next being start. If the contents are set newly again
from the Init dialog box after startup, new settings do not take effect unless you restart PDxx.
10
2 Setup Debugger
Following figures are examples of displaying PD30.
2.1.1 Specifying the MCU file
Click the "Refer" button.
The File Selection dialog is opened. Specify the corresponding MCU file.
An MCU file is saved under the directory in which PDxx is installed. (For example:
c:¥mtool¥pdxx¥mcufiles).
• An MCU file contains the information specific to the target MCU.
• The specified MCU file is displayed in the MCU area of the MCU tab.
If the corresponding MCU file is not contained in the debugger/emulation pod, you must create a new
MCU file.
To do this, see the following:
•
Method of making MCU file(PD30)
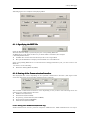
2.1.2 Setting of the Communication Interface
The displayed data varies depending on the specified communication interface. (The figure below
shows the data when special parallel communication is selected.)
The available communication interface varies depending on the products. The following shows the
setting for each communication interface.
• USB Interfece(PC4701U)
• LPT Interfece(PC4701U/M)
• Proprietary parallel Interfece(PC4701HS/L)
• Serial Interfece(PC4701M/HS/L)
• LAN Interfece(PC4701U/HS)
2.1.2.1 Setting of the USB Interface(PC4701U
Interface(PC4701U only)
USB communication uses the personal computer's USB interface. USB communication can only be
11
used on the PC4701U emulator. It is compliant with USB 1.1.
<< Setting of the USB Interface >>
Before USB communication can be performed, the computer must have a dedicated device driver
installed in it. For details on how to install USB device drivers, see "Install of USB device driver."
For connection by USB communication, click the "USB" radio button on the MCU tab.
The currently USB-connected emulators are listed in the Serial No. area. Select the serial No. of the
emulator you want to connect.
2.1.2.2 Setting of the LPT Interface
LPT communication uses a parallel interface (printer interface) of the personal computer.
This communication method is available when the emulator PC4701U/M is used.
<< Setting of the LPT Interface >>
To set the LPT communication, click the "LPT" radio button of the MCU tab in the Init dialog. The
setting looks like the figure below.
Specify the mode for data transfers in the Type field.
• The LPT interface has four modes for data transfers, Nibble, Byte, ECP, and EPP. Their modes
are documented in the IEEE-1284 standard. The mode possible to use depends on the PC with the
PDxx.
• When selecting AUTO, the PDxx detect the LPT interface at the start and select a mode possible
to use which give better performance automatically. In some PC, the PDxx cannot detect the most
suitable mode. Check the mode which the LPT interface in the PC have and select it from Nibble,
Byte, ECP or EPP, if cannot.
• Specify the I/O address of the used LPT port in the I/O Address field.
• Start the BIOS setup program of the PC for checking the mode possible to use. How to start and
use the BIOS setup program depends on each PC, so refer the manuals of the PC.
Display of BIOS Setup
SPP, Standard Parallel Port, Output Only
Bidirectional, Bi-directional
ECP, Extended Capabilities Port
EPP, Enhanced Parallel Port
Communication Mode
Nibble
Byte
ECP
EPP
The address displayed in the parallel port base address field is the I/O address.
Specify the I/O address set in the BIOS setup program, in the I/O Address field. (The following
addresses are possible to be specified)
•
•
378h
278h
ATTENTION
The C compiler made by IAR also uses this printer (parallel) port.
12
2 Setup Debugger
When using PDxx and the emulator PC4701U/M in the ECP mode on the LPT communication, a
problem that the data cannot be complied by the IAR C compiler will arise.
If this happens, take one of the following countermeasures:
• Connect PDxx to the emulator PC4701U/M in any mode other than the ECP mode.
• Start compilation when PDxx has been terminated.
2.1.2.3 Setting of the Parallel Interface
Special parallel communication uses a special parallel interface board PCA4202G02 (option), which is
inserted in the extension slot (ISA bus) of the personal computer.
This communication method is available when the emulator PC4701HS or PC4701L is used.
<< Setting of the Parallel Interface >>
To set the parallel communication, click the "Parallel" radio button of the MCU tab in the Init dialog.
The setting looks like the figure below.
Specify the I/O address in the I/O Address field. which is the I/O address set on the parallel interface
board, in hexadecimal (Don't describe prefix which shows a cardinal number ).
• Please specify the value of the hexadecimal number for the I/O address. (Don't describe prefix
which shows a cardinal number)
ATTENTION
Combination of Windows NT 4.0/2000/XP and Parallel Interface
It is necessary to set the I/O address used for the device driver for a parallel communication.
Please refer to "Setting before emulator starts" before starting PDxx.
2.1.2.4 Setting of the Serial Interface
Serial communication uses a serial interface (RS-232C) of the personal computer.
This communication method is available for all the PC4701 emulator series.
<< Setting of the Serial Interface >>
To set the Serial communication, click the "Serial" radio button of the MCU tab in the Init dialog. The
setting looks like the figure below.
Specify the communications port in the Port field and the baud rate in the Baud Rate field.
2.1.2.5 Setting of the LAN Interface
LAN communication uses a LAN interface (10 Base-T or 10 Base-5) of the personal computer.
Before using LAN, you must register the emulator IP address, port number and subnet mask to the
emulator itself (Otherwise, LAN is not available).
Then, set LAN communication.
This communication method is available when you are using the emulator PC4701U/HS.
13
LAN communication with emulators by Windows Me/98/2000/XP
It is necessary for LAN communication with emulators by Windows Me/98/2000/XP to set the registry.
For details, see "Setting before emulator starts".
<< Setting the IP Address and Subnet Mask >>
Start PDxx using other communication method. After it gets started, select Menu - [Environment]>[Init ...] to open the Init dialog. Then, click the Target button of MCU tab. The Target dialog will be
opened.
Specify the emulator IP address in the IP Address field, port number in the Port field, and subnet
mask in the SubNetMask field. (The emulator IP address must be registered in the network
environment in advance.)
When the PC4701U it is used, the Default Gateway area becomes effective. Please specify the IP
address of the default gateway. When the PC4701U it is used on the identical sub net mask of identical
network, it is possible to omit the IP address of the default gateway.
•
Specify the IP address, subnet mask and Default Gateway in decimal byte by byte, by separating
every 4 bytes with a period. For details on the IP address and subnet mask, consult with your
network manager.
•
A port number set in the Port field is used to identify the communication process of the server
(emulator) in LAN (TCP/IP) communications. Specify the port number which has been set in the
emulator in hexadecimal. (Do not add a prefix which shows a base.)
Click the "OK" button in the Target dialog. The Target dialog is then closed and the Init dialog appears
again. Click the "OK" button.
Then, exit from PDxx.
<< Setting of the LAN Interface >>
To set the LAN communication, click the "LAN" radio button of the MCU tab in the Init dialog. The
setting looks like the figure below.
Specify the IP address of the connected emulator in the IP address field.
Specify the IP address, in bytes, in decimal. Delimit each 4 bytes with a period. The port No. is the ID
No. for the communication process of the server (emulator) on the LAN (TCP/IP).
Specify, in hexadecimal (Don't describe prefix which shows a cardinal number), the port No. set on the
emulator.
<< LAN connection by couple 1 with emulator >>
Emulators PC4701U/HS can be connected by LAN (TCP/IP) to a commercially available LAN card
inserted in a PC by using a cross conversion cable for 10BASE-T (also commercially available). A HUB
is not necessary in this case.
The cross conversion cable for 10BASE-T converts the male connector of the 10BASE-T of a straight
14
2 Setup Debugger
LAN cable that is included with the emulators to that of a cross LAN cable.
Connect a cross conversion cable to the male connector of the 10BASE-T of the straight LAN cable
connected to the emulator; then, connect the male connector of the cross conversion cable to the LAN
card.
The LAN communications can be set up the same way as normal one.
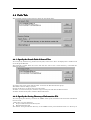
2.1.3 Executing Self-Check
Specify this option to execute self-check* on the emulator when the debugger starts up.
Be sure to select the above check box only when you want to perform self-check at startup. Specify this
option in the following cases:
•
•
•
When the firmware cannot be downloaded
When although the firmware is successfully downloaded, the debugger does not start
When the MCU goes wild or something is wrong with the trace results and you want to check
whether the emulator is operating normally.
Select the check box to close the Init dialog box. After connecting to the emulator and confirming the
firmware, the debugger will immediately start self-check on the emulator. (Self-check takes about 30
seconds to 1 minute.)
If an error is found in this self-check, the debugger displays the content of the error and is finished.
When the self-check terminated normally, the dialog box shown below is displayed. When you click OK,
the debugger starts up directly in that state.
This specification is effective only when the debugger starts up.
*Self-check refers to the function to check the emulator's internal circuit boards for memory condition,
etc. Refer to the user's manual of your emulator for details about the self-check function.
2.1.4 Specifying Clock Frequency
Specify the operation clock of the target MCU within the MCU Clock field in the Time Count Resource
group (in units of MHz).
Specify the MCU clock and the clock divide ratio.
If you are using the MCU at 10 MHz divided by 4, for example, enter "10" on the left side and "4" on the
right side of the text box.
If no values are set in the clock divide ratio specifying area, it is assumed that the clock is not divided
(i.e., the same as you would specify the value 1).
15
2.1.5 Using/unusing the watchdog timer
This specification exist for PD308 only.
Specify whether or not to use the watchdog timer. (By default, the watchdog timer is unused.)
When debugging the target system that uses a watchdog timer, select the check box shown above.
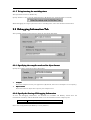
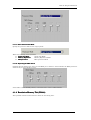
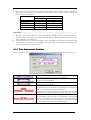
2.2 Debugging Information Tab
The specified content becomes effective when the next being download.
2.2.1 Specifying the compiler used and its object format
Specify the compiler used and its object file format.
•
Compiler
Select the compiler used in your application. (By default, this is the C Compiler of our company.)
•
Object Format
Select the format of object files output by the compiler used.
2.2.2 Specify the Storing of Debugging Information
To save the debugging information, two methods are available: On Memory which saves the
information in memory and On Demand which saves the information in the temporary file.
On Memory
On Demand
Allows high-speed process because of use of memory.
Minimizes use of memory.
Select the saving method. (On Memory is set by default.)
16
2 Setup Debugger
To select On Demand, specify the temporary file saving directory in the Temp Dir field.
If you do not specify the directory, the system creates a temporary file in the directory in which the
downloaded load module file is saved.
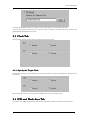
2.3 Clock Tab
The specified content becomes effective when the next being start.
2.3.1 Specify the Target Clock
Change the setting by synchronizing with the clock used by the target microcomputer. (Internal is set
by default.)
Select Internal to set the internal clock, and External to set the external clock.
2.4 F/W and Work Area Tab
In this tab, only PD30 exists. The specified content becomes effective when the next being start.
17
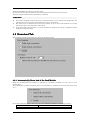
2.4.1 Select the Firmware File
Usually, click the Default radio button in the F/W group.
Click the Select radio button when you have to download firmware different from the one described in
the MCU file.
The F/W Name list box is enabled only when you click the Select radio button.
2.4.2 Specify the Work Area
In the Work Area Start Address field in the Work Area group, specify the top address of the area to be
used as the work area.
The emulator uses the MCU internal reservation area (unused area) as the debugging work area
(about 10 bytes).
Specify the work area so that it is accommodated in its MCU internal reservation area.
The default work area top address is 2C00h.
To debug a microcomputer (ex. 20K-byte RAM version if the M16C/62 group) whose work area is
within the internal RAM area, you must change the work area.
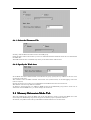
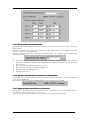
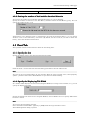
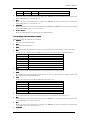
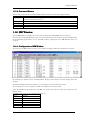
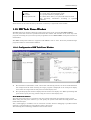
2.5 Memory Extension Mode Tab
This tab enabled only when the MCU tab in the Init dialog is used to specify the MCU file of the
microcomputer (M16C/62 group) which supports the memory space expansion function.
In this tab, only PD30 exists. The specified data remains effective for the next start.
18
2 Setup Debugger
2.5.1 Select the Memory Space Extension Mode
Select the memory space extension mode.
•
•
•
When you use a normal mode, Please click the "Normal" radio button.
When you use extension mode 1, Please click the "Ext1" radio button.
When you use extension mode 2, Please click the "Ext2" radio button.
The data of the eighth line of the selected MCU (data which specifies whether or not memory extension
mode is required) is used to determine whether or not memory extension mode has to be selected.
If the eighth line contains a '1', The memory extension mode selection area is active. If the line
contains a '0' or nothing, the memory extension mode selection area is inactive.
ATTENTION
The functions may be restricted depending on the type of memory space expansion mode.
Extension Mode 1
•
When the memory space expansion area is displayed in the dis-assemble mode in the Program
window or the Source window, the displayed data may be different from what you would expect
through the operation accompanying redrawing of the window, such as up/down scroll, during
execution of the target program.
•
The following emulator functions are implemented by analyzing the bus information (address bus,
data bus).
- RAM monitor function (RAM Monitor window, C Watch window)
- Coverage measurement function (Coverage window, Coverage command)
- Memory protect function (Protect window, Protect command)
•
MCU accesses the program bank if Fetch (command) is specified for the bank duplicated area,
and the data bank if Read/Write is specified for the bank duplicated area. In above cases, a signal
which can distinguish which bank accesses the bus information is not output. Therefore, the
above function may not work as expected.
•
The memory reference commands are added, which reference the internal ROM in the bank
duplicated area in the dump format (see the table below). You cannot use the DA command
during execution of the target program.
Command name
Abbreviation
Description
DumpByte2
DB2
DumpByte with bank designation
DumpWord2
DW2
DumpWord with bank designation
DumpLword2
DL2
DumpLword with bank designation
19
•
If you use the Memory Reference/Change command for the bank duplicated area before MCU is
switched from the normal mode to the memory space expansion mode1 by the target program, the
function may not work as expected.
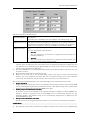
•
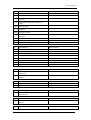
The memory map shows the following data after PD30 gets started.
Start Address
End Address
Map
Attention
00000
003FF
External
00400
03FFF
Internal
The internal RAM area cannot be changed.
04000
2FFFF
External
Cannot be changed.
30000
FFFFF
Internal
Extension Mode 2
•
The memory reference commands are added, which reference the internal ROM in the bank
duplicated area in the dump format (see the table below). A memory reference command with the
bank specification is added. The memory reference/the change to the bank repetition area must
use the following commands.
Command name
Abbreviation
Description with bank designation
DumpByte2
DB2
DumpByte with bank designation
DumpWord2
DW2
DumpWord with bank designation
DumpLword2
DL2
DumpLword with bank designation
SetMemoryByte2
MB2
SetMemoryByte with bank designation
SetMemoryWord2
MW2
SetMemoryWord with bank designation
SetMemoryLword2
ML2
SetMemoryLword with bank designation
FillByte2
FB2
FillByte with bank designation
FillWord2
FW2
FillWord with bank designation
FillLword2
FL2
FillLword with bank designation
Move2
Move with bank designation
MoveWord2
MoveW2
MoveWord with bank designation
•
The following emulator functions are implemented by analyzing the bus information (address bus,
data bus).
- RAM monitor function (RAM Monitor window, C Watch window)
- Coverage measurement function (Coverage window, Coverage command)
- Memory protect function (Protect window, Protect command)
- Hardware event (H/W break event*, Real-time trace event*, Time measurement event)
MCU switches the bank to be accessed based on the value in the bank selection register. A signal
which can distinguish which bank accesses the bus information is not output. Therefore, the
above function may work as expected.
*By specifying Simultaneous And (AND logic) (same time) for the hardware event and the bank
selection register, both of which are detected as the combined condition in the State Transient
Break/Trace window, the hardware event for the bank duplicated area can be detected.
•
If you use the Memory Reference/Change command for the bank duplicated area before MCU is
switched from the normal mode to the memory space expansion mode 2 by the target program,
the function may not work as expected.
•
The memory map shows the following data after PD30 gets started.
Start Address
End Address
Map
Attention
00000
003FF
External
00400
3FFFF
Internal
The internal RAM area cannot be changed.
40000
BFFFF
External
Cannot be changed.
C0000
FFFFF
Internal
2.6 Reset Tab
The specified content becomes effective when the next being start.
20
2 Setup Debugger
2.6.1 Target Reset after Down-loading
Specify whether you want to reset the target immediately after the target program is downloaded.
Do Reset
Do Not Reset
Reset.(Default)
Not Reset.
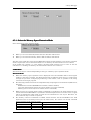
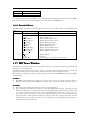
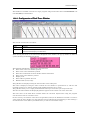
2.7 Resume Tab
The specified content becomes effective when the next being start.
2.7.1 Automatically Execute the Script Commands
To automatically execute the script command at start of Debugger, click the "Refer" button to specify
the script file to be executed.
21
By clicking the "Refer" button, the File Selection dialog is opened.
The specified script file is displayed in the "Init File:" field.
To disable auto-execution of the script command, erase a character string displayed in the "Init File:"
field.
2.7.2 Restore the Window Status
To restore the window status (window position, window size) after the previous debugger program is
terminated, check the "Resume" check box. (Resume is ON by default.)
2.7.3 Re-download a Load Module
To re-download a load module (target program), check the "AutoDownLoad" check box. (Re-download
is OFF by default.)
2.8 Method of making MCU file
2.8.1 PD30
The following content is sequentially described in the MCU file.
Specify the MCU name to the file name, and specify "mcu" to the file extension.
1. Start address of SFR area
2. End address of SFR area
3. Start address of internal RAM area
4. End address of internal RAM area
5. Start address of ROM area
6. End address of ROM area
7. File name of the Firmware *1
8. MCU type (whether memory space extension mode has to be specified or not)*2
Specify the addresses in hex format, and don't add any prefix which describe its radix.
*1 Specify the firmware file name (referring to the following tables), and don't add the end of
"m.s", "h.s", "l.s", which describe the type of emulator.
MCU
M16C/60 group
M16C/61 group
M16C/62 group
M16C/20 group
Firmware file name
M30600
group M30600
group M30620B
series M30620B
There is a case that the emulation pod need the different firmware from the listed firmware,
when the emulation pod is re-modeled.
*2 Specify whether the MCU: supports the memory space extension function or not.
When the MCU supports the function (EX: M16C/62 group), specify "1" , the other case,
specify "0".
22
2 Setup Debugger
Only when "1" is specified, the setting for memory space extension mode is available in
Memory Extension Mode tab of INIT Dialog
ATTENTION
•
•
The areas specified as the ROM in the MCU file are write-protected from the program. Even if
the write command is executed to the area, no value is written. However, you can use the Dump
command to write values to memory. (This is enabled only when the Internal area is mapped by
the MAP command.)
If the RAM is assigned to the same area, you must change the setting of the MCU file.
2.8.1.1 Example
0
3FF
400
2BFF
F0000
FFFFF
M30600
0
23
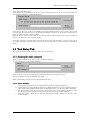
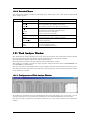
3. Set the Target Information
Setting information of the target for debugging is different according to the product.
3.1 PD308
In the Emem dialog box, setting information on the user target. The Emem dialog box opens after
closing the Init dialog box.
To keep the Emem dialog box closed next time the debugger is started, check "Next Hide" at the
bottom of the Emem dialog box.
You can open the Emem dialog box using either one of the following methods: After the debugger gets
started, select Menu - [Environment] -> [Emem...].
3.1.1 Status Tab (PD308)
The specified content becomes effective when the next being start.
24
3 Set the Target Information
3.1.1.1 Select the Processor Mode
Specify the processor mode for the target system.
Either the following can be specified.
• Single-chip Mode
Single-chip Mode
• Memory Expansion
Memory Expansion Mode
• Microprocessor
Microprocessor Mode
3.1.1.2 Inspecting the MCU status
Clicking this tab displays the status of each MCU pin. It allows to check whether the MCU pin status
matches the processor mode to be set.
If the slider is at the middle position, it means that the value is indeterminate.
3.1.2 Emulation Memory Tab (PD308)
The specified content becomes effective when the next being start.
25
3.1.2.1 Debug monitor's bank address settings
This product allocates a 64-Kbyte contiguous address area as the emulator's work area for use by the
debug monitor.
Specify any bank that the target system does not use. The debug monitor uses a 64-Kbyte area from
the start address of the specified bank.
(Example: If the specified bank is "F0," then the debug monitor uses a 64-Kbyte area beginning with
address F000000h.)
•
•
•
•
•
The bank specified here cannot have its contents referenced or set. The contents of this area when
displayed in the Memory window or the Program/Source window's disassemble display mode may
not be correct.
The following bank addresses cannot be specified:
MCU internal resources (e.g., SFR and RAM areas)
DRAM area and multiplexed area
Interrupt vector area
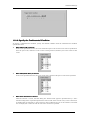
3.1.2.2 Automatic emulation memory allocation for the internal ROM
When single-chip or memory extension mode is selected, emulation memory is automatically allocated
to the internal ROM area.
The automatically allocated internal ROM address range is displayed in this field.
3.1.2.3 Emulation memory allocation for an extended area
When memory extension or microprocessor mode is selected, emulation memory can be allocated to the
extended area to be debugged (in up to four areas).
Here, allocate memory for the debug target area and specify its mapping information.
26
3 Set the Target Information
Follow the procedure described below.
Bank
Specify the bank address of the debug target area to be allocated in
(Set bank address)
hexadecimal.
If specified as C0, C00000h is the start address of the debug target area.
Length
Specify the size of the debug target area (256 bytes or 1 Mbytes).
(Specify size of area) If Length is specified to be "256 bytes," banks 00, 04, 08, and up to FC (every
four banks) are specified for Bank; if Length is specified to be "1 Mbytes,"
banks 00, 10, 20, and up to F0 (every 16 banks) are specified for Bank.
Map
Specify the mapping information ("Internal" or "External") for the specified
(Specify area map)
area.
If no area is specified, select "No Use."
•
Internal
The area specified to be "Internal" is mapped into the internal area
(emulation memory).
•
•
•
•
•
External
The area specified to be "External" is mapped into the external area
(external resources in the target system).
Areas for which "No Use" is selected for Map and those not specified here are mapped into
external areas. If compared to the case where areas are explicitly specified to be "External," the
only difference is a download speed. (Downloading into these areas is slower than downloading
into the areas specified to be "External.")
The internal ROM area is automatically mapped into the emulation memory. Therefore, there is
no need to set here.
Be careful that the debug areas will not overlap.
Make sure the total size of the specified debug target areas does not exceed the emulation
memory size of the emulation pod used. The size of emulation memory that can be allocated
varies with each emulation pod. (Consult the user's manual of your emulation pod.)
The setting of the emulation memory area varies depending on the specified processor mode.
Single-chip Mode
You do not need to specify the area to be assigned as the emulation memory. The internal ROM
area is automatically mapped into the emulation memory. The address range of the automatically
mapped area is displayed in the Internal ROM Area: field.
• Memory Expansion Mode(8bit and 16bit)
If you have an area to be assigned as the emulation memory in addition to internal ROM area,
specify it specify it separately. The internal ROM area is automatically mapped into the
emulation memory. The address range of the automatically mapped area is displayed in the
Internal ROM Area: field.
• Microprocessor Mode(8bit and 16bit)
Specify the area to be assigned separately. (There is no area which is automatically assigned.)
•
ATTENTION
•
The mapping setting data specified using the Map command is not reflected to the Emem dialog
27
•
box.
Set the emulation memory areas in the order of usage priority. The emulation memory areas to be
set by the Map command are numbered, ignoring the unused (Not Use) areas. Accordingly, the
emulation memory areas set in the Emem dialog box and the emulation memory area numbers
set by the Map command will be mismatched.
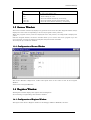
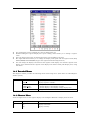
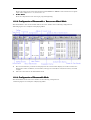
3.2 PD30
3.2.1 Specify the Memory Mapping
Please set the memory mapping as follows.
Area
Mapping
Note
SFR
External
Internal RAM
Internal
Internal ROM
Internal
External ROM
External
Memory Expansion Mode, Microprocessor Mode
Please use the MAP command to change the memory mapping.
Note
•
•
•
•
•
•
The emulator temporarily uses the area from FFFCh to FFFFh as a stack. Set this area as
Internal.
If you want to set this area to External be sure to prepare read-/write-unprotected memory for
the area.
When using the memory space expansion function on the M16C/62 Series microcomputer, set the
areas whose addresses are duplicated to External (The duplicated area depends on memory).
Memory space expansion mode 1: 4000h to 2FFFFh
Memory space expansion mode 2: 40000h to BFFFFh
28
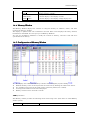
4 Environmental Setting of Debugger
4. Environmental Setting of Debugger
Specify debugger environment setting in the Customize dialog. You can open this dialog by selecting
menu - [Environment] -> [Customize...]. The data set in this dialog remains effective for the next start.
Please click the tab name about details.
Tab
Contents
Shortcut Key
Register the menus to the shortcut keys
Download
Automatically Down-load of the Load Module
Setting the number of load module download histories
Font
Specify the font
Specify the Displaying Tab Width
Path
Specify the Search Path of Source Files
Specify the Saving Directory of Information File
Tool Entry
Secify the make file
Specify the Editor
Other
Display the Termination Confirmation Dialog
Debugger Forced Ending when Error Occurs
Target Continuance Execution when Debugger Ends
Display the Absolute Path of Source File
29
Control the Display Mode Switching of Program Window
Execution History of Script Command
Number of Label Displays of Address Setting Area
You can also customize the buttons in the tool bar.
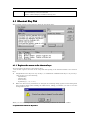
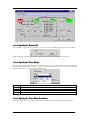
4.1 Shortcut Key Tab
The specified content becomes effective when the next being start.
4.1.1 Register the menus to the shortcut keys
You can register the menus to the shortcut keys.
You can also register execution of the script file and opening of the Custom window to the shortcut
keys.
•
Assignable shortcut keys are any one key*, or combination of Shift/Ctrl/Alt keys + any one key*.
*Any one key covers the following.
- Alphabet key
- Numeric key
- Function key
- Symbol key(",", "@", ":" etc.)
•
When the shortcut key information is changed, the following dialog appears when exiting from
the Customize dialog (when clicking the "OK" button). asking you whether you want to save the
changed data or not.
When you save the changed data, the data is automatically loaded at the next start of PDxx.
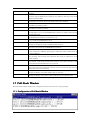
<< Specification of Shortcut Key Tab >>
30
4 Environmental Setting of Debugger
Key Assign Group
Category combo box
Displays the menu category. The enabled menus in the selected category are displayed in the
Menu List list box.
• The category name [Main Menu] indicates all the menus except the option menus of each
window.
• When the category of the window name is selected, the menu options available in that
window become enabled.
• When the category name [Custom Window] is selected, the registered Custom windows
become enabled.
• When the category name [Script Command] is selected, the registered script commands
become enabled.
Menu List list box
Lists the menus enabled in the menu category selected in the Category combo box. The listed
menus are sorted in the alphabet order.
Key Edit box
Specifies the shortcut key to be assigned to the menu selected in the Menu List list box.
Current Key Assign list box
Displays the shortcut key to be assigned to the menu selected in the Menu List list box.
ADD button
Enables the shortcut key specified in the Key Edit box.
DEL button
Disables the shortcut key selected from the Current Key Assign list box.
Current Shortcut Key List group
Lists the preset shortcut keys.
SAVE button
Saves the shortcut key information displayed in the Current Shortcut Key List group in a file.
LOAD button
Reads the shortcut key information from a file.
SCR button
Registers a script to be assigned to the shortcut key.
CB button
Registers the Custom window to be assigned to the shortcut key.
<< Registering the shortcut key >>
1. Select the category of the menu to be registered in the Category combo box in the Key Assign
group. The menus available for the category are displayed in the Menu List list box.
2. Select the menu to be registered from the Menu List list box and click the Key exit box. PDxx
is now waiting for the entry of shortcut key.
3. Press the shortcut key to be assigned. The content of the shortcut key is displayed in the Key
edit box.
4. Click the ADD button below the Current Key Assign list box.
<< Deleting the shortcut key >>
1. Select the shortcut key to be deleted using one of the following methods:
• Select the shortcut key from the list in the Current Shortcut Key List group.
• Select the Menu List list box in the Key Assign group.
2. Click the DEL button in the Current Shortcut Key List group.
<< Saving/reading the shortcut key >>
To use (save/read) the assigned shortcut key information separately, you need to specify the file.
31
Click the SAVE button and specify the file name.
To read the shortcut key information, click the LOAD button and specify the file name.
All of the registered shortcut key information is deleted.
ATTENTION
•
•
•
You cannot assign the same shortcut key to multiple menus. If you register the assigned key, the
information on the previously assigned shortcut key is overwritten.
The shortcut key is enabled only for the active window. If two or more same windows are opened,
the shortcut key is not reflected to all of them.
If the same menu (Change Font, etc.) exists between the windows, the menu is enabled in all the
windows having that menu.
4.2 Download Tab
The specified content becomes effective when the next being start.
4.2.1 Automatically Down-load of the Load Module
When the downloaded load module is updated by re-compile assemble, the file can be autodownloaded.
The load module is updated at timing when it is operated by a command of execution group (Go, Step,
etc.).
In the Auto Download group, select any one of the following ("Disable" is selected by default.)
Enable (with confirmation)
Asks for confirmation at auto-download.
Enable (without confirmation)
Does not ask for confirmation at auto-download.
32
4 Environmental Setting of Debugger
Disable
Does not auto-download the load module file.
4.2.2 Setting the number of load module download histories
You can set the number of load module download histories ("4" is set by default).
Specify the number of histories in the File History Number field in the File History group. You can
specify the number from 1 to 16.
Furthermore, if the debugger fails to redownload a file from the download history, you can choose
whether or not to leave the history of that file. (By default, the file is left.) If you want to delete the
history, select the check box shown above.
4.3 Font Tab
The specified content becomes effective when the next being start.
4.3.1 Specify the font
Specify the default font for the characters displayed by PDxx.
Click the "Font..." button. The font selection dialog opens. Enter the font and font size.
Note
You can set the font independently in each window. With the target window active, select [Option]>[Font...] from the menu in the PDxx Window to open the font selection dialog.
4.3.2 Specify the Displaying Tab Width
In a window which displays the source files (Program Window, Coverage source window, etc.), you can
specify the display tab width.
Specify the default tab values for the Program Window, Source Window. You can specify TAB values
between 1 and 32.
Note
You can set the tab width by window.
Select the PDxx window Menu - [Option] -> [TAB] while the target window is active.
The TAB designation dialog is opened.
33
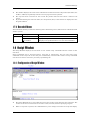
4.4 Path Tab
The specified content becomes effective when the next being start.
4.4.1 Specify the Search Path of Source Files
You can specify the directory position (search path) of the source file to be displayed in a window such
as the Program Window.
This method is useful when the source file does not exist in the current directory or divided into
multiple directories.
To register the search path, click the Add... button in the File Search Path group.
The folder selection dialog is opened.
Specify the directory in which the source file exists.
To delete a certain search path, click the target search path and click the Delete button.
To delete all the search paths, click the Delete All button.
4.4.2 Specify the Saving Directory of Information File
You can specify the directory in which the ASM/C watch point information file and other information
file are saved.
Other files cover the following:
• Script command execution history file
• Break information file
The default saving destination directory of the ASM/C watch point information file is a directory in
34
4 Environmental Setting of Debugger
which the load module exists.
The default saving destination directory of other information file is a directory in which PDxx has
been installed (example: c:¥mtool¥pdxx(sim)).
To change the directory in which the ASM/C watch point information file is saved, reset a check mark
from the "Use the same directory as the absolute module file" check box in the Directory Setting group.
Then, the "Watch Points:" field is enabled.
Click the Refer... button on the right of the "Watch Points:" field and specify the saving destination
directory from the Directory Selection dialog.
To change to directory in which other information file is saved, click the Refer... button on the right of
the "Other Settings:" field and specify the saving destination directory from the Directory Selection
dialog.
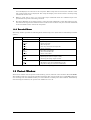
4.5 Tool Entry Tab
The specified content becomes effective when the next being start.
4.5.1 Starting the make command
First, prepare a PIF file from which to start the make command.
To create a PIF file, see "Creating a PIF file".
Click the Refer button in the Make group. The Directory Selection dialog is opened.
Specify the directory in which the Make file exists.
Name the PIF file to be registered in the PIF Filename field.
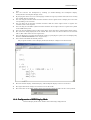
4.5.1.1 Create a PIF File
1.
2.
3.
4.
Create a keyboard shortcut for command.com located in the Windows directory.
Command.com is in the Windows directory in Windows95/98. It is in the system32 directory
(The example:¥winnt¥system32) under the Windows directory in Windows NT 4.0/2000/XP.
For the keyboard shortcut thus created, assign a file name xxxxx.pif(xxxxx denotes a name
specified by the user) and moves the file into the directory that contains makefile.
Open the property dialog box for PIF files and enter the make command to execute on the
command line.
35
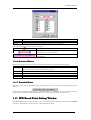
4.5.2 Specify the Editor
You can start the Editor in a window which displays the source file (Program window, Coverage source
window).
Click the Refer button in the Editor group. The File Selection dialog is opened.
Specify the item file of the editor to be used.
Specify the editor parameter in the Argument field.
File names are stored in "%F", and line numbers are stored in "%L".
To specify the editor options, see the Editor Manual/Help.
4.6 Other Tab
The specified content becomes effective when the next being start.
36
4 Environmental Setting of Debugger
4.6.1 Display the Termination Confirmation Dialog
The on-completion confirmation dialog box can be disabled from being opened when the debugger is
closed. (By default, it is opened.)
To keep the dialog closed, remove a check mark from the above check box in the Exit group.
4.6.2 Debugger Forced Ending when Error Occurs
You can set a parameter so that the debugger will not be forced to end when an communication error
occurs. (The debugger is forced to end by default.)
To do this, remove a check mark from the above check box in the Exit group.
4.6.3 Target Continuance Execution when Debugger Ends
When exiting from the debugger during execution of the target program, you can select to continue
execution or stop execution of the emulator. (The emulator is stopped by default.)
To continue execution, remove a check mark from the above check box in the Exit group.
ATTENTION
The target program which is executed continuously cannot be re-controlled next time the debugger
gets started.
To start the debugger, press the system reset switch on the emulator to reset the target program.
4.6.4 Enabling multiple startup
Multiple PDxx startup can be enabled (By default, multiple startup is disabled.).
37
To enable multiple startup, check the above check box included in the Exit group.
4.6.5 Display the Absolute Path of Source File
If the file name is shown with a path on the title bar of the Program (Source) window, you can choose
to omit the path and show only the file name.
To hide the file path, check the above check box in the Other Setting group.
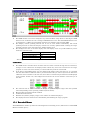
4.6.6 Control the Display Mode Switching of Program Window
You can set switching of the display mode at stop of the target program to "Suppress" (keep the current
display mode) in the Program window. (However, the display mode may be switched depending on
where the target program is stopped.)
To control the display mode switching, check the above check box in the Other Setting group.
4.6.7 Execution History of Script Command
You can save the execution history of the script command. (Ten sets of history data are saved by
default.)
To change the history of script commands, specify the number of history in the Number of Commands
field. (0 to 100) To clear history of script commands, remove a check mark from the above check box in
the Other Setting group.
4.6.8 Source file update warning
If any source file exists that has been updated after creating the target program, an warning dialog
box can be displayed when issuing the commands associated with target execution. (Warned, by
default)
If source file update warnings are unnecessary, uncheck the above check box. If the check box is
checked, the warning dialog box shown below appears.
Choosing "No" in this warning dialog box cancels the target execution command that was going to be
issued. Build and download the target program.
Choosing "Yes" accepts the target execution command that was going to be issued, so that the
command is processed normally. From the next time on (until the next time downloading is processed),
38
4 Environmental Setting of Debugger
no warnings will be displayed even when using target execution commands.
If the warning dialog box is closed by checking the Next Hide check box, no source file update warnings
are displayed from the next time on (This is the same as when the Warn to update the target program
check box is unchecked.).
4.6.9 Label List Display in Address Setting Field
It is possible to cease to display the label list in the address setting field of each dialog. (For the default,
up to 30,000 labels are displayed in the label list.)
To cease to display the label list, remove the check mark from the above check box. To change the
number of label displays, designate the number of labels in the "Number of Labels" field (0-30,000).
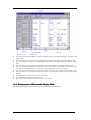
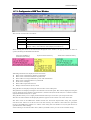
4.7 Customizing of Toolbar
The toolbar buttons on each window can be customized. To customize any button, right-click on the
window's toolbar. The popup menu shown below appears.
Flat Style
Flattens the button when checked.
Text Labels
Shows text below the button when checked.
Labels on right side
Shows text to the right of the button when checked.
Customize...
Opens a toolbar customize dialog box.
For details about the toolbar customize dialog box, see "Assigning Buttons to the Toolbar."
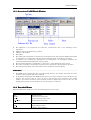
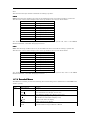
4.7.1 Assigning Buttons to the Toolbar
To do this, double-click an area in which no button is placed in the tool bar in the window. The
Customize Tool Bar dialog opened.
•
•
The buttons corresponding to the option menus in the window are provided.
You can only add the buttons which are enabled in each window. You cannot add the buttons for
other windows.
39
4.7.2 Adding a button
Click the buttons to be added in the "Available Button" list box at right of the Customize Tool Bar
dialog. Then, click the "Add" button in the center of the dialog.
4.7.3 Deleting a button
Click the button to be deleted int "Tool Bar Button" list box at left of the Customize Tool Bar dialog.
Then, click the "Delete" button in the center of the dialog.
4.7.4 Changing the button display order
Use the "Up" button or "Down" button at right of the dialog to change the display order. Click the
button for which the display order is to be changed in the "Tool Bar Button" list box at left of the
Customize Tool Bar dialog. Then, click the "Up" or "Down" button to change the display position.
4.7.5 Resetting the display buttons
Click the "Help" button at right of the dialog. The display buttons are reset to the default settings.
40
5 Ending the Debugger
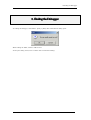
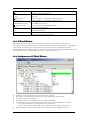
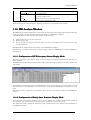
5. Ending the Debugger
To ending the debugger, select Menu - [File] -> [Exit]. The Confirmation dialog opens.
When ending the PDxx, click the "OK" button.
To keep the dialog closed, refer to "Other Tab of Customize Dialog".
41
[MEMO]
42
Reference
43
44
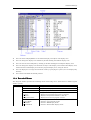
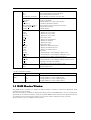
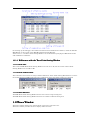
1 Windows/Dialogs
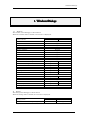
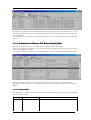
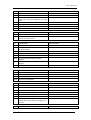
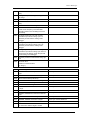
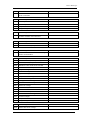
1. Windows/Dialogs
• Windows
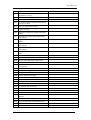
The window of this debugger is shown below.
When the window name is clicked, the reference is displayed.
Emulator
PC4701U/M/HS
PC4701L
Support
Support
Support
Support
Support
Support
Support
Support
Support
Support
Support
Support
Support
Support
Support
Support
Support
Support
Support
Support
Support
Support
Support
Support
Support
Support
Window Name
PDxx Window
Program Window
Source Window
Register Window
Memory Window
RAM Monitor Window
ASM Watch Window
C Watch Window
Call Stack Window *1
Script Window
S/W Break Point Settiong Window
H/W Break Point Settiong Window
Trace Point Setting Window
Protect Window
Trace Window
Data Trace Window
Coverage Window
Time Measurement Window
MR Window
MR Trace Window
MR Analyze Window
MR Task Pause Window
Task Trace Window
Task Analyze Window
GUI Input Window
GUI Output Window
•
Dialogs
The dialog of this debugger is shown below.
When the dialog name is clicked, the reference is displayed.
Dialog Name
H/W Break Point Setting Dialog Box[L]
Emulator
PC4701U/M/HS
PC4701L
Support
45
1.1 PDxx Window
The PDxx Window is the main window for PDxx. This window displays the main commands on a
toolbar. You can click on the buttons on this toolbar to run the target program in normal or one-step
mode. The main display area accommodates windows such as the Target Program Window.
1.1.1 Configuration of PDxx Window
•
•
•
•
•
•
•
•
The main commands, such as execution/stop of the target program and step execution, are
allocated to the tool bar.
The Option menu is dependent on the active window. When the active window is changed, the
Option menu is automatically changed.
The status bar at the bottom of the PDxx window shows the following information:
Explanation/display of menus and buttons
Display the communication interface
Execution time required from start to end of the target program execution
Execution state of the target program (during execution or execution stopped)
Display the Cause of the Program Stoppage
1.1.2 Tool Bar
A basic operation is allocated to the toolbar.
46
1 Windows/Dialogs
Button
Button Name
Go
Contents
Execute target Program
Come
Execute the target program from the value in the program counter to the
position of the cursor
Step
One-step execution of target program
Over
Step over function/subroutine call
Return
Run the program up to the higher routine
Stop
Stop execution of the target program
Break
Set the position of the cursor in the window as the software breakpoint
Reset
Reset the target program
SW
Set S/W breakpoint
HW
Set H/W breakpoint
1.1.3 Option
In the PDxx window, the following menus are prepared.
File Operation
Menu
Menu Options
File
Download
Load Module...
Memory Image...
Symbol...
Rom Data...
Reload...
Upload...
Save Disasm...
(Download File)
Exit
Editing
Menu
Edit
Display
Menu
Function
Download target program.
Download machine language data and debugging information.
Download only machine language data .
Download only debugging information.
Additional download machine language data
Reload target program.
Upload target program.
Save disassembly result.
List the file name of target program downloaded.
Terminate PDxx.
Menu Options
Copy
Paste
Cut
Delete
Undo
Find...
Function
Copy character strings specified to clipboard.
Paste character strings of clipboard.
Cut character strings specified to clipboard.
Cut character strings specified
Undo of edit
Find character strings.
Menu Options
Function
47
View
Tool Bar
Status Bar
Tool Bar(Child)
Setup
Menu
Menu Options
Environment Init...
Start Up...
Customize...
Switch display or non-display of toolbar.
Switch display or non-display of status bar.
Switch display or non-display of toolbar(child window).
Function
Environment setup(open the Init dialog box)
Startup function settings
Open Customize dialog box.
Debugging (Basic)
Menu
Menu Options
Debug
Go
Go
Go Option...
GoFree
Come
Step
Step
Step Option...
Over
Over
Over Option...
Return
Reset
Stop
Break Point
S/W Break Point...
H/W Break Point...
Break
Trace Point...
Scope...
Make
Function
Start target program.
Run from current program counter.
Run from specified address.
Free-run target program.
Run to cursor position.
Step execution.
Execute one step.
Execute specified No. of steps.
Over-step execution.
Execute one over-step.
Execute specified No. of over-steps.
Execute until return from current subroutine.
Reset target program.
Stop target program.
Set break point.
Open S/W Break Point Setting Window.
Open H/W Break Point Setting Window.
Set/cancel software break at cursor.
Open Trace Point Setting Window.
Open Scope Setting dialog box
Make target program
Debugging (Option)
Menu
Menu Options
Function
Option
The content of option menu depends on the active window.
The content of the menu changes automatically when an active window changes.
Please refer to the reference of each window for the content of the menu of each
window.
Window Operations (Basic Window)
Menu
Menu Options
Basic
Cascade
Windows
Tile
Arrange Icon
Program Window
Source Window
Register Window
Memory Window
RAM Monitor Window
ASM Watch Window
C Watch Window
Call Stack Window
Function
Cascade windows.
Tile windows.
Arrange icons.
Make Program Window active.
Open Source Window.
Open Register Window.
Open Memory Window.
Open RAM Monitor Window.
Open ASM Watch Window.
Open C Watch Window.
Open Call Stack Window
48
1 Windows/Dialogs
Script Window
Open Script Window
Window Operations (Optional Window)
Menu
Menu Options
Optional
Protect Window
Windows
H/W Break Point Setting Window
Trace Point Setting Window
Trace Window
Data Trace Window
Coverage Window
Time Measurement Window
Realtime OS Windows
MR Window*
MR Trace Window*
MR Analyze Window*
MR Task Pause Window*
Task Trace Window
Task Analyze Window
GUI Windows
GUI Input Window
GUI Output Window
Custom Windows
Option
(Custom Window)
*Does not exist according to the product.
Help
Menu
Help
Menu Options
Contents
Active Window
About...
Function
Open Protect Window.
Open H/W Break Point Setting Window.
Open Trace Point Setting Window.
Open Trace Window.
Open Data Trace Window.
Open Coverage Window
Open Time Measurement Window
Real-time OS Windows
Open MR Window
Open MR Trace Window
Open MR Analyze Window
Open MR Task Pause Window
Open Task Trace Window
Open Task Analyze Window
GUI Widows
Open GUI Input Window
Open GUI Output Window
Custom Windows
Entry Custom Window
Open the custom window
Function
Display Help.
Display Help of Active Window.
Display version information
1.1.4 Display the Cause of the Program Stoppage
If the program is stoped by the emulator's debug function, the cause of the stoppage is displayed in the
PDxx window's status bar.
Display
Forced,
Program,
Event, Combination,
The cause of the stoppage
Forced break from the front end
Hardware break, logical combination AND or AND(same time)
condition was met
Event, Combination, Ax,
Hardware break, logical combination OR condition was met
(Ax:The event number of which condition was met.)
Event, Sequential, from xx, Hardware break, State Transition condition was met
(from xx:previous state (start, state1, state2))
Event, Sequential, Timeout, Hardware break, State Transition, Time Out condition was met
Event, Access Error,
Protect break
49
1.2 Program Window
The Program window always displays the source file corresponding to the current program counter
position.
This window is opened automatically at start. The background of the program counter position is
displayed in yellow.
This window allows you to execute the source program up to the cursor position, set/reset the software
breakpoint, and perform line assemble.
The Program window provides the three display modes as below:
• Source display mode
Displays the source file of the target program.Can also be used to edit the source file.
• Disassemble Mode
Displays the disassemble result of the target program.
• MIX display mode
Displays the source file of the target program and its disassemble result in a mixed style.
1.2.1 Configuration of Source Display Mode
The program window has the following two source display modes. These display modes can be changed
from menus on the program window.
• Debug mode This mode is used to debug (e.g., run or stop) the target program.
• Edit mode This mode is used to edit the source file.
The program window's source display mode (debug mode) is configured as shown below.
•
•
•
You can switch "Display/Hide" for the line number display area/address display area.
You can change the source file to be displayed by double-clicking the line number display area.
You can change the display start address/display start line by double-clicking the address display
50
1 Windows/Dialogs
•
•
•
•
•
•
•
•
•
•
•
•
area.
You can set/reset the breakpoint by clicking (or double-clicking) the breakpoint display
area(Contents of breakpoint display area).
By staying the mouse cursor on a C language variable for a given period of time (about 0.5 second),
the variable data is popped up.
You can drag the function name and then click the mouse right button to display the source file
corresponding to the function.
You can drag the C language variable and then click the mouse right button to register the
variable as the C watch point.
You can drag the assembler symbol and then click the mouse right button to register the symbol
as the ASM watch point.
You can open the displayed source file on the editor. (You must have registered the editor name.)
The source file being displayed can be edited. The source file can also be edited on an external
editor. (The editor name must be registered.)
You can display the coverage measurement result by specifying the option. (It is not displayed by
default.) (PD32R/PD32RM does not support this.)
You can line-assemble the clicked position.
The program window's source display mode (edit mode) is configured as shown below.
The line number display, address display, and breakpoint display areas are not shown.
The right-click menu changes for exclusive use in edit mode.
The status bar on the PDxx window shows the line and column numbers of the cursor position.
1.2.2 Configuration of MIX Display Mode
The mix display mode of the window is the following configurations.
51
•
•
•
•
•
•
•
•
•
•
You can switch "Display/Hide" for the line number display area/address display area/object code
display area.
You can change the source file to be displayed by double-clicking the line number display area.
You can change the display start address/display start line by double-clicking the address display
area.
You can set/reset the breakpoint by clicking (or double-clicking) the breakpoint display area.
You can change the display ratio between the object code display area and the label display area,
and between the label display area and the program display area, using the mouse.
You can open the displayed source file on the editor. (You must have registered the editor name.)
You can display the coverage measurement result by specifying the option. (It is not displayed by
default.)
The MIX display result can be saved as a text file.
You can line-assemble the clicked position.
You can scroll the display up/down in units of source line.
1.2.3 Configuration of Disassemble Display Mode
The disassemble display mode of the window is the following configurations.
52
1 Windows/Dialogs
•
•
•
•
You can switch "Display/Hide" for the address display area/object code display area.
•
You can display the coverage measurement result by specifying the option. (It is not displayed by
default.)
•
You can line-assemble the clicked position.
You can change the display start address by double-clicking the address display area.
You can set/reset the breakpoint by clicking (or double-clicking) the breakpoint display area.
You can change the display ratio between the object code display area and the label display area,
and between the label display area and the program display area, using the mouse.
1.2.4 Extended Menus
The Program window provides the following menu when being active. (This menu is called Program
window option.)
Menu
Menu Options
Function
Option
Font...
Change font.
TAB...
Set source file display tabs.
Color...
Change display color
View
Change contents of display.
Display from specified source file or function.
Source...
Display from specified address or line No.
Address...
Display from current program counter.
Program Counter
Mode
Switch display mode.
Switch to source display mode.
Source Mode
Switch to MIX display mode.
Mix Mode
Switch to disassemble display mode.
Disasm Mode
53
Layout
Line Area
Address Area
Code Area
Line Assemble...
Save Mix...
Coverage
On/Off
Base...
Clear
Refresh
Edit
On
Save
Save As...
Save All
Set layout.
Switch display or non-display of line No. area.
Switch display or non-display of address area.
Switch display or non-display of object code area.
Open Line Assemble dialog.
Saves MIX display result
Set Coverage measurement.
Switch display or non-display of Measurement result.
Change coverage base address
Initialize coverage measurement result
Update display of coverage measurement result
Edit functions
Turns editing on or off
Saves the edited contents by overwriting
Saves the edited contents with another name
Saves all of the edited contents by overwriting
1.2.5 Shortcut Menu
The Program window provides the shortcut menu by clicking the mouse right button within the
window. (This menu is called Program window right-click menu.)
The menu content varies depending on the clicked position.
When right-clicking the line number display area or address display area
The shortcut menu same as the option menu appears.
When right-clicking the breakpoint display area
The shortcut menu does not appear. Hardware break can be set.
When right-clicking other area
The following shortcut menu appears.
(Debug Mode)
Menu
Menu Options
Right-Click Jump to function
Open Source Window
Set PC here
Add C Watch...
Add C Watch Pointer..
Add ASM Watch
BitAdd ASM Watch
Open Editor
Line Assemble...
Save Mix...
Edit
On
(Edit mode)
Menu
Right-Click
Menu Options
Copy
Paste
Cut
Delete
Undo
Find
Function
Display the selected function
Display the selected function (by Source Window)
Sets the PC at the cursor position
Register the C watch point on selected variable
Register the C watch point on selected pointer variable
Register the ASM watch point on selected symbol
Register the ASM watch point on selected bit symbol
Open the source file by the editor
Open the Line Assemble dialog.
Saves MIX display result
Edit functions
Turns editing on or off
Function
Same [Edit]->[Copy] menu.
Same [Edit]->[Paste] menu.
Same [Edit]->[Cut] menu.
Same [Edit]->[Delete] menu.
Same [Edit]->[Undo] menu.
Find character strings.
54
1 Windows/Dialogs
Font
Tab
Edit
On
Save
Save As...
Save All
Change font.
Set source file display tabs.
Edit functions
Turns editing on or off
Saves the edited contents by overwriting
Saves the edited contents with another name
Saves all of the edited contents by overwriting
1.3 Source Window
The Source window continuously displays any position of the source file. (The Program window always
displays the source file corresponding to the current program counter position.)
When the program counter points the displayed source file position, its background is displayed in
yellow.
Like the Program window, the Source window allows you to execute the source program up to the
cursor position, set/reset the software breakpoint and perform line-assemble.
You can open up to 30 Source windows.
1.3.1 Configuration of Source Window
The Source Window configuration, toolbar and option menu is the same as that in the Program
Window.
Please refer to Program Window.
1.4 Register Window
The Register window displays the register data and flag data.
You can change a register/flag value from the window.
1.4.1 Configuration of Register Window
The figure below shows a Register window of the debugger PD30 for M16C/60, 20 series.
55
•
•
•
•
•
If a register/flag value is changed, the value is displayed in red.
Double-clicking the register display line opens a dialog, which allows you to change a register
value.
You can change a flag value by clicking the button corresponding to the flag.
The right-click menu allows you to change the display radix point and the register bank. (Only
PD308(F/SIM) and PD30(SIM) support the register bank switching function.)
You can change the display ratio between the register name display area and the register value
display area, and between the register value display area and the radix point display area, using
the mouse.
1.4.2 Extended Menus
The Register window provides the following menu when being active. (This menu is called Register
window option.)
Menu
Option
Menu Options
Bank0
Bank1
Layout
Hide Radix
Hide FLAGs
Font...
Function
Display registers of bank 0.
Display registers of bank 1.
Set layout
Switch display or non-display of radix.
Switch display or non-display of flags display area.
Change font.
1.4.3 Shortcut Menu
Press the right button on the register display area in Register Window to display shortcut menu.
Menu
Right Click
Menu Options
Hex
Dec
Bin
Function
Display in hexadecimal.
Display in decimal.
Display in binary.
56
1 Windows/Dialogs
Bank0
Bank1
Layout
Hide Radix
Hide FLAGs
Font...
Display registers of bank 0.
Display registers of bank 1.
Set layout.
Switch display or non-display of radix
Switch display or non-display of flags display area.
Change font.
1.4.4 Memory Window
The Memory Window displays the contents of contiguous memory in "address", "label", and "data
(contents of memory)" formats.
The display is updated after each command is executed. Data can be displayed in binary, decimal,
hexadecimal, and ASCII. You can open up to 30 Memory Windows.
You can use the Memory Windows to modify the contents of memory, and also to fill and move
specified blocks of memory.
1.4.5 Configuration of Memory Window
•
•
•
•
•
The display start address and memory contents can be changed by in-place editing.
Different memory areas can be inspected at the same time by dividing the window into halves.
It is possible to keep track of the stack pointer position (by default, not tracked).
Coverage measurement results can be displayed.
Memory contents can be stored in a text file.
1.4.6Option Menu
The Memory window provides the following menu when being active. (This menu is called Memory
window option.)
Menu
Menu Options
Function
57
Option
Set data at specified address.
Set...
Fill specified memory block with data.
Fill...
Move specified memory block to
Move...
Save Memory Contents... Saving Memory Contents in a Text File
Address...
Specify display starting address.
Specify scroll range.
Scroll Area...
Starting address to value of the register.
Register
(Product dependence menu)
(xxxxx) *1
Followed Stack Pointer... Keep tracking of the stack pointer position.
Startup label settings
Set Start Up Symbol...
Refresh display.
Refresh
Data Length
Specify data length.
Byte
Display in 1-byte units.
Word
Display in 2-byte units.
Lword
Display in 4-byte units.
Radix
Specify data radix.
Display in hexadecimal.
Hex
Display in decimal.
Dec
Display in binaly.
Bin
Specify data code.
Code
Display as ASCII characters.
ASCII
Display as SJIS characters.
SJIS
Display as JIS characters.
JIS
Set layout.
Layout
Switch display or non-display of Label area.
Label
Switch display or non-display of Register area.
Register
Changing the number of digits displayed
Column...
Coverage
Set Coverage measurement.
Switch display or non-display of Measurement result
Enable
Change coverage base address
Base
Initialize coverage measurement result
Clear
Font...
Change font
Change display color
Color...
These menus can be selected even by the short cut menu by a right click in the window.
*1
Product Dependence Menu
Product
Menu
PD308
FB
PD30
SB
USP
ISP
Function
Starting address to value of FB register.
Starting address to value of SB register.
Starting address to value of USP register.
Starting address to value of ISP register.
1.5 RAM Monitor Window
The RAM monitor window is a window in which changes of memory contents are displayed while
running the target program.
The relevant memory contents are displayed in dump form in the RAM monitor area (in varying sizes
depending on the emulator used) by using the realtime RAM monitor function. The displayed contents
are updated at given intervals (by default, every 100 ms) while running the target program.
For the PC4701, up to 10 windows can be opened.
58
1 Windows/Dialogs
•
•
•
The RAM monitor area can be changed to any desired address range. Refer to "Setting the RAM
monitor area" for details on how to change the RAM monitor area. The default RAM monitor area
is mapped into a 1-Kbyte area beginning with the start address of the internal RAM.
The display content updating interval can be set for each window individually. The actual
updating interval at which the display contents are actually updated while running the target
program is shown in the title field of the Address display area.
The background colors of the data display and code display areas are predetermined by access
attribute, as shown below.
Access attribute
Background color
Read accessed address
Green
Write accessed address
Red
Non-accessed address
White
The background colors can be changed.
ATTENTION
•
•
•
•
•
•
•
The RAM monitor window shows the data that have been accessed through the bus. Therefore,
changes are not reflected in the displayed data unless they have been accessed via the target
program as in the case where memory is rewritten directly from an external I/O.
If the data in the RAM monitor area are displayed in lengths other than the byte, it is possible
that the data will have different memory access attributes in byte units. If bytes in one data have
a different access attribute as in this case, those data are enclosed in parentheses when displayed
in the window. In that case, the background color shows the access attribute of the first byte of
the data.
The interval time at which intervals the display is updated may be longer than the specified
interval depending on the operating condition (shown below).
Host machine performance/load condition
Communication interface
Window size (memory display range) or the number of windows displayed
The displayed access attributes are initialized by downloading the target program.
1.5.1 Extended Menus
The RAM Monitor window provides the following menu when being active. (This menu is called RAM
Monitor window option.)
59
Menu
RAM Monitor Area...
Sampling Period...
Clear
Up
Down
Address...
ScrollArea...
Data Length
Radix
Code
Layout
Column...
Font...
Color...
Byte
Word
Lword
Hex
Dec
Bin
ASCII
SJIS
JIS
Label
Register
Function
Sets RAM monitor area
A window or dialog box in which you can change the RAM monitor area
is displayed.
Sets display updating interval
Sets an interval time at which intervals you want the display to be
updated while running the target program.
Clears access attribute
The data in all RAM monitor areas are cleared, as are the displayed
access attributes.
Moves display position to the immediately preceding RAM area (smaller
address)
The display position is moved forward (toward smaller addresses) to the
beginning of the RAM monitor area that immediately precedes the
current display position.
Moves display position to the immediately following RAM area (larger
address)
The display position is moved backward (toward larger addresses) to the
beginning of the RAM monitor area that immediately follows the
current display position.
Display from specified address.
Specify scroll range.
Display in 1-byte units.
Display in 2-byte units.
Display in 4-byte units.
Display in hexadecimal.
Display in decimal.
Display in binary.
Display as ASCII characters.
Display as SJIS characters.
Display as JIS characters.
Switch display or non-display of Label area.
Switch display or non-display of Register area.
Set up the number of column displayed on one line.
Change font.
Set color of access attribute display.
These menus can be selected even by the short cut menu by a right click in the window.
1.6 ASM Watch Window
The ASM watch window is a window in which you can register specific addresses as watchpoints and
inspect memory contents at those addresses.
If a registered address resides within the RAM monitor area, the memory content at that address is
updated at given intervals (by default, every 100 ms) during program execution. The toolbar buttons
may be used to perform the main functions.
60
1 Windows/Dialogs
1.6.1 Overview of ASM Watch Window
•
•
•
•
•
•
•
•
•
The addresses to be registered are called the "watchpoints." One of the following can be
registered:
Address (can be specified using a symbol)
Address + Bit number
Bit symbol
The registered watchpoints are stored in an environment setup file when the ASM watch window
is closed and are automatically registered in the debugger when the window is reopened.
If symbols or bit symbols are specified for the watchpoints, the watchpoint addresses are
recalculated when downloading the target program.
The invalid watchpoints are marked by "-<not active>-" when displayed on the screen.
The order in which the watchpoints are listed can be changed by a drag-and-drop operation.
The watchpoint symbols, sizes and radixes can be changed by in-place editing.
ATTENTION
•
•
The RAM monitor obtains the data accessed through the bus. Any change other than the access
from the target program will not be reflected.
If the display data length of the RAM monitor area is not 1 byte, the data's access attribute to the
memory may varies in units of 1 byte. In such a case that the access attribute is not unified
within a set of data, the data's access attribute cannot be displayed correctly. In this case, the
background colors the access attribute color of the first byte of the data.
1.6.2 Extended Menus
When the ASM watch window is active, the following menus can be used.
Menu
Add...
Add Bit...
Remove
Remove All...
Function
Add watch point.
Add bit-level watch point.
Remove selected watch point.
Remove all watch points.
Set...
Radix
Bin
Set new data to selected watch point.
Change display radix.
Display value in binary.
61
Display value in decimal.
Dec
Display value in hexadecimal.
Hex
Refresh
Refresh display.
Set layout.
Layout
Switch display or non-display of address/bit area.
Address Area
Switch display or non-display of data size area.
Size Area
RAM Monitor
Display RAM monitor.
Set RAM monitor area.
RAM Monitor Area...
Set sampling period for RAM monitor.
Sampling period...
Clear the access attribute.
Clear
Save...
Save the watch points.
Load the watch points.
Load...
Font
Change font.
Set color of access attribute display.
Color...
These menus can be selected even by the short cut menu by a right click in the window.
1.6.3 C Watch Window
The C Watch Window displays C/C++ expressions and their values (results of calculations).
The C/C++ expressions displayed in the C Watch Window are known as C watchpoints. The displays
of the results of calculating the C watchpoints are updated each time a command is executed.
When RAM monitor function is effective and the C watch points are within the RAM monitor area,
the displayed values are updated during execution of the target program.
1.6.4 Configuration of C Watch Window
•
•
•
•
•
•
Variables can be inspected by scope (local, file local or global).
The display is automatically updated at the same time the PC value changes.
Variable values can be changed.
The display radix can be changed for each variable individually.
Any variable can be registered to the Watch tab, so that it will be displayed at all times:
- The registered content is saved for each project separately.
- If two or more of the C watch window are opened at the same time, the registered
The C watchpoints can be registered to separate destinations by adding Watch tabs.
62
1 Windows/Dialogs
•
•
•
•
Variables can be registered from another window or editor by a drag-and-drop operation.
The C watchpoints can be sorted by name or by address.
Variable names can be searched.
Values can be inspected in real time during program execution by using the RAM monitor
function.
ATTENTION
•
•
•
•
•
•
You cannot change the values of the C watch points listed below:
- Bit field variables
- Register variables
- C watch point which does not indicate an address(invalid C watch point)
If a C/C++ language expression cannot be calculated correctly (for example, when a C/C++ symbol
has not been defined), it is registered as invalid C watch point. It is displayed as "--<not active>-". If that C/C++ language expression can be calculated correctly at the second time, it becomes an
effective C watch point.
The display settings of the Local, File Local and Global tabs are not saved. The contents of the
Watch tab and those of newly added tabs are saved.
The RAM monitor obtains the data accessed through the bus. Any change other than the access
from the target program will not be reflected.
The variables, which are changed in real-time, are global variables and file local variables only.
If the display data length of the RAM monitor area is not 1 byte, the data's access attribute to the
memory may varies in units of 1 byte. In such a case that the access attribute is not unified
within a set of data, the data's access attribute cannot be displayed correctly. In this case, the
background colors the access attribute color of the first byte of the data.
1.6.5 Extended Menus
The C Watch window provides the following menu when being active. (This menu is called C Watch
window option.)
Menu Options
Add...
Remove
Initialize
Set New Value...
Radix
Hex
Bin
Default
Refresh
Hide type name
Function
Registers a new C watchpoint
A new watchpoint can be registered by specifying its name in a dialog box.
The result is reflected in all C watch windows.
Deletes a selected C watchpoint
The watchpoint being selected by an active tab is deleted. The result is
reflected in all C watch windows.
Reevaluates a selected C watchpoint
The currently selected watchpoint is reevaluated. Use this function in cases
where variables although in the same name assume different types
depending on scope, or where when expanding more than 100 arrays, you
want to change a specified number of elements.
Change value
Change value of the selected C watch point.
Change radix
Change radix of the selected C watch point.
Display in HEX
Display the selected C watch ponit in hexadecimal.
Display in BIN
Display the selected C watch point in Binary.
Default radix
Display the selected C watch point in default radix.
Updates a variable value
Variable values are updated (a memory access occurs).
Turns type name display on/off
63
Type names are shown on the screen or hidden. The result affects all C watch
windows.
Show char* as string
Selects whether to display char* type as a string
The char* type is displayed as a string or as a pointer to char type. The result
affects the entire PDxx
Sort
Sorts C watchpoints
Watchpoints are sorted. The result affects all C watch windows.
Sort by Name
Sorts by name
Variables are sorted by name.
Sort by Address
Sorts by address
Variables are sorted by address.
RAM Monitor
Sets RAM monitor function
The debugger is set to use the RAM monitor function to update values during
program execution.
Enable RAM Monitor Enables RAM monitor function
The RAM monitor function is turned on or off.
RAM Monitor Area...
Set RAM monitor area
Set or modify the RAM Monitor Area.
Sampling Period...
Set sampling period
Change the sampling period for RAM monitor function.
Clear
Clear the access attribute
Clear the access attribute for RAM Monitor function.
Add New Tab...
Adds a watch tab
A new watch tab is added by specifying its name. The result is reflected in all
C watch windows.
Remove Tab
Deletes a displayed watch tab
The currently active watch tab is deleted. The result is reflected in all C
watch windows.
Save...
Saves active watch tab content to a file
The content of the active watch tab is saved to a file. The contents of the
Local, File Local and Global tabs are not saved.
Load...
Loads saved content to an active watch tab
The saved content is loaded from a file into the active watch tab. The result is
reflected in all C watch windows.
Font...
Change font
Change the display font. Each window has its own font.
Color...
Change color
Change the display colors. All C watch window uses the common colors.
These menus can be selected even by the short cut menu by a right click in the window.
1.7 Call Stack Window
The Call Stack window displays the C language function call state of the target program.
1.7.1 Configuration of Call Stack Window
64
1 Windows/Dialogs
•
•
•
The window displays the name of the called function and the function call position (file name, line
number, address) sequentially from the current program counter position.
The top line shows a function at the current PC position. The last line shows a function call
source.
By double-clicking the function name, the call position (line) of the function is displayed in the
Program window.
1.7.2 Extended Menus
The Call Stack window provides the following menu when being active. (This menu is called Call Stack
window option.)
Menu
Option
Menu Options
Function
Font...
Change font.
Jump
Displays the specified function on Program Window.
Displays the specified function on a new Source Window.
New window
These menus can be selected even by the short cut menu by a right click in the window.
1.8 Script Window
The Script Window displays the execution of text -format script commands and the results of that
execution.
Script commands can be executed using a script file or interactively. You can also write script
commands in the script file so that they are automatically executed. The results of script command
execution can also be stored in a previously specified log file.
1.8.1 Configuration of Script Window
•
The Script Window has a view buffer that stores the results of executing the last 1000 lines. The
results of execution can therefore be stored in a file (view file) without specifying a log file.
•
When a script file is opened, the command history area changes to become the script file display
65
area and displays the contents of the script file. When script files are nested, the contents of the
last opened script file are displayed. The script file display area shows the line currently being
executed in inverse vide.
•
When a script file is open, you can invoke script commands from the command input area
provided the script file is not being executed.
•
The Script Window can record the history of the executed commands to a file. This function is not
the same as the log function. This function records not the result but only the executed commands,
so the saved files can be used as the script files.
1.8.2 Extended Menus
The Script window provides the following menu when being active. (This menu is called Script window
option.)
Menu
Option
Menu Options
Function
Font...
Change font.
Script
Script file operations.
Open script file.
Open...
Run script file.
Run
One-step execution of script file.
Step
Close script file.
Close
View
View buffer operations.
Save view buffer file.
Save...
Clear view buffer .
Clear
Log
Log file operations.
Open log file (start output to file).
On...
Close log file (stop output to file).
Off
Record
Record the executed commands
Record the executed commands to a file.
On...
Stop Recording the executed commands.
Off
These menus can be selected even by the short cut menu by a right click in the window.
1.9 Protect Window
The Protect window sets the protect break (memory protect) function of the emulator PC4701U/M/HS.
This window cannot be used on the emulator PC4701L. The protect break area is a 256 KB continuous
area starting from the 64 KB boundary. Its start address is called protect base address. Immediately
after starting the emulator, the protect base address is set to 0h.
66
1 Windows/Dialogs
1.9.1 Configuration of Protect Window
•
•
•
The protect break function is disabled at start of the debugger.
Three types of protect break attributes are provided as below:
- Access Disable (read/write disabled, display in red)
- Read Only (write disabled, display in yellow)
- R/W Enable (read/write enabled, display in sky blue)
You can use the following two methods to set protect break.
- Specify from the target program session information.
- Specify the memory attribute of the desired address range.
1.9.2 Extended Menus
The Protect window provides the following menu when being active. (This menu is called Protect
window option.)
Menu
Option
Menu Options
Function
Font...
Change font.
Section
Set protect break attribute by the section information.
Set base address.
Base Address...
Set protect break attribute.
Attribute...
Switch break mode enable/disable.
Mode
These menus can be selected even by the short cut menu by a right click in the window.
1.10 Trace Point Setting Window
The Trace Point Setting window is used to set trace points. This window cannot be used on the
PC4701L emulator.
67
•
The events listed below can be specified as trace events. If the contents of events are altered, they
are marked by an asterisk (*) on the title bar. The asterisks (*) are not displayed after setting up
the emulator (simulator engine).
Product Name
Event
PD308
PD30
Fetch
X*
O
Memory Access
O
O
Bit Access
O
O
Interrupt
X
O
Trigger
O
O
*Can be substituted by memory access. (Access type = Read)
•
Events at up to six points can be used. These six events can be combined in one of the following
ways:
- Trace when all of the valid events are established (AND condition)
- Trace when all of the valid events are established at the same time (simultaneous AND
condition)
- Trace when one of the valid events is established (OR condition)
- Trace upon entering a break state during state transition (State Transition condition)
1.10.1 Specify the Trace Event
To set events, double-click to select the event you want to set from the event setting area of the Trace
Point Setting Window. This opens the dialog box shown below.
68
1 Windows/Dialogs
Following events can be set by specifying Event Type in this dialog box.
•
When FETCH is selected
Traces for the instruction fetch. (PD308 not support. When using these products, use memory
access instead.)
•
When DATA ACCESS is selected
Traces for the memory access.
69
•
When BIT SYMBOL is selected
Traces for the bit access.
•
When INTERRUPT is selected
Traces for the interrupt occurrence or termination. (PD308 not support.)
•
When TRIGGER is selected
Traces for the status of signal input from external trace cable.
70
1 Windows/Dialogs
1.10.2 Specify the Combinatorial Condition
To specify a combinatorial condition, specify the desired condition from the combinatorial condition
specification area.
•
When AND or OR is selected
In the event specification area, the event used and a pass count for that event can be specified. To
alter the pass count, while the event to alter is being selected, click the pass count value of that
event.
•
When AND (Same Time) is selected
In the event specification area, the event used can be specified. No pass counts can be specified.
•
When State Transition is selected
Click the Details... button, and the dialog box shown below appears. Specification by a state
transition diagram or sequential specification can be used. If the content of any event is altered, it
is marked with an asterisk (*) on the title bar. Once conditions are set in the emulator, asterisks
are not displayed. A time-out time in each state can also be specified.
71
1.10.3 Specify the Process ID
By specifying a process ID, it is possible to detect only event establishment under specific conditions.
Example: Enable only the event that occurs in a specific task when using the realtime OS.
1.10.4 Specify the Trace Range
For the emulator debugger PDxx, 32K cycles equivalent of data can be recorded. For the simulator
debugger PDxxSIM, as many cycles as specified on the Init dialog box's Trace tab can be recorded
(Descriptions below are written assuming 32K cycles).
Break
Before
About
After
Full
Stores the 32K cycles (-32K to 0 cycles) to the point at which the target program stops.
Stores the 32K cycles (-32K to 1 cycles) to the point at which the trace point is passed.
Stores the 16K cycles (-16K to 16K cycles) either side of the trace point.
Stores the 32K cycles (0 to 32K cycles) of trace data after the trace point.
Stores the 32K cycles (-32K to 0 cycles) of trace data after the trace starts.
1.10.5 Specify the Trace Write Condition
Conditions for cycles to be written to trace memory (32K cycles accommodated) can be specified.
72
1 Windows/Dialogs
Total
Pick up
Exclude
Writes all cycles.
Writes only the cycles where specified condition holds true.
Writes only the cycles where specified condition does not hold true.
Also, following three write modes are supported.
Only cycles where specified event is established
Cycles from where specified event is established to where
specified event is not established
Cycles from where start event is established to where end event
is established
1.10.6 Command Button
The buttons at the bottom of the Trace Point Setting window have the following meanings.
Button Name Content
Reset
Discards the contents being displayed in the window and loads contents from the
emulator (simulator engine) in which they were set.
Save...
Saves the contents set in the window to a file
Load...
Loads event information from a file in which it was saved
Set
Sends the contents set in the window to the emulator (simulator engine)
Close
Closes the window
1.10.7 Extended Menus
The Trace Point Setting Window has popup menus that can be brought up by right-clicking in the
window.
If this menu is checked, input history for address input is available in an event setting dialog box
opened from the Trace Point Setting Window. if not, the labels of program are listed for it.
1.11 H/W Break Point Setting Window
The H/W Breakpoint Setting window is used to set hardware breakpoints for the PC4701U/M/HS
emulators. This window cannot be used on the PC4701L emulator.
73
On starting up the debugger, the hardware break function is disabled. To enable it, check the “Enable
H/W Break” at the top-left of the H/W Break Point Setting Window.
Please refer to “1.16 Trace Point Setting Window” for the method of specifying the H/W break events
and combination conditions.
1.11.1 Differences with the Trace Point Setting Window
1.11.1.1 Event name
The events of H/W Break Point Setting Window are from A1 to A6, but the events of Trace Point
Setting Window are from B1 to B6.
1.11.1.2 Event enable check box
The real-time trace function is always enabled. Therefore, Trace Point Setting Window does not have
the enable check box. H/W break function is enabled only when the enable check box is checked.
1.11.1.3 Other differences
The H/W Break Point Setting Window does not have Trace range setting area.
The H/W Break Point Setting Window does not have Write condition setting area.
1.12Trace Window
The Trace window displays the measurement result of the real time trace.
The Trace window provides the three display modes as below:
74
1 Windows/Dialogs
•
•
•
•
Bus mode
Allows you to reference the bus information by cycle. The information is displayed in the order of
execution path.
Disassemble + Data access Mixed Mode
The executed instructions and the accessed data contents can be referenced together. The
contents are displayed in order of execution passes.
Disassemble Mode
Allows you to reference the executed command. The commands are displayed in the order of
execution path.
Source Mode
Allows you to reference the source program execution path. Operate the buttons in the tool bar to
reference the path.
The Trace window displays the measurement result when the real time measurement is completed. If
the real time measurement has not been completed, the Trace window displays nothing.
By default, 32 K cycles before the target program is stopped are recorded. (For the PDxxSIM, as many
cycles as specified on the Init dialog box's Trace tab are recorded.)
To change the trace measurement range to the desired event position, set the required data in the
Trace Point Setting window which enables more precise settings for trace events.
For details on the Trace Point Setting Window, see "Referencing the Trace Point Setting Window".
1.12.1 Configuration of Bus Mode
The bus mode of the trace window is the following configurations.
Following figures are examples of displaying PD30.
•
•
•
By double-clicking the cycle count display area, you can change the start cycle to be displayed.
By double-clicking the Address line in the bus information display area, you can search the
execution address.
You can change the display ratio between the label display area and the bus information display
area, using the mouse.
75
•
The lines in the bus information display area vary depending on the debugger that you are using.
For details, see below:
1.12.1.1Display of bus information on PD308
From left to right, the contents are as follows:
Address
The status of the address bus
• Data
The status of the data bus
• BUS
The width of the external data bus ("8b" for an 8-bit data bus, and "16b" for a 16-bit data bus)
• BIU
This shows the status between the BIU (bus interface unit) and memory, and BIU and I/O.
Representation
BIU status
No access
WAIT
Executing wait instruction
RBML
Read access (bytes, ML on)
F
Fetch access
QC
Discontinuous Fetch access (queue buffer)
RWML
Read access (words, ML on)
INT
Interrupt acknowledge
RB
Read access (bytes)
WB
Write access (bytes)
DRB
Read access by DMA (bytes)
DWB
Write access by DMA (bytes)
RW
Read access (words)
WW
Write access (words)
DRW
Read access by DMA (words)
DWW
Write access by DMA (words)
•
•
•
•
R/W
Shows the status of the data bus ("R" for r ead, "W" for wr it e, "-" for no access).
RWT
This signal shows the effective position in the bus cycle ("0" when effective. Address, Data, and
BIU signals are valid when RWT is "0".
CPU, OPC, OPR
This shows the signal between CPU and BIU. In the column "CPU", the data shows whether CPU
accesses BIU or not . In the Column "OPC", the data shows the byte size of read operat ion code.
In the Column "OPR", the data shows the byte size of read operand.
Representation
Status
CPU
OPC
OPR
Operation code size
Operand size
No accessing
CPU
0
1
0byte
1byte
CPU
0
2
0byte
2bytes
CPU
0
3
0byte
3bytes
CPU
1
0
1byte
0byte
CPU
1
1
1byte
1byte
CPU
1
2
1byte
2bytes
CPU
1
3
1byte
3bytes
CPU
2
0
2bytes
0byte
CPU
2
1
2bytes
1byte
CPU
2
2
2bytes
2bytes
CPU
3
0
3bytes
0byte
CPU
3
1
3bytes
1byte
76
1 Windows/Dialogs
•
•
•
•
DMA
DMA accessing
DMAT
DMA accessing(terminal count)
B-T
Shows the level of the external break trigger (the EXTIN7 pin of the external trace signal input
cable). High level = "1", Low level = "0".
Q-T
Shows the level of the external trace trigger (the EXTIN6 pin of the external trace signal input
cable). High level = "1", Low level = "0".
76543210
Shows the status of the 8-bit external signal (pins EXTIN0 to EXTIN7 of the external trace signal
input cable). High level = "1", Low level = "0".
h" m' s: ms.us
Show the elapsed time from the target program beginning.
1.12.1.2 Display of bus information on PD30
From left to right, the contents are as follows:
• Address
The status of the address bus
• Data
The status of the data bus
• BUS
The width of the external data bus ("8b" for an 8-bit data bus, and "16b" for a 16-bit data bus)
• BIU
This shows the status between the BIU (bus interface unit) and memory, and BIU and I/O.
Display format
Status
No change
DMA
Data access other than a CPU cause such as DMA
INT
Start of INTACK sequence
IB
Instruction code read due to CPU cause (bytes)
DB
Instruction data access due to CPU cause (bytes)
IW
Instruction code read due to CPU cause (words)
DW
Instruction data a ccess due to CPU cause (words)
• R/W
Shows the status of the data bus ("R" for read, "W" for write, "-" for no access).
• RWT
This signal shows the effective position in the bus cycle ("0" when effective. Address, Data, and
BIU signals are valid when RWT is "0".
• CPU
Shows the status between CPU and BIU (bus interface unit )
Display format
Status
No change
CB
Operation code read (bytes)
RB
Operand read (bytes)
QC
Instruction queue buffer clear
CW
Operation code read (words)
RW
Operand read (words)
• QN
Shows the number of bytes stored in the instruction queue buffer in the range 1 to 4.
• B-T
Shows the level of the external break trigger (the EXTIN7 pin of the external trace signal input
cable). High level = "1", Low level = "0".
• Q-T
Shows the level of the external trace trigger (the EXTIN6 pin of the external trace signal input
cable). High level = "1", Low level = "0".
• 76543210
77
•
Shows the status of the 8-bit external signal (pins EXTIN0 to EXTIN7 of the external trace signal
input cable). High level = "1", Low level = "0".
h" m' s: ms.us
Show the elapsed time from the target program beginning.
1.12.2 Configuration of Disassemble + Data access Mixed Mode
The disassemble + data access mixed mode of the trace window is the following configurations.
Following figures are examples of displaying PD30.
•
•
The accessed memory contents are displayed in the accessed data display area. The contents are
displayed in order of address, accessed data, and type of access (R for read, W for write), from left
to right.
The rest is the same as in disassemble mode.
1.12.3 Configuration of Disassemble Mode
The disassemble mode of the trace window is the following configurations.
Following figures are examples of displaying PD30.
78
1 Windows/Dialogs
•
•
•
By double-clicking the cycle count display area, you can change the start cycle to be displayed.
By double-clicking the address display area, you can search the execution address.
You can change the display ratio between the object code display area and the label display area,
between the label display area and the inverted-assemble result display area, and between the
inverted-assemble result display area and the execution time display area, using the mouse.
1.12.4 Configuration of Source Mode
The source mode of the trace window is the following configurations.
Following figures are examples of displaying PD30.
79
•
•
•
•
•
You can switch "Display/Hide" for the line number display area/address display area/object code
display area.
By double-clicking the line number display area, you can change the source file to be displayed.
By double-clicking the address display area, you can search the execution address.
By clicking the source file display area and then clicking the Come button, you can search the
address at the clicked position (Come search).
In the reference cycle position display area, the current cycle position is displayed as ">>". A
display of "-" indicates a line with the address information (a line for which Come search can be
executed).
1.12.5 Extended Menus
The Trace window provides the following menu when being active. (This menu is called Trace window
option.)
Menu
Option
Menu Options
Function
Font...
Change font.
TAB...
Set tabs for source file display.
View
Change contents of display.
Specify cycle.
Cycle...
Search cycle by specifying address.
Address Search...
Change by specifying source file.
Source...
Mode
Change display mode.
Select bus mode.
Bus
Select disassemble + data access mixed mode.
Mix
Select disassemble mode.
Disasm
Select source mode.
Source
Layout
Set layout.
Switch display or non-display of line No. area.
Line Area
Switch display or non-display of address area.
Address Area
Trace
Search trace results.
Search forward (in direction of execution).
Forward
Search backward (in reverse direction of execution).
Backward
Search one step (Step search).
Step
Search specified line (Come search).
Come
Save...
Save real-time trace data to file.
Load...
Load real-time trace data to file.
Trace Stop
Stop tracing.
Trace Restart
Restart tracing.
These menus can be selected even by the short cut menu by a right click in the window.
1.13 Data Trace Window
The Data Trace Window is used to analyze the results of real-time trace measurements and
graphically show data access information. It operates in conjunction with Trace Window.
1.13.1 Configuration of Data Trace Window
80
1 Windows/Dialogs
•
In the data reference area, you can inspect memory values at the point of a cycle currently in
interest or the values of registered C variables.
•
In the access history reference area, you can see the history of accesses to registered addresses in
chart form.
•
In conjunction with the Trace Window, you can inspect memory values at the point of a cycle you
are watching in the Trace Window. Conversely, you can show the cycle in the Trace Window
which you are watching in the Data Trace Window.
1.13.2Extended Menus
The Protect window provides the following menu when being active.
Menu
Option
Menu Options
Font...
Color...
Analyze Trace Data
Set Cycle...
Sync with Trace Window
Add...
Remove
Data Length
Byte
Word
Lword
Radix
HEX
DEC
Address...
Hide Type Name
Function
Change the display font.
Change the display color.
Analyze the realtime-trace data.
Specify the display cycle.
Synchronize with Trace Window.
Add the watch data.
Remove the watch data.
Specify data length.
Display in 1-byte units.
Display in 2-byte units.
Display in 4-byte units.
Specify data radix.
Display in decimal.
Display in hexadecimal.
Change the display address.
Show/Hide the type name.
81
Zoom
Zoom In
Zoom Out
Zoom...
Adjust
Marker
Start Marker
End Marker
Indicator
Change Grid Interval...
Change Row Setting...
Save...
Load...
Change display scale.
Increase the display scale.
Decrease the display sacle.
Specify the display scale.
Change the display area to fit the markers.
Change marker position.
Move the start marker in the display area.
Move the end marker in the display area.
Move the indicator in the display area.
Change the grid interval.
Change the display setting of the specified row.
Save the watch data to the file.
Load the watch data from the file.
These menus can be selected even by the short cut menu by a right click in the window.
1.14 Coverage Window
The Coverage window allows you to reference the coverage measurement result of the functions of the
target program downloaded.
Two types of windows are provided: the Coverage window in which you can check the start
address/end address of the functions and coverage measurement results; and the Program Window or
Source Window in which you can check execution/non-execution by source line.
You cannot use these windows if you are using the emulator PC4701L.
• The coverage which can be measured is C0 coverage.
• The coverage measurement area is an any any blocks 1 to 32 (up to 8 Mbytes) beginning with the
256-byte boundarya.
• The top address of the coverage measurement area is called coverage base address. By default,
the coverage base address is set to 0h.
1.14.1 Configuration of Coverage Window
•
•
•
By double-clicking any function line, the corresponding function appears in the Source window.
During coverage measurement, "-%" appears in the coverage display area.
You can change the display ratio between the function name display area and the function range
display area, using the mouse.
82
1 Windows/Dialogs
1.14.2 Extended Menus
The Coverage window provides the following menu when being active. (This menu is called Coverage
window option.)
Menu
Option
Menu Options
Function
Font...
Change font.
Select source file
Specify the source file to see the coverage
Refresh
Update display of coverage measurement result
Clear
Initialize coverage measurement result
Base
Change coverage measurement area
File
Input/output coverage measurement result file
Save coverage measurement result file
Save...
Load coverage measurement result file
Load...
Layout
Set Layout
Turn address range display area on or off
Address Area
These menus can be selected even by the short cut menu by a right click in the window.
1.15 Time Measurement Window
The Time Measurement window displays the minimum/maximum/average execution time and
measurement count at any measurement point. The execution time of up to 4 measurement points can
be measured simultaneously.
You can specify the event for the measurement condition in the same manner as when specifying
events in the Trace Point Setting Window.
The Time Measurement window cannot be used on the emulator PC4701L.
83
•
The events listed below can be specified as measurement events. If the contents of events are
altered, they are marked by an asterisk (*) on the title bar. The asterisks (*) are not displayed
after setting up the emulator.
Product Name
Event
PD308
PD30
Fetch
X*
O
Memory Access
O
O
Bit Access
O
O
Interrupt
X
O
External Trigger
O
O
*Can be substituted by memory access. (Access type = Read)
ATTENTION
•
•
The Trace Point Setting Window and the Time Measure Windows use the same resource of the
emulator. If the event settings are modified in Time Measure Window, settings of the Trace Point
Setting Window are modified, too.
As the count resource for time measurement, specify the MCU cycle (operation clock of the target
mcu) instead of the emulator clock (16MHz), in the init dialog. If you specify the emulator clock,
the measurement result will be incorrect.
1.15.1 Time Measurement Condition
For the time measurement conditions, the following can be specified for each measurement interval.
Measures the time in an interval from where the start event is
established till where the end event is established.
Measures the time from where an event is established till where
the next event is established.
Measures the time from where an event is established till where
the event is not established.
Measures the execution time of functions. The start address and
the end address of the function are automatically registered for
the start event and the end event, respectively.
The measurement result includes the execution time of other
functions that have been called from within the specified function.
Measures the execution time of functions. The start address and
the end address of the function are automatically registered for
the start event and the end event, respectively. The measurement
result does not include the execution time of other functions that
have been called from within the specified function.
84
1 Windows/Dialogs
1.15.2 Command Button
The buttons at the bottom of the Time Measurement window have the following meanings.
Button Name Content
Reset
Discards the contents being displayed in the window and loads contents from the
emulator in which they were set.
Save...
Saves the contents set in the window to a file
Load...
Loads event information from a file in which it was saved
Set
Sends the contents set in the window to the emulator
Close
Closes the window
1.16 MR Window
Use the MR Window to display the status of the realtime OS. (PD38(SIM) does not support.)
You can only use the MR Window when you have downloaded a program that uses the realtime OS (if
the downloaded program does not use the MR, nothing is displayed in the MR Window when it is
opened.)
1.16.1 Configuration of MR Window
You can open the MR window as many as the number of display modes (9 at maximum currently).
By clicking the desired button, the MR window display mode changes and the display data also
changes.
By double-clicking the desired task line, you can display the context data of the task.
You can drag the cursor to change the width of the display area in each mode.
If the downloaded program does not use MR, you cannot select all the menu which will select the
display mode.
The MR window supports the displays listed below.
Button
Contents
TSK
Task status
RQ
Ready queue status
TIM
Timeout queue status
FLG
Event flag status
SEM
Semaphore status
MBX
Mailbox status
85
CYH
ALH
MPL
Cyclic handler status
Alarm handler status
Memory pool status
If a target program created on MR30 V.1.00 is downloaded, the MPL mode cannot be used on MR30.
(You cannot select the menu which changes the current mode to the MPL mode.)
1.16.2 Extended Menus
The MR window provides the following menu when being active. (This menu is called MR window
option.)
Menu
Menu Options
Function
Option
Font...
Change font.
Mode
Switch display mode.
Display Task status.
Task
Display Ready queue status.
Ready Queue
Display Timeout queue status.
Timeout Queue
Display Event flag status.
Event Flag
Display Semaphore status.
Semaphore
Display Mailbox status.
Mailbox
Display Cycle handler status.
Cyclic Handler
Display Alarm handler status.
Alarm Handler
Display Memory pool status.
Memory Pool
MR
Display Context.
Context...
Set Layout .
Layout
Switch display or non-display of status bar.
Status Bar
1.17 MR Trace Window
The MR Trace window measures the task execution history of a program using the real time OS and
displays the result graphically.
In addition to the task execution history, a history of various other operations each are traced and
displayed, including interrupt processing, task state transition, and system call issuance.
This window is available only when a target program which uses the RENESAS real time OS (MRxx)
is downloaded.
For MR30
• For MR30, this window is available for V. 2.00 or later version. If a target program crated on
MR30 V. 1.00 is downloaded, the MR Trace window will not function and not display any data.
For MR308
The history of the high-speed interrupt can not record and display.
The recording and displaying the history of the OS-independent interrupt processing has the
limitation. This function can detect the point of the OS-independent interruption, but not the end
of it. This window regard the end of the OS-independent interruption as other point of
interruption. The other words, when an OS-independent interrupt occur, the information of the
interrupt and the tasks under the influence of the interrupt (the task interrupted by the OSindependent interrupt and so on) is not correct. The history of the OS-independent interrupt is
indicated in hatch style wide line.
•
•
86
1 Windows/Dialogs
1.17.1 Configuration of MR Trace Window
The content of each item is as follows.
Items
VEC
table
ID
(name)
Contents
Indicates a software interrupt number.
Indicates the interrupt vector table number.
Indicates a task ID number.
Indicates an interrupt routine name, task name, idle processing
(display "idle"), and unknown name(displayed "unknown").
When moving the mouse to the information displayed in the window, the pop up window as below is
opened, showing the detailed information.
Interrupt handling or
task execution history
System call issue history
Task state transition history
Following information is displayed in the status bar.
• Time value at which start marker is positioned
• Time value at which end marker is positioned
• Time width of a range indicated by start and end markers
• Time value at which indicator is positioned
• Scale factor of display
• Time width of grid line interval
• Range of measurement (trace) result
The grid lines are displayed using the start marker as the radix point.
The grid lines are displayed using the start marker as the radix point. The scale is displayed, using the
time at which the start marker is positioned as 0, with the left (forward in time) set to "minus" and the
right (backward in time) set to "plus".
The grid lines allow you to roughly understand the interrupt occurrence cycle and process time.
The interval time width of the displayed grid lines appears in the "Grid" area of the status bar.
The time value in the MR Trace window means the execution elapsed time using the program
execution start time as 0 in all the cases. On the contrary, the numeric value above the grid lines
(scale) in the MR Trace window is a relative value using the start marker as 0 (the grid interval is
specified in the Value dialog).
It has nothing to do with the time value. (This is provided so that you can see the window easily.)
87
Note
The software interrupt number is different according to product.
PD308
MR308 has interrupt numbers (48 to 63) for the INT instruction reserved for issuing a system call.
The interrupt routine names displayed for interrupt numbers 48 to 63 are shown below.
Interrupt Number
Interrupt Routine Name
63
(_SYSCALL0)
62
(_SYSCALL1)
61
(_sys_ret_int)
60
(_sys_dis_dsp)
59
(_sys_loc_cpu)
58
(_sys_ext_tsk)
57
(_SYSCALL2)
56
(_SYSCALL3)
55
(_SYSCALL4)
54 to 48
For details about which interrupt number is assigned to which system call, refer to the MR308
Reference Manual, "Assemble Language Interface."
PD30
MR30 has interrupt numbers (32 to 47) for the INT instruction reserved for issuing a system call.
The interrupt routine names displayed for interrupt numbers 32 to 47 are shown below.
Interrupt Number
Interrupt Routine Name
32
(_SYSCALL0)
33
(_SYSCALL1)
34
(_sys_ret_int)
35
(_sys_dis_dsp)
36
(_sys_loc_cpu)
37
(_sys_ext_tsk)
38
(_SYSCALL2)
39
(_SYSCALL3)
40
(_SYSCALL4)
41 to 47
For details about which interrupt number is assigned to which system call, refer to the MR30
Reference Manual, "Assemble Language Interface."
1.17.2 Extended Menus
The MR Trace window provides the following menu when being active. (This menu is called MR Trace
window option.)
Menu
Option
Menu Options
Font...
Mark S
Mark E
Indicator
Adjust
Expand
Reduce
After
Break
Function
Change font
Move start marker into display screen area
Move end marker into display screen area
Move indicator marker into display screen area
Adjust display (by expanding range of start and
end markers to full width of display area)
Increase scale factor of display
Reduce scale factor of display
Set measurement range condition to After
Set measurement range condition to Break
88
1 Windows/Dialogs
Trace Stop
Trace Restart
Value...
Color...
Search...
Init Order
Stop measuring
Restart measuring
Set various values
Set various display colors
Search for history of system calls issued
Initialization of the display order
These menus can be selected even by the short cut menu by a right click in the window.
1.18 MR Analyze Window
The MR Analyze window displays the result of the measurement data statistically analyzed within the
range specified by the start marker and the end marker in the MR Trace window.
The MR Analyze window supports three display mode as below:
•
•
•
CPU occupation state by interrupt/task
Ready time by task
List of system call issuance histories (You can extract and display the history based on the
specific condition.)
The MR Analyze window functions together with the MR Trace window.
This window is available only when a target program using the RENESAS real time OS (MRxx) is
downloaded.
1.18.1 Configuration of CPU Occupancy Status Display Mode
The CPU occupation state display mode is used to display the CPU occupation time and ratio by
interrupt/task.
The MR Trace window shows the statistical results within the range specified by the start marker and
end marker.
By clicking the maximum execution time/minimum execution time display area of each line, you can
search interrupt to the clicked line or process history at the maximum/minimum execution time of the
task.
The search result is pointed by the indicator which moves to the target position in the MR Trace
window.
1.18.2 Configuration of Ready State Duration Display Mode
The ready state time display mode by task is used to display the results generated from statistical
process of the time required from execution ready to transition to execution by task.
The statistical result is displayed within the range specified by the start marker and end marker in
the MR Trace window.
89
By clicking the maximum ready time/minimum ready time display area of the desired line, you can
search the process history of the maximum ready time/minimum ready time of the task corresponding
to the clicked line.
The search result is pointed by the indicator which moves to the target position in the MR Trace
window.
1.18.3 Configuration of System Call History Display Mode
The system call issuance history list mode is used to list the system calls issued.
The system call issuance history is listed within the range specified by the start marker and end
marker in the MR Trace window.
The number indicates a numeric value counted from the top system call within the measurable range.
By clicking the desired line, you can search the system call issuance history to the clicked line.
The search result is pointed by the indicator which moves to the target position in the MR Trace
window.
1.18.3.1 Extended Menus
The MR Analyze window provides the following menu when being active. (This menu is called MR
Analyze window option.)
Menu
Option
Menu Options
Font...
Function
Change font.
90
1 Windows/Dialogs
Run Time
Rdy->Run
System Call
Pick Up System Call...
Go to CPU occupancy status display mode
Go to ready state duration display mode
Go to system call history display mode
Go to mode where history of system call issued is listed
after extracting information according to specified
conditions
These menus can be selected even by the short cut menu by a right click in the window.
1.19 MR Task Pause Window
The MR task pause window realizes the task pause function of the real time OS (MR308/MR30).
You can pause and restart the specified task from this window. The window can be used only if the
program containing the system and system programmer for the MR308/MR30 task pause function is
downloaded.
The MR30 task pause function is supported with MR30 V.3.00 or later. Previously installed target
programs cannot be used with this window.
1.19.1 Configuration of MR Task Pause Window
•
The information (ID number, name, context PC value during "Pause") on all the tasks defined in
the configuration file when creating the target program is displayed in the task pause display
area. Select the target task for task pause from this display area.
•
The specified program content is displayed in the task source display area. When performing task
pause Come, specify the stop position using the cursor in this display area.
About Task Pause Function
The task pause function is to stop/restart only the specific task while executing the target system.
When using the task pause function, you can specify the specific task while executing all the other
tasks and interrupts.
Also, as debugging is available, such as execution of Come, effective debugging is provided without
affection to peripheral devices controlled by tasks or interrupts.
The following lists terminology definitions used in this section.
91
•
•
•
•
Pause Status
Indicates a state of the specific task when stopping the task during execution of the target using
the MR Task Pause window.
Task Pause Pause Status
Indicates a process to pause the specific task during execution of the target using the MR Task
Pause window.
Task Pause Go Status
Indicates a process to reset Pause for the specific task during execution of the target using the
MR Task Pause window.
Task Pause Come Status
Indicates a process to pause the specific task during execution of the target using the MR Task
Pause window.
1.19.2 Extended Menus
The MR Task Pause window provides the following menu when being active. (This menu is called MR
Task Pause window option.)
Menu
Option
Menu Options
Function
Font...
Font change
Pause
Task pause function
Task pause Go processing for target task
Go
Task pause Come processing for target task
Come
Task pause Pause processing for target task
Pause
TAB...
TAB setting for source file display of task source display area
Display color setting for task source display area
Color...
View
Task source display area display contents change
Display beginning from specified source file
Source...
Display beginning from specified address or line number
Address...
Display beginning from PC position*
Program Counter
Mode
Task source display area display mode change
Change to source display mode
Source Mode
Change to mixdispla ymode
Mix Mode
Change to disassemble display mode
Disasm Mode
Layout
Task source display area layout setting
Line No. display area show/hide
Line Area
Address display area show/hide
Address Area
Object code display area show/hide
Code Area
*
Operation in the MR task window is as follows when the program display location is changed by PC
position specification.
•
When the target task selected in the task pause display area is paused
-> Its display position is changed to the context PC position of the task.
•
When the target task selected in the task pause display area is in a state other than "pause"
-> The display position is not changed.
•
When the target task is selected from the task pause display area
-> The display position is changed to the position from the current program counter (in the same
manner as the operation in the Source window).
1.20 Task Trace Window
The Task Trace window measures the task execution history of a program using the real time OS and
display it graphically.
92
1 Windows/Dialogs
This window is available even when a target program using an OS other than the MITSUBISHI real
time OS (MRxx) is downloaded.
1.20.1 Configuration of Task Trace Window
The content of each item is as follows.
Items
ID
(name)
Contents
Indicates a task ID number.
Indicates an interrupt routine name, task name, idle processing (display "idle"), and
unknown name(displayed "unknown").
When moving the mouse to the information displayed in the window, the pop up window as below is
opened, showing the detailed information.
The following information is displayed in the status bar.
• Time value at the start marker position
• Time value at the end marker position
• Time interval between the start marker and the end marker
• Time value at the indicator position
• Display scale
• Time width at grid line interval
• Measurement (trace) range
The grid lines are displayed using the start marker as the radix point.
The scale is displayed, using the time at which the start marker is positioned as 0, with the left
(forward in time) set to "minus" and the right (backward in time) set to "plus".
The grid lines allow you to roughly understand the interrupt occurrence cycle and process time.
The interval time width of the displayed grid lines appears in the "Grid" area of the status bar.
The time value in the Task Trace window means the execution elapsed time using the program
execution start time as 0 in all the cases.
On the contrary, the numeric value above the grid lines (scale) in the Task Trace window is a relative
value using the start marker as 0 (the grid interval is specified in the Value dialog). It has nothing to
do with the time value. (This is provided so that you can see the window easily.)
93
1.20.2 Extended Menus
The Task Trace window provides the following menu when being active. (This menu is called Task
Trace window option.)
Menu
Option
Menu Options
Font...
Mark S
Mark E
Indicator
Adjust
Function
Change font.
Move start marker into display screen area
Move end marker into display screen area
Move indicator marker into display screen area
Adjust display (by expanding range of start and
end markers to full width of display area)
Increase scale factor of display
Expand
Reduce scale factor of display
Reduce
After
Set measurement range condition to After
Set measurement range condition to Break
Break
Trace Stop
Stop measuring
Restart measuring
Trace Restart
Value...
Set various values
Set various display colors
Color...
Set target RTOS information
RTOS...
These menus can be selected even by the short cut menu by a right click in the window.
1.21 Task Analyze Window
The Task Analyze window displays the result of the measurement data statistically analyzed within
the range specified by the start marker and the end marker in the Task Trace window.
The Task Analyze window displays the CPU occupation state.
The Task Analyze window functions together with the Task Trace window.
This window is available even when a target program using an OS other than the MITSUBISHI real
time OS (MRxx) is downloaded.
The CPU occupation state display mode is used to display the CPU occupation time and ratio by task.
This mode shows the statistical result within the range specified by the start marker and end marker
in the Task Trace window.
1.21.1 Configuration of Task Analyze Window
By clicking the maximum execution time/minimum execution time display area of each line, you can
search process history of the task for the clicked line at the maximum/minimum execution time.
The search result is pointed by the indicator which moves to the target position in the Task Trace
window.
94
1 Windows/Dialogs
1.21.2 Extended Menus
The Task Analyze window provides the following menu when being active. (This menu is called Task
Analyze window option.)
Menu
Option
Menu Options
Function
Font...
Change font.
Run Time
Go to CPU occupancy status display mode
These menus can be selected even by the short cut menu by a right click in the window.
1.22 GUI Input Window
The GUI Input window allows you for port input by creating a user target system key input panel
(button) in the window and clicking the created button.
1.22.1Configuration of GUI Input Window
You can arrange the following parts on the input panel.
• Button
A virtual port input or virtual interrupt (PDxxSIM only for the latter) can be executed at the time
the button is pressed.
• Text
Display the text string.
You can label (name) the created button.
You can also save the created input panel in a file and reload it.
95
1.22.2 Extended Menus
The GUI Input window provides the following menu when being active. (This menu is called GUI
Input window option.)
Menu
Option
Menu Options
Function
Set
Edits or moves button.
Del
Deletes button.
Copy
Copies button.
Paste
Pastes button.
Make Button
Creates button.
Make Text
Create text label.
Display Grid Line
Shows/hides grid line.
Load...
Loads GUI input file.
Save...
Saves GUI input file.
These menus can be selected even by the short cut menu by a right click in the window.
1.23 GUI Output Window
The GUI Output window allows you to implement the user target system output panel in the window.
1.23.1 Configuration of GUI Output Window
You can arrange the following parts on the output panel.
• Label (character string)
Displays/erases a character string specified by the user when any value is written to the specified
address (bit).
• LED
Changes the display color of any area when any value is written to the specified address (bit).
(Substitution for LED ON)
• Text
Display the text character.
96
1 Windows/Dialogs
You can label (name) the created button.
You can also save the created output panel in a file and reload it.
You can set up to 200 address points to the created part. If different addresses are set to the individual
parts, you can arrange up to 200 parts.(PDxxSIM's limitation)
1.23.2 Extended Menus
The GUI Output window provides the following menu when being active. (This menu is called GUI
Output window option.)
Menu
Option
Menu Options
Set
Del
Copy
Paste
Make Label
Make LED
Make Text
Display Grid Line
Load...
Save...
RAM Monitor
Ram Monitor Area...
Sampling Period...
Function
Edits or moves parts.
Deletes parts.
Copies parts.
Pastes parts.
Creates label.
Creates LED.
Create text label.
Shows/hides grid line.
Loads GUI output file.
Saves GUI output file.
Display RAM monitor
Set RAM monitor area.
Set sampling period for RAM monitor.
These menus can be selected even by the short cut menu by a right click in the window.
1.24 S/W Break Point Setting Window
The S/W Break Point Setting window allows you to set software break points.
Software breaks stop the execution of instructions immediately before the specified break point.
You can also enable and disable each of those break points.
97
1.24.1 Configuration of S/W Break Point Setting Window
•
•
•
•
•
You can set up to 64 software break points.
If you have set multiple software breakpoints, program execution stops when any one software
break address is encountered (OR conditions).
You can continue to set software breakpoints until you click the "Close" button to close the S/W
Break Point Setting Window.
You can clear, enable or disable software breakpoints selected by clicking in the software
breakpoint display area. You can also enable and disable software breakpoints by double-clicking
on them.
Click on the "Save" button to save the software break points in the file. To reload software break
point settings from the saved file, click the "Load" button. If you load software break points from
a file, they are added to any existing break points.
1.24.2 Command Button
The buttons at the right of the S/W Break Point Setting window has the following meanings.
Button Name Content
Help
Display the help of this window
Load...
Load setting information from a file in which it was saved
Save...
Save the contents set in the window to a file
Add
Add the break point
Refer
Open file selection dialog box
Close
Close the window
Del
Delete the break point
Del All
Delete all break points
Enable
Enable the break point
All Enable
Enable all break points
Disable
Disable the break point
All Disable
Disable all break points
98
1 Windows/Dialogs
View
Shows software breakpoint positions in the Program Window
1.25 H/W Break Point Setting Dialog Box(PC4701L)
The H/W Break Point Setting dialog box allows you to set hardware break points.
If you are using the PC4701L emulator, you can set one address breakpoints with pass counts.
•
•
•
As address break point access types, you can specify writing data to the address break point
(Write), reading data from the address break point (Read), reading or writing data (R/W), and
fetching instructions (Fetch). (PD308 do not support the instruction fetch.)
You can also specify that execution breaks if the data read from or written to the address break
point has a specific value. Moreover, you can specify valid and invalid bits for the specific value.
Hardware breakpoints can be saved to a file by clicking "Save". To read hardware breakpoint
settings from the saved file, click "Load".
99
2. Table of Script Commands
The following script commands are prepared.
The character in parentheses of the command name (U,M,HS,L) indicates the emulator which
corresponds.
The command without parentheses can be used with all PC4701 emulators.
U : PC4701U
M : PC4701M
HS : PC4701HS
L : PC4701L
The commands with yellow color displaying can be executed at run time.
The command to which "*" adheres behind is not supported according to the product.
2.1 Table of Script Commands
2.1.1 Execution Commands
Command Name
Go
GoFree
GoProgramBreak*
GoBreakAt*
Stop
Status
Step
StepInstruction
OverStep
OverStepInstruaction
Return
ReturnInstruction
Reset
Time
Short Name
G
GF
GPB
GBA
S
SI
O
OI
RET
RETI
-
Contents
Program execution with breakpoints
Free run program execution
Run target program with software break point
Run target program with software break point
Stops program execution
Checks the operating status of the MCU
Halts for user input until the specified time has elapsed
Step execution of instructions
Overstep execution of source lines
Overstep execution of instructions
Executes a source line return
Executes an instruction return
Resets the target MCU
Sets the run time display and checks the current setting
2.1.2 File Operation Commands
Command Name
Load
LoadHex
LoadMot*
LoadSymbol
LoadIeee*
Reload
Short Name
L
LH
LM
LS
LI
-
Contents
Downloads the target program
Downloads an Intel HEX-format file
Downloads a Motorola S-format file
Loads source line/ASM symbol information
Downloads IEEE-695 absolute-format files
Re-downloads the target program
100
2 Table of Script Commands
UploadHex
UploadMot*
UH
UM
Outputs data to an Intel HEX-format file
Outputs data to a Motorola S-format file
2.1.3 Register Operation Commands
Command Name
Register
Short Name
R
Contents
Checks and sets a register value
2.1.4 Memory Operation Commands
Command Name
DumpByte
DumpWord*
DumpLword*
DumpDword*
SetMemoryByte
SetMemoryWord*
SetMemoryLword*
SetMemoryDword*
FillByte
FillWord*
FillLword*
FillDword*
Move
MoveWord*
Short Name
DB
DW
DL
DD
MB
MW
ML
MD
FB
FW
FL
FD
MOVEW
Contents
Displays the contents of memory (in 1-byte units)
Displays the contents of memory (in 2-byte units)
Displays the contents of memory (in 4-byte units)
Displays the contents of memory (in 4-byte units)
Checks and changes memory contents (in 1-byte units)
Checks and changes memory contents (in 2-byte units)
Checks and changes memory contents (in 4-byte units)
Checks and changes memory contents (in 4-byte units)
Fills a memory block with the specified data (in 1-byte units)
Fills a memory block with the specified data (in 2-byte units)
Fills a memory block with the specified data (in 4-byte units)
Fills a memory block with the specified data (in 4-byte units)
Moves memory blocks
Moves memory blocks(in 2-byte units)
2.1.5 Assemble/Disassemble Commands
Command Name
Assemble
DisAssemble
Module
Scope
Section
Bit*
Symbol
Label
Express
Short Name
A
DA
MOD
SEC
SYM
EXP
Contents
Line-by-line assembly
Disassembles memory contents line by line
Displays modules names
Sets and checks the effective local symbol scope
Checks section information
Checks and sets bit symbols
Checks assembler symbols
Checks assembler labels
Displays an assembler expression
2.1.6 Software Break Setting Commands
Command Name
SoftwareBreak
SoftwareBreakClear
SoftwareBreakClearAll
SoftwareBreakDisable
SoftwareBreakDisableAll
SoftwareBreakEnable
SoftwareBreakEnableAll
BreakAt
BreakIn
Short Name
SB
SBC
SBCA
SBD
SBDA
SBE
SBEA
-
Contents
Sets and checks software breaks
Clears software breaks
Clears all software breaks
Disables software breakpoints
Disables all software breaks
Enables software breakpoints
Enables all software breaks
Sets a software breakpoint by specifying a line No.
Sets a software breakpoint by specifying a function
101
2.1.7 Hardware Break Setting Commands
Command Name
HardwareBreak[U/M/HS]
HardwareBreak[L]
Protect[U/M/HS]
BreakMode[U/M/HS]
BreakMode[L]
Short Name
HB
HB
PT
BM
BM
Contents
Sets and checks a hardware break
Sets and checks a hardware break
Sets and checks protect breaks
Sets and checks hardware break mode
Sets and checks hardware break mode
2.1.8 Real-time Trace Commands
Command Name
TracePoint[U/M/HS]
TraceData[U/M/HS]
TraceList[U/M/HS]
Short Name
TP
TD
TL
Contents
Sets and checks a trace points
Realtime trace data display
Displays disassembled realtime trace data
2.1.9 Coverage Measurement Commands
Command Name
Coverage[U/M/HS]
Short Name
CV
Contents
Specifies and displays coverage measurement
2.1.10 Script/Log File Commands
Command Name
Script
Exit
Wait[U/M/HS]
Wait[L]
Pause
Sleep
Logon
Logoff
Short Name
-
Contents
Opens and executes a script file
Exits the script file
Waits for an event to occur before command input
Waits for an event to occur before command input
Waits for user input
Halts for user input until the specified time has elapsed
Outputs the screen display to a log file
Stops the output of the screen display to a log file
2.1.11 Program Window Control Commands
Command Name
Func
Up*
Down*
Where*
Path
File
Short Name
-
Contents
Checks function names and displays the contents of
functions
Displays the calling function
Displays a called function
Displays a function call status
Sets and checks the search path
Checks a filename and displays the contents of that file
2.1.12 Map Commands
Command Name
Map
Short Name
-
Contents
Checks and sets mapping data
102
2 Table of Script Commands
2.1.13 Clock Command
Command Name
Clock
Short Name
CLK
Contents
Checks and changes the clock
2.1.14 WatchDog Timer Commands
Command Name
WatchDogTimer*
Short Name
WDT
Contents
Sets and checks the usage condition of the watchdog timer
2.1.15 C Language Debugging Commands
Command Name
Print
Set
Short Name
-
Contents
Check value of specified C variable expression
Set specified data in specified C variable expression
2.1.16 Real-time OS Command
Command Name
MR*
Short Name
-
Contents
Displays status of realtime OS (MRxx)
2.1.17 Custom Command/Window Commands
Command Name
Macro
DelMacro
DelMacroAll
MacroPath
Short Name
MPATH
Contents
The reference and registration of the custom programs
Delete custom program
Delete all custom programs
Sets and checks the search path for custom programs
2.1.18 Utility Commands
Command Name
Radix
Alias
UnAlias
UnAliasAll
Version
Date
Echo
Quit
CD
OpenWindow
Short Name
VER
-
Contents
Sets and checks the radix for numerical input
Specifies and checks command alias definitions
Cancels the alias defined for a command
Cancels all aliases defined for commands
Displays the version No.
Displays the date
Displays messages
Quits Debugger
Specifies and checks the current directory
Window open
2.2 Table of Script Commands (alphabetical order)
Command Name
Alias
Assemble
Bit*
Short Name
A
-
Contents
Specifies and checks command alias definitions
Line-by-line assembly
Checks and sets bit symbols
103
BreakAt
BreakIn
DumpByte
DumpDword*
DumpLword*
DumpWord*
Echo
Exit
Express
File
FillByte
BM
BM
CLK
CV
DA
DB
DD
DL
DW
EXP
FB
FillDword*
FD
FillLword*
FL
FillWord*
FW
Func
-
Go
GoBreakAt*
GoFree
GoProgramBreak*
HardwareBreak[U/M/HS]
HardwareBreak[L]
G
GBA
GF
GPB
HB
HB
L
LH
LI
LM
LS
MPATH
MOD
MOVEW
O
OI
BreakMode[U/M/HS]
BreakMode[L]
CD
Clock
Coverage[U/M/HS]
Date
DelMacro
DelMacroAll
DisAssemble
Down*
Label
Load
LoadHex
LoadIeee*
LoadMot*
LoadSymbol
Logoff
Logon
Macro
MacroPath
Map
Module
Move
MoveWord*
MR*
OpenWindow
OverStep
OverStepInstruaction
Sets a software breakpoint by specifying a line No.
Sets a software breakpoint by specifying a function
Sets and checks hardware break mode
Sets and checks hardware break mode
Specifies and checks the current directory
Checks and changes the clock
Specifies and displays coverage measurement
Displays the date
Delete custom program
Delete all custom programs
Disassembles memory contents line by line
Displays a called function
Displays the contents of memory (in 1-byte units)
Displays the contents of memory (in 4-byte units)
Displays the contents of memory (in 4-byte units)
Displays the contents of memory (in 2-byte units)
Displays messages
Exits the script file
Displays an assembler expression
Checks a filename and displays the contents of that file
Fills a memory block with the specified data (in 1-byte
units)
Fills a memory block with the specified data (in 4-byte
units)
Fills a memory block with the specified data (in 4-byte
units)
Fills a memory block with the specified data (in 2-byte
units)
Checks function names and displays the contents of
functions
Program execution with breakpoints
Run target program with software break point
Free run program execution
Run target program with software break point
Sets and checks a hardware break
Sets and checks a hardware break
Checks assembler labels
Downloads the target program
Downloads an Intel HEX-format file
Downloads IEEE-695 absolute-format files
Downloads a Motorola S-format file
Loads source line/ASM symbol information
Stops the output of the screen display to a log file
Outputs the screen display to a log file
The reference and registration of the custom programs
Sets and checks the search path for custom programs
Checks and sets mapping data
Displays modules names
Moves memory blocks
Moves memory blocks(in 2-byte units)
Displays status of realtime OS (MRxx)
Window open
Overstep execution of source lines
Overstep execution of instructions
104
2 Table of Script Commands
Path
Pause
Print
Protect[U/M/HS]
PT
Quit
Radix
Register
R
Reload
Reset
Return
RET
ReturnInstruction
RETI
Scope
Script
Section
SEC
Set
SetMemoryByte
MB
SetMemoryDword*
MD
SetMemoryLword*
ML
SetMemoryWord*
MW
Sleep
SoftwareBreak
SB
SoftwareBreakClear
SBC
SoftwareBreakClearAll
SBCA
SoftwareBreakDisable
SBD
SoftwareBreakDisableAll SBDA
SoftwareBreakEnable
SBE
SoftwareBreakEnableAll SBEA
Status
Step
S
StepInstruction
SI
Stop
Symbol
SYM
Time
TraceData[U/M/HS]
TD
TraceList[U/M/HS]
TL
TracePoint[U/M/HS]
TP
UnAlias
UnAliasAll
Up*
UploadHex
UH
UploadMot*
UM
Version
VER
Wait[U/M/HS]
Wait[L]
WatchDogTimer*
WDT
Where*
-
Sets and checks the search path
Waits for user input
Check value of specified C variable expression.
Sets and checks protect breaks
Quits Debugger
Sets and checks the radix for numerical input
Checks and sets a register value
Re-downloads the target program
Resets the target MCU
Executes a source line return
Executes an instruction return
Sets and checks the effective local symbol scope
Opens and executes a script file
Checks section information
Set specified data in specified C variable expression
Checks and changes memory contents (in 1-byte units)
Checks and changes memory contents (in 4-byte units)
Checks and changes memory contents (in 4-byte units)
Checks and changes memory contents (in 2-byte units)
Halts for user input until the specified time has elapsed
Sets and checks software breaks
Clears software breaks
Clears software breaks
Disables software breakpoints
Disables all software breaks
Enables software breakpoints
Enables all software breaks
Checks the operating status of the MCU
Step execution of source line
Step execution of instructions
Stops program execution
Checks assembler symbols
Sets the run time display and checks the current setting
Realtime trace data display
Displays disassembled realtime trace data
Sets and checks a trace points
Cancels the alias defined for a command
Cancels all aliases defined for commands
Displays the calling function
Outputs data to an Intel HEX-format file
Outputs data to a Motorola S-format file
Displays the version No.
Waits for an event to occur before command input
Waits for an event to occur before command input
Sets and checks the usage condition of the watchdog timer
Displays a function call status
105
3. Error Messages
No.
Error Message
Notes and Action
INTERNAL ERROR:Unset err number
Contact your nearest distributor.
Error Message
Notes and Action
200
Can't open more xxxxx window.
The maximum number of the specified window
is already open.
201
202
203
204
205
206
207
209
Can't Create xxxxx window.
PDxx is already exist.
Project file (xxxxx) is broken.
File not found (xxxxx).
Path not found (xxxxx).
Not enough memory.
Can't execute.
Failed to read/write data to the archive xxxxx
(CODE: n).
Failed to read/write data to the file xxxxx
(CODE: n).
0
No.
210
No.
Error Message
Notes and Action
400
Can't change view mode.
401
Can't find source file (xxxxx).
402
Can't find search string (xxxxx).
403
Line number of Source File (xxxxx) is over 2.
The display starting address does not match
the first line of the source file, or the specified
source file cannot be found.
Specified source file was not found. Use the
PATH command, or the [Environment] ->
[Customize] menu items to specify the directory
containing the source file.
The specified search string was not found
between the starting position and end.
Because the source file has more lines than
can be displayed, the file cannot be displayed
in the Source Window. Switch to disassemble
display mode.
No.
600
601
602
603
604
605
Error Message
Notes and Action
The address value is out of range.
Can not open file(xxxxx).
Can't find file (xxxxx).
Can not save because the line number is over
xxxxx.
Can not save as the file (xxxxx). [system error:
xxxxx]
Can not edit this file (xxxxx) because it is being
106
3 Error Messages
606
No.
800
801
802
803
804
used by another process.
The number of base addresses is over the limit
(num).
Error Message
Notes and Action
Value is out of range.
Can't find the register information file.
There's incorrect line in register information
file.
Not enough memory.
Description of expression is illegal.
No.
Error Message
1200
1201
1203
1204
1205
1206
Address value is out range for scroll area.
The length of the set data is different from the
length of the displayed data.
The value is out of range.The value which can
be specified is 1 to 2.
Can not open file(string1).
Internal Error:Memory buffer is null.
Address value is out of range.
Start address is larger than end address.
No.
Error Message
1202
Contact your nearest distributor.
Notes and Action
Notes and Action
1550 There is not enough memory to load the target
program.
1551 Can't open the target file
1552 Failed to read or to load the target file. string1
1553 The loading has stopped as your request.
1554 The target file has not the specified format or it is
broken.
1555 Not found the debugging information.
1556 Not found the debuging information.
1557 The target file has wrong information. So can't
read the file.
1560 Can't find the scope.
1561 Can't find the appropriate symbols.
1562 Can't find the appropriate functions.
1563 Can't find the appropriate sections.
1564 Can't find the appropriate line information.
1565 Can't find the appropriate source file.
1566 Can't find the search paths.
1567 There is no more symbols.
1568 There is no more functions.
1569 There is no more sections.
1570 The name is invalid for registers.
1571 The word (string1) is one of the resereved
words. You can not specify it as symbol name.
1572 The word (string1) has been still defined. You
can not specify it as symbol name.
1573 There is no information for the source files and
the line numbers.
107
1574 Bit symbols are not supported.
1575 The word (string1) contains some illegal
characters. You can not specify it as symbol
name.
1580 Internal Error : unexpected symbol type has
been specified.
1581 Internal Error : an unexpected searching order
has been specified.
1582 Internal Error : not found the class where the
download data is stored.
1583 Internal Error : an unexpected file format has
been specified.
1584 Internal Error : The information for downloading
has not been obtained. string1
1585 Internal Error : Failed to regist the information to
the debugging information data base. string1
No.
Error Message
Notes and Action
1600 Can't add new watch point because it exceeds
limit of watch point number. Max number is
(num).
1601 Address value is out of range.
1602 Data value is out of range.
1603 Bit value is out of range.
1604 Can't save watch points.
No.
Error Message
Notes and Action
1800 There are no symbol information.
1801 The expression is too long.
1802 Can't save c watch points.
1803 Can't load c watch points.
1804 Load is terminated because the file extension is
different.
No.
Error Message
Notes and Action
2000 Can't open Script File (filename).
2001 Script File is not open.
2002 Can't open Log File (filename).
2003 Can't open more Log File.
2004 Can't open Log File.
2005 File (filename) is already log on.
2006 Can't open View File (filename) for new/add.
2007 Can't save command history.
No.
Error Message
Notes and Action
2200 Address value is out of range.
2201 Data value is out of range.
2202 Start address is larger than end address.
2203 Value is under (num).
2204 Data value is out of range.
2205 Data is not set.
108
3 Error Messages
2206 Sampling period value is out of range.
2207 Please fill in the blanks, and attach the contents
to the technical support sheet.
No.
Error Message
Notes and Action
2400 Illegal endi. (filename line)
2401 Illegal endw. (filename line)
2402 INTERNAL ERROR:ER_BAT_EOF
2403 Can't find endi. (filename line)
2404 Line length is overflow. (filename line)
2405 Nest level is overflow. (filename line)
2406 Can't find Script File (filename).
2407 Can't read Script File (filename).
2408 Description is illegal. (filename line)
2409 Can't find endw. (filename line)
2410 The nest level exceeds the limit (num).
2411 INTERNAL ERROR:ER_BAT_NONE
Contact your nearest distributor
2412 Illegal break. (filename line)
No.
Error Message
Notes and Action
2600 Syntax error.
2601 Command name is wrong.
2602 Too many aliases.
2603 You can register the only command name for
alias.
2604 Can't use the command now.
2605 Can't up more.
2606 Can't down more.
2607 Can't set break point in this function.
2608 The start address larger than the end address.
2609 Can't register that token for alias.
2610 Can't register that token for alias.
2611 Can't find File (filename).
2612 Data value is out of range.
2613 Can't find the specified directory.
2614 Can't open the window.
No.
Error Message
Notes and Action
6000 INTERNAL ERROR:ER_ENV_END
No.
Contact your nearest distributor.
Error Message
Notes and Action
6200 SYMBOL file is illegal.
6201 Loading is canceled.
6202 Can't find SYMBOL file (filename).
6203 Can't get enough memory.
6204 Cannot open temporary file.
No.
Error Message
Notes and Action
6402 Can't find symbol.
109
6403 Description of expression is illegal.
6404 Description is illegal.
6405 Can't find scope.
6406 Can't find symbol.
6407 Can't find function.
6408 Right hand side of the expression is illegal.
6409 The Type of structure (union) are not same.
6410 Can't assign.
6411 Can't find type.
6412 Not supported float (double) operation.
6413 The operation does not be allowed to pointers.
6414 The operation does not be allowed to the
pointer.
6415 Can't decrease by pointer.
6416 Divided by 0.
6417 The operator is not supported.
6418 Type information is broken.
6419 Left value must be the pointer.
6420 Left value must be a structure or an union.
6421 Can't find member.
6422 Left value must be reference of a structure or an
union.
6423 Left value is illegal.
6424 The operand must be a value.
6425 The operand is able to be opposite sign.
6426 Can't get address value.
6427 The array variable is illegal.
6428 The essential number of array is illegal.
6429 The operand must be an address value.
6430 Type casting for register variable is not be
supported.
6431 The type of type casting is illegal.
6432 Type casting for that type is not be supported.
6433 This expression can not be exchanged for some
address value.
No.
Error Message
Notes and Action
6601 Address value is out of range.
6602 Target program is already stopped.
6603 The number of break point is over the limit
(num).
6604 The break point isn't defined at that address.
6605 Data value is out of range.
6606 INTERNAL ERROR: ER_IN1_ILLEGAL_MODE Contact your nearest distributor.
has happen. (in xxxxx)
6607 Can't read/write, because there are no memory
at that area.
6608 Register value is out of range.
6609 Can't execute that command, when the target
program is running.
6610 Start address is larger than end address.
110
3 Error Messages
6611 STOP execution.
6612 Can't search more on the stack.
6613 Specified times of number is over than 65535.
6614 INTERNAL ERROR: The memory of the odd Contact your nearest distributor.
number byte cannot be dumped by the Word
access.
6615 Memory alignment error.
6616 Illegal register is specified.
6617 Already set address interrupt break.
6618 The block number is out of range.
No.
Error Message
Notes and Action
6800
The process is canceled.
6801
Can't execute this command while some source
windows are in editor mode.
No.
Error Message
Notes and Action
10000 Cannot find source file (filename).
10001 The number of lines of source file (filename) is
over the limit (num).
10002 The address value is out of range.
10003 Cannot open file (filename).
10004 Illegal file format.
10005 Cannot read the file saved by simulator
debugger.
10006 Cannot read the file saved by emulator
debugger.
10007 Not enough memory for display all function.
No.
Error Message
Notes and Action
10200 Operation code (code) not found.
10201 File (filename) not found.
10202 Duplicate event set in xxxxx.
10203 File format error (filename).
No.
Error Message
Notes and Action
10400 Can't execute more come instruction.
10401 Can't execute more step instruction.
10402 Cycle value is out of range.
10403 Can't find that address.
10404 Can not open file (filename).
10405 Can not read file (filename).
10406 The display mode is not able to change except
the BUS mode. Trace data is not enough or is
abnormal.
No.
Error Message
Notes and Action
111
10600 Can't open BUTTON file (filename).
10601 BUTTON file is illegal.
No.
Error Message
Notes and Action
10800 Illegal file format.
10801 Address value is out of range.
10802 Data value is out of range.
No.
Error Message
Notes and Action
11000 File format error (filename).
11001 File (filename) not found.
11002 Can't file (filename) open.
11003 Failed to read/write data to the file (filename).
11004 Failed to read/write data to the archive
(filename).
11005 Data value is out of range.
11006 Function not found.
11007 Bit Symbol not found.
11008 Can not set trace points while program is
running.
11009 Specify BYTE access for ODD address.
No.
Error Message
Notes and Action
11200 Already set hard ware break.
11201 Combination of bus width and access condition.
11202 Can't execute this command with PC4700L.
11203 The start cycle larger than the end cycle.
11204 HardwareBreak command cannot be used while
H/W Break Point Setting Window opens.
11205 These trace data can't disassemble.
11206 TracePoint command cannot be used while
Trace Point Setting Window, Time Measurement
Window, MR Trace/Analyze Window or Task
Trace/Analyze Window opens.
11207 Cycle value is out of range.
11208 The bit number is out of the range.
11209 Address Interrupt Break is invalid.
11210 ADdressInterruptBreak command cannot be
used while ADI Break Point Setting Window
opens.
11211 No base address is set.
11212 The number of base addresses is over the limit
(num).
No.
Error Message
Notes and Action
112
3 Error Messages
11400 Can't open temporary file.
11401 Can't delete temporary file.
11402 Can't open I/O data file(filename).
11403 The I/O data not set.
11404 The Output file of the same already set.
11405 Data not found.
11406 The start cycle larger than the end cycle.
11407 The Output port already set.
11408 There is no data in the Input file.
11409 Illegal file format.
11410 Can't open file.
11411 Can't open ( filename ).
11412 Address value is out of range.
No.
Error Message
Notes and Action
11600 Can't execute this command.
11601 Already set hard ware break.
11602 Combination of bus width and access condition.
11603 The start cycle larger than the end cycle.
11604 HardwareBreak command cannot be used while
state transition break window opens.
11605 TracePoint command cannot be used while
State Transition Trace Window,
Time Measurement Window, MR Trace/Analyze
Window or Task Trace/Analyze Window opens.
11606 These trace data can't disassemble.
11607 Cycle value is out of range.
No.
Error Message
Notes and Action
11800 The I/O data not set.
11801 Can't open ( filename ).
11802 Can't open temporary file.
11803 Address value is out of range.
11804 Can't delete temporary file.
11805 Can't open Log File (filename).
11806 Address value is out of range.
No.
Error Message
Notes and Action
12000 Address Interrupt Break is invalid.
12001 Address value is out of range.
No.
Error Message
Notes and Action
12200 Size value is out of range.
12201 Base Address value is out of range.
12202 The specified area is out of range.
113
12203 failed to save data.
12204 failed to load data.
12205 he number of RAM monitor area cannot be
changed.
No.
Error Message
Notes and Action
12400 Sampling period value is out of range.
No.
Error Message
Notes and Action
16000 INTERNAL ERROR: Already connected with the Contact your nearest distributor.
target.
16001 INTERNAL ERROR: Fork error has happen.
Contact your nearest distributor.
16002 Can't find Host Name (xxxxx).
16003 INTERNAL ERROR: The Baud rate is illegal.
Contact your nearest distributor.
16004 The connection with the target isn't created.
16005 Can't connect with the target.
16006 INTERNAL ERROR: The Time of time out is out Contact your nearest distributor.
of range.
16007 Time Out ERROR.
Contact your nearest distributor.
16008 INTERNAL ERROR: Can’t disconnect with the
target.
16009 INTERNAL ERROR: Can’t send given size data. Contact your nearest distributor.
16010 INTERNAL ERROR: Parameter is illegal.
Contact your nearest distributor.
16011 Illegal Host Name.
16012 Communication ERROR. The connection with
the target is closed.
16013 Communication ERROR. Can't send data.
16014 Communication ERROR. Can't accept data.
16015 Target is already used.
16016 Specified communications interface doesn't
support.
16017 LAN I/F can't be used on Windows3.1.
16018 Parallel connection doesn't support on Windows
NT.
16019 Setting of the communications interface is
illegal.
16020 OverRun ERROR with serial communications.
No.
Error Message
Notes and Action
16200 Address value is out of range.
16201 That baud rate has not yet supported.
16202 Bit number is out of range.
16203 STOP execution.
16204 Data value is out of range.
16205 Monitor File (filename) is broken.
16206 Can't find File (filename).
114
3 Error Messages
16207 Target system is not constructed properly.
16208 INTERNAL ERROR: ER_IN2_ILLEGAL_MODE Contact your nearest distributor.
has happen. (in xxxxx)
16209 Mask value is out of range.
16210 Counter of measurement time is overflow.
16211 The version of string1 and the firmware on the
target are not same.
16212 Pass count value is out of range.
16213 Can't execute that command, when the target
program is running.
16214 Target MCU is reset state. Please reset target
systems.
16215 Target MCU is unable to reset. Please reset
target systems.
16216 Target MCU is HOLD state. Please reset target
systems.
16217 Target MCU is not given clock. Please reset
target systems.
16218 Target MCU is not given power. Please reset
target systems.
16219 INTERNAL ERROR: Break point number is
illegal.
Contact your nearest distributor.
16220 Please download the firmware to target.
16221 Can't download firmware.
16222 Can't find trace data which is able to refer.
16223 Cycle value is out of range.
16224 Target MCU is not under control. Please reset
target systems.
16225 First data is larger than second data.
16226 First address is larger than second address.
16227 No event set on the state transition path.
16228 Time out value is out of range.
16229 Process ID value is out of range.
16230 Communication protocol error. (Argument error) Contact your nearest distributor.
16231 There was sent undefined data from Emulator.
Contact your nearest distributor.
16232 Check sum error of the received data occurred.
Contact your nearest distributor.
16233 The specified data do not exist.
16234 The target program is running.
16235 The target program is not running.
16236 The measurement has already been stopping.
16237 The measurement has already been being
executed.
16238 The measurement is not completed.
16239 There is no trace data of the specified cycle.
16240 There is no trace data.
16241 The measurement counter of time overflowed.
115
16242 POF state was released by compulsory reset.
16243 A number of setting points exceeds the range.
16244 The program break is not set.
16245 Source line information is not loaded.
16246 The trigger mode is not a software output mode.
16247 The exception processing was detected while
executing the step.
16248 Function range error.
16249 The writing error to EEPROM occurred.
16252 Unexecutable command code was specified.
16253 The processor mode and the target system are
the disagreements. xxxxx mode is used.
16254 The specified bank isn't defined in the expansion
memory.
16255 The bank set up is duplicated.
16256 The specified area includes the debugging
monitor memory area.
16257 The specified area includes the debugging
monitor work area.
16258 Flash ROM deletion error occurred. Flash ROM
deletion error occurred.
16259 Flash ROM verify error occurred.
16260 Specification area includes the internal (flash)
ROM area.
16261 When Word is specified for a size, the odd
number address cannot be specified.
16262 Can not spesify the larger total bank size than
the total emulation memory size.
16263 The bank specified is defined as EXTERNAL.
16264 The setting value is invalid in this processor
mode.
16265 RDY signal of MCU is Low.
16266 HOLD signal of MCU is Low.
16267 All program break points in the spesified bank is
cleared.
16268 Please specify the address in the emulation
memory area.
16269 The mistake is found in setting the emulation
memory area.
16270 The specified area has already been used in the
debugging monitor bank address.
16271 Too many emulation memory area specification.
16272 The bank from 0 to 3 cannot be specified.
16273 The mistake is found in the specification of the
debugging monitor bank address.
16274 The mistake is found in the specification of the
debugging monitor work address.
16275 Cannot specifiy to extend more than two banks.
116
3 Error Messages
16276 Please specify the address in the emulation
memory area.
16277 Too many ROM area specification.
16278 Start address is larger than end address.
16279 Too many DMA area specification.
16281 The mistake is found in the specification of the
DMA area.
16282 When Word is specified for a size, the odd
number address cannot be specified.
16283 Too many memory mapping specification.
16284 The mistake is found in the specification of the
memory mapping.
16285 Please specify the address in the emulation
memory area.
16286 The mistake is found in setting the emulation
memory area.
16287 The specified area has already been used in the
debugging monitor bank address.
16288 Too many emulation memory area specification.
16289 The bank from 0 to 3 cannot be specified.
16290 The mistake is found in the specification of the
debugging monitor bank address.
16291 The mistake is found in the specification of the
debugging monitor work address.
16292 Cannot specifiy to extend more than two banks.
16293 Please specify the address in the emulation
memory area.
16294 Too many ROM area specification.
16295 Start address is larger than end address.
16296 Too many DMA area specification.
16298 The mistake is found in the specification of the
DMA area.
16299 Too many 8 bits bus mode area specification.
16300 The mistake is found in the specification of the
8-bit bus mode area.
16301 When Word is specified for a size, the odd
number address cannot be specified.
16302 The S/W breakpoint cannot be set in the SFR
area and the RAM area.
16303 The S/W breakpoint cannot be set in the flash
ROM area.
16304 The S/W breakpoint cannot be set.
16305 The H/W breakpoint cannot be set in the SFR
area and the RAM area.
16306 The H/W breakpoint cannot be set in the flash
ROM area.
16307 The H/W breakpoint cannot be set.
16308 Too many memory mapping specification.
117
16309 The mistake is found in the specification of the
memory mapping.
16310 The target MCU is SLEEP mode.
16311 The target MCU is STANDBY/STOP mode.
16312 The target MCU is NO REFRESH STANDBY
mode.
16313 The MCU is HOLD state.
16314 Work Address value is out of range.
16315 The received data is illegal. The received data
must be 'xxxxx'. But 'yyyyy' is received.
16316 INIT code is received.
16317 The sent command cannot be executed in this
H/W environment.
16318 The specified event is used in an another mode.
16319 The chip break 0 is used in an another mode.
16320 An uninitialized interrupt vector was detected.
16321 This break function can't be set up in the ROM
area or the memory area which doesn't exist.
16322 This break function can't be set up in the odd
number address.
16323 This break function can't be set up in the middle
of 32bit instruction.
16324 A memory area which doesn't exist was
manipulated. Or, A memory area was
manipulated on the condition which wasn't
forgiven.(address=H'xxxxx)
16325 A specified reference section number is outside
the range.
16326 Tracing data file can't be open.
16327 Tracing data can't be read from the file.
16328 The specified break condition does not
correspond to the trace output mode.
16329 This break function can't be set up in the LSB
side parallel instruction.
16330 Can't execute from the LSB side parallel
instruction.
16347 Specification area includes not only the internal
(flash) ROM area but also other area.
16351 A request to an unavailable RAM monitor or
coverage area has been maid.
16352 Not in the output mode is the event output
terminal.
16353 Address Interrupt Break is invalid.
16354 Remove Address Interrupt Break Point(s).
16355 Remove Area (num) S/W Break Point(s).
Remove Address Interrupt Break Point(s).
16370 The S/W breakpoint cannot be set.
16371 The break point isn't defined at that address.
118
3 Error Messages
16372 The number of break point is over the limit
(num).
16373 Warning : The specified range was regulated
into string1.
16374 Software breakpoint is already set.
16375 The number of base addresses is over the limit
(num).
16376 The block number is out of range.
16377 The Generated mode cannot be specified.
Please set the frequency of the Emulator
Generation Clock in the Init dialog box at the
next startup.
16381 The target system may not work correctly,
because the input level of string1 pin is 'L'.
Check the pin level and the setting of the
debugger.
16382 The target system may not work correctly,
because the input level of string1 pin is 'H'.
Check the pin level and the setting of the
debugger.
16383 The target system may not work correctly,
because the input level of string1 pin does not
correspond to the setting. Check the pin level
and the setting of the debugger.
16384 Check the processor mode and the string1 pin
level.
16385 Self Check Error
Please turn off the emulator.
([1]: string1.)
No.
Error Message
Notes and Action
16400 INTERNAL ERROR:Already connected with the Contact your nearest distributor.
target.
16401 INTERNAL ERROR:Fork error has happen.
Contact your nearest distributor.
16402 Can't find Host Name (hostname).
16403 INTERNAL ERROR:The Baud rate is illegal.
Contact your nearest distributor.
16404 The connection with the target isn't created.
16405 Can't connect with the target.
16406 INTERNAL ERROR:The Time of time out is out
of range.
Contact your nearest distributor.
16407 Time Out ERROR.
16408 INTERNAL ERROR:Can't disconnect with the
target.
Contact your nearest distributor.
16409 INTERNAL ERROR:Can't send given size data. Contact your nearest distributor.
16410 INTERNAL ERROR: Parameter is illegal.
Contact your nearest distributor.
16411 Illegal Host Name.
16412 Communication ERROR.
The connection with the target is closed.
119
16413 Communication ERROR.Can't send data.
16414 Communication ERROR.
Can't send data.
16415 Target is already used.
16416 Parallel connection doesn't support on Windows
NT.
16417 Can't find Simulator Engine.
No.
Error Message
Notes and Action
16600 Address value is out of range. Address value is
out of range.
16601 That baud rate has not yet supported.
16602 Bit number is out of range.
16603 STOP execution.
16604 Data value is out of range.
16605 Monitor File ( filename ) is broken.
16606 Can't find File ( filename ).
16607 Target system is not constructed properly.
16608 INTERNAL ERROR:ER_IN2_ILLEGAL_MODE
has happen(in string1).
Contact your nearest distributor.
16609 Mask value is out of range.
16610 Counter of measurement time is overflow.
16611 The version of PD and the firmware on the target
are not same.
16612 Pass count value is out of range.
16613 Can't execute that command, when the target
program is running.
16614 Target MCU is reset state.
Please reset target systems.
16615 Target MCU is unable to reset.
Please reset target systems.
16616 Target MCU is HOLD state.
16617 Target MCU is not given clock. Please reset
target system.
16618 Target MCU is not given power.
16619 INTERNAL ERROR:Break point number is
illegal.
Contact your nearest distributor.
16620 Please download the firmware to target
16621 Can't download firmware.
16622 Download firmware is finished.
Please restart PD.
16623 Can't find trace data which is able to refer.
16624 Cycle value is out of range.
16625 Target MCU is not under control.
Please reset target systems.
16626 First data is larger than second data.
120
3 Error Messages
16627 First address is larger than second address.
16628 First address is larger than second address.
16629 No event set on the state transition path.
16630 Process ID value is out of range.
16631 Communication protocol error.(Argument error)
Contact your nearest distributor.
16632 Check sum error of the received data occurred.
Contact your nearest distributor.
16633 The specified data do not exist.
16634 The target program is running.
16635 The target program is not running.
16636 The measurement has already been stopping.
16637 The measurement has already been being
executed.
16638 The measurement is not completed.
16639 There is no trace data of the specified cycle.
16640 There is no trace data.
16641 The measurement counter of time overflowed.
16642 POF state was released by compulsory reset.
16643 A number of setting points exceeds the range.
16644 The program break is not set.
16645 Source line information is not loaded.
16646 Source line information is not loaded.
16647 The exception processing was detected while
executing the step.
16648 Function range error.
16649 The writing error to EEPROM occurred.
16650 There was sent undefined data from simulator.
Contact your nearest distributor.
16651 The received data is illegal.
Contact your nearest distributor.
The received data must be ( data ). But ( data )
is received.
16652 INIT code is received.
Contact your nearest distributor.
16653 Can't read/write, because there are no memory
at that area.
16654 Number of points exceeds the limit ( num ).
16655 Point already set.
16656 Breakpoint of other type already set.
16657 No hardware breakpoint set at specified
address.
16658 Can't get enough memory.
16659 Can't set more I/O script file.
16660 Can't set more virtual output.
16661 Specified vector No. out of range.
16662 Specified level of priority out of range.
16663 Stack trace mode is not enabled.
16664 The simulator engine execution error occurred.
16665 Undefined instruction was executed.
121
16666 Software break point can't be set up in the
address.
16667 Software break point can't be set up in the odd
number address.
16668 Software break point can't be set up in the
middle of 32bit instruction.
16669 Software break point can't be set up in the LSB
side parallel instruction.
16670 A memory territory which doesn't exist was
manipulated. Or, A memory territory was
manipulated on the condition which wasn't
forgiven.
16671 Can't execute from the LSB side parallel
instruction.
No.
Error Message
Notes and Action
16800 . Can't find '{'.(line: num )
16801 Can't find '}'. (line: num )
16802 Can't find '('.(line: num )
16803 Symbol isn't defined. (line: num , token: string )
16804 Can't find ')'.(line: num )
16805 Description of expression is illegal. (line: num ,
token: string )
16806 Nest level of the if statement is overflow. (line:
num )
16807 Nest level of the while statement is overflow.
(line: num )
16808 Too many the break statement. (line: num )
16809 There is no if statement corresponding to the
else statement. (line: num )
16810 Unknown token. (line: num , token: string )
16811 Can't open the ( filename ) file
16812 The ( filename ) file is not a file made in the I/O
window.
16813 The description of the memory variable is illegal.
(line: num )
No.
Error Message
Notes and Action
17000 INTERNAL ERROR:External frash memory
rewrite module parameter is wrong.
17001 Can't find FTD file.
17002 The FTD file is broken.
17003 The number of External flash rom is over.
17004 INTERNAL ERROR:The device number is
illegal.
17005 An Error was detected in work ram area activate
commands.
17006 An Error was detected in work ram area activate
122
3 Error Messages
commands.
17007 An Error was detected in external flash rom area
activate commands.
No.
Error Message
Notes and Action
20000 Task with specified task No. not found.
20001 Context of specified task No. not found.
20002 Corrupted MR data.
20003 Can't get enough memory.
No.
Error Message
Notes and Action
20200 History of the system call issue that conforms to
the search condition cannot be found.
No.
Error Message
Notes and Action
20400 Can't use Task Pause function.
20401 Task Pause function (xxxxx) was failed.
No.
Error Message
Notes and Action
20600 Can't use Task Trace Window without setting
real-time OS information.
No.
Error Message
Notes and Action
20800 The save file name (filename) is wrong.
20801 Can't find symbol (xxxxx) of MR.
20802 Initialization routine of MR is not executed.
20803 Can't find the task of the specified task number.
20804 Priority out of range.
20805 Task ID out of range.
20806 Flag ID out of range.
20807 Semaphore ID out of range.
20808 Mailbox ID out of range.
20809 Memory pool ID out of range.
20810 Cyclic handler ID out of range.
20811 Address out of range.
20812 Cannot invoke system call.
20813 System call not invoked.
20814 System call not completed.
20815 Address value is out of range.
20816 File Name is illegal.
20817 Corrupted MR data.
20818 Can't get enough memory.
No.
Error Message
Notes and Action
26000 Address value is out of range.
123
26001 Description of Assembly language is illegal.
26002 Address value for JUMP is out of range.
26003 Operand value is out of range.
26004 Description of expression is illegal.
26005 Addressing mode specified is not appropriate.
26006 INTERNAL ERROR: 'ALIGN' is multiple
specified in '.SECTION'.
Contact your nearest distributor.
26007 Operand value is undefined.
26008 Bit-symbol is in expression.
26009 Invalid bit-symbol exist.
26010 Symbol value is not constant.
26011 Same items are multiple specified.
26012 Same kind items are multiple specified.
26013 Characters exist in expression.
26014 Format specified is not appropriate.
26015 Invalid symbol definition.
26016 Invalid reserved word exist in operand.
26017 INTERNAL ERROR: 'JMP.S' operand label is
not in the same section.
Contact your nearest distributor.
26018 Reserved word is missing.
26019 No space after mnemonic or directive.
26020 INTERNAL ERROR: No '.FB' statement.
Contact your nearest distributor.
26021 INTERNAL ERROR: No '.SB' statement.
Contact your nearest distributor.
26022 INTERNAL ERROR: No '.SECTION' statement. Contact your nearest distributor.
26023 Operand value is not defined.
26024 Operand size is not appropriate.
26025 Operand type is not appropriate.
26026 INTERNAL ERROR:Section attribute is not
defined.
Contact your nearest distributor.
26027 INTERNAL ERROR: Section has already
determined as attribute.
Contact your nearest distributor.
26028 INTERNAL ERROR: Section name is missing.
Contact your nearest distributor.
26029 INTERNAL ERROR: Section type is not
appropriate.
Contact your nearest distributor.
26030 INTERNAL ERROR: Section type is multiple
specified.
Contact your nearest distributor.
26031 Size or format specified is not appropriate.
26032 Size specified is missing.
26033 String value exist in expression.
26034 Symbol is missing.
26035 Symbol is multiple defined.
26036 Symbol is missing.
26037 Symbol is multiple defined.
26038 Invalid operand exist in instruction.
26039 Syntax error in expression
124
3 Error Messages
26040 Invalid operand exist in instruction.
26041 Operand expression is not completed.
26042 Too many operand.
26043 Too many operand data.
26044 Undefined symbol exist.
26045 Value is out of range.
26046 Division by zero.
26047 INTERNAL ERROR:'.VER' is duplicated.
Contact your nearest distributor
26048 '#' is missing.
26049 ',' is missing.
26050 ']' is missing.
26051 ')' is missing.
26052 INTERNAL ERROR: Symbol defined by external Contact your nearest distributor.
reference data is defined as global symbol.
26053 Invalid operand exist in instruction.
26054 Quote is missing.
26055 Right quote is missing.
26056 Can't get enough memory.
26057 Invalid chip mode.
26058 ':' is missing.
26059 Absolute addressing is not avail.
26060 Direct addressing is not avail.
26061 Invalid addressing mode declaration included.
26062 Syntax error in indexed addressing expression.
26063 '(' is missing.
26064 Internal error.
26065 Operand value of direct addressing is out of
range.
26066 Operand value of absolute addressing is out of
range.
26067 Operand value of absolute long addressing is
out of range.
26068 Operand value of stack relative addressing is
out of range.
26069 Operand value is illegal.
26070 The indirect addressing you expressed is illegal.
26071 An odd number address can't be specified.
No.
Error Message
Notes and Action
26200 Line number is illegal.
26201 Can't find right bracket ')'.
26202 The Number of Macro constant is over the limit
(num).
26203 Immediate value is out of range.
26204 Prefix which gives radix of the constant is illegal.
125
26205 Description of indirect reference is illegal.
26206 Can't find end of strings (xxxxx).
26207 Description of expression is illegal.
26208 Macro constant (macro) isn't defined.
26209 Symbol (symbol) isn't defined.
26210 Immediate value is illegal.
26211 Divide by 0.
26212 The value is over the maximum value of which
can be treated by MCU.
26213 Register name is using for macro variable name.
No.
Error Message
Notes and Action
26400 Address value is out of range.
26401 Bit number is out of range.
26402 File (filename) is broken.
26403 Can't find File (filename).
26404 Can't find sub routine information.
26405 Illegal character in the strings.
26406 INTERNAL ERROR: ER_IN2_ILLEGAL_MODE Contact your nearest distributor
has happen. (in xxxxx)
26407 Can't find that line number.
26408 Multiple definition of symbol/label.
26409 There are no code at that line.
26410 Can't get enough memory.
26411 Can't find scopes.
26412 Can't find section information.
26413 Can't find source lines which correspond to that
address.
26414 Can't find symbol (symbol).
26415 Can't find the scopes which include that
address.
26416 Loading is canceled.
26417 INTERNAL ERROR: The end of section
information.
Contact your nearest distributor.
26418 INTERNAL ERROR: The end of section
information.
Contact your nearest distributor.
26419 The register name is wrong.
26420 Can't find Source File (filename).
26421 Unable to read Load Module File (filename).
26422 The PATH name is incorrect.
26423 Cannot open the save file (filename).
26424 Can't open SYSROF file.
26425 Can't read SYSROF file.
26426 Illegal file format. (no absolute format file)
26427 Illegal file format.
126
3 Error Messages
26428 Can't get enough memory.
26429 Can't find file.
26430 There are no address at that line.
26431 Can't find the function which correspond to that
source line.
26432 Can't find the scopes which include that
address.
26433 Can't find symbol.
26434 Can't find the function which correspond to that
source line.
26435 Loading is canceled.
26436 INTERNAL ERROR: ER_LOAD_SYMSCOPE
has happen.
Contact your nearest distributor.
26437 File Name is illegal.
26438 Display source codes.
26439 The path name is too long.
No.
Error Message
Notes and Action
26600 Can't open file (filename).
26601 Can't create file (filename).
26602 Can't close file (filename).
26603 File seek error (in xxxxx).
26604 Out of disk space.
26605 Illegal file format (xxxxx --> xxxxx). (filename)
26606 Out of heap space.
26607 Not yet implemented (xxxxx).
No.
Error Message
Notes and Action
30200 Comfirm the processor mode and the CNVss
terminal level.
30201 Comfirm the emulation memory allocation, or the
mapping.
No.
Error Message
Notes and Action
30400 MCU file is old format.
30401 MCU file is illegal format.
No.
Error Message
Notes and Action
30600 In connected emulation-pod, the target clock is
external fixation.
No.
Error Message
Notes and Action
30201 Comfirm the emulation memory allocation, or the
mapping.
No.
Error Message
Notes and Action
127
38000 The value of Bank is wrong.
128
Emulator Debugger for PC4701 System User’s Manual
Rev. 1.00
May 1, 2003
REJ10J0024-0100Z
COPYRIGHT ©2003 RENESAS TECHNOLOGY CORPORATION ALL RIGHTS RESERVED
AND RENESAS SOLUTIONS CORPORATION ALL RIGHTS RESERVED