1
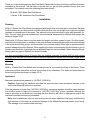
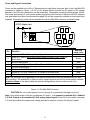
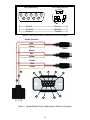
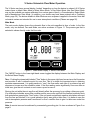
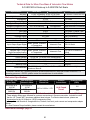
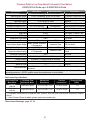
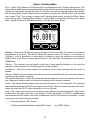
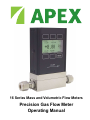
16 Series Mass and Volumetric Flow Meters
Precision Gas Flow Meter
Operating Manual
Notice: The manufacturer reserves the right to make any changes and improvements
to the products described in this manual at any time and without notice. This manual
is copyrighted. This document may not, in whole or in part, be copied, reproduced,
translated, or converted to any electronic medium or machine readable form, for
commercial purposes, without prior written consent from the copyright holder.
Note: Although we provide assistance on our products both personally and through
our literature, it is the complete responsibility of the user to determine the suitability
of any product to their application.
The manufacturer does not warrant or assume responsibility for the use of its
products in life support applications or systems.
Wide-Range Laminar Flow Element Patent:
The wide-range laminar flow element and products using the wide-range laminar
flow element are covered by U.S. Patent Number: 5,511,416. Manufacture or use of
the wide-range laminar flow element in products other than products licensed under
said patent will be deemed an infringement.
10/24/06
Rev. 0
DOC-APEXMAN16
Table of Contents
Installation
Plumbing
Mounting
Application
Power and Signal Connections
RS-232 Digital Output Signal
Standard Voltage (0-5 Vdc) Output Signal
Optional 0-10 Vdc Output Signal
Optional Current (4-20 mA) Output Signal
Optional 2nd Analog Output Signal
M Series Mass Flow Meter Operation
Main Mode
Tare
Gas Absolute Pressure
Gas Temperature
Volumetric Flow Rate
Mass Flow Rate
Flashing Error Message
Select Menu Mode
Gas Select Mode
Communication Select Mode
Unit ID
Baud
Data Rate
Manufacturer Data Mode
V Series Volumetric Flow Meter Operation
Main Mode
Tare
Flashing Error Message
Select Menu Mode
Gas Select Mode
Communication Select Mode
Manufacturer Data Mode
RS-232 Output and Input
Configuring HyperTerminal®
Changing from Streaming to Polling Mode
Tare
Gas Select
Page
5
5
5
5
6
7
7
7
7
7
10
10
10
11
11
11
11
11
12
12
13
13
13
13
14
15
15
15
16
16
16
16
16
16
16
17
17
17
Table of Contents
Collecting Data
Data Format
Sending a Simple Script File to HyperTerminal®
Operating Principle
Gas Viscosity
Other Gases
Volume Flow vs. Mass Flow
Volumetric Flow and Mass Flow Conversion
Compressibility
Standard Gas Data Tables
Gas Viscosities and Densities Table
Volumetric Flow Meters Under Pressure
Troubleshooting
Maintenance and Recalibration
Warranty
Technical Specifications
Dimensional Drawings
Additional Information
Option: Totalizing Mode
Option: Battery Pack
Accessories
Flow Conversion Table
Calibration Certificate Pocket
Table of Figures
Figure 1. 8 Pin Mini-DIN Connector
Figure 2. Mini-DIN to DB-9 Connection for RS-232 Signals
Figure 3. Typical Multiple Device (Addressable) Wiring Configuration
Figure 4. Optional Industrial Connector
Figure 5. Proper Set Up for Remote Tare on Meters
Figure 6. Main Mode Display, M Series Flow Meter
Figure 7. Select Menu Display
Figure 8. Gas Select Display
Figure 9. Communication Select Display
Figure 10. Manufacturer Data Display
Figure 11. Main Mode Display, V Series Flow Meter
Page
19
19
20
21
21
22
23
23
23
24
25
26
27
28
29
33
36
37
39
39
40
6
8
8
9
9
10
12
12
13
14
15
Thank you for purchasing an Apex Gas Flow Meter. Please take the time to find and read the information
contained in this manual. This will help to ensure that you get the best possible service from your
instrument. This manual covers the following Apex instruments:
M Series 16 Bit Mass Gas Flow Meters
V Series 16 Bit Volumetric Gas Flow Meters
Installation
Plumbing
All M or V Series Gas Flow Meters are equipped with female inlet and outlet port connections. Because
the flow meters set up a laminar flow condition within the flow body, no straight runs of pipe are required
upstream or downstream of the meter. The inlet and outlet ports are equal in size and symmetric (inline). The port sizes (process connections) and mechanical dimensions for different flow ranges are
shown on pages 29-32.
Meters with 10-32 ports have o-ring face seals and require no further sealant or tape. On other meters,
avoid the use of pipe dopes or sealants on the ports as these compounds can cause permanent damage
to the meter should they get into the flow stream. Use of thread sealing Teflon tape is recommended to
prevent leakage around the threads. When applying the tape, avoid wrapping the first thread or two to
minimize the possibility of getting a piece of shredded tape into the flow stream. When changing fittings,
always clean any tape or debris from the port threads.
It is also recommended that a 20 micron filter be installed upstream of meters with full scale ranges
of 1(S)LPM or less and a 50 micron filter be installed upstream of meters with full scale ranges above
1(S)LPM.
Mounting
All M or V Series Gas Flow Meters have mounting holes for convenient mounting to flat panels. These
meters are position insensitive and can be mounted in any orientation. The sizes and dimensions for
the mounting holes are shown on pages 33-35.
Application
Maximum operating line pressure is 145 PSIG (1000 kPa).
Caution: Exceeding the maximum specified line pressure may cause permanent damage to the
solid-state differential pressure transducer.
If the line pressure is higher than 145 PSIG (1000 kPa), a pressure regulator should be used upstream
from the flow meter to reduce the pressure to 145 PSIG (1000 kPa) or less if possible. Although the
meter’s operation is uni-directional, reversing the flow direction will inflict no damage as long as the
maximum specified limits are not exceeded.
Note: Avoid installations (such as snap acting solenoid valves upstream) that apply instantaneous
high pressure to the meter as permanent damage to the differential pressure sensor could result.
This damage is not covered under warranty!
Power and Signal Connections
Power can be supplied to your M or V Series meter through either the power jack or the 8 pin Mini-DIN
connector as shown in Figure 1. An AC to DC adapter which converts line AC power to DC voltage
between 7 and 30 volts is required to use the power jack. The adapter current should be at least 100mA.
The power jack accepts 2.1 mm female power plugs with positive centers. Cables and AC/DC adaptors
may purchased from Apex (see Accessories page 42) and are commonly available at local electronics
suppliers. Alternatively, power can be supplied through the Mini-DIN connector as shown below:
AC/DCAdapterJack
11
3
3
6
6
Pin
2
2
44
77
5
5
8
8
Mini-DIN
cable color
Black
Function
1
Inactive or 4-20mA Primary Output Signal
Static 5.12 Vdc or Secondary Analog Output (4-20mA, 5Vdc, 10Vdc) or
2
Brown
Basic Alarm
3
RS-232 Input Signal
Red
4
Analog Input Signal = Remote Tare (Ground to Tare)
Orange
5
RS-232 Output Signal
Yellow
6
0-5 Vdc (or 0-10 Vdc) Output Signal
Green
7
Power In (7-30 Vdc, 100mA) or (15-30Vdc for 4-20mA units)
Blue
8
Ground (common for power, communications and signals)
Purple
Note: The above pin-out is applicable to all the flow meters and controllers available with the MiniDIN connector. The availability of different output signals depends on the flow meter options ordered.
Underlined Items in the above table are optional configurations that are noted on the unit’s
calibration sheet.
Figure 1. 8 Pin Mini-DIN Connector
CAUTION:Do not connect power to pins 1 through 6 as permanent damage can occur!
Note: Upon initial review of the pin out diagram in Figure 1, it is common to mistake Pin 2 (labeled
5.12 Vdc Output) as the standard 0-5 Vdc analog output signal! In fact Pin 2 is normally a constant
5.12 Vdc that reflects the system bus voltage and can be used as a source for the input signal.
RS-232 Digital Output Signal
If you will be using the RS-232 output signal, it is necessary to connect the RS-232 Output Signal (Pin
5), the RS-232 Input Signal (Pin 3), and Ground (Pin 8) to your computer serial port as shown in Figure
2. Adapter cables are available from the manufacturer or they can be constructed in the field with parts
from an electronics supply house. In Figure 2, note that the diagrams represent the “port” side of the
connections, i.e. the connector on top of the meter and the physical DB-9 serial port on the back of the
computer. The cable ends will be mirror images of the diagram shown in Figure 2. (See page 16 for
details on accessing RS-232 output.)
Standard Voltage (0-5 Vdc) Output Signal
All M or V Series flow meters have a 0-5 Vdc (optional 0-10 Vdc) output signal available on Pin 6. This
is generally available in addition to other optionally ordered outputs. This voltage is usually in the range
of 0.010 Vdc for zero flow and 5.0 Vdc for full-scale flow. The output voltage is linear over the entire
range. Ground for this signal is common on Pin 8.
Optional 0-10 Vdc Output Signal
If your meter was ordered with a 0-10 Vdc output signal, it will be available on Pin 6. (See the Calibration
Data Sheet that shipped with your meter to determine which output signals were ordered.) This voltage
is usually in the range of 0.010 Vdc for zero flow and 10.0 Vdc for full-scale flow. The output voltage is
linear over the entire range. Ground for this signal is common on Pin 8.
Optional Current (4-20 mA) Output Signal
If your meter was ordered with a 4-20 mA current output signal, it will be available on Pin 1. (See the
Calibration Data Sheet that shipped with your meter to determine which output signals were ordered.)
The current signal is 4 mA at 0 flow and 20 mA at the meter’s full scale flow. The output current is
linear over the entire range. Ground for this signal is common on Pin 8. (Current output units require
15-30Vdc power.)
Note: This is a current sourcing device. Do not attempt to connect it to “loop powered” systems.
Optional 2nd Analog Output Signal
You may specify an optional 2nd analog output on Pin 2 at time of order. (See the Calibration Data
Sheet that shipped with your meter to determine which output signals were ordered.) This output may
be a 0-5 Vdc, 0-10 Vdc, or 4-20 mA analog signal that can represent any measured parameter. With
this optional output, a volumetric flow meter could output the volumetric flow rate with a 0-5 Vdc signal
(on pin 6) and a 4-20 mA signal (on pin 2), or a mass flow meter could output the mass flow rate (0-5
Vdc on pin 6) and the absolute pressure (0-5 Vdc on pin 2).
Note: This is a current sourcing device. Do not attempt to connect it to “loop powered” systems.
DB-9 Serial Port
8PinMini-DINPort
2
1
1
2
6
3
7
4
8
5
3
9
6
6
5
5
44
7
7
8
8
5----------Ground--------------------------------------Ground----------8
3----------Transmit------------------------------------Receive---------3
2----------Receive-------------------------------------Transmit--------5
Figure 2. Mini-DIN to DB-9 Connection for RS-232 Signals
Purple (Ground)
Red
Yellow
Unit A
Purple
Red
Yellow
Unit B
Purple
Red
Yellow
Unit C
2
2
3
4
1
5
3
5
9
7
8
6
Female Serial Cable Front
Figure 3. Typical Multiple Device (Addressable) Wiring Configuration
An optional industrial connector is also available:
Pin
1
2
3
4
5
6
Function
Power In ( + )
RS-232 Output
RS-232 Input Signal
Remote Tare (Ground to Tare)
Ground (commom for power,
communications and signals)
Signal Out (Voltage or Current as ordered)
Cable Color
Red
Blue
White
Green
Black
6
1
5
2
3
4
Brown
Figure 4. Optional Industrial Connector
Note: The above pin-out is applicable to all the flow meters and controllers ordered with the industrial
connector. The availability of different output signals depends on the flow meter options ordered.
Figure 5. Proper set up for remote tare on meters (Momentarily ground Pin 4 to Tare)
M Series Mass Flow Meter Operation
The M Series Mass Flow Meter provides a multitude of useful flow data in one simple, rugged device.
The M Series can have several display “modes” depending on how the device is ordered. All M Series
meters have a default Main Mode, Select Menu Mode, a Gas Select Mode (the Gas Select Mode may
not be available on meters calibrated for a custom gas or blend), a Communication Select Mode and
a Manufacturer Data Mode. (In addition, your device may have been ordered with a Totaliizing Mode,
page 36.) The device defaults to Main Mode as soon as power is applied to the meter.
Main Mode
The main mode display defaults on power up with the mass flow on the primary display. The following
parameters are displayed in the main mode as shown in Figure 6.
PSIA
+13.49
o
C
+22.73
+0.000
Volume
+0.000
Mass
Tare
MASS
SCCM
Air
Main
Figure 6. Main Mode Display, M Series Flow Meter
The “MODE” button in the lower right hand corner toggles the display between Main Display and the
Select Menu Display.
Tare – Pushing the dynamically labeled “Tare” button in the upper right hand corner tares the flow meter
and provides it with a reference point for zero flow. This is a simple but important step in obtaining
accurate measurements. It is good practice to “zero” the flow meter each time it is powered up. If the
flow reading varies significantly from zero after an initial tare, give the unit a minute or so to warm up
and re-zero it.
If possible, zero the unit near the expected operating pressure by positively blocking the flow downstream
of the flow meter prior to pushing the “Tare” button. Zeroing the unit while there is any flow will directly
affect the accuracy by providing a false zero point. If in doubt about whether a zero flow condition exists,
remove the unit from the line and positively block both ports before pressing the “Tare” button. If the unit
reads a significant negative value when removed from the line and blocked, it is a good indication that
it was given a false zero. It is better to zero the unit at atmospheric pressure and a confirmed no flow
conditions than to give it a false zero under line pressure.
Note: A remote tare can be achieved by momentarily grounding pin 4 to tare as shown in Figure 5
on page 9.
10
Gas Absolute Pressure: The M Series flow meters utilize an absolute pressure sensor to measure
the line pressure of the gas flow being monitored. This sensor references hard vacuum and accurately
reads line pressure both above and below local atmospheric pressure. This parameter is located in
the upper left corner of the display under the dynamic label “PSIA”. This parameter can be moved to
the primary display by pushing the button just above the dynamic label (top left). The engineering unit
associated with absolute pressure is pounds per square inch absolute (PSIA). This can be converted
to gage pressure (psig = the reading obtained by a pressure gauge that reads zero at atmospheric
pressure) by simply subtracting local atmospheric pressure from the absolute pressure reading:
PSIG = PSIA – (Local Atmospheric Pressure)
The flow meters use the absolute pressure of the gas in the calculation of the mass flow rate. For
working in metric units, note that 1 PSI = 6.89 kPa.
Gas Temperature: The M Series flow meters also utilize a temperature sensor to measure the line
temperature of the gas flow being monitored. The temperature is displayed in engineering units of
degrees Celsius (°C). The flow meters use the temperature of the gas in the calculation of the mass
flow rate. This parameter is located in the upper middle portion of the display under “°C”. This parameter
can be moved to the primary display by pushing the top center button above “°C”.
Volumetric Flow Rate: The volumetric flow rate is determined using the Flow Measurement Operating
Principle described elsewhere in this manual. This parameter is located in the lower left corner of the
display over “Volume”. This parameter can be moved to the primary display by pushing the “Volume”
button (lower left). In order to get an accurate volumetric flow rate, the gas being measured must be
selected (see Gas Select Mode). This is important because the device calculates the flow rate based on
the viscosity of the gas at the measured temperature. If the gas being measured is not what is selected,
an incorrect value for the viscosity of the gas will be used in the calculation of flow, and the resulting
output will be inaccurate in direct proportion to the ratio between the two gases viscosities.
Mass Flow Rate: The mass flow rate is the volumetric flow rate corrected to a standard temperature
and pressure (typically 14.696 psia and 25°C). This parameter is located in the lower middle portion
of the display over “Mass”. This parameter can be moved to the primary display by pushing the button
located below “Mass” (bottom center). The meter uses the measured temperature and the measured
absolute pressure to calculate what the flow rate would be if the gas pressure was at 1 atmosphere and
the gas temperature was 25°C. This allows a solid reference point for comparing one flow to another.
Flashing Error Message: Our flow meters and controllers display an error message (MOV = mass
overrange, VOV = volumetric overrange, POV = pressure overrange, TOV = temperature overrange)
when a measured parameter exceeds the range of the sensors in the device. When any item flashes
on the display, neither the flashing parameter nor the mass flow measurement is accurate. Reducing
the value of the flashing parameter to within specified limits will return the unit to normal operation and
accuracy.
11
Select Menu Mode
Pushing “Mode” once will bring up the “Select Menu” display. Push the button nearest your selection to
go to the corresponding display. Push “Mode” again to return to the Main Mode display. (Note: If your
meter was ordered with Totalizing Mode option (page 36), pushing the “Mode” button once will bring up
the “Totalizing Mode” display. Pushing “Mode” a second time will bring up the “Select Menu” display.)
Gas
Select
SELECT
MENU
Comm.
RS-232
Gas Select Mode
Mfg.
Data
Menu
Figure 7. Select Menu Display
The gas select mode is accessed by pressing the button above “Gas Select” on the Select Menu
display. The display will appear as shown in Figure 8 below.
PgUP
H2
He
>N2
N2O
Ne
O2
UP
PgDWN
Main
Hydrogen
Helium
Nitrogen
Nitrous Oxide
Neon
Oxygen
DOWN
Gas
Figure 8. Gas Select Display
The selected gas is displayed on the default main mode display as shown in Figure 6, and is indicated
by the arrow in the Gas Select Mode display in Figure 8. To change the selected gas, use the buttons
under “UP” and “DOWN” or above “PgUP” and “PgDWN” to position the arrow in front of the desired
gas. When the mode is cycled back to the Main Mode, the selected gas will be displayed on the main
display. (Note: Gas Select Mode may not be available for units ordered for use with a custom gas or
blend.)
12
Communication Select Mode
The Communication Select mode is accessed by pressing the button below “Comm. RS-232” on the
Select Menu display. The screen will appear as shown in Figure 9 below.
Select
Main
>
Unit ID (A).....A
Baud (19200)....19200
Data Rate......Fast
UP
DOWN
Comm.
RS-232
Figure 9. Communication Select Display
Unit ID – Valid unit identifiers are letters A-Z and @ (see Note below). This identifier allows the user
to assign a unique address to each device so that multiple units can be connected to a single RS-232
port on a computer. The Communication Select Mode allows you to view and/or change a unit’s unique
address. To change the unit ID address, press the “Select” button in the upper left corner of the display
until the cursor arrow is in front of the word “Unit ID”. Then, using the UP and DOWN buttons at the
bottom of the display, change the unit ID to the desired letter. Any ID change will take effect when the
Communication Select Screen is exited by pushing the MODE or Main button.
Note: When the symbol @ is selected as the unit ID, the device will go into streaming mode when
the Communication Select Mode is exited by pushing the MODE or Main button. See the RS-232
Communications chapter in this manual for information about the streaming mode.
Baud – The baud rate (bits per second) determines the rate at which data is passed back and forth
between the instrument and the computer. Both devices must send/receive at the same baud rate in
order for the devices to communicate via RS-232. The default baud rate for these devices is 19200
baud, sometimes referred to as 19.2K baud. To change the baud rate in the Communication Select
Mode, press the “Select” button in the upper left corner of the display until the cursor arrow is in front
of the word “Baud”. Then, using the UP and DOWN buttons at the bottom of the display, select the
required baud rate to match your computer or PLC. The choices are 38400, 19200, 9600, or 2400 baud.
Any baud rate change will not take effect until power to the unit is cycled.
Data Rate – Changing the Data Rate affects the rate at which the instrument dumps its data in the
streaming mode. Slow is ½ the Fast rate. The speed of the Fast rate is determined by the selected
baud rate. It is sometimes desirable to reduce the data rate if the communication speed bogs down
the computer’s processor (as is not uncommon in older laptops), or to reduce the size of data files
collected in the streaming mode. To change the data rate in the Communication Select Mode, press the
“Select” button in the upper left corner of the display until the cursor arrow is in front of the word “Data
Rate”. Then, using the UP and DOWN buttons at the bottom of the display, select either Fast or Slow.
Any data rate change will be effective immediately upon changing the value between Fast and
Slow.
13
Manufacturer Data
“Manufacturer Data” is accessed by pressing the “Mfg. Data” button on the Select Menu display (Figure
7). The “Mfg 1” display shows the name and telephone number of the manufacturer. The“Mfg 2” display
shows important information about your flow meter including the model number, serial number, and
date of manufacture.
Main
Apex
Ph 404-474-3115
Mfg 1
Main
Model M-10SLPM-D
Serial No 27117
Date Mfg.11/07/2005
Calibrated By.DL
Software GP07R23
Mfg 2
Figure 10. Manufacturer Data Displays
14
V Series Volumetric Flow Meter Operation
The V Series can have several display “modes” depending on how the device is ordered. All V Series
meters have a default Main Mode,a Select Menu Mode, a Gas Select Mode (the Gas Select Mode
may not be available on meters calibrated for a custom gas or blend), a Communication Select Mode
and a Manufacturer Data Mode. (In addition, your device may have been ordered with a Totaliizing
Mode, page 36.) The device defaults to Main Mode as soon as power is applied to the meter. Note that
volumetric meters are intended for use in near atmospheric conditions (Please see page 26).
Main Mode
The main mode display shows the volumetric flow in the units specified at time of order. In the flow
mode, only two buttons, Tare and Mode, are active as shown in Figure 11. The process gas that is
selected is shown directly under the flow units.
Tare
Volume
CCM
Air
+0.000
Volume
Main
Figure 11. Main Mode Display, V Series Flow Meter
The “MODE” button in the lower right hand corner toggles the display between the Main Display and
the Select Menu Display.
Tare – Pushing the dynamically labeled “Tare” button in the upper right hand corner tares the flow meter
and provides it with a reference point for zero flow. This is a simple but important step in obtaining
accurate measurements. It is good practice to “zero” the flow meter each time it is powered up and
whenever a known zero flow condition exists. If the flow reading varies significantly from zero after an
initial tare, give the unit a minute or so to warm up and re-zero it.
Zeroing the unit while there is any flow will directly affect the accuracy by providing a false zero point.
If in doubt about whether a zero flow condition exists, remove the unit from the line and positively block
both ports before pressing the “Tare” button. If the unit reads a significant negative value when removed
from the line and blocked, it is a good indication that it was given a false zero. It is better to zero the
unit at atmospheric pressure and a confirmed “no flow” condition than to give it a false zero under line
pressure.
Note: A remote tare can be achieved by momentarily grounding pin 4 to tare as shown in Figure 5 on
page 9.
15
Flashing Error Message: Our volumetric flow meters and controllers display an error message (VOV
= volumetric overrange) when a measured parameter exceeds the range of the sensors in the device.
When any item flashes on the display, the flashing parameter is not accurate. Reducing the value of the
flashing parameter to within specified limits will return the unit to normal operation and accuracy.
Select Menu Mode
Pushing “Mode” once will bring up the “Select Menu” display (Figure 7, page 12). Push the button nearest your selection to go to the corresponding display. Push “Mode” again to return to the Main Mode
display. (Note: If your meter was ordered with Totalizing Mode option (page 36), pushing the “Mode”
button once will bring up the “Totalizing Mode” display. Pushing “Mode” a second time will bring up the
“Select Menu” display.)
Gas Select Mode
The Gas Select Mode is accessed by pressing the button above “Gas Select” on the Select Menu
display. The display will appear as shown in Figure 8 (page 12). The selected gas is displayed on the
default main mode display as shown in Figure 11, and is indicated by the arrow in the gas select mode
display in Figure 8. To change the selected gas, use the buttons under “UP” and “DOWN” or those
above “PgUP” and “PgDWN” to position the arrow in front of the desired gas. When the mode is cycled
back to the main mode, the selected gas will be displayed on the main display.
Note: Gas Select Mode may not be available for units ordered for use with a custom gas or blend.
Communication Select Mode
The Communication Select mode is accessed by pressing the button below “Comm. RS-232” on the
Select Menu display. Please see page 13 for Communication Select mode instructions.
Manufacturer Data
“Manufacturer Data” is accessed by pressing the “Mfg. Data” button on the Select Menu display (Figure
7, page 12). The “Mfg 1” display shows the name and telephone number of the manufacturer. The“Mfg 2”
display shows important information about your flow meter including the model number, serial number,
and date of manufacture (Figure 10, page 14).
RS-232 Output and Input
Configuring HyperTerminal®:
1. Open your HyperTerminal® RS-232 terminal program (installed under the “Accessories” menu on
all Microsoft Windows operating systems).
2. Select “Properties” from the file menu.
3. Click on the “Configure” button under the “Connect To” tab. Be sure the program is set for: 19,200
baud (or matches the baud rate selected in the RS-232 communications menu on the meter) and
an 8-N-1-None (8 Data Bits, No Parity, 1 Stop Bit, and no Flow Control) protocol.
4. Under the “Settings” tab, make sure the Terminal Emulation is set to ANSI or Auto Detect.
5. Click on the “ASCII Setup” button and be sure the “Send Line Ends with Line Feeds” box is not
checked and the “Echo Typed Characters Locally” box and the “Append Line Feeds to Incoming
Lines” boxes are checked. Those settings not mentioned here are normally okay in the default
position.
6. Save the settings, close HyperTerminal® and reopen it.
In Polling Mode, the screen should be blank except the blinking cursor. In order to get the data streaming
16
to the screen, hit the “Enter” key several times to clear any extraneous information. Type “*@=@”
followed by “Enter” (or using the RS-232 communcation select menu, select @ as identifier and exit the
screen). If data still does not appear, check all the connections and com port assignments.
Changing From Streaming to Polling Mode:
When the meter is in the Streaming Mode, the screen is updated approximately 10-60 times per second
(depending on the amount of data on each line) so that the user sees the data essentially in real time.
It is sometimes desirable, and necessary when using more than one unit on a single RS-232 line, to be
able to poll the unit.
In Polling Mode the unit measures the flow normally, but only sends a line of data when it is “polled”.
Each unit can be given its own unique identifier or address. Unless otherwise specified each unit is
shipped with a default address of capital A. Other valid addresses are B thru Z.
Once you have established communication with the unit and have a stream of information filling your
screen:
1. Type *@=A followed by “Enter” (or using the RS-232 communcation select menu, select A as identifier
and exit the screen) to stop the streaming mode of information. Note that the flow of information will
not stop while you are typing and you will not be able to read what you have typed. Also, the unit
does not accept a backspace or delete in the line so it must be typed correctly. If in doubt, simply hit
enter and start again. If the unit does not get exactly what it is expecting, it will ignore it. If the line
has been typed correctly, the data will stop.
2. You may now poll the unit by typing A followed by “Enter”. This does an instantaneous poll of unit
A and returns the values once. You may type A “Enter” as many times as you like. Alternately you
could resume streaming mode by typing *@=@ followed by “Enter”. Repeat step 1 to remove the
unit from the streaming mode.
3. To assign the unit a new address, type *@=New Address, e.g. *@=B. Care should be taken not to
assign an address to a unit if more than one unit is on the RS232 line as all of the addresses will be
reassigned. Instead, each should be individually attached to the RS-232 line, given an address, and
taken off. After each unit has been given a unique address, they can all be put back on the same
line and polled individually.
Tare –Tareing (or zeroing) the flow meter provides it with a reference point for zero flow. This is a simple
but important step in obtaining accurate measurements. It is good practice to “zero” the flow meter each
time it is powered up. A unit may be Tared by following the instructions on page 10 or it may be Tared
via RS-232 input.
To send a Tare command via RS-232, enter the following strings:
In Streaming Mode:$$V<Enter>
In Polling Mode:
Address$$V<Enter>
(e.g. B$$V<Enter>)
17
Gas Select – The selected gas can be changed via RS-232 input. To change the selected gas, enter
the following commands:
In Streaming Mode:$$#<Enter>
In Polling Mode:
Address$$#<Enter> (e.g. B$$#<Enter>)
Where # is the number of the gas selected from the table below. Note that this also corresponds to the
gas select menu on the flow meter display:
#
0
1
2
3
4
5
6
7
8
9
10
11
12
13
14
15
16
17
18
19
20
21
22
23
24
25
26
27
28
29
GAS
Air
Argon
Methane
Carbon Monoxide
Carbon Dioxide
Ethane
Hydrogen
Helium
Nitrogen
Nitrous Oxide
Neon
Oxygen
Propane
normal-Butane
Acetylene
Ethylene
iso-Butane
Krypton
Xenon
Sulfur Hexafluoride
75% Argon / 25% CO2
90% Argon / 10% CO2
92% Argon / 8% CO2
98% Argon / 2% CO2
75% CO2 / 25% Argon
75% Argon / 25% Helium
75% Helium / 25% Argon
90% Helium / 7.5% Argon / 2.5% CO2
(Praxair - Helistar® A1025)
90% Argon / 8% CO2 / 2% Oxygen
(Praxair - Stargon® CS)
95% Argon / 5% Methane
For example, to select Propane, enter: $$12<Enter>
18
Air
Ar
CH4
CO
CO2
C2H6
H2
He
N2
N2O
Ne
O2
C3H8
n-C4H10
C2H2
C2H4
i-C2H10
Kr
Xe
SF6
C-25
C-10
C-8
C-2
C-75
A-75
A-25
A1025
Star29
P-5
Collecting Data:
The RS-232 output updates to the screen many times per second. Very short-term events can be
captured simply by disconnecting (there are two telephone symbol icons at the top of the HyperTerminal®
screen for disconnecting and connecting) immediately after the event in question. The scroll bar can be
driven up to the event and all of the data associated with the event can be selected, copied, and pasted
into Microsoft® Excel® or other spreadsheet program as described below.
For longer term data, it is useful to capture the data in a text file. With the desired data streaming to the
screen, select “Capture Text” from the Transfer Menu. Type in the path and file name you wish to use.
Push the start button. When the data collection period is complete, simply select “Capture Text” from
the Transfer Menu and select “Stop” from the sub-menu that appears.
Data that is selected and copied, either directly from HyperTerminal® or from a text file can be pasted
directly into Excel®. When the data is pasted it will all be in the selected column. Select “Text to
Columns...” under the Data menu in Excel® and a Text to Columns Wizard (dialog box) will appear.
Make sure that “Fixed Width” is selected under Original Data Type in the first dialog box and click “Next”.
In the second dialog box, set the column widths as desired, but the default is usually acceptable. Click
on “Next” again. In the third dialog box, make sure the column data format is set to “General”, and click
“Finish”. This separates the data into columns for manipulation and removes symbols such as the plus
signs from the numbers. Once the data is in this format, it can be graphed or manipulated as desired.
For extended term data capture see: “Sending a Simple Script to HyperTerminal®” on page 20.
Data Format:
The data stream on the screen represents the flow parameters of the main mode in the units shown on
the display. For volumetric flow meters, there are two columns of data representing volumetric flow rate
in the units specified at time of order and the selected gas.
+4.123 Air
+4.123 Air
+4.123 Air
+4.123 Air
+4.124 Air
+4.125 Air
V Series Volumetric Flow Meter Data Format
For mass flow meters, there are 5 columns of data representing pressure, temperature, volumetric flow,
mass flow and the selected gas. The first column is absolute pressure (normally in PSIA), the second
column is temperature (normally in °C), the third column is volumetric flow rate (in the units specified at
time of order and shown on the display), and the fourth column is mass flow (also in the units specified
at time of order and shown on the display). For instance, if the meter was ordered in units of SCFM,
the display on the meter would read 2.004 SCFM and the last two columns of the output below would
represent volumetric flow and mass flow in CFM and SCFM respectively.
+014.70 +025.00 +02.004 +02.004 Air
+014.70 +025.00 +02.004 +02.004 Air
+014.70 +025.00 +02.004 +02.004 Air
+014.70 +025.00 +02.004 +02.004 Air
+014.70 +025.00 +02.004 +02.004 Air
+014.70 +025.00 +02.004 +02.004 Air
M Series Mass Flow Meter Data Format
19
Sending a Simple Script File to HyperTerminal®
It is sometimes desirable to capture data for an extended period of time. Standard streaming mode
information is useful for short term events, however, when capturing data for an extended period of
time, the amount of data and thus the file size can become too large very quickly. Without any special
programming skills, the user can use HyperTerminal and a text editing program such as Microsoft Word
to capture text at user defined intervals.
1. Open your text editing program, MS Word for example.
2. Set the cap lock on so that you are typing in capital letters.
3. Beginning at the top of the page, type A<Enter> repeatedly. If you’re using MS Word, you can tell how
many lines you have by the line count at the bottom of the screen. The number of lines will correspond
to the total number of times the flow device will be polled, and thus the total number of lines of data it
will produce.
For example:A
A
A
A
A
A
will get a total of six lines of data from the flow meter, but you can enter as many as you like.
The time between each line will be set in HyperTerminal.
4. When you have as many lines as you wish, go to the File menu and select save. In the save dialog
box, enter a path and file name as desired and in the “Save as Type” box, select the plain text (.txt)
option. It is important that it be saved as a generic text file for HyperTerminal to work with it.
5. Click Save.
6. A file conversion box will appear. In the “End Lines With” drop down box, select CR Only. Everything
else can be left as default.
7. Click O.K.
8. You have now created a “script” file to send to HyperTerminal. Close the file and exit the text editing
program.
9. Open HyperTerminal and establish communication with your flow device as outlined in the manual.
10. Set the flow device to Polling Mode as described in the manual. Each time you type A<Enter>, the
meter should return one line of data to the screen.
11. Go to the File menu in HyperTerminal and select “Properties”.
12. Select the “Settings” tab.
13. Click on the “ASCII Setup” button.
14. The “Line Delay” box is defaulted to 0 milliseconds. This is where you will tell the program how often
to read a line from the script file you’ve created. 1000 milliseconds is one second, so if you want a line
of data every 30 seconds, you would enter 30000 into the box. If you want a line every 5 minutes, you
would enter 300000 into the box.
15. When you have entered the value you want, click on OK and OK in the Properties dialog box.
16. Go the Transfer menu and select “Send Text File…” (NOT Send File…).
17. Browse and select the text “script” file you created.
18. Click Open.
19. The program will begin “executing” your script file, reading one line at a time with the line delay you
specified and the flow device will respond by sending one line of data for each poll it receives, when it
receives it.
You can also capture the data to another file as described in the manual under “Collecting Data”. You
will be simultaneously sending it a script file and capturing the output to a separate file for analysis.
20
Operating Principle
All M or V Series Gas Flow Meters are based on the accurate measurement of volumetric flow. The
volumetric flow rate is determined by creating a pressure drop across a unique internal restriction,
known as a Laminar Flow Element (LFE), and measuring differential pressure across it. The restriction
is designed so that the gas molecules are forced to move in parallel paths along the entire length of the
passage; hence laminar (streamline) flow is established for the entire range of operation of the device.
Unlike other flow measuring devices, in laminar flow meters the relationship between pressure drop
and flow is linear. The underlying principle of operation of the 16 Series flow meters is known as the
Poiseuille Equation:
Q = (P1-P2)�r4/8ηL
Where:
Q P1 P2
r
η
L
=
=
=
=
=
=
(Equation 1)
Volumetric Flow Rate
Static pressure at the inlet
Static pressure at the outlet
Radius of the restriction
(eta) absolute viscosity of the fluid
Length of the restriction
Since �, r and L are constant; Equation 1 can be rewritten as:
Q = K (∆P/η) (Equation 2)
Where K is a constant factor determined by the geometry of the restriction. Equation 2 shows the linear
relationship between volumetric flow rate (Q) differential pressure (∆P) and absolute viscosity (η) in a
simpler form.
Gas Viscosity: In order to get an accurate volumetric flow rate, the gas being measured must be
selected (see Gas Select Mode, page 12). This is important because the device calculates the flow
ratebased on the viscosity of the gas at the measured temperature. If the gas being measured is
not what is selected, an incorrect value for the viscosity of the gas will be used in the calculation of
flow, and the resulting output will be inaccurate in direct proportion to the difference in the two gases
viscosities.
Gas viscosity, and thus gas composition, can be very important to the accuracy of the meter. Anything
that has an effect on the gas viscosity (e.g. water vapor, odorant additives, etc.) will have a direct
proportional effect on the accuracy. Selecting methane and measuring natural gas for instance, will
result in a fairly decent reading, but it is not highly accurate (errors are typically < 0.6%) because
natural gas contains small and varying amounts of other gases such as butane and propane that result
in a viscosity that is somewhat different than pure methane.
Absolute viscosity changes very little with pressure (within the operating ranges of these meters) therefore
a true volumetric reading does not require a correction for pressure. Changes in gas temperature do
affect viscosity. For this reason, the M or V Series internally compensate for this change.
21
Other Gases: M Series Flow Meters can easily be used to measure the flow rate of gases other than
those listed as long as “non-corrosive” gas compatibility is observed. For example, a flow meter that
has been set for air can be used to measure the flow of argon.
The conversion factor needed for measuring the flow of different gases is linear and is simply determined
by the ratio of the absolute viscosity of the gases. This factor can be calculated as follows:
Qog = Q1 [η1 / ηog ]
Where:
Q1
η1
Qog
ηog
=
=
=
=
Flow rate indicated by the flow meter
Viscosity of the calibrated gas at the measured temp.
Flow rate of the alternate gas
Viscosity of the alternate gas at the measured temp.
Say we have a meter set for air and we want to flow argon through it. With argon flowing through the
meter, the display reads 110 SLPM. For ease of calculation, let us say the gas temperature is 25°C.
What is the actual flow of argon?
Qog
Q1
η1
ηog
=
=
=
=
Actual Argon Flow Rate
Flow rate indicated by meter (110 SLPM)
Viscosity of gas selected or calibrated for by the meter at the
measured temp.
Viscosity of gas flowing through the meter at the measured temp.
At 25°C, the absolute viscosity of Air (η1) is 184.918 micropoise.
At 25°C, the absolute viscosity of Argon (ηog) is 225.593 micropoise.
Qog
Qog
Qog
=
=
=
Q1 (η 1 / ηog)
110 SLPM (184.918 / 225.593)
90.17 SLPM
So, the actual flow of Argon through the meter is 90.17 SLPM. As you can see, because the Argon gas
is more viscous than the Air the meter is set for, the meter indicates a higher flow than the actual flow.
A good rule of thumb is: “At a given flow rate, the higher the viscosity, the higher the indicated flow.”
Volume Flow vs. Mass Flow: At room temperature and low pressures the volumetric and mass flow
rate will be nearly identical, however, these rates can vary drastically with changes in temperature and/
or pressure because the temperature and pressure of the gas directly affects the volume. For example,
assume a volumetric flow reading was used to fill balloons with 250 mL of helium, but the incoming
line ran near a furnace that cycled on and off, intermittently heating the incoming helium. Because
the volumetric meter simply measures the volume of gas flow, all of the balloons would initially be the
same size. However, if all the balloons are placed in a room and allowed to come to an equilibrium
temperature, they would generally all come out to be different sizes. If, on the other hand, a mass flow
reading were used to fill the balloons with 250 standard mL of helium, the resulting balloons would
initially be different sizes, but when allowed to come to an equilibrium temperature, they would all turn
out to be the same size.
This parameter is called corrected mass flow because the resulting reading has been compensated
for temperature and pressure and can therefore be tied to the mass of the gas. Without knowing the
temperature and pressure of the gas and thus the density, the mass of the gas cannot be determined.
22
Once the corrected mass flow rate at standard conditions has been determined and the density at
standard conditions is known (see the density table at the back of this manual), a true mass flow can
be calculated as detailed in the following example:
Mass Flow Meter Reading = 250 SCCM (Standard Cubic Centimeters/Minute)
Gas: Helium
Gas Density at 25C and 14.696 PSIA = .16353 grams/Liter
True Mass Flow = (Mass Flow Meter Reading) X (Gas Density)
True Mass Flow = (250 CC/min) X (1 Liter / 1000 CC) X (.16353 grams/Liter)
True Mass Flow = 0.0409 grams/min of Helium
Volumetric and Mass Flow Conversion: In order to convert volume to mass, the density of the gas
must be known. The relationship between volume and mass is as follows:
Mass = Volume x Density
The density of the gas changes with temperature and pressure and therefore the conversion of
volumetric flow rate to mass flow rate requires knowledge of density change. Using ideal gas laws, the
effect of temperature on density is:
ρa / ρs = Ts / Ta
Where:
ρa
Ta
ρs
Ts
ºK
=
=
=
=
=
density @ flow condition
absolute temp @ flow condition in °Kelvin
density @ standard (reference ) condition
absolute temp @ standard (reference) condition in °Kelvin
ºC + 273.15 Note: ºK=ºKelvin
The change in density with pressure can also be described as:
ρa / ρs = Pa / Ps
Where:
ρa
Pa
ρs
Ps
=
=
=
=
density @ flow condition
flow absolute pressure
density @ standard (reference ) condition
Absolute pressure @ standard (reference) condition
Therefore, in order to determine mass flow rate, two correction factors must be applied to volumetric
rate: temperature effect on density and pressure effect on density.
Compressibility: Heretofore, we have discussed the gasses as if they were “Ideal” in their characteristics.
The ideal gas law is formulated as:
PV=nRT
where:
P
V
n
R
T
= Absolute Pressure
= Volume (or Volumetric Flow Rate)
= number moles (or Molar Flow Rate)
= Gas Constant (related to molecular weight)
= Absolute Temperature
Most gasses behave in a nearly ideal manner when measured within the temperature and pressure
limitations of our products. However, some gasses (such as propane and butane) can behave in a less
than ideal manner within these constraints. The non-ideal gas law is formulated as:
PV=ZnRT
Where: “Z” is the compressibility factor. This can be seen in an increasingly blatant manner as gasses
approach conditions where they condense to liquid. As the compressibility factor goes down (Z=1 is
the ideal gas condition), the gas takes up less volume than what one would expect from the ideal gas
calculation.
23
This reduces to: Pa Va / Za Ta = Ps Vs / Zs Ts , eliminating R and n.
Our mass flow meters model gas flows based upon the non-ideal gas characteristics of the calibrated
gas. The flow corrections are normally made to 25 C and 14.696 PSIA and the compressibility factor
of the gas under those conditions. This allows the user to multiply the mass flow rate by the density of
the real gas at those standard conditions to get the mass flow rate in grams per minute.
Because we incorporate the compressibility factor into our ‘full gas model’; attempts to manually
compute mass flows from only the P, V, and T values shown on the display will sometimes result in
modest errors.
Note: Although the correct units for mass are expressed in grams, kilograms, etc. it has become standard
that mass flow rate is specified in SLPM (standard liters / minute), SCCM (standard cubic centimeters
/ minute) or SmL/M (standard milliliters / minute).
This means that mass flow rate is calculated by normalizing the volumetric flow rate to some standard
temperature and pressure (STP). By knowing the density at that STP, one can determine the mass flow
rate in grams per minute, kilograms per hour, etc.
STP is usually specified as the sea level conditions; however, no single standard exists for this
convention. Examples of common reference conditions include:
0°C
25°C
0°C
70°F
68°F
20°C
and
and
and
and
and
and
14.696 PSIA
14.696 PSIA
760 torr (mmHG)
14.696 PSIA
29.92 inHG
760 torr (mmHG)
M Series Flow Meters reference 25ºC and14.696 PSIA (101.32kPa) - unless ordered otherwise.
Refer to the calibration sheet to confirm the reference point.
Standard Gas Data Tables: We have incorporated the latest data sets from NIST (including their
REFPROP 7 data) in our products’ built-in gas property models. Be aware that calibrators that you may
be spot checking against may be using older data sets such as the widely distributed Air Liquide data.
This may generate apparent calibration discrepancies of up to 0.6% of reading on well behaved gases
and as much as 3% of reading on some gases such as propane and butane, unless the standard was
directly calibrated on the gas in question. As the older standards are phased out of the industry, this
difference in readings will cease to be a problem. If you see a difference between the meter and your inhouse standard, in addition to calling Apex, call the manufacturer of your standard for clarification as to
which data set they used in their calibration. This comparison will in all likelihood resolve the problem.
24
Gas
Number
Short Form
Long Form
0
1
2
3
4
5
6
7
8
9
10
11
12
13
14
15
16
17
18
19
20
21
22
23
24
25
26
Air
Ar
CH4
CO
CO2
C2H6
H2
He
N2
N2O
Ne
O2
C3H8
n-C4H10
C2H2
C2H4
i-C4H10
Kr
Xe
SF6
C-25
C-10
C-8
C-2
C-75
A-75
A-25
27
A1025
28
Star29
29
P-5
Air
Argon
Methane
Carbon Monoxide
Carbon Dioxide
Ethane
Hydrogen
Helium
Nitrogen
Nitrous Oxide
Neon
Oxygen
Propane
normal-Butane
Acetylene
Ethylene
iso-Butane
Krypton
Xenon
Sulfur Hexafluoride
75% Argon / 25% CO2
90% Argon / 10% CO2
92% Argon / 8% CO2
98% Argon / 2% CO2
75% CO2 / 25% Argon
75% Argon / 25% Helium
75% Helium / 25% Argon
90% Helium / 7.5% Argon /
2.5% CO2
(Praxair - Helistar® A1025)
90% Argon / 8% CO2
/ 2% Oxygen
(Praxair - Stargon® CS)
95% Argon / 5% Methane
*in micropoise (1 Poise = gram / (cm) (sec))
Viscosity*
25 deg C
14.696 PSIA
184.918
225.593
111.852
176.473
149.332
93.540
89.153
198.457
178.120
148.456
311.149
204.591
81.458
74.052
104.448
103.177
74.988
251.342
229.785
153.532
205.615
217.529
219.134
223.973
167.451
230.998
234.306
Density**
25 deg C
14.696 PSIA
1.1840
1.6339
0.6569
1.1453
1.8080
1.2385
0.08235
0.16353
1.1453
1.8088
0.8246
1.3088
1.8316
2.4494
1.0720
1.1533
2.4403
3.4274
5.3954
6.0380
1.6766
1.6509
1.6475
1.6373
1.7634
1.2660
0.5306
Compressibility
25 deg C
14.696 PSIA
0.9997
0.9994
0.9982
0.9997
0.9949
0.9924
1.0006
1.0005
0.9998
0.9946
1.0005
0.9994
0.9841
0.9699
0.9928
0.9943
0.9728
0.9994
0.9947
0.9887
0.9987
0.9991
0.9992
0.9993
0.9966
0.9997
1.0002
214.840
0.3146
1.0003
218.817
1.6410
0.9992
223.483
1.5850
0.9993
** Grams/Liter
(NIST REFPROP 7 database)
Gas Viscosities, Densities and Compressibilities at 25o C
25
Gas
Number
Short Form
Long Form
0
1
2
3
4
5
6
7
8
9
10
11
12
13
14
15
16
17
18
19
20
21
22
23
24
25
26
Air
Ar
CH4
CO
CO2
C2H6
H2
He
N2
N2O
Ne
O2
C3H8
n-C4H10
C2H2
C2H4
i-C4H10
Kr
Xe
SF6
C-25
C-10
C-8
C-2
C-75
A-75
A-25
27
A1025
28
Star29
29
P-5
Air
Argon
Methane
Carbon Monoxide
Carbon Dioxide
Ethane
Hydrogen
Helium
Nitrogen
Nitrous Oxide
Neon
Oxygen
Propane
normal-Butane
Acetylene
Ethylene
iso-Butane
Krypton
Xenon
Sulfur Hexafluoride
75% Argon / 25% CO2
90% Argon / 10% CO2
92% Argon / 8% CO2
98% Argon / 2% CO2
75% CO2 / 25% Argon
75% Argon / 25% Helium
75% Helium / 25% Argon
90% Helium / 7.5% Argon
/ 2.5% CO2
(Praxair - Helistar® A1025)
90% Argon / 8% CO2
/ 2% Oxygen
(Praxair - Stargon® CS)
95% Argon / 5% Methane
*in micropoise (1 Poise = gram / (cm) (sec))
Viscosity*
0 deg C
14.696 PSIA
172.588
209.566
103.657
165.130
137.129
86.127
83.970
186.945
166.371
136.350
293.825
190.555
74.687
67.691
97.374
94.690
68.759
232.175
212.085
140.890
190.579
201.897
203.423
208.022
154.328
214.808
218.962
Density**
0 deg C
14.696 PSIA
1.2927
1.7840
0.7175
1.2505
1.9768
1.3551
0.08988
0.17849
1.2504
1.9778
0.8999
1.4290
2.0101
2.7048
1.1728
1.2611
2.6893
3.7422
5.8988
6.6154
1.8309
1.8027
1.7989
1.7877
1.9270
1.3821
0.5794
Compressibility
0 deg C
14.696 PSIA
0.9994
0.9991
0.9976
0.9994
0.9933
0.9900
1.0007
1.0005
0.9995
0.9928
1.0005
0.9990
0.9787
0.9587
0.9905
0.9925
0.9627
0.9991
0.9931
0.9850
0.9982
0.9987
0.9988
0.9990
0.9954
0.9995
1.0002
201.284
0.3434
1.0002
203.139
1.7918
0.9988
207.633
1.7307
0.9990
** Grams/Liter
(NIST REFPROP 7 database)
Gas Viscosities, Densities and Compressibilities at 0o C
26
Volumetric Flow Meters Under Pressure
V Series Volumetric Flow Meters are intended for use in low pressure applications. This is
because an accurate measurement of the volumetric flow rate by means of differential pressure
requires the flow at the differential pressure sensor to be in a laminar state. The state of the flow
is quantified by what is known as the Reynolds Number. If the Reynolds Number gets above a
certain point, generally accepted as approximately 2000, the flow will become non-laminar. The
Reynolds Number for a given Newtonian fluid flow is defined as:
Re = ρVL/η
Where: ρ =
V =
L =
η =
density
average velocity
Constant determined by length and geometry of passage
absolute viscosity
From this relationship we see that increasing the gas density or velocity increases the Reynolds
Number, and increasing the gas viscosity decreases the Reynolds number. For a given gas in
a given meter at a given temperature, L and η are roughly fixed constants.
For the purpose of illustration, let us put two 100 (S)LPM flow meters, identical in every way
except that one is a volumetric flow meter and one is a mass flow meter, in series with one
another in a pipeline. Now let us pass a small constant air flow through the meters, thus fixing
the velocity V though both meters. With the flow fixed, let us begin increasing the pressure,
and thus the density ρ. The mass flow meter, which is measuring the absolute pressure and
compensating for the density change registers this pressure increase as an increase in mass
flow rate because the number of molecules of gas keeps going up in the fixed volume of flow.
In addition, the Reynolds number has increased proportionately with the pressure increase
because the density goes up with the pressure. If you increase the pressure high enough,
the mass flow meter will max out at 100 SLPM, the Reynolds number has increased fairly
dramatically, and the volumetric meter still registers your small fixed flow rate.
Now if we maintain the higher pressure and try to take the volumetric meter up to its published
full scale flow of 100 LPM, our density ρ AND our velocity V will be high, which often results
in a high Reynolds number and non-laminar flow. When the flow is non-laminar, the Poiseuille
Equation upon which we base our volumetric flow measurement is no longer valid and the
meter reading is therefore no longer valid.
Gas properties also need to be taken into account in deciding whether you can use a volumetric
flow meter at a particular line pressure. Helium, which has a relatively low density and a
relatively high viscosity at standard conditions, can generally get away with higher pressures in
a volumetric flow meter. Propane, on the other hand, has a relatively high density and relatively
low viscosity making it a considerably more difficult gas to measure at higher pressures in a
volumetric flow meter. In air, most volumetric meters make valid full scale measurements up to
10-15 PSIG line pressure.
27
TROUBLESHOOTING
Display does not come on or is weak.
Check power and ground connections.
Flow reading is approximately fixed either near zero or near full scale regardless of actual line
flow.
Differential pressure sensor may be damaged. Avoid installations that can subject sensor to pressure
drops in excess of 10 PSID. A common cause of this problem is instantaneous application of highpressure gas as from a snap acting solenoid valve upstream of the meter. Damage due to excessive
pressure differential is not covered by warranty.
Displayed mass flow, volumetric flow, pressure or temperature is flashing and message MOV,
VOV, POV or TOV is displayed:
Our flow meters and controllers display an error message (MOV = mass overrange, VOV = volumetric
overrange, POV = pressure overrange, TOV = temperature overrange) when a measured parameter
exceeds the range of the sensors in the device. When any item flashes on the display, neither the
flashing parameter nor the mass flow measurement is accurate. Reducing the value of the flashing
parameter to within specified limits will return the unit to normal operation and accuracy.
Meter reads negative flow when there is a confirmed no flow condition.
This is an indication of an improper tare. If the meter is tared while there is flow, that flow is accepted as
zero flow. When an actual zero flow condition exists, the meter will read a negative flow. Simply re-tare
at the confirmed zero flow condition. Also note that while the meter is intended for positive flow, it will
read negative flow with reasonable accuracy (it is not calibrated for bi-directional flow) and no damage
will result.
Meter does not agree with another meter I have in line.
Volumetric meters will often not agree with one another when put in series because they are affected
by pressure drops. Volumetric flow meters should not be compared to mass flow meters. Mass flow
meters can be compared against one another provided there are no leaks between the two meters and
they are set to the same standard temperature and pressure. Both meters must also be calibrated (or
set) for the gas being measured. M Series mass flow meters are normally set to Standard Temperature
and Pressure conditions of 25° C and 14.696 PSIA. Note: it is possible to special order meters with a
customer specified set of standard conditions. The calibration sheet provided with each meter lists its
standard conditions.
Flow flutters or is jumpy.
The meters are very fast and will pick up any actual flow fluctuations such as from a diaphragm pump,
etc. Also, inspect the inside of the upstream connection for debris such a Teflon tape shreds. Note: M
& V Series meters feature a programmable geometric running average (GRA) that can aid in allowing
a rapidly fluctuating flow to be read.
The output signal is lower than the reading at the display.
This can occur if the output signal is measured some distance from the meter as voltage drops in the
wires increase with distance. Using heavier gauge wires, especially in the ground wire, can reduce this
effect.
My volumetric meter reading is strange, inconsistent, or incorrect.
Make sure you use a volumetric flow meter only under low pressure (close to atmospheric) and with
little to no back pressure for accurate readings. Mass meters should be used for higher pressure
applications. See page 26.
RS-232 Serial Communications is not responding.
Check that your meter is powered and connected properly. Be sure that the port on the computer to which
the meter is connected is active. Confirm that the port settings are correct per the RS-232 instructions
in this manual (Check the RS-232 communications select screen for current meter readings). Close
HyperTerminal® and reopen it. Reboot your PC.
28
Slower response than specified.
M or V Series meters feature an RS-232 programmable Geometric Running Average (GRA). Depending
on the full scale range of the meter, it may have the GRA set to enhance the stability/readability of
the display, which would result in slower perceived response time. If you require the fastest possible
response time, please consult the factory for written instructions on adjusting the GRA.
Jumps to zero at low flow.
M or V Series meters feature an RS-232 programmable zero deadband. The factory setting is usually
0.5% of full scale. This can be adjusted via RS-232 programming between NONE and 6.375% of full
scale. Contact the factory for more information.
Discrepancies between old and new units.
Please see “Standard Gas Data Tables” explanation on page 24.
Maintenance and Recalibration
General: M or V Series Flow Meters require minimal maintenance. They have no moving parts. The
single most important thing that affects the life and accuracy of these devices is the quality of the gas
being measured. The meter is designed to measure CLEAN, DRY, NON-CORROSIVE gases. A 20
micron filter (50 micron for 50 LPM and up) mounted upstream of the meter is highly recommended.
Moisture, oil, and other contaminants can affect the laminar flow elements and/or reduce the area that
is used to calculate the flow rate. This directly affects the accuracy.
Recalibration: The recommended period for recalibration is once every year. Providing that the CLEAN,
DRY, and NON-CORROSIVE mantra is observed, this periodic recalibration is sufficient. A label located
on the back of the meter lists the recalibration due date. The meter should be returned to the factory for
recalibration near the listed due date. Before calling to schedule a recalibration, please note the serial
number on the back of the meter. The Serial Number, Model Number, and Date of Manufacture are also
available on the Manufacture Data 2 screen (page 14).
Cleaning: M or V Series Flow Meters require no periodic cleaning. If necessary, the outside of the meter
can be cleaned with a soft dry rag. Avoid excess moisture or solvents.
For repairs, recalibrations, or recycling of this product contact:
Apex Vacuum
222 Riverstone Drive
Canton, GA 30114
USA
Ph. 404-474-3115
Website: www.apexvacuum.com
Warranty
This product is warranted to the original purchaser for a period of one year from the date of purchase
to be free of defects in material or workmanship. Under this warranty the product will be repaired or
replaced at manufacturer’s option, without charge for parts or labor when the product is carried or
shipped prepaid to the factory together with proof of purchase. This warranty does not apply to cosmetic
items, nor to products that are damaged, defaced or otherwise misused or subjected to abnormal use.
See “Application” under the Installation section. Where consistent with state law, the manufacturer shall
not be liable for consequential economic, property, or personal injury damages. The manufacturer does
not warrant or assume responsibility for the use of its products in life support applications or systems.
29
Technical Data for Micro Flow Mass & Volumetric Flow Meters
0-0.5SCCM Full Scale up to 0-50SCCM Full Scale
Specification
Accuracy
High Accuracy Option
Repeatability
Operating Range
Typical Response Time
Standard Conditions (STP)
Operating Temperature
Zero Shift
Span Shift
Humidity Range
Measurable Flow Rate
Maximum Pressure
Mass Meter
Volumetric Meter
Description
At
calibration
conditions after tare
± 0.8% of Reading ±0.2% of Full Scale
At calibration conditions after tare
± 0.4% of Reading ±0.2% of Full Scale
± 0.2%
Full Scale
1% to 100% Full Scale
Measure
10
Milliseconds (Adjustable)
25ºC & 14.696PSIA
Not Applicable
Mass Reference Conditions
−10 to +50
ºCelsius
0.02%
Full Scale / ºCelsius / Atm
0.02%
Full Scale / ºCelsius / Atm
0 to 100%
Non–Condensing
128%
Full Scale
125
125*
PSIG
Mass, Volume, Pressure
Input /Output Signal Digital
Volumetric Flow
RS-232 Serial
& Temperature
Input / Output Signal Analog
Mass Flow
Volumetric Flow
0-5Vdc
Optional Input / Output Mass, Volume, Pressure
0-5 Vdc or 0-10Vdc or 4Volumetric Flow
Signal Secondary Analog
or Temperature
20mA
Electrical Connections
8 Pin
Mini-DIN
Supply Voltage
7 to 30 Vdc (15-30Vdc for 4-20mA outputs)
Supply Current
0.035Amp (+ output current on 4-20mA)
Mounting Attitude Sensitivity
0%
Tare after installation
Warm-up Time
<1
Second
303 & 302 Stainless Steel, Viton®, Silicon, RTV, Glass Reinforced Nylon,
Wetted Materials
Aluminum, Buna-N.
* Volumetric meters only: Operating pressure limitations determined by Reynolds number thresholds. For
operating pressures >10PSIG, please contact the manufacturer for more details.
Mechanical Specifications
Full Scale Flow
Full Scale Flow
Mechanical
Process
Pressure Drop2
Mass Meter
Volumetric Meter
Dimensions
Connections1
(PSID)
0.5SCCM up to
0.5CCM up to
0.5
1SCCM
1CCM
10-32 Female
3.9”H x 2.4”W x 1.1”D
Thread*
2SCCM up to
2CCM up to
1.0
50SCCM
50CCM
∗ Units ≤50SCCM F.S. are shipped with 10-32 Male Buna-N O-ring face seal to 1/8” Female NPT fittings.
These adaptor fittings were selected for customer convenience in process connection. It should be noted
that the 1/8” Female NPT introduces additional dead volume. To minimize dead volume, please see
Accessories for the 10-32 Male to 1/8”OD compression fitting.
1. Compatible with Beswick®, Swagelok® tube, Parker®, face seal, push connect and compression adapter
fittings.
2. Lower Pressure Drops Available, please contact the manufacturer.
Dimensional Drawings: page 33
30
Technical Data for Low Flow Mass & Volumetric Flow Meters
>50SCCM Full Scale up to 0-20SLPM Full Scale
Specification
Accuracy
High Accuracy Option
Repeatability
Operating Range
Typical Response Time
Standard Conditions (STP)
Operating Temperature
Zero Shift
Span Shift
Humidity Range
Measurable Flow Rate
Maximum Pressure
Mass Meter
Volumetric Meter
Description
At calibration conditions after tare
± 0.8% of Reading ±0.2% of Full Scale
At calibration conditions after tare
± 0.4% of Reading ±0.2% of Full Scale
± 0.2%
Full Scale
1% to 100% Full Scale
Measure
10
Milliseconds (Adjustable)
25ºC & 14.696PSIA
Not Applicable
Mass Reference Conditions
−10 to +50
ºCelsius
0.02%
Full Scale / ºCelsius / Atm
0.02%
Full Scale / ºCelsius / Atm
0 to 100%
Non–Condensing
128%
Full Scale
125
125*
PSIG
Mass, Volume, Pressure
Input /Output Signal Digital
Volumetric Flow
RS-232 Serial
& Temperature
Input / Output Signal Analog
Mass Flow
Volumetric Flow
0-5Vdc
Optional Input / Output Mass, Volume, Pressure
0-5 Vdc or 0-10Vdc or 4Volumetric Flow
Signal Secondary Analog
or Temperature
20mA
Electrical Connections
8 Pin
Mini-DIN
Supply Voltage
7 to 30 Vdc (15-30Vdc for 4-20mA outputs)
Supply Current
0.035Amp (+ output current on 4-20mA)
Mounting Attitude Sensitivity
0%
Tare after installation
Warm-up Time
<1
Second
303 & 302 Stainless Steel, Viton®, Silicon, RTV, Glass Reinforced Nylon,
Wetted Materials
Aluminum.
* Volumetric meters only: Operating pressure limitations determined by Reynolds number thresholds. For
operating pressures >10PSIG, please contact the manufacturer for more details.
Mechanical Specifications
Full Scale Flow
Mass Meter
Full Scale Flow
Volumetric Meter
Mechanical
Dimensions
Process
Connections1
Pressure Drop2
(PSID)
>50SCCM to
10SLPM
>50CCM to 10LPM
4.1”H x 2.4”W x 1.1”D
1/8” NPT Female
1.0
>50SCCM to
20SLPM
>50CCM to 20LPM
4.2”H x 2.4”W x 1.1”D
1/8” NPT Female
1.0
1. Compatible with Beswick®, Swagelok® tube, Parker®, face seal, push connect and compression adapter
fittings.
2. Lower Pressure Drops Available, please contact the manufacturer.
Dimensional Drawings: page 33, 34
31
Technical Data for Moderate Flow Mass & Volumetric Flow Meters
>20SLPM Full Scale up to 0-250SLPM Full Scale
Specification
Accuracy
High Accuracy Option
Repeatability
Operating Range
Typical Response Time
Standard Conditions (STP)
Operating Temperature
Zero Shift
Span Shift
Humidity Range
Measurable Flow Rate
Maximum Pressure
Mass Meter
Volumetric Meter
Description
At calibration conditions after tare
± 0.8% of Reading ±0.2% of Full Scale
At calibration conditions after tare
± 0.4% of Reading ±0.2% of Full Scale
± 0.2%
Full Scale
1% to 100% Full Scale
Measure
10
Milliseconds (Adjustable)
25ºC & 14.696PSIA
Not Applicable
Mass Reference Conditions
−10 to +50
ºCelsius
0.02%
Full Scale / ºCelsius / Atm
0.02%
Full Scale / ºCelsius / Atm
0 to 100%
Non–Condensing
128%
Full Scale
125
125*
PSIG
Mass, Volume, Pressure
Input /Output Signal Digital
Volumetric Flow
RS-232 Serial
& Temperature
Input / Output Signal Analog
Mass Flow
Volumetric Flow
0-5Vdc
Optional Input / Output Mass, Volume, Pressure
0-5 Vdc or 0-10Vdc or 4Volumetric Flow
or Temperature
Signal Secondary Analog
20mA
Electrical Connections
8 Pin
Mini-DIN
Supply Voltage
7 to 30 Vdc (15-30Vdc for 4-20mA outputs)
Supply Current
0.035Amp (+ output current on 4-20mA)
Mounting Attitude Sensitivity
0%
Tare after installation
Warm-up Time
<1
Second
303 & 302 Stainless Steel, Viton®, Silicon, RTV, Glass Reinforced Nylon,
Wetted Materials
Aluminum.
* Volumetric meters only: Operating pressure limitations determined by Reynolds number thresholds. For
operating pressures >10PSIG, please contact the manufacturer for more details.
Mechanical Specifications
Full Scale Flow
Mass Meter
Full Scale Flow
Volumetric Meter
Mechanical
Dimensions
Process
Connections1
>20 to 100SLPM
>20 to 100SLPM
4.4”H x 4.0”W x 1.1”D
1/4” NPT Female
>50SCCM to
20SLPM
>50CCM to 20LPM
5.0”H x 4.0”W x 1.6”D
1/2” NPT Female
Pressure Drop2
(PSID)
1.0
1.7
1. Compatible with Beswick®, Swagelok® tube, Parker®, face seal, push connect and compression adapter
fittings.
2. Lower Pressure Drops Available, please contact the manufacturer.
Dimensional Drawings: page 34, 35
32
Technical Data for High Flow Mass & Volumetric Flow Meters
>250 SLPM Full Scale up to 0-1500 SLPM Full Scale
Specification
Accuracy
High Accuracy Option
Repeatability
Operating Range
Typical Response Time
Standard Conditions (STP)
Operating Temperature
Zero Shift
Span Shift
Humidity Range
Measurable Flow Rate
Maximum Pressure
Mass Meter
Volumetric Meter
Description
At calibration conditions after tare
± 0.8% of Reading ±0.2% of Full Scale
At calibration conditions after tare
± 0.4% of Reading ±0.2% of Full Scale
± 0.2%
Full Scale
1% to 100% Full Scale
Measure
10
Milliseconds (Adjustable)
25ºC & 14.696PSIA
Not Applicable
Mass Reference Conditions
−10 to +50
ºCelsius
0.02%
Full Scale / ºCelsius / Atm
0.02%
Full Scale / ºCelsius / Atm
0 to 100%
Non–Condensing
128%
Full Scale
125
125*
PSIG
Mass, Volume, Pressure
Input /Output Signal Digital
Volumetric Flow
RS-232 Serial
& Temperature
Input / Output Signal Analog
Mass Flow
Volumetric Flow
0-5Vdc
Optional Input / Output Mass, Volume, Pressure
0-5 Vdc or 0-10Vdc or 4Volumetric Flow
Signal Secondary Analog
or Temperature
20mA
Electrical Connections
8 Pin
Mini-DIN
Supply Voltage
7 to 30 Vdc (15-30Vdc for 4-20mA outputs)
Supply Current
0.035Amp (+ output current on 4-20mA)
Mounting Attitude Sensitivity
0%
Tare after installation
Warm-up Time
<1
Second
303 & 302 Stainless Steel, Viton®, Silicon, RTV, Glass Reinforced Nylon,
Wetted Materials
Aluminum.
* Volumetric meters only: Operating pressure limitations determined by Reynolds number thresholds. For
operating pressures >10PSIG, please contact the manufacturer for more details.
Mechanical Specifications
Full Scale Flow
Full Scale Flow
Mechanical
Process
Pressure Drop2
1
Mass Meter
Volumetric Meter
Dimensions
Connections
(PSID)
>250SLPM
>250LPM
2.5
1000SLPM
1000LPM
5.0”H x 4.0”W x 1.6”D
3/4” NPT Female
6.8
1500SLPM
1500LPM
12.0
1. Compatible with Beswick®, Swagelok® tube, Parker®, face seal, push connect and compression adapter
fittings.
2. Lower Pressure Drops Available, Please contact the manufacturer.
Dimensional Drawings: page 35
33
34
35
36
Option: Totalizing Mode
M or V Series Flow Meters and Controllers can be purchased with the Totalizing Mode option. This
option adds an additional mode screen that displays the total flow (normally in the units of the main flow
screen) that has passed through the meter or controller since the last time the totalizer was cleared.
The Totalizing Mode screen shown below is accessed by pushing the “MODE” button until the label
over it reads “Total”. If your meter is ordered with Totalizing Mode option, pushing the “Mode” button
once will bring up the “Totalizing Mode” display. Pushing “Mode” a second time will bring up the “Select
Menu” display. Pushing it a third time will return you to the Main Mode Sreen.
Hours
0.3
Mass
0.00
Clear
Mass
SLtr
Air
+0.0 SCCM
Total
Counter – The counter can have as many as six digits. At the time of order, the customer must specify
the resolution of the count. This directly affects the maximum count. For instance, if a resolution of
1/100ths of a liter is specified on a meter which is totalizing in liters, the maximum count would be
9999.99 liters. If the same unit were specified with a 1 liter resolution, the maximum count would be
999999 liters.
Rollover – The customer can also specify at the time of order what the totalizer is to do when the
maximum count is reached. The following options may be specified:
No Rollover – When the counter reaches the maximum count it stops counting until the counter is
cleared.
Rollover – When the counter reaches the maximum count it automatically rolls over to zero and continues
counting until the counter is cleared.
Rollover with Notification – When the counter reaches the maximum count it automatically rolls over to
zero, displays an overflow error, and continues counting until the counter is cleared.
Hours.–.The display will show elapsed time since the last reset in 0.1 hour increments. The maximum
measurable elapsed time is 6553.5 hours (about nine months). The hours count resets when the “clear”
button is pushed, an RS-232 clear is executed or on loss of power
Clear – The counter can be reset to zero at any time by pushing the dynamically labeled “Clear” button
located above the upper right side of the display. To clear the counter via RS-232, establish serial
communication with the meter or controller as described in the RS-232 section of the manual. To reset
the counter, enter the following commands:
In Streaming Mode: $$T <Enter>
In Polling (addressable) Mode: Address$$T <Enter>
37
(e.g. B$$T <Enter>)
Option: 9 Volt Battery Pack
A Battery Pack that uses a common 9 Volt battery can be mounted to the top of your M or V Series Flow
Meter. Power is passed from the battery to the flow meter through the 8 pin Mini-DIN connector. Output
signals from the flow meter or pressure guage are passed through the male connector on the bottom
of the battery pack to the female connector on top of the battery pack so the signals can be accessed
normally. Turn off the switch on top of the battery pack when the meter is not in use. (Note: The Battery
Pack cannot be used with Flow Controllers)
Normal (9V alkaline) battery life is approximately 8 hours (30-40 hours with a 9V-lithium battery), however
many factors can affect this. Replace the battery as often as required. A common indicator that the battery
may be approaching the end of its life is a sharp increase in the temperature indicated on the meter.
This false signal can result when the voltage drops below its normally regulated level. This can affect
the accuracy of the meter so it is good practice to check that the temperature is approximately correct
(25°C is about room temperature) or use a fresh battery especially if the measurement is critical.
Replacing the Battery:
The battery can be replaced with the battery pack installed on the flow meter.
1.
2.
3.
4.
Remove the four Phillips head screws from the back cover and gently remove it as shown below.
Remove the 9V battery, pulling the top of the battery out first.
Remove the old battery from the harness and replace it with a new battery.
Install the new battery bottom end first and replace the back cover so that the cushioning pad
presses directly down on the battery.
5. Replace the four Phillips head screws.
Battery Pack Back Cover Removal
38
Battery Pack Installation and Removal:
The battery must be removed before the battery pack can be installed or removed.
1. Remove the back cover of the battery pack and remove the battery if installed (see “Replacing the
Battery”).
2. Carefully place the battery pack on top of the flow meter, being especially careful that the pins in the
8 pin Mini-DIN plug are inserted properly into the 8 pin Mini-DIN socket on top of the flow meter. The
two screws trapped in the bottom of the battery pack will not allow the plug to be completely inserted
into the socket until they are screwed into place.
3. Slip the included hex wrench into either of the two holes on the top of the battery pack as shown
below and start the screw into the corresponding threaded hole in the top of the meter.
4. Before the screw is tightened down all the way, move the hex wrench to the other hole and tighten
the other screw gently down. Avoid over tightening the screw.
5. Return the hex wrench to the first hole and tighten the first screw gently down. Avoid over tightening
the screw.
6. Install the battery and replace the back cover as described above.
7. Removal is the reverse of the installation.
Wrench Access Hole
Wrench Access Hole
3/32 Hex Wrench
9 volt
battery
Trapped Mounting Screw
Trapped Mounting Screw
8 Pin Mini DIN Plug
Back of
Meter
Battery Pack Installation/Removal
39
Accessories
Battery Pack
Muti-Drop Box
8 Pin Male Mini-DIN connector cable, single ended, 6 foot length
8 Pin Male Mini-DIN connector cable, double ended, 6 foot length
8 Pin Male Mini-DIN connector cable, single ended, 25 foot length
8 Pin Male Right Angle Mini-Din Cable, single ended, 6 foot length
8 Pin Male Mini-DIN to DB9 Female Adaptor 6 foot length
AC to DC 12 Volt Power Supply Adapter
AC to DC 24 Volt Power Supply Adapter
AC to DC 12 Volt European Power Supply Adapter
AC to DC 24 Volt European Power Supply Adapter
Industrial cable, 6 Pin, single ended, 10 foot length
Flow Conversion Table:
CCM
CCH
LPM
LPH
CFM
CFH
CFH
CFM
LPH
LPM
CCH
0.0021
0.000035
0.06
0.001
60.0
0.00003
0.0000005
0.001
0.000017
1.0
2.1189
0.035
60.0
1.0
60000.0
0.035
0.00059
1.0
0.0166
1000.0
60.0
1.0
1699.0
28.316
1699011.0
1.0
0.0166
28.316
0.4719
28317.0
CCM
1.0
0.0167
1000.0
16.667
28317.0
471.947
40
Serial Number: ____________________________
Model Number: ____________________________
Calibration Certificate
(Store device calibration certificate in the pocket below.)
41