1
Enterprise Reporting Solution
Argos Report Writers Guide
Document Version 2.0
Last Updated 10.18.2010
Table of Contents
Introduction ................................................................................................................. 8
Evisions Support Site ............................................................................................................. 8
In Product Help ........................................................................................................................ 8
Security....................................................................................................................................... 9
Sample Database .................................................................................................................... 9
Getting Started.......................................................................................................... 10
Starting Argos ................................................................................................................................ 10
Change Password ......................................................................................................................... 10
Navigation .................................................................................................................. 11
Action Area ..................................................................................................................................... 11
Navigation Area ............................................................................................................................ 11
Explorer view .......................................................................................................................... 11
QuickLaunch view................................................................................................................. 12
Dashboard view..................................................................................................................... 13
DataBlocks .................................................................................................................. 14
Report Types .............................................................................................................. 15
QuickView................................................................................................................................ 15
CSV............................................................................................................................................. 15
Banded ..................................................................................................................................... 15
Extract ....................................................................................................................................... 15
Creating a QuickView Report ............................................................................... 16
Refresh Tab ..................................................................................................................................... 17
API Tab ............................................................................................................................................. 17
Saved States Tab ........................................................................................................................... 18
Executing a QuickView Report ................................................................................................ 18
Creating a CSV Report ............................................................................................ 19
Report Name and Description .................................................................................................. 19
www.evisions.com
Argos - Argos Report Writers Guide
Document Version 1.0 – Last Updated 10.18.2010
Page 2 of 118
Choose the Database fields to use .......................................................................................... 20
Execute the Report....................................................................................................................... 21
Adding additional fields using expressions ......................................................................... 21
Filter and Sort the Data............................................................................................................... 25
Filters......................................................................................................................................... 26
Sort ............................................................................................................................................ 27
Creating a Basic Banded Report.......................................................................... 28
Introduction ................................................................................................................................... 28
Creating a Basic Banded Report............................................................................................... 29
Select the Report Type ................................................................................................................ 29
Including the database fields into the report ...................................................................... 30
Choosing the Bands to utilize ................................................................................................... 31
Editing the Report Design.......................................................................................................... 33
Resizing and Aligning Fields ..................................................................................................... 35
Resizing Objects .................................................................................................................... 35
Aligning Fields ....................................................................................................................... 36
Selecting and Aligning Multiple Fields........................................................................... 36
Enhancing the Report ................................................................................................................. 37
Sort Employees by Department Name .................................................................................. 37
Add Date, Page Number, Page Count .................................................................................... 38
Creating the Group Bands ......................................................................................................... 41
Moving Dept. Name to Group Header Band ...................................................................... 43
Add Child Band Following the Group Header Band .......................................................... 45
Add Employee Count and Salary Sum ................................................................................... 46
Create Sum of Salaries Expression .......................................................................................... 47
Adding the Summary Band ....................................................................................................... 49
Formatting Numeric Output ................................................................................ 52
Introduction ................................................................................................................................... 52
Selecting/Creating the Format Mask ..................................................................................... 52
Group By Expression ............................................................................................... 55
Introduction ................................................................................................................................... 55
Create the Basic Report .............................................................................................................. 55
Create a Band Group ................................................................................................................... 56
Create the Expression.................................................................................................................. 56
www.evisions.com
Argos - Argos Report Writers Guide
Document Version 1.0 – Last Updated 10.18.2010
Page 3 of 118
Place Expression into Group Header Band ........................................................................... 57
Creating Mailing Labels ......................................................................................... 59
Introduction ................................................................................................................................... 59
Select the Mailing Labels Report Type ................................................................................... 59
Select the fields to use ................................................................................................................ 59
Edit the Fields ................................................................................................................................ 60
Suppress printing of empty lines............................................................................................. 63
Group Band on new page/reset counter ......................................................... 64
Introduction ................................................................................................................................... 64
Force Group Header on new page .......................................................................................... 65
Reset the COUNTER expression ............................................................................................... 66
Conditional Printing ................................................................................................ 67
Introduction ................................................................................................................................... 67
Starting with a Blank Report Type...................................................................... 70
Introduction ................................................................................................................................... 70
Create a New Report .................................................................................................................... 70
Adding Bands ................................................................................................................................ 70
Using Sub-Detail Bands.......................................................................................... 71
Introduction ................................................................................................................................... 71
The Report Contents.................................................................................................................... 71
Create the Title and Detail Bands ............................................................................................ 73
Create the datasets ...................................................................................................................... 73
Create the Four Sub-Detail Bands ........................................................................................... 75
Move fields into the Sub-Detail Bands ................................................................................... 76
Obtaining tables from an external database ....................................................................... 77
Adding Parameter Input to the Report ............................................................ 79
Link With Band .......................................................................................................... 81
Lonely Group Header Band................................................................................................ 81
Lonely Group Footer Band ................................................................................................. 81
Creating a Chart ........................................................................................................ 84
www.evisions.com
Argos - Argos Report Writers Guide
Document Version 1.0 – Last Updated 10.18.2010
Page 4 of 118
Create the Title, Column Header, and Detail Bands ................................................... 84
Add a Summary Band .......................................................................................................... 85
Add a Chart Object ............................................................................................................... 85
Follow the Chart Wizard...................................................................................................... 85
Creating an Extract Report.................................................................................... 88
Introduction ................................................................................................................................... 88
Sections in the Extract Report ........................................................................................... 88
The Report Specification ............................................................................................................ 90
Report Creation Steps ................................................................................................................. 92
Create a New Report .................................................................................................................... 93
The Extract Report Editor ........................................................................................................... 94
Configure the Report................................................................................................................... 95
Add datasets .................................................................................................................................. 96
Add the section for the T Record Type (Title Section) ....................................................... 98
Add the section...................................................................................................................... 98
Add fields to the section ..................................................................................................... 99
Save your work and test the report .............................................................................. 101
Add the section for the A Record Type (Detail Section) ................................................ 102
Add the section................................................................................................................... 102
Add the fields ...................................................................................................................... 102
Add the section for the B Record Type (Detail Section)................................................. 103
Add the section and fields............................................................................................... 104
Save your work and test the report .............................................................................. 104
Add the Sections for the C Record Type (Header and Footer Sections) ................... 105
Add a Header Section ....................................................................................................... 105
Add a Footer Section ........................................................................................................ 105
Add the fields to the C Record ....................................................................................... 106
Add the Section for the F Record Type (Summary Section) ......................................... 107
Add a Summary Section................................................................................................... 107
Add the fields ...................................................................................................................... 107
Save your work and test the report .............................................................................. 108
Execute the Report.................................................................................................................... 109
The Report in Delimited Report Format ............................................................................. 110
The Report in XML Report Format ........................................................................................ 110
Argos Resources .................................................................................................... 112
www.evisions.com
Argos - Argos Report Writers Guide
Document Version 1.0 – Last Updated 10.18.2010
Page 5 of 118
The Support Site ........................................................................................................................ 112
The CO-OP User Community ................................................................................................. 113
Important Links .......................................................................................................................... 113
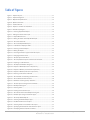
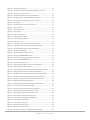
Table of Figures...................................................................................................... 114
www.evisions.com
Argos - Argos Report Writers Guide
Document Version 1.0 – Last Updated 10.18.2010
Page 6 of 118
Trademark, Publishing Statement and Copyright Notice
© 2010 Evisions, Inc. All rights reserved.
This software and related documentation are provided under a license agreement containing restrictions on use and disclosure and are protected by intellectual
property laws. No part of this document may be reproduced, stored in or introduced into a retrieval system, or transmitted in any form or by any means
(electronic, mechanical, photocopying, recording, or otherwise), or for any purpose, without the express written permission of Evisions, Inc.
The information contained herein is subject to change without notice and is not warranted to be error-free. Product features referenced herein for a period of
time may not match product contents. Evisions, Inc. does not warrant that the functions contained in the software will meet your requirements or that the
operation of the software will be uninterrupted or error free. Evisions, Inc. reserves the right to make changes and/or improvements in the software without notice
at any time.
This software and documentation may provide access to or information on content, products, and services from third parties. Evisions, Inc. and its affiliates are not
responsible for and expressly disclaim all warranties of any kind with respect to third-party content, products, and services. Evisions, Inc. and its affiliates will not
be responsible for any loss, costs, or damages incurred due to your access to or use of third-party content, products, or services. Evisions, Inc. does not endorse the
content or developer of any products or web sites mentioned.
All information in this guide is designed for instructional purposes only. Evisions, Inc. makes no guarantees regarding the accuracy or performance of any
techniques used in this guide. Software configurations and environments may vary, and some techniques used in this guide may not operate efficiently under all
configurations. This guide may contain examples of various technologies or products, which are the sole property and responsibility of their creators.
Trademarks are the property of the respective owners for any products mentioned herein.
www.evisions.com
Argos - Argos Report Writers Guide
Document Version 1.0 – Last Updated 10.18.2010
Page 7 of 118
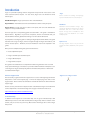
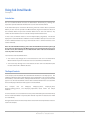
Introduction
Argos is a powerful reporting solution designed for everyone from novice users to the
most seasoned technical experts. For ease of use, Argos users are divided into three
distinct types:
Argos
Evisions solution for building and deploying
reports and dashboards across the enterprise.
DataBlock Designers: Argos “power users” who create DataBlocks.
Report Writers: Intermediate users who use DataBlocks to build a variety of reports.
DataBlock
Report Viewers: Casual users who are able to run reports, then save and distribute the
output in a variety of useful formats.
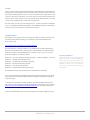
DataBlocks are the foundation of Argos. They
contain user input forms and queries to retrieve
information from one or more data sources.
Reports in Argos have a DataBlock as their
“parent” and each DataBlock can contain
multiple reports.
Each user type has a corresponding guide associated with it. This guide is intended for
Report Writers. Regardless of your level of expertise, Evisions recommends that you
become familiar with this guide before moving on to more advanced features.
A prerequisite to reading this guide is reading the Argos Report Viewers Guide. This guide
describes how to log into Argos, how to navigate through the Argos User Interface, and
how to execute reports. Therefore, this basic information need not be repeated in this
guide.
Explorer Tree
The Argos Explorer Tree is a way to view and
navigate the folders, DataBlocks, and reports in
Argos.
Once you have completed this guide, you should be able to:
Create a QuickView report
Design a Comma Separated Value report
Design a Banded report
Design an Extract report
This guide is not intended to be a comprehensive reference guide that covers each and
every option within Argos. The intent is to provide a sufficient number of examples to aid
a new Argos user to get started quickly, with the In-Product Help used as a reference for
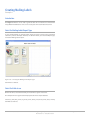
each feature within Argos.
Evisions Support Site
Support icon on Argos toolbar
The easiest way to get to the Evisions support site is to access it through Argos. Under the
Help menu is a link to the Support page. A link to the Support page also exists on the
Argos toolbar. All the technical documentation available for download is found under the
Support page.
Evisions can also provide more in-depth and even customized training via our Professional
Services department. Visit the Consulting Services page on the Evisions web site at
http://www.evisions.com/Services/Overview.aspx
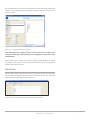
In Product Help
In addition to the Support site is In-Product Help. You can get to In-Product Help a few
different ways. There is a link under the Help menu to Argos Help. There is a button on the
toolbar, and you can also use your F1 key. Most screens within Argos have a link to Argos
Help as well.
www.evisions.com
Argos - Argos Report Writers Guide
Document Version 1.0 – Last Updated 10.18.2010
Page 8 of 118
Security
Access to reports is managed by DataBlock Designers and Administrators by permitting or
denying access to Argos objects. The only level of security available to report writers is a
private report. Making a report private is an action reserved to the user types that can edit
a report. So this means a few things. You cannot create a private report for someone else.
And only report writers and above can create private reports. Report Viewers, since they
cannot create or modify reports, cannot make a report private.
The next security concept is for your information only. You will not be able to implement
it, since it is implemented within the DataBlock. The DataBlock Designer has the ability to
restrict access to a piece of data based on who runs the report.
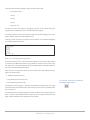
Sample Database
The examples in this guide are based on an MS Access database that was created to assist
you with becoming familiar with Argos. The database can be downloaded from the
Evisions web site at:
http://www.evisions.com/Default.aspx?tabid=67&id=745.
The name of the file is “Sample_Database_and_DataBlocks.zip” and after unzipping the
file name of the database will be “Sample.accdb”. Five DataBlocks are included in the zip
file that were used to create Banded Reports in examples 1, 3, 4, 5, 6, 8, 9, and 11 in this
guide. The DataBlocks are named as follows:
Example 1_3_4_9 - basic banded 20100526.argosexport (used by examples 1, 3, 4, and 9)
Example 5 – resetexpr 20100526.argosexport
Example 6 – conditional print 20100526.argosexport
Example 8 – sub-detail 20100526.argosexport
Example 11 – chart 20100526.argosexport
Example 12 – Extract Report.20100929.argosexport
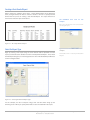
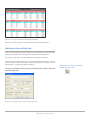
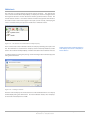
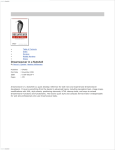
Importing a DataBlock
To import a DataBlock, select a folder within the
Explorer tree where you want the DataBlock to
reside under, right-click and select Import. You
can then enter the location and file name of the
DataBlock to import. You can also find the
Import option under the File Menu in the Argos
Main Interface.
Each DataBlock contains the reports that were created within each example.
You can use the database and DataBlocks to follow along with the examples in this guide.
If you choose to do so, import the five DataBlocks into Argos and follow the examples to
create the reports.
A description of the database contents (.pdf file) can be downloaded from the Evisions
web site and is named “Argos User Guides Sample Database Description” and is located at
http://www.evisions.com/Default.aspx?tabid=67&id=746. The document also describes
how to create the ADO connection to the sample database.
Contact your MAPS Administrator to install the database and create the ADO connection.
www.evisions.com
Argos - Argos Report Writers Guide
Document Version 1.0 – Last Updated 10.18.2010
Page 9 of 118
Getting Started
Starting Argos
Browser support
Argos is Windows PC software which is web-enabled, meaning it is accessible from your
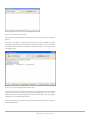
web browser via an Internet connection. Before launching Argos, you may need to disable
any pop-up blockers running on your computer. To disable the pop-up blocker in
Microsoft (MS) Internet Explorer, select Tools, Pop-up Blocker, Turn Off Pop-up Blocker.
You should be able to re-enable the pop-up blocker once you have downloaded the
software.
Connect to the Server
Type the web address provided by your system administrator into the address bar of your
browser to access the Multiple Application Platform Server (MAPS) launch page. This
webpage provides a central access point for all MAPS applications, including Argos,
FormFusion, IntelleCheck and the MAP Server Configuration Tool.
Start Argos
Multiple Application Platform Server
MAPS is the server that delivers the Argos
software to users. Once Argos is installed, users
connect to MAPS which fetches data and
performs other tasks for them.
FormFusion
Evisions solution for enhancing documents and
managing distribution via email, imaging
software, print, etc. Users can rearrange and add
data and images, change the layout, format
fonts, etc.
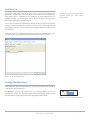
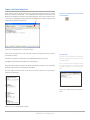
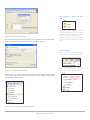
Click Argos from the menu on the left.
Click the “Start Here” button to launch Argos.
NOTE: If this is the first time Argos has been launched from this PC, an
information bar will appear at the top of the screen. Click the bar and
choose “Install ActiveX Control” to install the “MAP Client Universal
Launcher” from “Global Evisions Solutions, Inc.”
Enter your user name and password (obtained from your system administrator) in the
Login box. The “Remember this user” and “Remember the password for this user” are
optional check boxes (available as determined by the MAPS Administrator) that should
not be used on shared computers. Check them as desired.
Click the Login button.
IntelleCheck
Evisions solution for payment processing – AP,
payroll and refund checks, Direct Deposit
Advices and electronic refunds.
ActiveX Control
Browser software components that are needed
to launch Argos.
Password Strategies
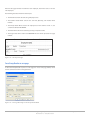
Change Password
To change your password, select Tools from the menu at the top of the screen and then
select Change Password. You must know your current password in order to change it.
The password strength indicator will help you determine if your password is secure
enough. It is advisable to contact your system administrator before changing your
password to verify that the change will not produce any undesirable results.
www.evisions.com
Argos is designed to operate using MS Internet
Explorer browser. You can also use other
browsers, such as Firefox, but they may require
some configuration first.
Argos - Argos Report Writers Guide
Document Version 1.0 – Last Updated 10.18.2010
The following strategies will help you make a
more secure password.
Increase password length
Include letters and numbers.
Use both upper and lower case.
Include special characters [, {, !, ?, etc
Page 10 of 118
Navigation
Argos has been designed with an intelligent interface that knows your user type and
configures menus and buttons to show only those actions permitted.
Menus across the top allow you to take simple actions such as logging into the product,
finding items in the Explorer, customizing your Argos toolbars and changing your
password. You can also access the integrated Help system or visit the Evisions website
that has many helpful resources available. The most common actions are replicated as
buttons just beneath the menus.
At the very bottom of the screen, the status bar tells you what server you are logged into,
your user name and user type.
Between the top and bottom toolbars is the Argos work area. The work area is broken into
two halves. The left half contains the Navigation area while the right half contains the
Action area.
Action Area
The right hand side of the screen will have buttons for any actions you can take on a
selected object. The buttons that show will depend on the type of object you select in the
Navigation area.
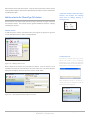
Navigation Area
This area contains the objects that you can perform actions on. There are three different
views you can use for the Navigation area by clicking the desired tab (Explorer,
QuickLaunch, Dashboards). Each of these views is described below.
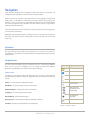
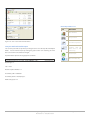
Icon
Explorer Objects
Folder
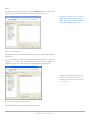
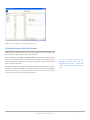
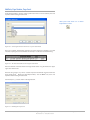
Explorer view
DataBlock
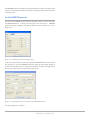
The Explorer is the default view for the Navigation area, in which a simple menu of
available folders and objects is displayed. Argos objects that can be found in the Explorer
include:
QuickView Report
Folders – Contains objects, including other folders
CSV Report
Banded Report
DataBlocks – The “parent” object for one or more reports
QuickView Report – A display-only report or Dashboard
Extract Reports
(Delimited, Fixed
Width, XML)
CSV Report – A comma-separated values report
Banded Report – A fully-formatted report
Private Report
(Banded)
Extract Report – A text report that meets pre-defined specifications
Schedule
Schedule – Reports may be scheduled to run automatically
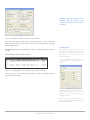
Figure 1 – Explorer objects
www.evisions.com
Argos - Argos Report Writers Guide
Document Version 1.0 – Last Updated 10.18.2010
Page 11 of 118
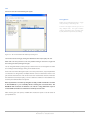
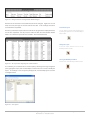
Some objects can be flagged as private. Private objects will not show up in the Explorer
for users other than the creator and the administrator. These objects will have the “private
eye” icon like the sample private Banded report icon on the list to the right.
Dashboards and Schedules will appear in the navigation area only if these features were
purchased and included within your software license.
Reports exist within the Explorer as child objects of a DataBlock. A DataBlock can have
many “child” reports. Any object that has child objects will have a “+” next to it. Simply
click the “+” to expand the object to view its children.
Are my reports secure?
You may be wondering about the security of
reports in Argos. Each object can be assigned to
groups or individuals as needed. Unauthorized
users would not be able to even see objects they
lack permissions for. It is even possible to have
security all the way down to individual fields in a
CSV, Banded, or Extract report.
Is my data secure?
All data transmitted from the server to Argos is
“point-to-point” encrypted, meaning that
anyone other than the intended user would see
only gibberish. Once a report is created, care
should be taken with resulting file(s) to ensure
data security.
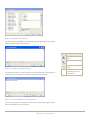
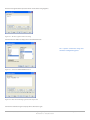
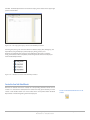
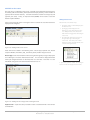
Figure 3 – Explorer Navigation
If you use a DataBlock or report frequently, you can right-click on it and choose “Add to
QuickLaunch”. You can also right-click on a QuickView report and choose “Add to
Dashboard”. This allows you to add objects to the QuickLaunch and Dashboard views,
which can make it easier to find what you need.
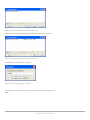
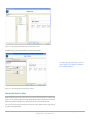
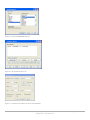
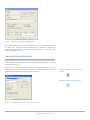
QuickLaunch view
This view can be very convenient as it shows only your available QuickLaunches. You can
even rename a QuickLaunch to something other than the original name. To find the
original object in the Explorer view, right-click a QuickLaunch and choose “Locate” (see
figure on the right). Deleting a QuickLaunch has no effect on the original object.
QuickLaunch
A QuickLaunch is a shortcut to a DataBlock or
Report. They can be Public (so all users can see
them) or Private (so only the creator can see
them). Click the QuickLaunch tab to switch to
the QuickLaunch view.
Figure 2 – Options for QuickLaunch
www.evisions.com
Argos - Argos Report Writers Guide
Document Version 1.0 – Last Updated 10.18.2010
Page 12 of 118
.
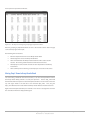
Figure 4 – QuickLaunch View
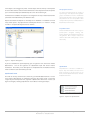
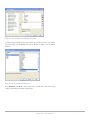
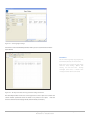
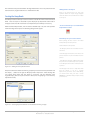
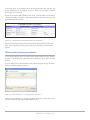
Dashboard view
Dashboards provide an organized, direct way of accessing and running your reports. Here
is an example of a QuickView report that has been run as a Dashboard. The report is
within the main Argos window.
Figure 5 – Dashboard View
www.evisions.com
Argos - Argos Report Writers Guide
Document Version 1.0 – Last Updated 10.18.2010
Page 13 of 118
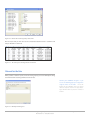
DataBlocks
The DataBlock is the foundation from which all reports are created and contains Forms
and Queries. Only users with DataBlock Designer privileges can create DataBlocks.
The Queries obtain data from a database. When results of a query are displayed on a
form, this is called a QuickView Report. In the case of CSV, Banded, and Extract Reports,
the results of the query become input to the report design with the results displayed or
stored elsewhere. Within the Argos Explorer tree, reports exist as "child" objects of a
DataBlock.
The Form, created by the DataBlock Designer using the Argos DataBlock Designer, is used
for two purposes:
To obtain input selections from the user executing the report. The input selections
can be passed to the queries to limit the results.
To display the results of the report. QuickView reports can display results on the
form.
Whenever a user executes a report, the form designed as part of a DataBlock will be
displayed. The input selections made by the user become query parameters.
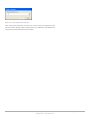
Any report type (QuickView, CSV, Banded, Extract) can utilize the data obtained from the
queries. The tree structure shown on the right denotes that all report types underneath
the DataBlock will obtain the same results from the queries, but of course each report type
will print the data using methods applicable to the given report type.
www.evisions.com
Argos - Argos Report Writers Guide
Document Version 1.0 – Last Updated 10.18.2010
Figure 6 – Reports as children of a
DataBlock
All report types residing under the same
DataBlock share the form. Reports are “children”
of the DataBlock.
Page 14 of 118
Report Types
QuickView
A situation in which a user needs to access information quickly and often is usually a case
in which one would want to use a “QuickView”. A good example is a situation where the
head of Sales needs to view sales results for the organization. The design of the QuickView
report could allow the Sales Manager to view a sales summary for the organization, by
region, for each quarter. The QuickView form could provide additional ‘drill down’
functionality such as monthly sales results for each salesperson. The QuickView results are
displayed directly on the user’s browser.
CSV
A “Comma Separated Value” or “CSV” report is the simplest of Argos report types. A
comma delimited file simply separates the desired columns by a comma or other specified
delimiter. This type of report is especially useful when obtaining data quickly for
manipulation in MS Excel or other spreadsheet software. It is also useful when creating
files used by third party applications.
Figure 7 –Available report types
Banded
Banded Reports are fully formatted reports where the Report Writer has complete control
over the location and appearance of information within the report. The term “band” is
utilized since many types of reports can be thought of as consisting of various bands (or
groups) of data types (Title Bands, Column Header Bands, Detail Bands, etc.).
Extract
An Extract Report is designed to create output files that meet pre-defined specifications.
This feature is especially useful for creating delimited output that is more complex than a
simple comma-separated file (CSV), for creating a fixed-width file in which each field is
precisely positioned on a given line, or for creating an XML file. This could include files
that you might upload to a government agency, clearinghouse, or service bureau.
Extract Reports are somewhat similar in design to a Banded Report. Similar to bands
within a Banded Report, an Extract Report has sections, each of which can include
different data fields. However, in an Extract Report you can loop through as many
datasets as your report requires, and you can precisely control the position of your data in
the output file.
www.evisions.com
Argos - Argos Report Writers Guide
Document Version 1.0 – Last Updated 10.18.2010
Page 15 of 118
Creating a QuickView Report
If you highlight a DataBlock you can see the option to create a new report in the detail
pane.
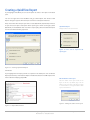
You can also right-click on the DataBlock and go to New Report. The “Create a New
Report” dialog box appears. Give the report a name and a description if desired.
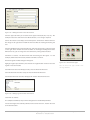
Next, choose what kind of report you want to create: QuickView, CSV, Banded, or Extract.
As you select each report a description of the report type is shown to the right. (Select
QuickView). If the DataBlock does not contain a report query, the CSV and banded reports
are not accessible and will be greyed out.
QuickView Report
Displays results on the user’s browser
Figure 8- Icons used to represent the
report types
Figure 10 – Creating a QuickView Report
Click Create.
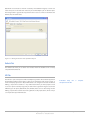
If you highlight the new report you will see 3 options in the detail pane. You can Edit the
Report, Edit the Data, and Delete the Report. The Edit Data button is for XML experts who
want to edit the underlying object XML.
Edit the Author of the report
Note the Author of the report shown in the
figure to the left. By default, Argos sets the
Author to the user name of the person logged
in. Click “Author” to change the Author of the
report as shown below
Figure 9 – Editing the author of the report
Figure 11 – Report Writer Actions
www.evisions.com
Argos - Argos Report Writers Guide
Document Version 1.0 – Last Updated 10.18.2010
Page 16 of 118
QuickViews are shortcuts to the form created by the DataBlock Designer, so there isn’t
much more you can do other than create it. If you click Edit Report you can edit the report.
The Design button is grayed out and you don’t have access to it. There are a few tabs: the
Refresh, API, and Saved States.
Figure 12 – Editing the details of the QuickView Report
Refresh Tab
The Refresh tab allows you to refresh the variables within the DataBlock. This is mostly
only useful for Dashboards.
API Tab
The API tab is part of the optional Advanced Reporting module. API stands for Application
Programming Interface which allows a report to be called from a web page or portal, or
even a third party application. Only Administrators can configure and access the API tab.
Making a report API accessible is a very useful feature when you want people to have
access to a report created by Argos, but you don’t want to give them Argos access. All the
different types of reports, QuickView, CSV, Banded, Extract can be called using the API.
Making a report API accessible does have significant security implications, which is why it
can only be done by an Administrator.
www.evisions.com
Argos - Argos Report Writers Guide
Document Version 1.0 – Last Updated 10.18.2010
In-Product Help has
description of the API
a
complete
Page 17 of 118
Saved States Tab
The last tab is the Saved States tab. A Saved State is a point in time snapshot of a
QuickView or an OLAP cube or chart. The data is saved as a file that can be viewed at any
time. Saved States are configured via the scheduler by an Argos Administrator or a
DataBlock Designer. As a Report Writer you can allow or disallow the running of the
QuickView by checking or un-checking this box.
Creation and execution of Saved States is
described within the Argos Report
Viewers Guide.
You can also manage the Saved States files by deleting any that you don’t want. The states
shown are stored on the MAP Server, however you can also copy a Saved State onto a PC
by clicking the ‘Save’ icon. You will then be able to supply the destination and file name of
the Saved State.
The Report Viewer can choose whether to execute a state stored on the MAP Server or one
stored on any PC. The Argos Report Viewers Guide provides an explanation of this.
Figure 14 – The Saved States Tab
Executing a QuickView Report
After making the desired changes within any of the tabs described above, click OK to
complete the creation of the report.
The QuickView report will now appear under the associated DataBlock and can be
executed by selecting the appropriate action listed under Report Viewer Actions.
Execution options are fully explained within the Argos Report Viewers Guide.
Figure 13 – The created QuickView Report
www.evisions.com
Argos - Argos Report Writers Guide
Document Version 1.0 – Last Updated 10.18.2010
Page 18 of 118
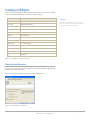
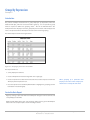
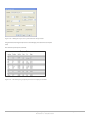
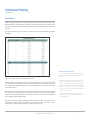
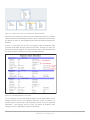
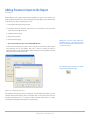
Creating a CSV Report
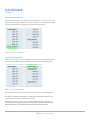
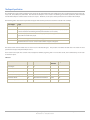
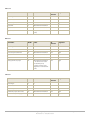
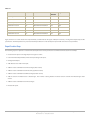
For this example, the Employees table within the sample database will be used. The table
contains the following fields which are all used in the Report query.
Field name
Description
emp_id
Employee Number
last_name
Employee Last Name
first_name
Employee First Name
hire_date
Hire Date
salary
Salary
dept_id
Department ID
location_id
Location ID (a department can exist in several locations)
Street_Line1
1st line of address
Street_Line2
2nd line of address
Street_Line3
3rd line of address
city
City
state
State
zip
Zip Code
CSV Report
A “Comma Separated Value” file is generated by
the report, which can be viewed in MS-Excel or
other similar spreadsheet applications.
Figure 15 – Field Names in Employee Table
Report Name and Description
To create a CSV report you start the same way you did the QuickView. Highlight the
DataBlock and click on New Report.
Give it a name and a description, and click the “Comma delimited” icon.
Figure 16 – Creating a new CSV Report
www.evisions.com
Argos - Argos Report Writers Guide
Document Version 1.0 – Last Updated 10.18.2010
Page 19 of 118
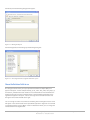
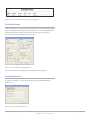
Click Create, then the following dialog box will appear.
Figure 17 – Editing the Report
Click the Design button which brings up the following dialog box:
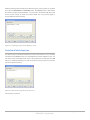
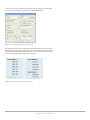
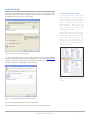
Figure 18 – Choosing the fields to appear within the report
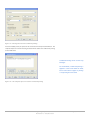
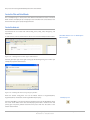
Choose the Database fields to use
This dialog box above allows you to specify which fields within the Report Query will
appear in the report. For this example the emp_id, last_name, first_name, salary, dept_id,
and location_id fields will be used. Double-click each field name to move the field to the
window on the right as shown in the figure below. The fields within the window on the
right will then appear in the report. You can also single-click each field name then click
the right arrow to move the fields to the right.
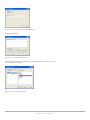
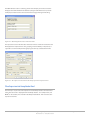
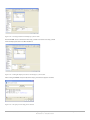
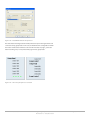
You can change the name of each field to something more meaningful since this name
will appear in the column header in the spreadsheet application. Right-click on each field
or highlight the field and click ‘ab’ to create an editable box where you can change the
names as shown in the figure below:
www.evisions.com
Argos - Argos Report Writers Guide
Document Version 1.0 – Last Updated 10.18.2010
Page 20 of 118
After fields are moved to the window in
the right you can:
Click the red X to delete a field from the report.
Use the up/down arrows to move a field up or
down.
Editing fields
To change the name of a field within the right
hand window, click the “ab” item, then change
the name of the field.
Right-clicking on any field provides all available
editing features
Figure 19 – Changing the field names
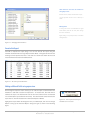
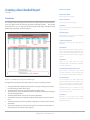
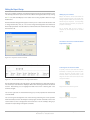
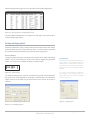
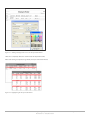
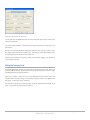
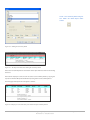
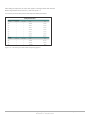
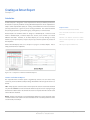
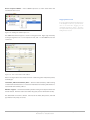
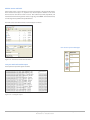
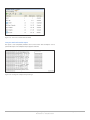
Execute the Report
Click OK to complete the report design. You can now execute the report using the
methods described within the Argos Report Viewers Guide. The figure below shows the
resulting CSV file imported into Excel. Note that the column titles within the first row
match the field names that were modified above.
Figure 21 – The CSV report within Excel
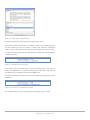
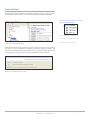
Adding additional fields using expressions
Even though the report has been created, you can edit the report to add fields from the
DataBlock or add fields created from expressions. To illustrate this, two fields will be
added to the report. The first field will have the last name and first name concatenated
into one field (with a space between the names). The other field will contain the date the
report was run. This will illustrate how to utilize the Expression Builder.
Highlight the report within the Navigation Pane, click Edit Report, then click the Design
Button to bring up the “Edit CSV Report” dialog box again as shown in the following
figure.
www.evisions.com
Argos - Argos Report Writers Guide
Document Version 1.0 – Last Updated 10.18.2010
Figure 20 – The completed CSV report
available to be executed
Page 21 of 118
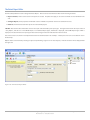
Figure 22 – Preparing to add new fields
To add the first field, click E=mc2 (in the upper right of the dialog box) which brings up the
Expression Builder dialog box shown below.
icon
Function
Choose functions from
library
Add system variables.
Lists available database
fields.
Figure 23 – The Expression Builder dialog box
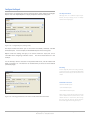
+
Click the Green circular icon which brings up the list of database fields, then double-click
on Employees.last_name which places the field within the Expression Builder.
Concatenate fields.
Leading/trailing spaces
are removed.
Figure 24 – Expression Builder (first item in expression)
Click on the plus sign (to concatenate) and a blank space (surrounded by single quotes) to
leave room between the last and first name.
www.evisions.com
Argos - Argos Report Writers Guide
Document Version 1.0 – Last Updated 10.18.2010
Page 22 of 118
Figure 25 – Expression Builder (second item in expression)
Click the green circular icon to display the list of fields, then add the first_name field.
Figure 26 – Expression Builder ( final item in expression)
Click OK then enter the name for this new field.
Figure 27 – Entering a name for the new field
The figure on the next page shows the new field (lastfirst) added to the original list of
fields.
www.evisions.com
Argos - Argos Report Writers Guide
Document Version 1.0 – Last Updated 10.18.2010
Page 23 of 118
Figure 28 – The new field concatenating last/first name
To create the other field which will contain today’s date, a similar process is used. Within
the above dialog box click E=mc2 then click the
fn item
to display a list of available
functions.
Figure 29 – The list of Date & Time Functions
Click Date&Time, then Now to obtain today’s date. Click OK then name the new field
“Today”. The resulting list of fields is shown below.
www.evisions.com
Argos - Argos Report Writers Guide
Document Version 1.0 – Last Updated 10.18.2010
Page 24 of 118
Figure 30 – New field containing today’s date/time
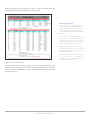
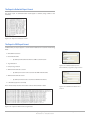
Run the report and you will now see the concatenated last/first name in column G and
today’s date/time in column H.
Figure 31 - The CSV report showing the two new fields
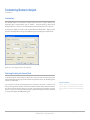
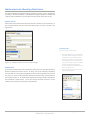
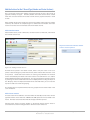
Filter and Sort the Data
When you first create the report (or edit an existing report) you see the Edit Report dialog
box shown below containing the Filters and Sorts tabs.
Contact your DataBlock Designer if you
receive the following pop-up message when
using the Filters or Sort Tabs: “To use this
feature edit the DataBlock and insert special
character sequences into the Free Type SQL so
Argos will know where to place the overrides at
runtime”
Figure 32 – Edit Report dialog box
www.evisions.com
Argos - Argos Report Writers Guide
Document Version 1.0 – Last Updated 10.18.2010
Page 25 of 118
Filters
The Filters tab allows the report writer to activate additional filters to the report query.
Any filters here are run after the filters in the DataBlock report query are run.
The Filters tab allows you to activate
additional data filters at the report level
rather than having to modify the WHERE
clause of the DataBlock's report query.
Figure 33 – Creating a filter
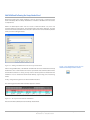
To add a filter you need to activate additional filtering by checking the “Activate additional
filtering” box.
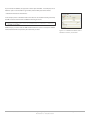
You can create filters by selecting the list of fields and filtering them by the expression
operators (+ < <>, and , or, etc.). For example to view salaries above 60,000, double-click
on Employees.salary, click >, then enter 60000. The resulting filter is shown below.
Although in this example filtering is done
using only one field, a filter can consist of
multiple fields with associated operators
(=, <, <> ,etc.)
Figure 34 – Filtering salaries above 60,000
Click OK and run the report to view the application of the filter.
www.evisions.com
Argos - Argos Report Writers Guide
Document Version 1.0 – Last Updated 10.18.2010
Page 26 of 118
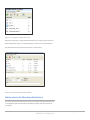
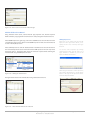
Sort
Click on the Sort tab and the following will appear.
Sorting Options
Double-click Ascending/Descending to toggle
sort by ascending or descending order.
As shown in the figure at the left, you can sort
using multiple fields. The figure illustrates
sorting by department name (ascending), then
by salary within the department (descending).
Figure 35 – The Sort Tab within the Edit Report dialog box
You need to activate sorting by clicking the “Override the main report query sort” box
Move items over that you wish to sort on by double-clicking on the item or single-click
then clicking the arrow pointing to the right.
You can reorganize fields by clicking the up or down arrow. You can change the sort order
to ascending and descending by clicking on the double arrows.
Filters and sorts involve editing the report so once they are turned on, only a Report Writer
can deactivate or change them, and Report Viewers cannot. To deactivate a filter or sort
just uncheck the activate box. You do not need to clear out the filters and sorts. The Filters
tab adds filters to the Report query, so all the conditions and filters in the DataBlock run,
and then your additional filters are applied.
Note: If you define a sort order by using the sort tab, you will override the sort order
in the DataBlock, so you essentially will be ordering the recordsets twice. The
DataBlock will sort based on whatever sort order it is using. When the report is
created it will reorder the recordsets based on the report sort order.
After choosing your sort options, click OK then execute the report to see the results of
your specified sort.
www.evisions.com
Argos - Argos Report Writers Guide
Document Version 1.0 – Last Updated 10.18.2010
Page 27 of 118
Creating a Basic Banded Report
Example 1
Definition of Bands:
Page Header Band
Prints at the top of every page.
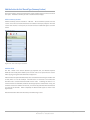
Introduction
Page Footer Band
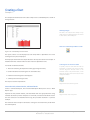
This example utilizes the Employees table within the sample database and will produce a
report (see figure below) of employees grouped by Department Name. The example
demonstrates the use of a Page Header Band, Group Header Band, Child Band, Detail
Band, Group Footer Band, and Summary Band.
Prints at the bottom of every page.
Title Band
Prints on the first page immediately below the
page header band.
Summary Band
Always prints on the last page, immediately
before the Page Footer Band.
Column Header Band
Always prints at the top of the page after the
Title Band.
Detail Band
This is where the data from the Report query is
printed. The band will print repeatedly for each
record. It will keep printing between the other
bands until it runs out of room, then a new page
will start.
Child Band
Linked to any other band and prints
immediately after it. The band that it is linked to
is called its parent band.
Group Bands(Group Header/Footer)
Group Header and Group Footer bands
surround a detail band. Used to structure data
into groups, based on a data field or expression.
Sub-Detail Band
Figure 36 – Banded report using various Band Types
The figure above illustrates the band types that are used in this example as follows:
•
•
•
•
•
•
•
The Page Header Band (Employee Roster) prints at the top of the page and contains
the date and page number of the report.
The Detail Band contains the data obtained from the Report query.
The Detail Band is surrounded by Group Header and Group Footer Bands. Grouping is
done by Department Name.
The Group Header Band contains the name of the department.
The Child Band always prints beneath the Group Header Band and contains column
titles
The Group Footer Band shows the number of employees and sum of salaries for that
department.
The Summary Band prints at the end of the report and contains the total number of
employees and salaries for the entire company.
www.evisions.com
Argos - Argos Report Writers Guide
Document Version 1.0 – Last Updated 10.18.2010
This band displays one dataset while being
linked to another dataset (called the Master). As
each record is printed in the Master dataset,
Argos will loop through the Sub Detail dataset.
Sub-Detail Bands are not as efficient as other
methods and should be used only when other
methods cannot be used.
Loop Band
Contents of a loop band will be printed
repeatedly. The user inputs the number of times
the band is repeated.
Page 28 of 118
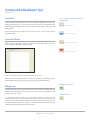
Creating a Basic Banded Report
Before creating the complete report above, a simple Banded Report of the Employees
table (see figure below) will first be created to enable a new user to quickly become
familiar with the process of creating a basic Banded Report. This report will then be
enhanced to create the report shown above.
The DataBlock form used for this
example.
One or more departments can be selected when
executing the report.
Figure 37 – The simple Banded Report
Select the Report Type
Figure 39 – DataBlock form for this
example.
Begin by creating a new report using the same method used for QuickView and CSV
reports, but this time select “Banded” and name it “Example Banded Report”. Then, within
the Edit Report dialog box, click the Design button to launch the Banded Report Wizard as
shown in the figure below.
The DataBlock form is created by the DataBlock
Designer.
Figure 38 – Selecting the Banded Report Type
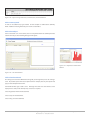
For this example, click the “List Report” image, then click Next which brings up the
following screen in which you specify which fields are to be included within the report.
www.evisions.com
Argos - Argos Report Writers Guide
Document Version 1.0 – Last Updated 10.18.2010
Page 29 of 118
Figure 40 – Selecting fields to include within the report
Including the database fields into the report
Move emp_id, last_name, first_name, hire_date, salary, dept_name, city, and region_name
to the area on the right by double-clicking each field name.
When moving fields, click city prior to region_name to order them in that fashion within
the report. After moving the fields to the area on the right you can rearrange the order of
fields by highlighting a field then click the up/down arrows to change the order that the
fields will appear in the report.
This moves the fields (and corresponding Column Headers) onto the report as shown on
the right of the Report Data Window. The Column Headers were generated by DataBlock
Designer, however you can change the Column Headers as shown later in this example.
Scroll to the right to view the entire width of the report.
www.evisions.com
Argos - Argos Report Writers Guide
Document Version 1.0 – Last Updated 10.18.2010
To move a field to the right or left,
highlight the field then click the
appropriate blue arrow. Clicking the
double blue arrows moves all fields at
once.
Page 30 of 118
Figure 41 – Specifying which fields will exist within the report
Click Next to bring up the Report Options window shown below.
The Page Settings Tab provides options
such as paper size, margins, orientation
(portrait/landscape), etc.
Figure 42 – Identifying which bands will be utilized
Choosing the Bands to utilize
Under the Band Selection tab shown above you can decide which bands to include in the
report. For the simple example the Page Header Band, Column Header Band, and Detail
Band will be utilized. Therefore place check marks into the corresponding boxes.
You can also click the Page Settings tab which allows you to specify various page settings
as shown in the figure below.
www.evisions.com
Argos - Argos Report Writers Guide
Document Version 1.0 – Last Updated 10.18.2010
Page 31 of 118
Figure 43 – Selecting Page Settings
Click Finish to launch the Band Report Editor where you can customize the look of the
report further.
Band Names
Note the names assigned by Argos (Pageheader,
Columnheader, Detail) to the various bands.
Band names can be changed by right clicking
within the band, selecting
Options, then
entering the new band name. Creating
meaningful band names is valuable when
creating bands that reference other bands.
Figure 44 – The Report Format showing Column Headings and Fields
The Band Report Editor shows the current appearance of the report and contains the
column headers positioned above the fields to be printed in the report. Note the
existence of the three bands (Page Header, Column Header, and Detail).
www.evisions.com
Argos - Argos Report Writers Guide
Document Version 1.0 – Last Updated 10.18.2010
Page 32 of 118
Editing the Report Design
There are a number of toolbar icons within the Editor that will be discussed further in the
next example, but for this report a title will be added to the Page Header band by clicking
the A icon (Text Field Object) on the toolbar then clicking anywhere within the Page
Header band.
The Edit Text Field dialog box will appear in which you can create text for the band as well
as change the font size, color, etc. You can also change the background color of the band.
Enter “Employee Roster” into the textbox as shown below. Click the font button to change
the font size to 18.
Adding objects to a Band
Objects are added to various bands within the
report by clicking the object on the toolbar, then
clicking anywhere within the band where you
want the object to be placed. A corresponding
dialog box will appear in which you specify the
properties of the object.
The In Product Help (F1 key) contains a
complete list and description of the available
objects.
The Add a Text Field icon within the Band
Report Editor toolbar
Figure 45 – Properties of the Text Field
Centering the text in the title band
Figure 46 – The text field added to the Page Header Band
The title “Employee Roster” will now appear in the Page Header band. Note that the title is
not centered, so click within the “Employee Roster” box and drag the field to the desired
location. Alternatively you can highlight the field and click the “centering text” icons
shown at the right.
To quickly center the text within the title bar
horizontally or vertically, click on the text, then
click the “Align the selected control to the
horizontal center of its parent” button, or click
“Align the selected control to the vertical center
of its parent” button.
Align to horizontal center of its parent
You can also right click on the field which brings up a list of properties for the field that
can be modified.
You can change the background color of the band by positioning the cursor anywhere
within the band (but not on the field just created), right-click then select Edit. Click on the
“Color” button to select a background color for the band. For this example, dark grey is
selected. The report design now appears as follows:
www.evisions.com
Argos - Argos Report Writers Guide
Document Version 1.0 – Last Updated 10.18.2010
Align to vertical center of its parent
Page 33 of 118
Figure 47 – Background color of Page Header Band changed
Next the text for the labels in the Column Header will be changed. Right-click on each
label, select edit, then type in the new name for the label. In this example, the text for
each label will be capitalized.
Execute (or preview) the report and it will look like this (larger font for “Employee Roster”)
and all titles capitalized. You may need to reduce the font size of the Column Header
fields to 10 to make the report look more readable. Also make the font bold.
Preview the report
You can obtain a preview of the printed report
by clicking the preview icon on the Band Report
Editor toolbar.
Saving the report
To save the report, click the Save icon on the
Band Report Editor toolbar.
Closing the Band Report Editor
Figure 48 – The report after adjusting the column headers
Click the icon on the Band Report Editor toolbar.
As a reminder, you can further edit or sort the report by returning to the Argos navigation
pane, highlight the report, then click Edit Report. Click the Filters or Sort Tab to modify the
report. For example, to sort the report by Employee ID, enter the Employee ID as shown
in the figure below:
Figure 49 – Sort options
www.evisions.com
Argos - Argos Report Writers Guide
Document Version 1.0 – Last Updated 10.18.2010
Page 34 of 118
After executing the report again you can see the report is now sorted by Employee ID.
Figure 50 – The report after sorting by Employee ID
Your first simple Banded Report is now complete. The next step is to enhance the report
to obtain the final report format.
Resizing and Aligning Fields
As fields are added to the report, you may need to resize them to ensure that the contents
of the fields will fit into the space allocated by the editor. You will also want to align fields
to each other horizontally and vertically to produce an attractive appearance.
Resizing Objects
Selecting an object (left mouse click) displays the boundary of the object with resizing
handles. You can increase/decrease the size of the field by dragging the appropriate
handle. You can also click on the field and drag it to another location.
Resizing Bands
Figure 52 – Selected field
You can also right-click within the band, and
select Options.
The following dialog box
appears where you can specify the band height
as well as other options.
For additional resizing options, right-click on the field and select Edit. The Edit dialog box
will appear shown in the figure below. Checking the “Autosize width” and “Autostretch
height” check boxes will adjust the size of the field to fit the contents of the data, if
necessary.
Bands can be resized using the same methods as
resizing objects. Click anywhere within the
band (but not on a field) and the boundary of
the band will be shown with the sizing handles.
The handles can be used to adjust the height of
the band.
Figure 51 – Band options
Figure 53 – Field Editing options
www.evisions.com
Argos - Argos Report Writers Guide
Document Version 1.0 – Last Updated 10.18.2010
Page 35 of 118
Aligning Fields
When repositioning a field by dragging it, Argos will display blue horizontal or vertical
alignment guidelines to assist you in aligning a field with other fields. In the figure below,
note the blue vertical alignment line (to the left of the “R” in REGION) that appears when
moving the REGION title to align it with the region_name field.
Icon
Usage
Align by left sides
Align by horizontal centers
Align by horizontal center of
parent
Stretch to be same horizontal
size
Figure 54 – Alignment guidelines
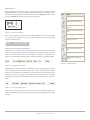
There are also alignment icons within the Band Report Editor toolbar (shown below) that
can be used to align multiple fields to each other. The methods for selecting multiple
objects is described below.
Align by right sides
Align by top sides
Align by vertical centers
Selecting and Aligning Multiple Fields
Multiple fields can be selected by depressing the shift key and clicking on the desired
field(s). Each selected field will then be surrounded by a rectangle with small grey boxes
on the corners. These fields can be moved or aligned as a group. In the figure below, all
fields are surrounded by the small grey boxes, indicating that they are grouped together.
Stretch to be same vertical
size
Align by bottom sides
Align by vertical center of
parent
Figure 55 – Alignment icons
Figure 56 – Grouping fields together
Multiple fields can also be selected by depressing the Ctrl key and dragging the cursor to
create a rectangle around the fields that you want to include. All objects enclosed within
the box will be individually surrounded by the small grey boxes described above and can
be moved or aligned as a group. The rectangle shown in the figure below (created by
dragging the cursor) shows seven fields that have been selected and will be treated as a
group.
Figure 57 – Selecting multiple objects
When using the alignment tools, select one object, then select additional objects to be
aligned using either method described above. All objects will be aligned to the first object
selected.
www.evisions.com
Argos - Argos Report Writers Guide
Document Version 1.0 – Last Updated 10.18.2010
Page 36 of 118
Enhancing the Report
The report will now be enhanced to appear in its final form by:
Sorting the employees by department name.
Adding page counts and dates to the report.
Creating and highlighting groups.
Summing employee count and salaries by department and by entire company.
Sort Employees by Department Name
Begin by selecting the existing report from the Argos Navigation pane, highlight the
report (Example Banded Report) then click Edit Report within the Detail Pane which brings
up the Edit Report dialog box.
Since employees are to be grouped by department, click the Sort tab and move
Departments.dept_name and Employees.emp_id into the right hand window. Argos will
now sort by department name, then by employee ID within each department. Remember
to check the “Overide the main report query sort” check box, otherwise you will not be
able to move any fields.
Figure 58 – Sorting by Department Name then Employee ID
Click the Apply button, the General Tab, then the Design button. You will be brought back
to the Band Report Editor.
www.evisions.com
Argos - Argos Report Writers Guide
Document Version 1.0 – Last Updated 10.18.2010
Page 37 of 118
Add Date, Page Number, Page Count
From within the Editor, click the “Add a System Data Field” icon on the toolbar, then click
anywhere within the Page Header band.
Add System Data Field Icon on Band
Report Editor Toolbar
Figure 59 – Selecting the Date from the list of system data fields
There are a number of Date/Time selections, but select Date for this example. You need
not enter anything into the Text field for this example. You will then see the following:
Figure 60 – The Date field added to the Page Header Band
Note the addition of the date field in the Page Header band. Drag the field to the upper
right corner of the band.
Next the string ‘Page x of y’ will be created and placed underneath the date within the
Page Header band. Within the Band Report Editor, click the E=mc2 icon, then click
anywhere within the Page Header band.
Click the ellipsis (…) button shown in the figure below.
Figure 61 – Building the expression
www.evisions.com
Argos - Argos Report Writers Guide
Document Version 1.0 – Last Updated 10.18.2010
Page 38 of 118
Enter the first segment of the expression which consists of the string ‘Page No. ‘:
`
Figure 62 – The first segment of the text string
Click the ‘Function’ button to display the list of available functions.
The + operator concatenates strings and
eliminates leading/trailing spaces.
Figure 63 – Select the PAGENUMBER function
Figure 64 – Enter the remaining segment of the expression
Click the Function button again to display the list of functions again.
www.evisions.com
Argos - Argos Report Writers Guide
Document Version 1.0 – Last Updated 10.18.2010
Page 39 of 118
Figure 65 – Select the PAGECOUNT function
Figure 66 – The completed expression
Figure 67 – Select Autosize width to ensure the new field will fit
www.evisions.com
Argos - Argos Report Writers Guide
Document Version 1.0 – Last Updated 10.18.2010
Page 40 of 118
The new field is now positioned within the Page Header Band. If it is not positioned in the
desired location, drag the field until it is underneath the date.
Adding bands to the Report
Click on the desired band icon, then click
anywhere within the report image displayed
within the Editor. The band will then be added
to the report.
Creating the Group Bands
Next Group Header and Group Footer bands will be created which will surround the Detail
Band. Since the report is structured to print employees by department name with an
employee count and sum of salaries for each department, use of Groups is necessary.
Within the Band Report Editor, click the “Create a Band Group” icon, then click anywhere
within the image of the report. The following dialog box will appear:
“Create a Band Group” icon within Band
Report Editor Toolbar
Band Groups are processed as follows:
Before printing the first record in the Detail
band, the Group Header is printed.
The first Detail record is printed.
The Group-by Field in the next Detail record is
examined:
-If the Group-by Field has the same value as the
previous detail record, the next Detail record is
printed.
-If the Group-by Field has a different value than
the previous record, the Group Footer is printed.
A new Group Header and the next Detail record
is printed.
Figure 68 – Adding the Group Header Band
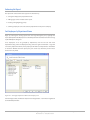
Next, the item that the detail band will be grouped by needs to be entered, therefore click
the ellipsis (…) button to the right of “Group by field or expression”. After entering data
into several dialog boxes that will appear in succession, you will ultimately cause
Argosdata.dept_name to be placed into this field (since the grouping is to be done by
department name).
The Group-by Field can be a simple Data Field
from the dataset, or can be a complex
Expression. If you wish to create a Band Group,
you should ensure that your data is sorted
(ORDER BY) on the Data Field(s) or Expressions(s)
you wish to use.
Figure 69 – Selecting Department Name as the database field to group by
www.evisions.com
Argos - Argos Report Writers Guide
Document Version 1.0 – Last Updated 10.18.2010
Page 41 of 118
Remember that when grouping by a
particular field (dept. name in this
example), the data must be sorted by the
same field.
Figure 70 – Adding the database field to Group-by field listbox
Enter dept_name into the group-by field or expression textbox. A later example will
illustrate how to group by an expression as opposed to this example where grouping is
done by database field.
Click the Create button at the upper right to create a corresponding Group Footer, then
click OK.
The Banded Editor will now appear as follows:
Renaming Bands
Argos generates names for each band. Note on
the figure to the left that “Pageheader” is the
label given to the Page Header Band and
“Columnheader” is the name given to the
Column Header Band.
To change the name of the band, right click
anywhere within the band and click on
“Options”
Figure 71 – The Banded Editor showing the Group Header/Footer Bands
Note the existence of the Group Header (Header 1) and Footer Bands (Footer 1)
surrounding the Detail Band.
Within the “Name” field enter the name of your
choice (spaces between words are not
permitted). The new name will replace the
name given by Argos.
When many bands are created in a complex
report, creating meaningful names will be useful
when referencing bands.
.
www.evisions.com
Argos - Argos Report Writers Guide
Document Version 1.0 – Last Updated 10.18.2010
Page 42 of 118
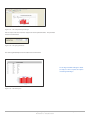
At this point the report will look like this:
.
Figure 72 – The Report showing the grouping by Department Name
Note the grouping by Department Name as well as the existence of the date and page
count at the top right of the report.
The following will now be done:
•
•
•
•
•
Move the department name into the Group Header Band
Add background color to the Group Header Band
Add a child band after the Group Header band which will contain column
headers. The existing column header band will then be removed.
Add employee count and sum of salaries for each department in the Group
Footer Band.
Add a summary band containing a total employee count and sum of salaries.
Moving Dept. Name to Group Header Band
You cannot drag a field from one band to another, so to move the department name to
the Group Header Band, perform a cut and paste operation. Cut the dept_name field
from the Detail Band and paste it into the Group Header Band. You will need to move the
city and region fields to the left due to the removed dept_name. Also, drag the
dept_name field that now resides within the Group Header Band to the desired location.
Right-click the Group Header Band, and click Edit. Then choose a background color from
the color button within the displayed dialog box.
www.evisions.com
Argos - Argos Report Writers Guide
Document Version 1.0 – Last Updated 10.18.2010
Page 43 of 118
Figure 73 – Adding a background color to the Group Header Band
After this is completed, delete the column header for department name.
After some resizing and repositioning of fields, the report should look like this:
Figure 74 - Highlighting the Group Header Band
www.evisions.com
Argos - Argos Report Writers Guide
Document Version 1.0 – Last Updated 10.18.2010
Page 44 of 118
Add Child Band Following the Group Header Band
Rather than printing the column headings at the top of each page, it is desired to print
them immediately after the Group Header Band. Therefore a Child Band will be used to
accomplish this.
Within the Band Report Editor click the “Create a New Child Band” icon, then click
anywhere within the report image. The following dialog box will be displayed. You must
enter the Parent Band, therefore select “Header 1” (which is the name of the Group Header
band) as shown in the figure below.
Figure 75 – Adding a Child Band beneath the Group Header Band
After clicking the OK button, a Child Band named Band2 now exists underneath the Group
Header Band. The column headers will now be copied from the Column Header Band into
the Child Band. After this is done, you may need to resize/reposition the fields within the
Child Band. You can delete the Column Header Band by right-clicking on it and selecting
delete.
Create a new child band using the icon
within the Band Report Editor toolbar
Finally, change the background color of the Child Band to blue.
The resulting report format within the Editor appears as follows:
Figure 76 – The report format with the Child Band
Note the Child Band (Band2) beneath the Group Header Band.
www.evisions.com
Argos - Argos Report Writers Guide
Document Version 1.0 – Last Updated 10.18.2010
Page 45 of 118
Figure 77 – The report showing the Group and Child Bands
Note that the column headers are now printed under each Group Header Band.
Add Employee Count and Salary Sum
Next a count of employees and sum of salaries for each department will be placed within
the Group Footer Band and will print after the Detail Band for each department.
The employee count and salary sum will be done using the Expression Wizard.
Click on the “Add an Expression Field” icon on the Band Report Editor toolbar, then click
anywhere within the Group Footer Band. The following dialog box will appear. Click the
ellipsis button (…) to bring up the Expression Wizard.
Since the count must be reset to zero for each band group, you need to check the
“Reset after print” box.
Add an Expression Field icon within the
Band Report Editor toolbar
Figure 78 – Resetting values of expression after printing
www.evisions.com
Argos - Argos Report Writers Guide
Document Version 1.0 – Last Updated 10.18.2010
Page 46 of 118
Build the following within the Expression Wizard using the same procedure as described
above for the PAGENUMBER and PAGECOUNT fields. The COUNT function is found under
the Statistical category within the Wizard. You may need to extend the width of the field
to have it print correctly (or check the “Autosize width” box in the previous figure to
allocate sufficient room for the field.
Figure 79 – Creating an expression for Employee Count
Create Sum of Salaries Expression
In a similar fashion use the Expression Wizard to create a sum of salaries. This is a bit more
involved than the COUNT function since the SUM function requires additional input. You
will need to select the DataBlock field ‘salary’ as the parameter to be used within the SUM
function as summarized below (not all steps are shown since they are to those used in the
expressions illustrated earlier).
Figure 80 – Enter the first segment of the expression
Click Function to continue.
www.evisions.com
Argos - Argos Report Writers Guide
Document Version 1.0 – Last Updated 10.18.2010
Page 47 of 118
Figure 81 – Selecting the parameter for SUM function
Click the ellipsis button.
Figure 82 – Selecting the database field
Select “Database field” since the parameter for the SUM function is the employee salary
and comes from the DataBlock.
Figure 83 – Selecting the salary field
www.evisions.com
Argos - Argos Report Writers Guide
Document Version 1.0 – Last Updated 10.18.2010
Page 48 of 118
Figure 84 – The completed expression
As was done with the COUNT function, check the “Reset after print” box to reset the sum
to zero for each band.
Also, check “Autosize width” to guarantee that enough room will be set aside for the new
field to print.
This item will be placed under the employee count field, thus you may need to increase
the height of the band for the new field to fit. You may also select “Autostretch height”
and the height of the band will be increased for you.
Position the new fields just created by clicking each field then dragging it to the desired
location within the band.
Adding the Summary Band
A Summary Band which will now be created will contain the employee count and sum of
salaries for all departments. Recall that the Summary Band always prints on the last page,
immediately before the Page Footer Band.
Click on the “Create a new band” icon on the Band Report Editor toolbar, then click
anywhere within the report image. The following dialog box shown in the figure below
will appear. For the Type, select “Summary”.
A frame will be placed around the band, thus check the Top, Bottom, Left, Right check
boxes as shown below, and set the line width to 2.
www.evisions.com
Argos - Argos Report Writers Guide
Document Version 1.0 – Last Updated 10.18.2010
Page 49 of 118
Create a new Summary Band using the
icon within the Band Report Editor
toolbar
Figure 85 – Adding the Summary Band
Figure 86 – The Report Format after adding the Summary Band
Notice the new Summary Band at the bottom of the report with the solid line surrounding
the band.
Now add the employee count and sum of salaries to the Summary Band by copying the
expressions from the Group Header Band and pasting them into the Summary Band.
The final page of the report will now appear as follows:
Figure 87 –Employee count and salary sum within Group & Summary Bands
www.evisions.com
Argos - Argos Report Writers Guide
Document Version 1.0 – Last Updated 10.18.2010
Page 50 of 118
Note the total employee count and sum of salaries as well as the frame around the
Summary Band. The final report now appears as shown below.
Additional Group Bands
This example utilizes a single Group Band to
group employees by department name. If
desired, additional Group Bands could be
created to group, for example, by Region. Thus,
nesting of Group Bands provides multi-levels of
grouping.
When creating an additional Group Band, if
Argos does not place the band in the desired
order,you can drag the band to the correct
location. Argos will always place the new group
band immediately in front of the detail band.
It is recommended that the outermost group be
created first, followed by inner groups. Using
this method generally does not require that
group bands be moved.
Not all bands are movable due to the nature of
the various band types. For example the
Summary Band always exists at the bottom of
the report and cannot be moved.
Figure 88 – The completed report
The report above consists of only one page because in the parameter query for this
particular figure, only the HR and Product Development Departments were selected.
There are actually 7 departments within the sample database that could have been
chosen for this report.
www.evisions.com
Argos - Argos Report Writers Guide
Document Version 1.0 – Last Updated 10.18.2010
Page 51 of 118
Formatting Numeric Output
Example 2
Introduction
The Banded Report in the previous example shows the sum of salaries without any
formatting, that is, without dollar signs or commas. Instead of printing “Total Sum of
Employee Salaries = 1923000 in the Summary Band, it is desired to print it as $1,923,000.
To format the output you need to edit the field within the Band Editor. Right-click the
field to be formatted which brings up the Edit Expression Field dialog box shown below.
Figure 89 – Choosing the field to be formatted
Selecting/Creating the Format Mask
To format the field, click the ellipsis button to the right of “Format” which brings up the
“Edit Format Mask” dialog box (shown below) that provides options for formatting both
numeric and date fields.
You can select one of the pre-existing formats or create your own mask. To select one of
the pre-existing formats, double-click the desired format shown within the lower window.
The selected option will then appear in the box at the bottom of the window as shown
below. You can also create your own format by using the formatting characters described
at the top of the Edit Format Mask dialog box.
www.evisions.com
Argos - Argos Report Writers Guide
Document Version 1.0 – Last Updated 10.18.2010
Edit Format Mask
Choose one of the existing formats (doubleclick) or enter your desired mask in the text box
at the bottom of the Edit Format Mask dialog
box.
Page 52 of 118
Figure 90 – Selecting the formatting option
The field being edited will then be displayed using the format chosen.
However, the example above needs to be modified in order to use the formatting since
the field containing the sum also contains a leading string “Total Sum of Employee
Salaries”. Argos cannot format the entire field since the expression also contains a string.
Therefore the leading string must be separated from the SUM, and only the SUM field
should be formatted.
Figure 91 – The expression as one string
To accomplish this, edit the field above to remove the leading string. Then apply the
format to the SUM function. To replace the leading string you will need to add a new text
field and position it immediately to the left of the SUM function.
The figure below shows that there are now two separate fields (the leading string and the
SUM field).
Figure 92 – The expression separated into 2 fields
The new fields will print as shown below and contains the dollar sign and commas:
www.evisions.com
Argos - Argos Report Writers Guide
Document Version 1.0 – Last Updated 10.18.2010
Page 53 of 118
Figure 93 – The formatted numeric output printed
The same procedure can be used to format the Sum of Employees Salaries within the Group Footer Band.
www.evisions.com
Argos - Argos Report Writers Guide
Document Version 1.0 – Last Updated 10.18.2010
Page 54 of 118
Group By Expression
Example 3
Introduction
The previous examples illustrated how to group employees by department, where the
database field dept_name was used as the field to group by. It is also possible to group
where an expression defines the grouping criteria. This will be demonstrated in this
example where the employee list will be grouped by the first letter of the employee last
name. An expression will be developed to be used as the criteria for grouping.
The desired output is shown in the figure below
Figure 94 – Grouping by First Letter of Last Name
The steps to follow are:
Sort by Employee Last Name.
Create a Group Band and set its background color to light grey.
Create an expression to obtain the first letter of the last name and place it within the
“Group-by-field or expression” box.
Place the expression into the Group Band Header to highlight the groupings (see the
bold letters in the above figure).
When grouping by a particular field
(Employee last name in this example), the
data must be sorted by the same field.
Create the Basic Report
Begin by creating a report and within the “Edit Report” dialog box click the Sort Tab and
sort by Employee Last Name.
Within the Edit Report dialog box, click the Design button to bring up the Band Report
Editor and create a simple report as shown in the figure below:
www.evisions.com
Argos - Argos Report Writers Guide
Document Version 1.0 – Last Updated 10.18.2010
Page 55 of 118
Figure 95 – The format of the report prior to creating groups
Create a Band Group
Create a band group by clicking the “Create a Band Group” icon on the Band Report Editor
toolbar. The Header dialog box will appear as shown below. Since grouping by the first
letter of the employee last name is to be done, you need to enter an appropriate
expression into the “Group-by-field or expression” box.
Figure 96 – Creating the Group Header Band
Add a color to the band by clicking the “Color” button, then select light grey.
Create the Expression
To create the expression, click the ellipsis button then select the COPY function via
double-click.
Figure 97 – Selecting the COPY function
www.evisions.com
Argos - Argos Report Writers Guide
Document Version 1.0 – Last Updated 10.18.2010
Page 56 of 118
The COPY function returns a substring, and for this example you need to choose the
Employee Last Name field from the database (using the same method as in previous
examples) and return the first character from the string by entering the following:
Figure 98 – Obtaining the first letter of the last name
The expression to return the first letter of the last name has now been inserted into the
Group-by-field or expression box. The grouping is now handled by an expression, as
opposed to an earlier example where grouping was done by a database field name.
Figure 99 – The expression entered into the Group-by-field or expression box
Place Expression into Group Header Band
The final step is to place the same expression into the Group Header such that the first
letter of the last name is displayed within the Group Header. To accomplish this, click
E=mc2 on the toolbar, then click within the Group Header Band. Then enter the same
expression as before.
www.evisions.com
Argos - Argos Report Writers Guide
Document Version 1.0 – Last Updated 10.18.2010
Page 57 of 118
Figure 100 – Adding the expression to print within the Group Header
Drag the field containing the expression to the left edge, then set the font to 14 point
bold.
The desired report will print as follows:
Figure 101 – The final report grouped by first letter of employee last name
www.evisions.com
Argos - Argos Report Writers Guide
Document Version 1.0 – Last Updated 10.18.2010
Page 58 of 118
Creating Mailing Labels
Example 4
Introduction
The Argos Band Editor can be used to generate labels for an extensive list of labels from
many different manufactures. You can also create your own custom label size as well.
Select the Mailing Labels Report Type
To use the Band Editor to generate labels, begin the report creation using procedures
outlined in previous examples. However, on the form where you select the Report type,
choose the ‘Mailing Labels’ option.
Figure 102 – Selecting the Mailing Label Report Type
Click Finish to continue.
Select the fields to use
On the next form, select the fields that you would like to appear on the label .
This example will once again use the Employees table in the sample database.
Select last_name, first_name, city, Street_Line1, Street_Line2, Street_Line3, State, and Zip.
Click Next to continue.
www.evisions.com
Argos - Argos Report Writers Guide
Document Version 1.0 – Last Updated 10.18.2010
Page 59 of 118
The next form allows you to choose the Label Format. First select the Vendor, and then the
Format. For this example select the vendor Avery Standard, using the 2163 layout. Click
Finish to continue.
Figure 103 – Selecting the Mailing Label Type
Note: If the label you are using is not listed, select one that is close to what you are
using as you will be given opportunity later on to change the size and position of the
individual label.
On the figure above, a sample of the layout is displayed. The Band Editor has already
selected the proper margins for the selected label, however, you can change these if
required. Click Finish to continue.
Edit the Fields
The Band Report Editor is then displayed with the label existing within the Detail Band.
You are now free to change the characteristics of the data (font size, font color, etc) within
the Band by right-clicking anywhere within the band.
Figure 104 – The Label Format shown within the Band Report Editor
www.evisions.com
Argos - Argos Report Writers Guide
Document Version 1.0 – Last Updated 10.18.2010
Page 60 of 118
You will need to rearrange the fields to appear as follows on the label:
first name last name
Street 1
Street 2
Street 3
City, State Zip
By selecting a field and clicking and dragging, the field can be moved. Using the
alignment tools, multiple fields can be selected and properly aligned.
For example, to make sure the all the fields are aligned on the same left margin, select the
fields in question and press the Left Alignment icon.
Similarly, to make sure items are aligned across the bottom, use the Bottom Alignment
tool. Position the fields as follows:
Figure 105 – Rearranging and aligning fields
To preview the layout, click on the Preview button. Make sure to run with a good sample
to ensure you test different possibilities. Any problems are quickly taken care of by using
Rich Text Fields in conjunction with the Expression Builder. Return to the Report Editor to
first take care of the formatting for all fields.
Next, select the existing fields, delete them and replace them with Expression Fields.
Expressions will be used to:
Add fields that were removed
Concatenate the first and last name
Use the Rich Text Field icon within the
Band Report Editor toolbar
Concatenate City, State, and Zip
Concatenating is done using the + sign. When joining fields with the plus sign, all leading
and trailing blanks will be removed. This means that you need to add a space between the
first and last name.
The new fields will be created using Rich Text Fields. Therefore click the “Add a Rich Text
Field” icon within the Band Report Editor Toolbar then click anywhere within the Detail
Band. The Rich Text Editor will be displayed as shown below:
www.evisions.com
Argos - Argos Report Writers Guide
Document Version 1.0 – Last Updated 10.18.2010
Page 61 of 118
Figure 106 – The Rich Text Field Editor
The RTF Editor can be thought of a mini text editor and provides various text formatting
features.
The fields to be added to the label will be identified by clicking the E=mc2 icon (then
selecting the desired database field within the expression builder) to obtain the desired
field. Perform this repeatedly for each field to include within the label. The result is shown
in the figure below.
Figure 107 – Expressions Added to the Report Format
You can now enhance the appearance of the label by changing the font, font size and font
characteristics (bold, italics, underline) by selecting the appropriate icon on the toolbar.
Additional commonly used formatting features can be selected (left, center, right justify),
adding bullets, and setting background color.
For this example the street addresses will be bolded and italicized, and will be changed to
Times New Roman font.
www.evisions.com
Argos - Argos Report Writers Guide
Document Version 1.0 – Last Updated 10.18.2010
Page 62 of 118
Suppress printing of empty lines
Fields Street_Line2 and Street_Line3 may not contain data, therefore if they are empty
these lines should not be printed. To accommodate this condition, click the red X icon
(Remove Line if Empty) on the upper right of the dialog box. This will cause empty lines to
not be printed. Highlight the 2 fields then click the red X on the toolbar (see figure in the
sidebar) which results in the following:
Remove Line if Empty icon within the Rich
Text Field Editor
Figure 108 – Identifying lines not to print if empty
Street_Line2 and Street_Line3 now have DEL inserted, indicating that the line will be
removed if it is empty.
Resizing fields
Note the use of quotes to create blank spaces between fields when necessary.
A field can be resized manually by selecting the
field, then dragging the handles of the box that
surrounds the field.
Click OK, then the fields will be added to the selected band.
Drag the resulting field to the upper left of the Detail Band and resize it to accommodate
the fields. You may also need to resize the Detail Band.
Or, you can avoid manual resizing by selecting
the “Autosize width” or “Autostretch height”
selections that appear on the “Edit” dialog for a
field.
The final output is shown below. Note that for each label, there are no blank spaces
between any of the lines.
Figure 109 – Edit dialog box for Rich Text
Field
Figure 110 – The completed mailing label
www.evisions.com
Argos - Argos Report Writers Guide
Document Version 1.0 – Last Updated 10.18.2010
Page 63 of 118
Group Band on new page/reset counter
Example 5
Introduction
This example illustrates a situation where it is desired to print each group on a new page
and to reset the page number to 1 for each group. The COUNTER and RESETEXPR
functions will be utilized to accomplish this.
Example 1 showed how to reset the SUM and COUNT functions after printing (by selecting
the “Reset after print” check box). For this example the PAGENUMBER function seemingly
could be used to print the page number, however this function cannot be reset. Instead
the COUNTER function is used to count pages since this function can be reset using the
RESETEXPR function when required.
The Employees, Orders, Order_Details, and Products tables within the sample database are
used within this example. The report will list all sales orders per employee as shown
below:
Figure 111 – The printed report
www.evisions.com
Argos - Argos Report Writers Guide
Document Version 1.0 – Last Updated 10.18.2010
Page 64 of 118
Note that the page numbers increment for each employee, but will be reset to 1 for the
next employee.
The following describes the format of the report.
The Title Band contains the text string “Employee Sales”.
The Column Header Band contains the Sale Date, Quantity, and Product Name
Headers.
The Group Header Band contains the employee last name and first name. It also
contains the function RESETEXPR.
The Detail Band contains the sale date, quantity, and product name.
The Page Footer Band contains the COUNTER function which represents the page
number.
Figure 112 – The Report Design
Force Group Header on new page
To force the Group Header to print on a new page, the “Force new page (before)” check
box was selected as shown in the figure below.
Figure 113 – Forcing a New Page for the Group Header Band
www.evisions.com
Argos - Argos Report Writers Guide
Document Version 1.0 – Last Updated 10.18.2010
Page 65 of 118
The COUNTER function was added to the Page Footer Band as shown in the above report
design. Since the Page Footer Band is printed on each page, the counter will increment on
each page as well.
Reset the COUNTER expression
The name of the COUNTER expression must be obtained such that it can be reset within
the RESETEXPR function. To obtain the name, right-click on the [‘Page ‘ + COUNTER]
expression then click “Options’ to obtain the Expression Name, which in this case is
Expression1.
Figure 114 – Obtaining the name of the expression
To force the page counter to reset for each group, the RESETEXPR function must contain
the expression to reset (the COUNTER expression) when this band (Group Header) is
printed. Therefore ’Expression1’ is entered as the parameter as shown in the figure below.
The expression name must be enclosed within single quotes.
Figure 115 – Entering the expression name into the RESETEXPR function
The report design is now complete.
www.evisions.com
Argos - Argos Report Writers Guide
Document Version 1.0 – Last Updated 10.18.2010
Page 66 of 118
Conditional Printing
Example 6
Introduction
When an Argos DataBlock is initially designed, the developer creates a form that the
Report Viewer uses to filter or limit the data that will be displayed. There are times when it
would be useful to run the same report, but filter the data on information not available on
the form.
Consider the following report which lists vendors to which Purchase Orders have been
submitted:
Bands used in this report
This report contains a Title Band, Group Header
Band, Child Band, Detail Band, and Group Footer
Band.
Figure 116 – The report showing all Purchase Orders
For each PO listed, the field “invoice recd” indicates whether an invoice has been received
from the vendor, and the field “invoice paid” indicates whether the invoice has been paid.
This example uses the Purchase_Orders, Purchase_Order_Items, and Vendors tables from
the sample database.
The report is to be modified to list only vendors for which invoices have been received,
but not yet paid. Since these fields do not exist within the input selection form, filtering
must be done using the “Only print if expression is true” selection within the dialog box
that is displayed when editing a band.
Each record in the Detail Band contains an item
within a Purchase Order, but only the total of all
items is of interest. The item sum is placed
within the Group Footer Band and the Detail
Band is not printed. This is why conditional
printing is done for the Group Footer Band and
not for the Detail Band.
To prohibit printing of the Detail Band, the band
height is set to zero in the Options dialog box
for the Detail Band.
Conditional printing is done by editing the band that the filtering is to be applied to and
entering the condition within the “Only print if expression is true” text box as shown
below (for this example filtering is done on the Group Footer Band).
www.evisions.com
Argos - Argos Report Writers Guide
Document Version 1.0 – Last Updated 10.18.2010
Page 67 of 118
Figure 117 – Entering the criteria for conditional printing
For this band (PO_Footer) an expression was entered to limit the printed information. The
complete expression is shown in the figure below which satisfies the condition for printing
as described above.
Conditional Printing can be used for any
band type.
For Detail Bands, conditional printing is
applied to each record within the band,
but for other bands it applies to printing
or not printing the entire band.
Figure 118 – The complete expression used for conditional printing
www.evisions.com
Argos - Argos Report Writers Guide
Document Version 1.0 – Last Updated 10.18.2010
Page 68 of 118
After adding the expression, the report now appears in the figure below with Purchase
Orders only printed if invoice received = ‘y’ and invoice paid = ‘n’.
It is necessary to enclose each portion of the expression within parentheses.
Figure 119 – The final report with conditional printing applied
www.evisions.com
Argos - Argos Report Writers Guide
Document Version 1.0 – Last Updated 10.18.2010
Page 69 of 118
Starting with a Blank Report Type
Example 7
Introduction
Icons on Band Report Editor toolbar for
creating bands
Previous examples demonstrated the creation of a Banded Report using the List and
Mailing Labels report types. As you have seen, other report types are available within the
Banded Report Wizard Report Type Library (List Report, Tabular, Blank, Form Style, and
Mailing Labels).
If none of the Report Types meet your needs, you can create a custom report using the
Blank Report Type.
Create a new band
Create a new child band
Create a New Report
When creating a new report, and after selecting the Blank Report Type, you will be
presented with the Band Report Editor as follows:
Create a new sub detail band
Create a new band group
Figure 120 –Band Report Editor with Blank Report Type selected
None of the bands or database fields are shown as is done with the other Report Types.
With the Blank Report Type you must create bands and band contents manually.
Adding a database field
Adding Bands
To add bands, click the appropriate band (see band icons within the sidebar) then click
anywhere within the Editor and the band will be created. Do this repeatedly for each
band that you need to create.
Adding a text field
To add database fields or text fields (to be used as headers or titles) click the
corresponding icon (see sidebar) then click within the band that you wish the field to be
inserted into. The field will then be added to the selected band. Use the same process to
add other field types (expressions, images, etc.). Continue with this process until you have
inserted all required bands and fields into your report.
www.evisions.com
Argos - Argos Report Writers Guide
Document Version 1.0 – Last Updated 10.18.2010
Page 70 of 118
Using Sub-Detail Bands
Example 8
Introduction
The use of Sub-Detail Bands increases the Band Editor’s functionality by allowing subreports that provide additional information for each record in the Detail Band.
A Sub-Detail Band prints one dataset while being linked to another dataset (called the
Master). As each record is printed in the Master dataset, Argos will execute the dataset in
the Sub-Detail Band and print the Sub-Detail Band once for each row returned. Any
number of Sub-Detail Bands can be created and they follow the detail band.
In most cases, the Master dataset is the main Report Query (ArgosData). The dataset
displayed in a Sub-Detail Band is a different one than the Master dataset, in fact it can even
be from a different database (as long as both datasets have a common field that can be
used to link them).
Note: the Sub-Detail Band always prints after the Detail Band and will loop through
all records in its dataset before the Master dataset is incremented to the next record.
For this reason, this technique is less efficient than other methods and should be
used only when needs dictate.
You should use Sub-Detail Bands when:
You need to loop through two or more datasets for each row in the Detail Band.
Other methods only allow one dataset to be associated with each Detail Band.
You need to loop through one or more datasets for each row in the Detail Band, but
the data comes from a different database.
The Report Contents
In this example, Sub-Detail Bands will add additional information to an employee list. The
additional information will include employee contact information such as phone number,
email address, contact information, and dependent information. Each type of contact will
appear in its own Sub-Detail Band such that four Sub-Detail Bands will be associated with
the basic Employee information that appears in the Detail Band.
This
example
uses
the
Employee,
Employee_Phone,
Employee_Email,
Employee_Emerg_Contact, and Employee_Dependents tables within the sample
database.
Since four datasets are associated with and are printed immediately after the Detail Band,
the use of Sub-Detail Bands is required (other methods only allow one dataset to be linked
to a Detail Band).
The figure below shows the relationships of the tables within the sample database that are
used in this example.
www.evisions.com
Argos - Argos Report Writers Guide
Document Version 1.0 – Last Updated 10.18.2010
Page 71 of 118
Figure 121 – Tables to be used to create datasets for Sub-Detail Bands
Note that none of the tables are joined since for this example these tables are considered
separate datasets from the Main Report DataBlock. This also simulates the situation where
the datasets can exist in an entirely different database from the database used within the
DataBlock.
A report is to be created such that for each employee within the Employees table,
associated records within the other datasets will be printed. The emp_id is used as the
field to link the datasets together. Each dataset will exist within its own Sub-Detail Band.
The report will appear as follows with each Sub-Detail Band identified:
.
Figure 122 – The Banded Report to be created
For each employee, the associated Telephone Number records, Email Address records,
Emergency Contact records, and Dependent Information records are printed. If a
particular dataset is empty it will not print (Employee 683 has no email or dependent
information). Each employee record can have any number of telephone, email,
emergency contact, and dependent records associated with it.
www.evisions.com
Argos - Argos Report Writers Guide
Document Version 1.0 – Last Updated 10.18.2010
Page 72 of 118
The process for creating the Banded Report shown above follows:
Create the Title and Detail Bands
First a List Report Type is chosen, with a Title Band and Detail Bands created. The Detail
Band contains the Employee ID, and employee last name/first name concatenated. Also
the band has been given a purple background color.
Create the datasets
Four datasets will be created and named empl_phone, empl_email, Emergency, and
Dependents.
To add a dataset, click the Show/hide the dataset icon on the Band Report Editor Toolbar.
Show/Hide Dataset icon on Band Report
Editor Toolbar
Figure 123 – Clicking the Green Plus Sign to add a dataset
Click the green plus sign on the right to bring up the following dialog box in which you
identify the properties of the dataset.
Figure 124 – Building the dataset using the query builder
Name the dataset empl_phone and set the Master Dataset to ArgosData(main).
ArgosData(main) is the dataset containing the Main Report query.
Build Query icon
Click the “Build Query” icon (the hat with the hammer) to bring up the Build Query dialog
box. Click “Show Tables” then select the Employee_Phone table. Double-click on the
phone_type and phone_number fields which will place them into the tables at the
bottom of the window.
www.evisions.com
Argos - Argos Report Writers Guide
Document Version 1.0 – Last Updated 10.18.2010
Page 73 of 118
Figure 125 – Selecting fields from the Employee_Phone table
Next the WHERE clause is utilized to link the emp_id field in this table to the emp_id field
within the Employees table in the Main DataBlock.
Figure 126 – Linking the Employees table to the Employee_Phone table
After creating the WHERE clause, the SQL for the empl_phone dataset appears as follows:
Figure 127 – The query for the empl_phone dataset
www.evisions.com
Argos - Argos Report Writers Guide
Document Version 1.0 – Last Updated 10.18.2010
Page 74 of 118
Click OK. The Band Report Editor now shows the empl_phone dataset in the upper right
portion of the window.
Figure 128 – The empl_phone query shown in the Band Report Editor
Click the green plus sign to create the other three datasets (empl_email, Emergency, and
Dependents) using the Employee_Email, Employee_Emerg_Contact, and
Employee_Dependents tables using the same method that was used to create the
empl_phone dataset. When completed, the following datasets will then be displayed
within the Band Report Editor.
Figure 129 – All datasets shown in the Band Report Editor
Create the Four Sub-Detail Bands
Now that all datasets have been created, the corresponding Sub-Detail bands can be
created. To create the first band (which will contain the empl_phone dataset), click the
“Create a new subdetail band” icon on the toolbar. Then click anywhere within the Band
Report Editor. The following dialog box will be displayed:
www.evisions.com
Argos - Argos Report Writers Guide
Document Version 1.0 – Last Updated 10.18.2010
Create a new Sub-Detail Band icon on the
toolbar
Page 75 of 118
Figure 130 – Properties of the first Sub-Detail Band
Select empl_phone from the dataset drop-down menu since this is the dataset applied to
this band. Also, uncheck the “Print header/footer even if dataset is empty” box.
Unchecking the box will prevent the band from printing if there is no data within the
dataset. Click OK to continue.
Move fields into the Sub-Detail Bands
Before adding fields into the Band, if you desire to change the name of the band to
something more meaningful, right-click within the band then select “Options”. Enter the
desired name of the band.
The next step is to add fields and appropriate titles to the band. For the first band
(empl_phone), click the “Add a database text field” icon from the toolbar then click
anywhere within the band. The dialog box below will appear.
Adding a database field icon on the
toolbar
Adding a text field icon on the toolbar
Figure 131 – Adding database fields to the Sub-Detail Band
www.evisions.com
Argos - Argos Report Writers Guide
Document Version 1.0 – Last Updated 10.18.2010
Page 76 of 118
Select empl_phone as the dataset and the phone_number field then click OK. The
phone_number field will be added to the band. Repeat the procedure to add the
phone_type to the same band.
Repeat this procedure (adding fields) for each band. Add text fields to each band by
selecting the “Adding a text field”. After adding all fields and titles to each band, the
report format appears as follows:
Figure 132 – The final report design with all four Sub_Detail bands
Note the four Sub-Detail bands beneath the detail band. Each Sub-Detail band contains
labels as well as fields from the empl_phone, empl_email, Emergency, and Dependents
datasets.
Obtaining tables from an external database
In this example, datasets were created from tables existing within the same database.
However, as mentioned earlier, tables from external databases can be utilized to create
datasets.
To access tables from an external database, after clicking the green plus sign to create a
dataset, the following dialog box appears:
Figure 133 – Dataset Properties – selecting another connection
Click “Connection:<default>” in the lower left of the dialog box to bring up the list of
available connections created by your MAPS Administrator.
www.evisions.com
Argos - Argos Report Writers Guide
Document Version 1.0 – Last Updated 10.18.2010
Page 77 of 118
Figure 134 – Choosing another connection
After choosing the appropriate connection you can then select the appropriate tables
from the external database, build the dataset query, and add fields to Sub-Detail Bands
using the same methods described in this example.
www.evisions.com
Argos - Argos Report Writers Guide
Document Version 1.0 – Last Updated 10.18.2010
Page 78 of 118
Adding Parameter Input to the Report
Example 9
Banded Reports obtain query results from the DataBlock to report on the contents of a
database. Other information not contained within the Report Query can be obtained and
inserted into your report, including items such as:
Date and time the report was generated
Information about the database connection such as DataSource name, Driver file
name and version, SQL format, etc.
DataBlock name and path
Report name and path
Username and user type
The search parameters chosen from the DataBlock form.
To obtain this information you need to add an expression field into the desired band
using methods you are now familiar with. This is done by clicking the “Add an
expression field” icon on the Band Report Editor toolbar, then clicking within the band
where you want the field to be placed.
Adding the selections made within the
DataBlock form to the report provides
very useful background information used
to create the report
The “Add an Expression Field” icon within
the Band Report Editor toolbar
Figure 135 – Adding an expression
The Expression dialog boxes above are displayed. From the Expression Wizard, click the
“Variable” button which displays the list of variables that can be inserted into the band.
Variables preceeded with a $ are system variables. Variables without the $ are items
selected from the DataBlock form used to create the report.
www.evisions.com
Argos - Argos Report Writers Guide
Document Version 1.0 – Last Updated 10.18.2010
Page 79 of 118
Figure 136 – The list of system variables
For this example, the DataBlock name as well as the departments selected within the
DataBlock form will be placed into Summary Band that was created in Example 1.
The DataBlock form for Example 1 consists of a list of department names which is
contained in the variable LISTBOX1.DEPT_NAME shown at the bottom of the list in the
above figure.
To add the selected department names into the Summary Band, click the
LISTBOX1.DEPT_NAME variable and it will be placed within the band. When adding the
expression to the band, select the “Autostretch height” box which will increase the height
of the band, if necessary, to accommodate the list of selections from the form.
To add the DataBlock name to the Summary Band, repeat the above process to add an
expression field and select the variable GETVARIABLE(‘$DATABLOCK.NAME’).
Figure 137 – The Summary Band with the new fields
The DataBlock Name (User Guide) as well as the Departments selected within the
DataBlock form (Product Dev, HR, Sales) now appear within the Summary Band. Labels
(“DataBlock Name” and “Departments Selected”) were added separately to describe the
newly added information.
www.evisions.com
Argos - Argos Report Writers Guide
Document Version 1.0 – Last Updated 10.18.2010
Page 80 of 118
Link With Band
Example 10
Lonely Group Header Band
Occasionally, depending on the number and size of bands in your report, you may get
pages that have Group Header Bands at the end of a page. Its corresponding Detail Bands
are then printed on the following pages as illustrated in the figure below.
Figure 138 – Lonely Group Header
Lonely Group Footer Band
In other cases, a page will have just enough room to print the last Detail Band. The Group
Footer Band will be printed on the following page by itself as seen in the figure below.
Figure 139 – Lonely Group Footer
These situations are not desired and to overcome them, use the “Link with Band” feature.
This feature is available for all band types. Report Writers select which band to link the
current band to so the above situations will not occur.
The method to use for this option is to set the link inside the band that comes first. For
example, to fix the lonely group header, you would set the Link with band option in the
Group Header Band since the Detail Band comes after the Group Header Band.
www.evisions.com
Argos - Argos Report Writers Guide
Document Version 1.0 – Last Updated 10.18.2010
Page 81 of 118
In the case of the lonely group footer, you would set the Link with band option in the
detail band since the Group Footer Band comes after the Detail Band.
.
Figure 140 – Group Header Linked to Detail Band
The data entered as shown in the figure above would produce the report in the figure
below and corrects the lonely group header. In this case, the Header 1 band is linked to
the detail band “myDetailBand”. Notice how there is still room for more data on page 1,
yet the second group header is printed on the next page.
Figure 141 – The Lonely Group Header corrected
www.evisions.com
Argos - Argos Report Writers Guide
Document Version 1.0 – Last Updated 10.18.2010
Page 82 of 118
Figure 142 – Detail Band Linked to Group Footer
The data entered in the figure above would produce the report in the figure below and
corrects the lonely group footer. In this case, the Detail Band was configured to link with
the Footer 1 band. Notice how there is still room for more data on page 1, yet the last
detail record for group 1 is not printed until page 2 with its group footer.
Figure 143 – The Lonely Group Footer corrected
www.evisions.com
Argos - Argos Report Writers Guide
Document Version 1.0 – Last Updated 10.18.2010
Page 83 of 118
Creating a Chart
Example 11
This example will demonstrate how to add a simple chart to a Banded Report as shown in
the figure below.
Charting in Argos
The chart to be created in this example is very
simple and was included primarily to show how
to add a chart to a Banded Report.
Chart icon on Band Report Editor toolbar
Figure 144 – Banded Report with a chart
The report contains a list of employees (ID and name) within a department and a chart
showing the salary of each employee.
The Employees Table within the sample database is the only table used in this example. A
DataBlock form was created in which the user enters the department name.
Centering the text in the title band
Four bands are utilized as follows:
Title band containing the department name (grey background color).
Column Header band containing the “ID” and “Name” titles.
Detail band containing the list of employees.
To quickly center the text within the title bar
horizontally or vertically, click on the text, then
click the “Align the selected control to the
horizontal center of its parent” button, or click
“Align the selected control to the vertical center
of its parent” button.
Summary band containing the chart.
The steps to create the report follow.
Align to horizontal center of its parent
Create the Title, Column Header, and Detail Bands
Create a new Banded Report, launch the Banded Report Wizard, then select a “Blank
Report” Type.
Populate the Title, Column Header, and Detail Bands with the appropriate fields using
methods described in previous examples. As a reminder, note that the Title Band contains
the value selected in the DataBlock form using the procedure described in a previous
example.
Align to vertical center of its parent
The remainder of this example is devoted to creating the chart that will be placed within
the Summary Band.
www.evisions.com
Argos - Argos Report Writers Guide
Document Version 1.0 – Last Updated 10.18.2010
Page 84 of 118
Figure 145 – Report Design with Title, Column Header, and Detail Bands
Add a Summary Band
A chart can be added to any type of band. For this example it is added to the Summary
Band. Add the band using methods you are now accustomed to.
Add a Chart Object
Click on the Chart icon on the toolbar, then click anywhere within the Summary Band to
add the chart object. The following dialog box will appear:
Figure 147 – Help Button within Chart
Wizard
Figure 146 – The Chart Wizard
Follow the Chart Wizard
This dialog box is the Chart Wizard that will guide you through the process of creating a
chart. All possible options will not be explained in this example, but only the options that
apply to this example will be shown.
Click the Green Plus sign to add a series. Although more than one series of data can be
displayed on a chart, for this example only one series is required.
Select “ArgosData” within the Dataset field.
Select “salary” for the Value field.
Select “emp_id” for the Label field.
www.evisions.com
Argos - Argos Report Writers Guide
Document Version 1.0 – Last Updated 10.18.2010
Page 85 of 118
Figure 149 – Adding information into the Data Tab
Click the “Type” tab where you can select various types of charts (Bar, Pie, Line, etc.). This
example creates a bar chart which is the default selection, so no change is required.
Click on the “Labels” tab to display various label options. Uncheck the “Visible Label” box.
The image on the right of the window will show the effect of checking/unchecking this
box.
Click the “Bar Option” tab and uncheck the “3D” and “Color Each” boxes. Again, the image
on the right of the window will show the effect of checking/unchecking these boxes.
While on this tab, you can change the color of the bars by clicking the Color button.
Click Next to continue. The Chart Theme and Panel dialog box will appear. For this
example, default values will be used, therefore click Next to continue.
The Chart Legend and Titles dialog box will appear.
Highlight “Legend Style and Title”, then uncheck the “Legend Visible” check box since the
legend is not to be included.
Figure 148 – Bar Chart Sub Types
Note the various sub types available when
choosing a Bar Chart.
Click “Main Title” then enter “Employee Salary” into the “Enter Title Here” box.
Click “Left Axis Title” then enter “Salary” for into the “Enter Title Here” box.
Click “Bottom Axis Title” then enter “Employee ID” into the “Enter Title Here” box.
Figure 150 – Adding Legend and Titles information
Click Finish to continue.
This completes the Wizard, and you will be brought back to the Band Report Editor.
Increase the height of the Summary Band to make room for the chart. Position the chart
to the desired location.
www.evisions.com
Argos - Argos Report Writers Guide
Document Version 1.0 – Last Updated 10.18.2010
Page 86 of 118
Figure 151 – The completed report design
Run the report and select “Technical Support” for the Department Name. The parameter
entered is shown below.
Figure 152 – The query parameter
The resulting Banded Report with included chart is shown below.
See the Argos DataBlock Designers Guide
(or Help) for a more complete description
of Charting within Argos.
Figure 153 – The final report
www.evisions.com
Argos - Argos Report Writers Guide
Document Version 1.0 – Last Updated 10.18.2010
Page 87 of 118
Creating an Extract Report
Example 12
Introduction
An Extract Report is designed to create output files that meet pre-defined specifications.
This feature is especially useful for creating delimited output that is more complex than a
simple comma-separated file (CSV), for creating a fixed-width file in which each field is
precisely positioned on a given line, or for creating an XML file. This could include files
that you might upload to a government agency, clearinghouse, or service bureau.
Report Formats
There are three report formats available:
Extract Reports are somewhat similar in design to a Banded Report. Similar to bands
within a Banded Report, an Extract Report has sections, each of which can include
different data fields. However, in an Extract Report you can loop through as many
datasets as your report requires, and you can precisely control the position of your data in
the output file.
Fixed - The width of each field is a user defined
fixed value.
Unlike a Banded Report, there is no concept of a “page” in an Extract Report. Data is
simply streamed into an output file.
XML - Report output is in XML format.
Delimited - The width of each field is variable
with each field separated by a user defined
delimiter.
Figure 154 – Comparison of Extract and Banded Reports
Sections in the Extract Report
The output file from an Extract report is organized by sections. You can add as many
sections as you like to the Extract Report design. The definition of each type of section is as
follows:
Title - Always appears as the first section in the report. This section contains data obtained
only from the current record of each dataset referenced by the section. Looping through
the datasets to obtain data is not done for this section as only data from the current record
of each dataset is obtained.
Detail – Used to loop through an associated dataset. Within this section, Argos will create
one detail row for each record in the associated dataset. This is useful if you wish to create
a list of vendors, for example.
www.evisions.com
Argos - Argos Report Writers Guide
Document Version 1.0 – Last Updated 10.18.2010
Page 88 of 118
You can create multiple Detail sections in an output file. You might have one simply follow
another. For example, if you wanted a list of all regular checks, followed by a list of all
voided checks, you would simply add a pair of Detail sections. Each Detail section is
associated with its own dataset, and can be formatted however you require.
Another option is to make a Detail section a “parent” of a subsequent Detail section
(referred to as the Sub-Detail section). For each record that is output in the parent Detail
section, the Sub-Detail section will be executed and added to the file as well. In the vendor
example from above, the vendor would be in the parent Detail section, with a list of
invoices in the Sub-Detail section. You can have multiple “levels” of Sub-Detail sections.
Like a Banded Report, using Sub-Detail sections in an Extract Report can significantly
impact the amount of time needed to generate the report. Use this technique only if
Headers and Footers (below) do not meet your requirements.
Header – A Header section is associated with a Detail section, and is used to group the
Detail data by a selected field or expression. The Header section will print once anytime
the value of the group-by expression changes. For example, if your data is organized by
year, and you need a header row at the beginning of each year, you should add a Header
section, grouped by year. Make sure your dataset is sorted by the fields you wish to group
by. As an option, you can exclude the group-by field which will cause Argos to print a
single group Header (and Footer if it exists).
Child – These sections will print directly after their parent section. They are not associated
with a dataset, so any fields you add to a Child section will reflect whatever the current
value of that dataset is. For example, in the vendor example, if you wanted to output each
vendor, with the name on the first line, and the mailing address on the line just below, a
Child section could be used.
Footer – A Footer section is always associated with a Header section. Each Header prints
before a Detail section, and its associated Footer will print just after the last record of the
Detail section.
Summary - Always appears as the last section in the report. This section contains data
obtained only from the current record of each dataset referenced by the section. Looping
through the datasets to obtain data is not done for this section as only data from the
current record of each dataset is obtained. A child section can be placed beneath a
Summary section if necessary.
www.evisions.com
Argos - Argos Report Writers Guide
Document Version 1.0 – Last Updated 10.18.2010
Page 89 of 118
The Report Specification
This example will create an Extract Report loosely based on the Internal Revenue Service Publication 1120, Specifications for Filing Forms 1098,
1099, 3921, 3922, 5498, 8935, and W-2G. The intent of the example is not to create a file adhering to the entire specification, but to illustrate
how the Extract Report could be used to create such a report. Therefore, not all aspects of the specification are included in this example.
The following tables describe the required Record Types within the IRS specification that will be created in this example.
Record Type
Usage
T
The first record in the file. Identifies the institution sending the file to the IRS.
A
Identifies the payer (the institution making payments to vendor). In this example, the payer
is also the institution transmitting the file (same institution as in T record).
B
Identifies the payee (the vendor that received payments) and the payment amounts to each
payee. One record for each payee.
C
Sum of B records (payment amounts) for the payees.
F
End of Transmission records. Contains total number of payers and payees.
The tables below show the fields that are used in each of the Record Types. The position and number of fields does not match the 1099
specification exactly to keep the example concise.
Each record in the report must contain a Record Sequence Number, beginning with “1” for the first record, and incremented by one for each
record in the report.
T Record
Field Name
Width
Value
Record Type
1
T
Payment Year
4
2009
Record Sequence Number
10
Obtained from DataBlock
Transmitter TIN (taxpayer ID)
9
Obtained from DataBlock
Transmitter Name
20
Number of Payees (B records)
10
www.evisions.com
Fill
character
Alignment
zero
right
Obtained from DataBlock
blanks
left
Obtained from DataBlock
zero
right
Argos - Argos Report Writers Guide
Document Version 1.0 – Last Updated 10.18.2010
Page 90 of 118
A Record
Field Name
Width
Value
Fill
character
Alignment
Record Type
1
A
Payment Year
4
2009
Record Sequence Number
10
Obtained from DataBlock
zero
right
Payers TIN
9
Obtained from DataBlock
Payers Name
20
Obtained from DataBlock
blank
left
Type of Return
1
A (represents 1099-MISC
form)
Field Name
Width
Value
Fill
character
Alignment
Record Type
1
B
Payment Year
4
2009
Record Sequence Number
10
Obtained from DataBlock
zero
right
Payee TIN
9
Obtained from DataBlock
Payee Name
20
Obtained from DataBlock
blank
left
Total payments to payee
12
Obtained from DataBlock
– 12 numeric characters.
No decimal points,
commas or dollar signs.
Rightmost 2 characters for
cents
zero
right
Field Name
Width
Value
Fill
character
Alignment
Record Type
1
C
Payment Year
4
2009
Record Sequence Number
10
Obtained from DataBlock
zero
right
Number of payees (B records)
10
Obtained from DataBlock
zero
right
Total amounts paid by payer
18
Obtained from DataBlock
zero
right
B Record
C Record
www.evisions.com
Argos - Argos Report Writers Guide
Document Version 1.0 – Last Updated 10.18.2010
Page 91 of 118
F Record
Field Name
Width
Value
Fill
character
Alignment
Record Type
1
F
Payment Year
4
2009
Record Sequence Number
10
Obtained from DataBlock
zero
right
Number of A records
10
Obtained from DataBlock
zero
right
unused
21
blank
unused
19
blank
Number of B records
10
Obtained from DataBlock
zero
right
Again, the above is a small subset of the required fields, but demonstrates the types of fields, fill characters, and alignment required by the IRS
specification. The field positions may not match the IRS specification in order to keep the report width such that it is easily viewable.
Report Creation Steps
The following steps are required to create the Extract Report for the above specifications and will be demonstrated in this example.
Create the new report in the Argos Explorer and give it a name.
Launch the Extract Report Editor, where the report design takes place.
Configure the Report.
Add datasets to be used in the report.
Add the section and fields for the T Record Type (Title section).
Add the section and fields for the A Record Type (Detail section).
Add the section and fields for the B Record Type (Detail section).
Add the section and fields for the C Record Type. This involves creating Header and Footer sections around the B Record Type detail
section.
Add the section and fields for the F Record Type.
Execute the report.
www.evisions.com
Argos - Argos Report Writers Guide
Document Version 1.0 – Last Updated 10.18.2010
Page 92 of 118
Create a New Report
As with other report types, go to the Argos Explorer, right-click on the DataBlock to be
used for this report, then select “New Report”. Give the report a Name and Description,
click “Extract text report”, then the “Create” button.
The DataBlock used in this example
The Sample Database used for other examples
in this guide will also be used here and will
create 1099 forms for vendors that supplied
services to the Company existing in the Sample
Database. The Purchase_Orders, Vendors, and
Purchase_Order_Items tables contain the
vendor information.
The “Company” table
contains information about the company
submitting the file to the IRS.
A DataBlock was developed to sum the Purchase
Order records for each vendor that received a
1099 form. Vendors with the “reqd1099” field set
to ‘Y’ will receive 1099s. This will be one of the
Datasets used in the Extract Report. The
Company table, which is not joined with any
other table, will be one of the other Datasets
used in the Extract Report.
Figure 155 –Create a new report dialog box
You can add additional Filters or Sort the data that comes from the Report Query by
clicking the Filters and Sort tabs shown in the figure below. Refer to the Filters and Sort
section in this guide for an explanation of this feature is used when creating CSV reports.
This feature is also available to Banded and Extract Reports.
Figure 156 –The database tables used in this
example
Figure 157 – Adding the Report Name and Description
Click the “Design” button to begin the creation of the report.
The Extract Report Editor will then be displayed which is used to design the report.
www.evisions.com
Argos - Argos Report Writers Guide
Document Version 1.0 – Last Updated 10.18.2010
Page 93 of 118
The Extract Report Editor
The Extract Report Editor is used to design the Extract Report. There are three areas within the editor shown in the figure below.
Report Structure, where sections used in the report are created. Properties that apply to all sections and fields are also identified in this
area.
Configure Report, where properties of individual sections and fields are specified. Fields are also added in this area.
Datasets, where datasets used in the report are created and displayed.
Title Bar: Note the Title Bar of the Editor contains the report name followed by the report type. The figure below shows the report name of
“1099_Report”, and that it is a Fixed Width Report. For Delimited Report Types, “Delimited” is displayed, and for XML Report Types “XML” is
displayed. The asterisk next to the report type indicates that changes have been made but have not been saved.
Use of the various icons shown in the Report Editor below are demonstrated in this example. A description of all icons can be found in the InProduct Help.
Options often can be viewed by selecting an object and performing a right-click. For these objects, a menu of selections will be displayed after
the right-click.
Figure 158 –The Extract Report Editor
www.evisions.com
Argos - Argos Report Writers Guide
Document Version 1.0 – Last Updated 10.18.2010
Page 94 of 118
Configure the Report
The first step is to configure the report be selecting options shown within the “Configure
Report” area. Click “Report Options” to display the options under the Settings tab.
The Report Formats
Although there are 3 different output report
formats, the report design process is virtually
identical for all report types.
Figure 159 – Configure Report ( Settings Tab)
The Report Format field allows you to select from Fixed Width, Delimited, and XML
formatted reports. For this example, the Fixed Width Report Format is being used.
Options under the Settings tab apply to all sections within the report, but can be
overridden when configuring individual sections. This will be illustrated later in this
example.
For this example, numeric characters will be padded with zeroes, and the Default Field
Width is changed to 10. The extension can be left blank if you choose to use the default
provided by Argos.
Encoding
For the output file, if UTF-8 encoding is selected,
you have the option of including the Byte Order
Mark (Unicode character) at the start of the text
stream.
Default file extensions
.txt for fixed width reports
.csv for delimited reports
.xml for XML formatted reports
Figure 160 – Entering pad character for numeric fields and default field width
www.evisions.com
Argos - Argos Report Writers Guide
Document Version 1.0 – Last Updated 10.18.2010
When saving a report after execution, Argos will
use the default extensions shown above. If the
default extension is entered here, when saving
the report only this extension will be shown in
the list of file types when saving the report.
Page 95 of 118
Add datasets
The next step is to add the datasets that will be used in the report. The datasets that
were created in the DataBlock’s Report Query are displayed as shown in the figure below.
The ArgosData dataset is the main dataset that obtains payments made to vendors. The
Counter dataset contains a count of the number of vendors that payments were made to.
This value is used in several record types in the report (T and C records), and keeping the
value as a variable allows you to place the variable into a number of sections.
Figure 161 – The datasets area with Datasets in Report Query
The T and A records contain information about the company submitting the report to the
IRS. This information is contained in the “Company” table in the Sample Database, but this
table is not included in the Report Query. Therefore this table must be added as a Dataset.
A right click anywhere within the Datasets
area displays menu items to Add, Edit, or
Delete datasets.
To add the Dataset, click the green plus sign shown in the figure above which displays the
dialog box shown below.
Figure 162 – Creating a Dataset
Enter the name “Company” for the Dataset then click the hardhat/hammer icon to display
the Build Query dialog box shown below. Click the “Add Table” button, enter “Company”
for the name of the table, then click “OK”.
www.evisions.com
Argos - Argos Report Writers Guide
Document Version 1.0 – Last Updated 10.18.2010
Page 96 of 118
Added datasets vs. datasets in Report
Query
Figure 163 – Entering the Table name
The “Company” table will be displayed. Double-click on Transmitter_TIN and Transmitter_
Name as they will be used in the T and A records. Click “OK” to continue.
Datasets added during creation of the Extract
Report are shown with a colored icon. Datasets
contained in the Report Query are not colored.
Datasets created in the Extract Report are
editable, whereas datasets created in the Report
Query are not editable within the Extract Report
Editor.
Dataset Grouping
Click the Group Datasets option shown below to
choose if dataset groupings are to be displayed.
When Dataset grouping is selected, child
datasets are indented relative to its master
dataset. This is shown in the picture below.
Figure 164 – Entering the Dataset name
This Dataset is not a child of another Dataset, therefore leave the “Master Dataset” field as
(none). After clicking “OK”, you will be returned to the Main Interface with the newly
added Company Dataset shown.
Figure 165 – The Datasets area showing all Datasets
www.evisions.com
Argos - Argos Report Writers Guide
Document Version 1.0 – Last Updated 10.18.2010
Page 97 of 118
Note the field names under each Dataset. They will each be placed into various sections
within the Extract Report. Now that the required Datasets exist, the sections and fields can
be added to the report.
Add the section for the T Record Type (Title Section)
A right-click anywhere within the Report
Structure area displays the following
menu items for adding, deleting, or
moving sections.
The first section in the report creates the T Record Type and reads the single record from
the Company Dataset. This Dataset contains general information about the company
submitting the 1099 file.
Add the section
To add the section, click the small down-arrow to the right of the green plus sign, then
click on “Add Title Section” as shown in the figure below.
Conditionally Print
Figure 166 – Adding a Title Section
Enter a Name for the section and a Description, if desired. Since this section is to be
included in the report, do not uncheck the “Print this Section” box. The name entered is
displayed in the Report Structure area for the section as shown below.
If you choose to print the section, you can also
specify if the section is to be conditionally
printed based on the results of an expression.
Click the ellipsis button to launch the Expression
Builder which is used to create an expression.
When Conditional Printing is selected for a
section, the printer icon shown below with the
blue question mark is displayed.
Figure 167 – Entering Name and Description of Section
www.evisions.com
Argos - Argos Report Writers Guide
Document Version 1.0 – Last Updated 10.18.2010
Page 98 of 118
Add fields to the section
The next step is to add fields to this section. The fields to be added from the datasets are
Transmitter_TIN and Transmitter_Name (from the Company dataset), and the number of
payees (from the Counter dataset). Constant fields will be used for record type (T) and
payment year (2009). Finally, an expression field (COUNT) will be used to create the
Record Sequence Number.
Click on the Fields tab shown in the figure above to activate the area where fields are
displayed and configured.
Adding Dataset fields
Dataset fields can be added 3 ways:
By double-clicking on the field displayed in
the Datasets area.
By dragging a field displayed in the
Datasets area onto the Configure Section
area. Multiple fields can be selected via
CTRL-click then dragged into the Configure
Section area.
By clicking the small down-arrow next to
the green plus sign in the Configure
Section area. This allows you to add all
field types and not only Dataset fields. This
is shown in the figure below.
Figure 168 –Adding fields to the section
Fields will now be added in the following order: Record Type, Payment Year, Record
Sequence Number, Transmitter_TIN, _Transmitter_Name, number of payee records.
Record Type - Click the small down-arrow to the right of the green plus sign to display the
list of field types and select “Add Constant Field”. An area will be displayed beneath
where you configure the field. For this field, enter “T” as the value. Also enter “1” as the
field width. Change the name of the field from “Constant” to “T”.
A right-click anywhere within the Configure
Section area will also display the above items.
Figure 169 –Adding the Record Type and renaming the field
Payment Year – repeat the same procedure to add a constant field with a value of 2009
and width of 4.
www.evisions.com
Argos - Argos Report Writers Guide
Document Version 1.0 – Last Updated 10.18.2010
Page 99 of 118
Record Sequence Number – Add a COUNT expression as shown below which will
increment for each record.
Dragging Dataset fields
If you drag a Dataset field from the Datasets area
to the Configure Section area, you will need to
click on the field after dragging for the
configurable properties to appear. This step is
not required when using the other methods for
adding fields to a section.
Figure 170 –Adding the COUNT expression
The COUNT field will then appear as shown in the figure below. Right align the field by
clicking the alignment icon. For the expression value, add “+1” after COUNT to start the
counter at 1.
Figure 171 –The section with 3 fields added
Note in the figure above that 3 fields have been added along with width, field position,
and field type.
Transmitter_TIN and Transmitter_Name – add these dataset fields by double-clicking
on them within the Datasets area. Increase the width of the Transmitter_Name field to 20.
Set the width of Transmitter_TIN to 9.
Number of payees – add this dataset field by double-clicking on the B_Count field in the
Counter dataset. This field contains the number of payees (also the number of B records).
The added fields are shown as follows. Take note of the width, field position, and field
type fields to verify it they are correct.
www.evisions.com
Argos - Argos Report Writers Guide
Document Version 1.0 – Last Updated 10.18.2010
Page 100 of 118
Extract Report Editor Icons
Icon
Description
Close the Editor.
Save your work.
Figure 172 –The section with all fields added
Undo the last operation.
Save your work and test the report
You can save your work at any time by clicking the save icon at the top left of the Report
Editor. You can view the report by clicking the green circular icon containing an arrow.
The icon is shown in the sidebar to the right.
Redo the last undone
operation. Click the
small arrow to view
undo history.
Test the report.
A preview of the report at this stage appears as follows:
Open In-Product Help
Record Type = T
Year = 2009
Record Sequence Number = 1
Transmitter_TIN = 123456789
Transmitter_Name = ACompany,Inc.
Number of payees = 12
www.evisions.com
Argos - Argos Report Writers Guide
Document Version 1.0 – Last Updated 10.18.2010
Page 101 of 118
Add the section for the A Record Type (Detail Section)
This section identifies the institution making payments to vendors. For this example, the
transmitter is the same institution as the institution making the payments. Therefore the
company name and TIN for this record contains the same values used in the T record.
Add the section
Add a Detail Section beneath the T Record and name it “A Record”. Select “Company” as
the Associated Dataset and leave the Parent Detail Section as (none) as shown in the
figure below.
Renaming fields
There are 3 ways to rename a field:
Figure 173 –Adding a Detail Section for the A Record Type
Add the fields
Since the first 5 fields are the same as used in the T Record, you can copy them from the T
Record and paste them into this section. To do this, click on the T Record (in the Report
Structure Area), click the Fields tab, highlight the first 5 fields using CTRL/click, then click
the copy icon. Then click the A Record (in the Report Structure Area), click the Fields tab,
then click the paste icon. All 5 fields will be pasted, with an integer number appended to
the Field Name as shown below. You can then rename the fields as desired. See the
sidebar which contains the various ways to rename fields.
www.evisions.com
Argos - Argos Report Writers Guide
Document Version 1.0 – Last Updated 10.18.2010
Click on the field then change the name in
the “Name” field at the bottom of the area.
The figure below shows the Name field.
Perform a slow double-click on the field.
The field will then be surrounded by a box.
You can then change any characters within
the box. The figure below shows the
selected field name surrounded by the box
after a slow double-click.
Select the field then click the F2 key. The
field can then be edited.
Page 102 of 118
Figure 174 – copy/paste fields to this section
After the paste operation, change the field name from T to A, and change the value to A.
Then add the Return Type as a constant field, give it a value of A, and set the width to 1.
The fields within the A record should now appear as shown below:
Figure 175 –The A Record with all fields added
Add the section for the B Record Type (Detail Section)
This section contains the amount paid to each payee and loops through the Vendor table
in the ArgosData dataset to obtain the Payee TIN, Payee Name, and total payments to
each payee.
www.evisions.com
Argos - Argos Report Writers Guide
Document Version 1.0 – Last Updated 10.18.2010
Page 103 of 118
Add the section and fields
Add a Detail Section, name it “B Record” and select ArgosData as the Associated Dataset.
Then add the Record Type = B, Payment Year, Record Sequence Number in the same
fashion that was done for the T and A records. Then add the Payee TIN, PayeeName, and
TotalCost fields from the ArgosData dataset. Right align the COUNT and TotalCost fields,
and left align the PayeeTIN and PayeeName fields.
The fields contained within the B Record should appear as follows:
Icons used to represent data types
Icon
Data type
string
float
Figure 176 –The B Record with all fields added
integer
Save your work and test the report
At this point the report will appear as follows:
date
Figure 177 – Testing the report
www.evisions.com
Argos - Argos Report Writers Guide
Document Version 1.0 – Last Updated 10.18.2010
Page 104 of 118
Add the Sections for the C Record Type (Header and Footer Sections)
The C record type contains the number of payees (B records) as well as the sum of all
payments made by the payer. Therefore, Header and Footer sections will be created
which will count the number of B records and will sum the payment amounts in the B
records.
Note: although the B_Count variable also contains the number of B records and could be
used here, the value will be computed again to demonstrate how Header and Footer
Sections are used to count and sum data contained in details records.
Add a Header Section
Add a Header Section, name it “B Header”, set Detail Section to “B Record”, and uncheck
the “Print this section” box.
The printer with a red x indicates that the
section is not to be printed
Figure 178 –Adding a Header Section
No fields will be placed in the Header Section, which is why the section is not to be
printed. Note the image of a printer with the red x, which indicates that the section is not
to be printed. Header and Footer Sections are used to group information in the Detail
Section surrounded by the Header and Footer Sections in the same fashion as is used for
the Banded Report Header and Footer Bands. You can group the data in the Detail Section
by selecting one of the available functions that are displayed when clicking the ellipsis in
the “Group by” field. The Expression Builder will be launched where you can create the
expression used as the criteria for grouping.
This example does not require the B Records to be grouped since the order of data in this
case is immaterial.
Add a Footer Section
A Footer Section will be added to count the number of detail (B) records and to sum the
payment amounts in the B Records. COUNT and SUM expressions will be added to the
Footer. The footer section becomes the C Record Type and will be printed.
Add the Footer Section and select “Header” as the Header Section that this Footer is
associated with as shown in the figure below. Name the Section “C Record”.
www.evisions.com
Argos - Argos Report Writers Guide
Document Version 1.0 – Last Updated 10.18.2010
Page 105 of 118
Figure 179 –The Footer Section for the C Record Type
Add the fields to the C Record
Using methods shown above, add the Record Type, Payment Year, Record Sequence
Number fields by copying them from other sections and pasting them into the C Record.
Add a COUNT expression, right align, and name it TotalBRecords. Select “B Record” for the
“Controlled by Detail Section” field since the COUNT expression must count the number of
records in the B (detail) section.
Add a SUM expression to sum the TotalCost fields in the B Records. Select “B Record” for
the “Controlled by Detail Section” field such that the SUM expression will sum only values
from the B section. The figure below shows the selections required when summing the
TotalCost field using “Add EZ Expression Field”.
Adding Expressions
Expressions can be added using the Add EZ
Expression Field option which allows you to
quickly add the most commonly used Argos
functions.
You can also add an expression by selecting
“Add Expression Field”, and the entire set of
Argos functions is available to you via the
Expression Builder shown below.
When using this method to add an expression,
after clicking “Add Expression”, click the ellipsis
button at the right of the Expression field to
launch the Expression Builder
Figure 180 – Adding the SUM function
The figure below shows all of the fields after being added to the C Record.
Figure 181 – After all fields added to the C Record
www.evisions.com
Argos - Argos Report Writers Guide
Document Version 1.0 – Last Updated 10.18.2010
Page 106 of 118
Add the Section for the F Record Type (Summary Section)
The F Record Type is the end of transmission record and must appear as the last record in
the report. Therefore a Summary Section is used for this Record Type.
Add a Summary Section
Add the Summary Section and name it “F Record”. The record will be placed as the last
section. Since this record contains fields to be included in the report, keep the “Print this
section” box checked. At this point, all sections have been added and appear as shown
below.
Figure 182 –The entire report structure
Add the fields
The first 3 fields in this Section (Record Type, Payment Year, and Record Sequence
Number) have already been added to prior sections and can be copied into this section.
After copying, change the value of the Record Type to “F”.
After the Record Sequence Number field, add a constant field containing the number of A
records, which is 1 for this example. The next field is 21 characters and is left blank.
Therefore add a constant field with blanks for the value. Following this field is a 19
character field to be left blank, therefore add the appropriate constant field. Finally, the
last field contains the number of B records, so move the B_Count field from the Datasets
area into the list of fields. When completed, the fields should appear as shown in the
figure below.
Note the field names that were entered to provide meaning to each.
www.evisions.com
Argos - Argos Report Writers Guide
Document Version 1.0 – Last Updated 10.18.2010
Page 107 of 118
Figure 183 –The F Record with all fields added
Save your work and test the report
The report is now completed, therefore save it and click the “Test this Report” icon to
preview the report. The completed report appears as follows:
Figure 184 –Testing the completed report design
www.evisions.com
Argos - Argos Report Writers Guide
Document Version 1.0 – Last Updated 10.18.2010
Page 108 of 118
Execute the Report
Extract Reports are executed in the same fashion as other report types. Select the report
from the Argos Explorer window, then click the Execute button to execute the report.
The icons shown below are used to
represent the Report Type.
Del represents Delimited report format
Fix represents Fixed Width report format
xml represents XML report format
Figure 185 – Executing the report
After execution of the report you have the option of saving the report to a file, emailing
the report, or have an application automatically launched to display the report. The
application launched depends on the file extension chosen when the report was created.
For example, if you chose a file extension of .xls, then MS-Excel will be launched.
Figure 186 – Saving the report results
www.evisions.com
Argos - Argos Report Writers Guide
Document Version 1.0 – Last Updated 10.18.2010
Page 109 of 118
The Report in Delimited Report Format
The above report in delimited format would appear as follows (using comma as the
delimiter).
Figure 189 –Report in delimited format
The Report in XML Report Format
In XML format, the report appears as shown below if defaults were used for the following
fields:
Write XML Declaration
Root Element Name
o
By default, the Root Element Name is “XML” as shown below
Tag Indentation
Figure 187 –XML Declaration, Root
Element Name, Tag indent, tag notation
Compact tag notation
XML Element Name for a section
o
By default, the section name is used for the XML Element Name.
XML Element Name for a field
o
By default, the field name is used for the XML Element Name.
Is Attribute (applies to each field)
The In-Product Help describes the location and use of these fields in detail.
Figure 188 –XML Element Name for a
Section
Figure 190 – Report in XML format using defaults
www.evisions.com
Argos - Argos Report Writers Guide
Document Version 1.0 – Last Updated 10.18.2010
Page 110 of 118
If you override the defaults, the appearance of the report will differ. For example, if the “Is
Attribute” option is unchecked for a given field, then the XML syntax for the field is:
<Field Name>field value</Field Name>
In this example, if the “Is Attribute” field in the F Record is unchecked for the B_Count field,
the XML created is shown below and differs from the figure above.
Additionally, if you enter values for XML Element Name for sections or fields, the defaults
mentioned above will be replaced by the values that you enter.
Figure 191 –XML Element Name and “Is
Attribute” for the B_Count field
www.evisions.com
Argos - Argos Report Writers Guide
Document Version 1.0 – Last Updated 10.18.2010
Page 111 of 118
Argos Resources
Evisions Forum
Comprised of Argos clients for sharing of
information about Evisions’ products
The Support Site
The support site can be accessed through the web using the following URL:
HelpDesk
Technical issues can be logged here.
http://www.evisions.com/Support/Overview.aspx
Navigating to this site through the link or through Evisions’ main page will require login
credentials before allowing material to be downloaded.
The support site can also be accessed through Argos by clicking the Help button on the
Argos menu bar shown below.
Training Calendar
A calendar of all online training.
Argos Documentation
All Argos Documentation (technical
functional) can be downloaded here.
&
Multimedia Content
Gives users the opportunity to download the
flash video files.
COOP
Figure 192 – Link to support site from Argos
A DataBlock repository for all Argos’ clients.
Accessing the support site from Argos requires login credentials for the first use of the
site. Subsequent access to the site will bypass the security page, allowing the user to
access materials without credentials. The figure on the right shows the screen that
appears when accessing the support site for the first time.
Enter your User Name and Password, which are required only the first time you visit the
support site. If you do not have a user name or password, contact your systems
administrator or you may create your own account by filling in the items under
“Register New Account”. If you register yourself, you will be granted a default set of
privileges. Therefore if you require additional privileges see your systems administrator.
After accessing the site, navigate around the site noting the available tools for Argos
users.
Once in the support site, there are several things that Argos users may find useful:
Argos Documentation: All Argos documentation (technical and functional) can be
downloaded here. This includes user guides, installation guides, and white papers.
Don’t forget to use the In-Product Help within Argos.
The Training Calendar: A calendar of all online training sessions. Training is
completely free and can be repeated as needed.
Multimedia Content: In addition to the documentation, Evisions records on video all
online training. This gives users the opportunity to download the flash video files and
watch the training at their leisure.
www.evisions.com
Argos - Argos Report Writers Guide
Document Version 1.0 – Last Updated 10.18.2010
Page 112 of 118
Evisions Forums: collaborate with peers and share ideas about the Evisions Suite of
Products based upon specific topics. The forums are also used to provide Evisions
product/update information to clients. Forums can be found on the Evisions web site
under the CO-OP User Community page.
The HelpDesk: Technical issues can be logged here. The link to the HelpDesk is listed
below under “Important Links”.
The CO-OP User Community
Like the support site, the COOP can be accessed in two ways:
1. Through the Evisions main page under the Support tab
2. Using the COOP button in the Argos interface
The COOP is a DataBlock repository for all Argos clients. Evisions periodically uploads
DataBlocks to the COOP for use in its client base. In addition, clients are encouraged to
use the COOP as a mechanism to share the DataBlocks they have put together. Joining
the Evisions CO-OP User Community also allows users to participate in forums and
obtain Evisions Documentation and Software.
CO-OP
“Visit the COOP Site” icon on the Argos toolbar
Click the “Visit the Argos COOP Site” icon on the toolbar. Enter your User Name and
Password shown on the Account Login screen shown on the previous page. This is only
required the first time you visit the COOP site. If you do not have a user name or
password, contact your systems administrator or you may create your own account by
filling in the items under “Register New Account”. If you register yourself, you will be
granted a default set of privileges. Therefore if you require additional privileges see your
systems administrator. The default privilege will allow you to download files from the
CO-OP.
This will bring you to the CO-OP User Community page on the Evisions web site where
you can take advantage of the features described above.
Important Links
Evisions Help Desk:
http://helpdesk.evisions.com
Evisions Training Calendar: http://www.evisions.com/calendar
www.evisions.com
Argos - Argos Report Writers Guide
Document Version 1.0 – Last Updated 10.18.2010
Page 113 of 118
Table of Figures
Figure 1 – Explorer objects............................................................................................................ 11
Figure 3 – Explorer Navigation .................................................................................................... 12
Figure 2 – Options for QuickLaunch .......................................................................................... 12
Figure 4 – QuickLaunch View ....................................................................................................... 13
Figure 5 – Dashboard View ........................................................................................................... 13
Figure 6 – Reports as children of a DataBlock ......................................................................... 14
Figure 7 –Available report types ................................................................................................. 15
Figure 10 – Creating a QuickView Report ................................................................................. 16
Figure 9 – Editing the author of the report .............................................................................. 16
Figure 11 – Report Writer Actions ............................................................................................... 16
Figure 12 – Editing the details of the QuickView Report ..................................................... 17
Figure 14 – The Saved States Tab ............................................................................................... 18
Figure 13 – The created QuickView Report.............................................................................. 18
Figure 15 – Field Names in Employee Table ............................................................................ 19
Figure 16 – Creating a new CSV Report .................................................................................... 19
Figure 17 – Editing the Report ..................................................................................................... 20
Figure 18 – Choosing the fields to appear within the report ............................................. 20
Figure 19 – Changing the field names....................................................................................... 21
Figure 21 – The CSV report within Excel ................................................................................... 21
Figure 20 – The completed CSV report available to be executed..................................... 21
Figure 22 – Preparing to add new fields ................................................................................... 22
Figure 23 – The Expression Builder dialog box ....................................................................... 22
Figure 24 – Expression Builder (first item in expression) ..................................................... 22
Figure 25 – Expression Builder (second item in expression) ............................................. 23
Figure 26 – Expression Builder ( final item in expression) ................................................... 23
Figure 27 – Entering a name for the new field ........................................................................ 23
Figure 28 – The new field concatenating last/first name .................................................... 24
Figure 29 – The list of Date & Time Functions ......................................................................... 24
Figure 30 – New field containing today’s date/time ............................................................. 25
Figure 31 - The CSV report showing the two new fields ..................................................... 25
Figure 32 – Edit Report dialog box ............................................................................................. 25
Figure 33 – Creating a filter ........................................................................................................... 26
Figure 34 – Filtering salaries above 60,000 .............................................................................. 26
Figure 35 – The Sort Tab within the Edit Report dialog box ............................................... 27
Figure 36 – Banded report using various Band Types .......................................................... 28
Figure 37 – The simple Banded Report ..................................................................................... 29
Figure 38 – Selecting the Banded Report Type ...................................................................... 29
Figure 39 – DataBlock form for this example. ......................................................................... 29
Figure 40 – Selecting fields to include within the report .................................................... 30
Figure 41 – Specifying which fields will exist within the report ........................................ 31
Figure 42 – Identifying which bands will be utilized ............................................................ 31
www.evisions.com
Argos - Argos Report Writers Guide
Document Version 1.0 – Last Updated 10.18.2010
Page 114 of 118
Figure 43 – Selecting Page Settings ........................................................................................... 32
Figure 44 – The Report Format showing Column Headings and Fields.......................... 32
Figure 45 – Properties of the Text Field .................................................................................... 33
Figure 46 – The text field added to the Page Header Band ................................................ 33
Figure 47 – Background color of Page Header Band changed .......................................... 34
Figure 48 – The report after adjusting the column headers ............................................... 34
Figure 49 – Sort options ................................................................................................................. 34
Figure 50 – The report after sorting by Employee ID ............................................................ 35
Figure 52 – Selected field ............................................................................................................. 35
Figure 53 – Field Editing options ................................................................................................ 35
Figure 51 – Band options............................................................................................................... 35
Figure 54 – Alignment guidelines ............................................................................................... 36
Figure 56 – Grouping fields together ........................................................................................ 36
Figure 57 – Selecting multiple objects ...................................................................................... 36
Figure 55 – Alignment icons ......................................................................................................... 36
Figure 58 – Sorting by Department Name then Employee ID ........................................... 37
Figure 59 – Selecting the Date from the list of system data fields.................................... 38
Figure 60 – The Date field added to the Page Header Band .............................................. 38
Figure 61 – Building the expression ........................................................................................... 38
Figure 62 – The first segment of the text string ..................................................................... 39
Figure 63 – Select the PAGENUMBER function ....................................................................... 39
Figure 64 – Enter the remaining segment of the expression ............................................. 39
Figure 65 – Select the PAGECOUNT function .......................................................................... 40
Figure 66 – The completed expression ..................................................................................... 40
Figure 67 – Select Autosize width to ensure the new field will fit .................................... 40
Figure 68 – Adding the Group Header Band ........................................................................... 41
Figure 69 – Selecting Department Name as the database field to group by ................ 41
Figure 70 – Adding the database field to Group-by field listbox ...................................... 42
Figure 71 – The Banded Editor showing the Group Header/Footer Bands ................... 42
Figure 72 – The Report showing the grouping by Department Name ........................... 43
Figure 73 – Adding a background color to the Group Header Band ............................... 44
Figure 74 - Highlighting the Group Header Band
............................................................ 44
Figure 75 – Adding a Child Band beneath the Group Header Band ................................ 45
Figure 76 – The report format with the Child Band............................................................... 45
Figure 77 – The report showing the Group and Child Bands ............................................. 46
Figure 78 – Resetting values of expression after printing ................................................... 46
Figure 79 – Creating an expression for Employee Count .................................................... 47
Figure 80 – Enter the first segment of the expression .......................................................... 47
Figure 81 – Selecting the parameter for SUM function........................................................ 48
Figure 82 – Selecting the database field................................................................................... 48
Figure 83 – Selecting the salary field ........................................................................................ 48
Figure 84 – The completed expression ..................................................................................... 49
Figure 85 – Adding the Summary Band .................................................................................... 50
Figure 86 – The Report Format after adding the Summary Band ..................................... 50
www.evisions.com
Argos - Argos Report Writers Guide
Document Version 1.0 – Last Updated 10.18.2010
Page 115 of 118
Figure 87 –Employee count and salary sum within Group & Summary Bands............. 50
Figure 88 – The completed report .............................................................................................. 51
Figure 89 – Choosing the field to be formatted ..................................................................... 52
Figure 90 – Selecting the formatting option ........................................................................... 53
Figure 91 – The expression as one string ................................................................................. 53
Figure 92 – The expression separated into 2 fields ............................................................... 53
Figure 93 – The formatted numeric output printed.............................................................. 54
Figure 94 – Grouping by First Letter of Last Name ................................................................ 55
Figure 95 – The format of the report prior to creating groups .......................................... 56
Figure 96 – Creating the Group Header Band ......................................................................... 56
Figure 97 – Selecting the COPY function.................................................................................. 56
Figure 98 – Obtaining the first letter of the last name ......................................................... 57
Figure 99 – The expression entered into the Group-by-field or expression box ......... 57
Figure 100 – Adding the expression to print within the Group Header ......................... 58
Figure 101 – The final report grouped by first letter of employee last name ............... 58
Figure 102 – Selecting the Mailing Label Report Type ......................................................... 59
Figure 103 – Selecting the Mailing Label Type ....................................................................... 60
Figure 104 – The Label Format shown within the Band Report Editor ........................... 60
Figure 105 – Rearranging and aligning fields ......................................................................... 61
Figure 106 – The Rich Text Field Editor ..................................................................................... 62
Figure 108 – Identifying lines not to print if empty............................................................... 63
Figure 110 – The completed mailing label............................................................................... 63
Figure 109 – Edit dialog box for Rich Text Field ..................................................................... 63
Figure 111 – The printed report .................................................................................................. 64
Figure 112 – The Report Design .................................................................................................. 65
Figure 113 – Forcing a New Page for the Group Header Band .......................................... 65
Figure 114 – Obtaining the name of the expression ............................................................ 66
Figure 115 – Entering the expression name into the RESETEXPR function ................... 66
Figure 116 – The report showing all Purchase Orders.......................................................... 67
Figure 117 – Entering the criteria for conditional printing ................................................. 68
Figure 118 – The complete expression used for conditional printing ............................ 68
Figure 119 – The final report with conditional printing applied ....................................... 69
Figure 120 –Band Report Editor with Blank Report Type selected ................................... 70
Figure 121 – Tables to be used to create datasets for Sub-Detail Bands........................ 72
Figure 122 – The Banded Report to be created ...................................................................... 72
Figure 123 – Clicking the Green Plus Sign to add a dataset ............................................... 73
Figure 124 – Building the dataset using the query builder................................................. 73
Figure 125 – Selecting fields from the Employee_Phone table......................................... 74
Figure 126 – Linking the Employees table to the Employee_Phone table .................... 74
Figure 127 – The query for the empl_phone dataset ........................................................... 74
Figure 128 – The empl_phone query shown in the Band Report Editor ........................ 75
Figure 129 – All datasets shown in the Band Report Editor ................................................ 75
Figure 130 – Properties of the first Sub-Detail Band ............................................................. 76
Figure 131 – Adding database fields to the Sub-Detail Band ............................................ 76
www.evisions.com
Argos - Argos Report Writers Guide
Document Version 1.0 – Last Updated 10.18.2010
Page 116 of 118
Figure 132 – The final report design with all four Sub_Detail bands............................... 77
Figure 133 – Dataset Properties – selecting another connection ..................................... 77
Figure 134 – Choosing another connection ............................................................................ 78
Figure 135 – Adding an expression ............................................................................................ 79
Figure 136 – The list of system variables .................................................................................. 80
Figure 137 – The Summary Band with the new fields .......................................................... 80
Figure 138 – Lonely Group Header............................................................................................. 81
Figure 139 – Lonely Group Footer .............................................................................................. 81
Figure 140 – Group Header Linked to Detail Band ................................................................ 82
Figure 141 – The Lonely Group Header corrected................................................................. 82
Figure 142 – Detail Band Linked to Group Footer ................................................................. 83
Figure 143 – The Lonely Group Footer corrected .................................................................. 83
Figure 144 – Banded Report with a chart ................................................................................. 84
Figure 145 – Report Design with Title, Column Header, and Detail Bands .................... 85
Figure 146 – The Chart Wizard ..................................................................................................... 85
Figure 147 – Help Button within Chart Wizard ....................................................................... 85
Figure 149 – Adding information into the Data Tab ............................................................. 86
Figure 150 – Adding Legend and Titles information ............................................................ 86
Figure 148 – Bar Chart Sub Types ............................................................................................... 86
Figure 151 – The completed report design ............................................................................. 87
Figure 152 – The query parameter ............................................................................................. 87
Figure 153 – The final report ........................................................................................................ 87
Figure 154 – Comparison of Extract and Banded Reports .................................................. 88
Figure 155 –Create a new report dialog box ........................................................................... 93
Figure 157 – Adding the Report Name and Description ..................................................... 93
Figure 158 –The Extract Report Editor....................................................................................... 94
Figure 159 – Configure Report ( Settings Tab) ........................................................................ 95
Figure 160 – Entering pad character for numeric fields and default field width ......... 95
Figure 161 – The datasets area with Datasets in Report Query ......................................... 96
Figure 162 – Creating a Dataset ................................................................................................. 96
Figure 163 – Entering the Table name ...................................................................................... 97
Figure 164 – Entering the Dataset name .................................................................................. 97
Figure 165 – The Datasets area showing all Datasets ........................................................... 97
Figure 166 – Adding a Title Section............................................................................................ 98
Figure 167 – Entering Name and Description of Section ................................................... 98
Figure 168 –Adding fields to the section.................................................................................. 99
Figure 169 –Adding the Record Type and renaming the field........................................... 99
Figure 170 –Adding the COUNT expression .......................................................................... 100
Figure 171 –The section with 3 fields added ......................................................................... 100
Figure 172 –The section with all fields added ....................................................................... 101
Figure 173 –Adding a Detail Section for the A Record Type ............................................ 102
Figure 174 – copy/paste fields to this section....................................................................... 103
Figure 175 –The A Record with all fields added ................................................................... 103
Figure 176 –The B Record with all fields added.................................................................... 104
www.evisions.com
Argos - Argos Report Writers Guide
Document Version 1.0 – Last Updated 10.18.2010
Page 117 of 118
Figure 177 – Testing the report ................................................................................................. 104
Figure 178 –Adding a Header Section ..................................................................................... 105
Figure 179 –The Footer Section for the C Record Type...................................................... 106
Figure 180 – Adding the SUM function ................................................................................... 106
Figure 181 – After all fields added to the C Record ............................................................. 106
Figure 182 –The entire report structure .................................................................................. 107
Figure 183 –The F Record with all fields added .................................................................... 108
Figure 184 –Testing the completed report design .............................................................. 108
Figure 185 – Executing the report ............................................................................................ 109
Figure 186 – Saving the report results..................................................................................... 109
Figure 189 –Report in delimited format ................................................................................ 110
Figure 190 – Report in XML format using defaults .............................................................. 110
Figure 187 –XML Declaration, Root Element Name, Tag indent, tag notation ...........110
Figure 188 –XML Element Name for a Section...................................................................... 110
Figure 191 –XML Element Name and “Is Attribute” for the B_Count field ...................111
Figure 192 – Link to support site from Argos ........................................................................ 112
www.evisions.com
Argos - Argos Report Writers Guide
Document Version 1.0 – Last Updated 10.18.2010
Page 118 of 118