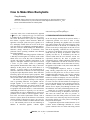
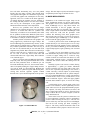
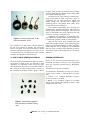
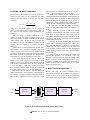
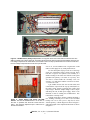
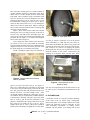
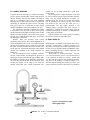
1
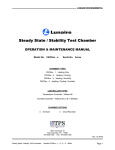
the Bell Jar
vacuum technique and related topics
for the amateur investigator
VOLUME 10 NUMBER 3/4
SUMMER/FALL 2001
Pressure
Reading
LO
Vacuum Chamber
P
Deviation
Error
I
HI
D
Set Point Input
Pressure
Gauge
Gas
Supply
Proportioning
Valve
C
Throttle Valve
A
D
B
E
To Pump
Time
From Cartesian Divers to
Closed Loop Pressure Control
Also In This Issue: Synthesizing Buckyballs, Modified
Hardware Store Inverters for High Voltage Power
Supplies, a Microwave Oven Plasma Reactor, Taking
the Bubbles out of Gel Candles
Departments & Brief
Notes
Contents
the Bell Jar
Commentary
Vol.10, No. 3/4
1
Summer/Fall 2001
Vacuum Connections
the journal of
vacuum technique and
related topics for
the amateur
investigator
1
Articles
How to Make More Buckyballs
Greg Konesky
1
A Happenstance High Voltage Power Supply 6
Microwave Oven Plasma Reactor
Hideaki Page
11
Bubbles and Gel Candles
14
Cartesian Divers - Part 2
17
ISSN 1071-4219
Published quarterly.
Subscription price is $20.00
(US addresses) for the 2001
volume. Add $3.00 (Canada &
Mexico); $9.00 elsewhere.
Address: 35 Windsor Drive
Amherst, NH 03031
Tel. (603) 429-0948
email: [email protected]
http://www.belljar.net
Publisher & Editor: Steve Hansen
The mission of the Bell Jar is to provide information of
value to the serious amateur experimenter in the area of
vacuum technique. Along with this, the scope of the
journal includes projects in the physical sciences which
require the use of vacuum apparatus of varying
complexity. the Bell Jar also serves as a forum for
information exchange. Contributions in the form of
correspondence and articles are invited.
Notice of Disclaimer: Many of the topics, projects, and
materials discussed in this journal are inherently
hazardous to life, health, and property. Please do not
undertake the utilization or implementation of any of the
information presented herein unless you have an
appropriate level of experience. While care has been
taken to assure the accuracy of the material presented,
neither the editor nor the authors may be held liable for
any damages and/or injuries resulting from the use or
misuse of information.
the Bell Jar is funded by subscriptions rather than
through advertising. Subscribers having relevant items
for sale may have those items listed without charge.
Firms with products or services of potential interest to
the readership will be given editorial mention as space
permits.
What Next? This issue (which is actually being
released at the end of 2007) represents the end of the
original series of this publication. Beginning in 2008
with Volume 11, the Bell Jar will become an on line
journal with printed copies only being made available
for the complete year.
Copyright 2007, Stephen P. Hansen except material
otherwise credited. Individuals are permitted to make
copies of articles in this journal for their own use,
providing such copies are not to be sold. Permission is
granted to briefly quote from this journal with the
customary acknowledgment of the source.
Coming Up: Preparing pumps for oxygen service,
Kurt J. Lesker’s amazing MicroMaze, using orifices
for precise low pressure control, plasma ashing and
lots more.
ii
How to Make More Buckyballs
Greg Konesky
Abstract: Improvements in reactor design and operation are described which result in
an over five-fold increase in yield of the soccer ball shaped carbon molecule C 60 also
known as Buckminsterfullerene or Buckyballs.
I. INTRODUCTION
fullerenes, such as C120 and C24, carbon nanotubes, plus
other interesting carbon morphologies.
A previous article, How to Make Buckyballs, appeared
in tBJ Vol. 2, No. 2, Spring 1993, pgs 7-10. This article
is included in the compendium The First Five Years.
The article described a basic system for synthesizing
these hollow, cage-like carbon molecules. While the
apparatus was simple, yields were poor, typically 1% or
less, and highly variable from run to run. In the years
since that article was published considerable improvement has occurred in understanding how Buckminsterfullerenes (simply referred to as fullerenes) form,
preferred reactor operating conditions and enhanced
extraction techniques.
Among the more interesting properties of fullerenes
is that they are held together in a solid by weak van der
Waals forces. As a result, they can be sublimated in a
vacuum with relatively moderate temperatures of 350
degrees C and higher. Fullerene vapor has been used as
a source of pure volatile carbon in synthesizing
nanocrystalline diamond thin films using a microwave
discharge. In this process, the rare carbon dimer C2 is
formed - a process unique to the decomposition of
fullerenes. Thin films of fullerene can also be deposited
by Physical Vapor Deposition (PVD). These films have
interesting optical and electro-optical properties. Both
the PVD of fullerene thin films and the electrochromic
effect in these films will be the subject of future articles.
The electric arc synthesis technique is the simplest
route to generating fullerenes. Two graphite rods are
brought together in an inert atmosphere, typically
helium, at reduced pressure. An electric current of 100
to 150 amps is passed through the contact area of the
two graphite rods (each of which is ¼ inch in diameter)
establishing an electric arc. Typically, 15 to 20 volts are
required, either ac or dc, to maintain the arc. Fine soot is
produced, most of which is unreacted graphite. Extraction of the soot with a hydrocarbon solvent, such as
toluene or xylene, dissolves the fullerenes. The solution
consists primarily of dissolved C60 and C70 in a ratio of 3
to 1, as well as trace amounts of smaller fullerenes down
to C28. The insoluble portion of the soot remaining, in
addition to unreacted graphite, contains higher
II. PROBLEMS WITH EARLIER DESIGNS
In the first design described in the previous article, a
compressed grommet was used to form a rotary
feedthrough, permitting one graphite rod to be rotated
into contact with the other. The vacuum integrity of this
approach left much to be desired, as evidenced by the
pressure in the bell jar being higher at the end of a run
than at the beginning. Fullerenes are easily destroyed
by exposure to atmospheric oxygen at the temperatures
inside the bell jar during arc synthesis. Yields were
typically less than 1%, as calculated by the mass of
extracted solids from the soot when the solvent was
evaporated, divided by the mass of graphite rod
consumed by the arc. Another indication of atmospheric
oxygen contamination was that the total mass of soot
and other residual solids was less than what was lost by
the graphite rods. In other words, some carbon had been
lost as carbon dioxide.
A refrigeration compressor, used as a vacuum
pump, initially pumped the bell jar down. The base
pressure was only about 8 to 10 Torr, so three or more
pumpdown-backfill sequences were used to minimize
residual atmospheric contamination. Welding grade
helium was used. Its stated purity was 99.9%, but subsequent analysis by a Residual Gas Analyzer showed it to
be closer to 99.99%. The last backfill was brought up to
between 100 and 300 Torr as the operating pressure for
the arc synthesis. Initially, the actual pressure selected
did not seem to impact yield, although it became clear
later that there were other yield-limiting factors at work.
During the arc synthesis procedure, a kilowatt or
more of electrical energy is dissipated in the bell jar.
This heats the helium and raises its pressure. A
maximum of 300 Torr initial pressure was used so that
at the end of a run, which may only last for 30 seconds,
the pressure did not rise to the point of unsealing the
bell jar from the baseplate.
A significant improvement resulted from the use of
a linear motion feedthrough intended for vacuum
systems. Instead of the two carbon rods being rotated
the Bell Jar, Vol. 10, No. 3/4, Summer/Fall 2001
1
into each other horizontally, they were now pushed
linearly into each other vertically. This allowed much
more graphite rod length to be consumed in a typical run
(1/2 inch total graphite rod consumption for the rotary
approach, versus over 3 inches for the linear approach).
Air leakage during the synthesis was now minimal, as
the starting and final pressures were the same, and the
mass lost by the consumption of the graphite rods
balanced with the total mass of the end products.
However, new problems arose with the longer
duration of a run. Heating and pressure rise required the
process to be broken into short arc synthesis runs
followed by a cool-down of several minutes, after which
the arc synthesis would resume. While the yields rose to
about 3.5 %, the frequent rapid thermal cycling resulted
in the failure of a bell jar, as shown in Figure 1.
Another problem resulted from both graphite rods
being supported by cantilevered copper clamps. The
linear feedthrough also permitted rotary motion, so both
clamps had to be aligned along a common axis before
they could be pushed into each other. This was easy at
the start of a run, when the bell jar was clean and visual
alignment was possible. But as the interior of the bell jar
became coated with soot, is would be easy to misalign
the two rods so that they missed each other and
contacted the other rods’ copper clamp. This resulted in
a lot of melted copper.
The use of a linear motion feedthrough significantly
improved yields. This also generated much more soot so
that the total production mass of fullerene per run
increased dramatically. However, the increased maintenance in frequently making new copper clamps, and loss
of a bell jar, made it a mixed blessing. Reducing the
duration of the arc synthesis segment and allowing more
cooling time between segments together reduced
thermal stress cycles and the magnitude of the pressure
Figure 1 - Fractured Bell Jar
swings. This also improved yield, and started to suggest
an optimum pressure range of around 150 Torr
III. MORE IMPROVEMENTS
Elimination of the cantilevered copper clamp on the
linear feedthrough became an obvious improvement.
This graphite rod was now mounted coaxial with the
linear feedthrough rod, so only linear motion was
needed. Sometimes, if the two graphite rods were
pushed into each other too forcefully, they would spot
weld. A slight rotation of the linear feedthrough would
easily break this weld, and the procedure could
continue. The mounting of the lower graphite rod is
shown in the center of Figure 2. To the left is an electrically insulated copper feedthrough (¼ inch diameter)
used to mount the upper graphite electrode.
A collar is placed on the linear feedthrough shaft
outside the bell jar. It is locked in place to act as a stop
so that when most of the graphite rods are consumed by
the arc, you cannot accidentally go too far and touch the
copper clamps together, again, producing a lot of melted
copper.
A cooling coil was then added to remove excess
heat and stabilize the pressure swings. This consisted of
a section of copper tubing with 3” id and 4” long,
outside of which was wound with four turns of ¼ inch
copper tubing, soldered in place. Swagelock bulkhead
connectors were used to connect the cooling coil to the
baseplate.
Normally, tap water was used as a coolant, flowing
at approximately ½ gallon per minute. Maximum
pressure variations were now of the order of only a few
Torr. In one experiment, liquid nitrogen was used as a
coolant. Curiously, it had no impact on yield. Perhaps
the temperature differential from arc plasma temperatures (a few thousand Kelvins) to a water cooled surface
(at about 285 K) versus to a LN2 cooled surface (77 K)
is not too different. Figure 3 shows the upper graphite
electrode and its holder in place, as well as the cooling
coil.
A refrigeration service vacuum pump, with a base
pressure of 25 milliTorr, did not significantly increase
yields when used for the pumpdown-backfill preparation sequence, but using 5N9 helium (99.999%) did
show a slight improvement in yield. A prepped system
ready to initiate the arc is shown in Figure 4, with the
safety shield removed.
At the end of a run, the system was allowed to cool
to room temperature, and then vented to atmospheric
pressure. When removing the bell jar, a vent hose was
used to collect any soot that may have been dislodged.
Soot can be seen covering just about everything in
Figure 5. The silvery material around the ends of the
rods is sometimes called “popcorn” and is rich in carbon
the Bell Jar, Vol. 10, No. 3/4, Summer/Fall 2001
2
Figure 2 - Linear motion
feedthrough (center) for
lower electrode. Copper
feedthrough for the upper
electrode at left.
nanotubes. Additional fragments of popcorn are usually
scattered around the baseplate at the end of a run.
IV. COLLECTING SOOT
The soot is gently swept into a large beaker, while
trying to minimize the generation of any airborne particles. The popcorn is placed in a separate container as it
contains little or no extractable fullerenes. Disassembling the system makes it easier to collect the soot as
well as facilitate loading new graphite rods for the next
run. Be sure to blow-through any cooling water that may
remain in the cooling coils before loosening the Swagelok connectors. Otherwise, it will flood the baseplate
when removing the cooling coil.
I tried various collection innovations, such as a tube
filled with packed glass wool, connected to an aspirator.
Soot loosened with a small acid brush would be swept
into this tube, which acted like a vacuum cleaner. The
glass wool would then be extracted directly with
solvents to remove the fullerenes from the soot trapped
in it. Ultimately, it proved easier just to sweep the soot
into a beaker. It’s a good idea to both wear a dust mask,
and provide local ventilation to remove any airborne
soot. The fullerenes should be extracted from the soot as
soon as possible.
V. ENHANCED EXTRACTION TECHNIQUES
Previously, the soot was simply mixed with solvent and
then filtered. This process was repeated a number of
times until the solvent no longer showed the characteristic fullerene red-wine coloring. This was tedious at best.
Figure 3 - Upper graphite
rod and cooling coil in
place.
the Bell Jar, Vol. 10, No. 3/4, Summer/Fall 2001
3
Figure 4 Assembled
reactor without the safety
shield.
A vastly improved approach is to use a Soxhlet
Extractor. It operates in a fashion similar to the old
percolator coffee makers, with freshly distilled solvent
passing through the soot. The basic setup has a boiling
flask, containing solvent, fitted with the extractor tube.
A porous “thimble” is filled with soot and then placed
into the extractor tube. A vertical condenser is then
fitted on top of the extractor. In operation, boiling
solvent vapors from the boiling flask rise up through the
extractor where they are condensed by the vertical
condenser. This freshly distilled solvent then falls back
into the soot-loaded thimble in the extractor tube,
dissolving any fullerenes. This solution eventually
siphons into the boiling flask, where the process repeats.
Over time, the solution in the boiling flask will darken
as it accumulates more and more dissolved fullerenes.
Many researchers in the field let the extraction proceed
for 24 hours, but I’ve found that 99 percent of the
extractable fullerenes have been removed after about 4
hours. The volume of this solution is reduced by distillation, and then evaporated to recover the fullerenes.
Some precautions should be observed. Never use an
open flame to heat the boiling flask; an electrical immersion heater in an oil bath is ideal. Use plenty of ventilation as the solvents are flammable and toxic. Never use
benzene as a solvent. Some early research papers
specify benzene, but we now know that it is very toxic.
Toluene and xylene are alternatives that are much less
Figure 5 - Reactor interior
after a run showing soot
deposits.
the Bell Jar, Vol. 10, No. 3/4, Summer/Fall 2001
4
Figure 6 - Various cooling coils. At the
left is the original 3” id coil.
toxic. Distill away as much of the collected solution at
the end of an extraction as possible. This solvent can
then be used again. You can find inexpensive Soxhlet
Extractors and associated glassware on eBay, but get
new and unused ones. The siphon tube on the extractor
is difficult to impossible to clean effectively.
hexagons. This provides the curvature that eventually
closes the Buckyball, and without which, planar graphite hexagons would simply form.
Given the success of the cooling coil, which consistently boosted yields to about 5.7 percent, a series of
experiments was run with successively smaller and
smaller cooling coils. The idea was to enhance the
quenching process, and perhaps boost yields. These
cooling coils are shown in Figure 6.
It is said that, experimentally, for every thing you
find that works, you find ten that don’t. This is the case
with the smaller diameter cooling coils, where the yield
drops off with smaller coils, and is effectively zero with
the last two (¾” and ½” id respectively).
Apparently, the quenching is so rapid that pentagons cannot form, and the interior of these cooling coils
is coated with a graphite cylinder, as seen in Figure 7.
There are also curious white crystallites that form
within these graphite cylinders. Some research suggests
that these are yet another allotrope of carbon, sometimes
called “carbolites” that are transparent, yet not diamond,
that form under extremely high temperature gradients.
Their physical and electrical properties are still largely
unknown.
VI. HOW TO MAKE FEWER BUCKYBALLS
GENERAL REFERENCES
The basic formation mechanism for fullerenes involves
vaporization of carbon by the arc, followed by rapid
quenching. It is important to then remove the newly
formed fullerenes from the arc environment, otherwise
they could just as easily be destroyed by it. The key is
the formation of pentagons within a group of carbon
Kroto et al, eds., The Fullerines, Pergamon Press, 1993.
Hammond and Kuck, Fullerines, ACS Symposium
Seres 481, American Chemical Society, Washington,
DC, 1992.
The following are specific to carbolites:
S. Tanuma and A. Palinchenko, Synthesis of low density
carbon crystal carbolite, J. Materials Res., 10(5), May
1995.
Y. Gogotsi, et al., “Graphite Polyhedral Crystals,”
Science, Vol 290, 13 Oct 2000.
V. Babina, et al., “Dynamic synthesis of crystalline
carbyne from graphite and amorphous carbon,” High
Temperature, 37(4), 1999.
Figure 7 - Recondensed graphite
from the interior of smaller cooling
coils.
the Bell Jar, Vol. 10, No. 3/4, Summer/Fall 2001
5
A Happenstance High Voltage Power Supply (and
having fun with DC/AC Inverters)
Steve Hansen
I. INTRODUCTION
A few years ago (Winter of 2000 I believe) I picked up
a number of high voltage multiplier assemblies and
some related parts from a local surplus dealer
(Electronic Surplus Services of Manchester, NH). ESS
was in the process of moving out of their delightful but
dark and dingy 19th century factory building for newer
(smaller, pricier) digs and they were in a mood to let
things go for cheap.
These power supplies came in two major pieces: the
stack of multiplier disks coupled with the hv step up
transformer (20 kV, center tapped) and the rack mount 6
kW 220 volt/3-phase inverter. The inverter puts out
about 800 volts, at 20 kHz. This is stepped up by a
ferrite core transformer in the cascade base to provide
the input to the Cockcroft-Walton full wave multiplier.
Each stage of the multiplier is in the form of a
potted disk and the disks are, in turn, conneted to each
other with a clever set of studs and spacers. All of the
disks are the same and they can be stacked up to 10 high
(200 kV). The cascades that I picked up ranged from 4
to 6 disks and the rated output current was in the range
of 100 mA. Quite lethal. A variety of names were on the
equipment including Hivolt and Wallis.. A bit of
investigating revealed that the company was UK-based
had been through a number of acquisitions, hence the
name changes.
I was able to get quite a bit of information on the
units via the manufacturer’s US sales office. The current
name is HiTek Power and they can be found on the web
at http://hitekp.routo.net . A major application for these
particular supplies is in ion implanters and the units that
Figure 2 - The author’s conversion with six-section
120 kV negative cascade, dual 10 kV rms transformers, water resistor and 1 Gigohm divider resistor.
I got were from Eaton’s semiconductor equipment
division (now Axcelis). A complete 60 kV system is
shown in Figure 1.
Having no access to 3-phase power and being
somewhat fearful of 100 mA I really couldn’t use or
justify the inverter portion of the unit. Just to see if the
cascades were functional, I tested them with an
iron-core neon sign transformer (15 kV peak, center
tapped). Each one that I tested was good.
From each cascade assembly I was able to harvest
the following useful components: the ferrite core
transformer (more about this later), the disks (all
positive output with the exception of one six-disk
negative stack), 1 G-ohm resistor for the output
measurement and control circuit, plus a bunch of
specialized hardware including sparkgaps, IGBTs, etc.
II. FIRST VERSION, 60 Hz
Figure 1 - HiTek Power OL Series Power Supply
(photo courtesy of Hitek Power)
Since neon transformers are the leakage type and the
output droops at higher power levels, I dug through my
the Bell Jar, Vol. 10, No. 3/4, Summer/Fall 2001
6
Copper Sulphate/Water Resistor
N
1 Gigohm
1
RD
Autotransformer
110 Vac
Mains
Figure 3 - Adapted Cockcroft-Walton High Voltage Power Supply. The disks are rated for 20 kV peak input.
The AMP transformers are 10 kV rms each so care has to be taken to avoid overstressing the multiplier
components. The water resistor is about 1 Mohm. Divider resistor RD is sized for the input resistance of the meter
used and desired voltage scaling.
junk box to find something more suitable for driving the
cascades directly from the 60 Hz mains. In a dark corner
of my basement I found two matched AMP Corp. 10 kV
rms units. I have no idea what they were originally made
for or the current specs but they have potted windings
and C cores of fairly fine laminate.
The obvious disadvantage of this arrangement is
that the efficiency of a low frequency CW multiplier is
fairly low and any substantial current draw will cause
the output voltage to drop substantially. This, of course,
is the reason that multipliers are generally driven by
high frequency power supplies. More stages and smaller
capacitors worsen the performance.
All of that being said, a picture of the resulting
power supply is shown in Figure 2. The unit was built
on an old printer stand. The cascade shown is a 6-disk
negative output stack (120 kV at no load). Under the
shelf are the two transformers. To the left of the stack
are (rear) a copper sulphate water resistor and (front) a
voltage divider made from the salvaged 1 G-ohm
resistor. Test leads from the divider go to a DVM which
is mounted remote to the stand. To vary the output I
have a 10 amp autotransformer (not shown). The
schematic for the supply is shown in Figure 3.
the Bell Jar, Vol. 10, No. 3/4, Summer/Fall 2001
7
III. UPPING THE INPUT FREQUENCY
As noted above, the efficiency of a voltage multiplier is
related to the values of the capacitors, the input
frequency and the number of stages. For sine-wave
excitation:
3
2
Vo = 2nv − i 8n + 6n − 2n
12fC
where Vo is the output voltage, n is the number of
stages, i is the load current, f is the frequency and C is
the value of each capacitor (equal capacitances are
assumed).
Since the output is strongly influenced by the
number of stages, the simplest stopgap measure is to
only use the number of stages required to get the desired
output voltage. Thus, for 40 kV, only two disks are
used. However, for any load handling capability at high
voltages, the only option is to increase the drive
frequency.
I did a bit of searching and found out that some
experimenters were successful in adapting common 12
Vdc to 120 Vac power inverters to run surplus 400 Hz
equipment. Home Depot carries the Vector brand under
their Husky Tool line so I picked up the cheapest one I
could find (175 watts for about $20) to tinker with.
The block diagram for the inverter is shown in
Figure 4. The 12 Vdc input is first converted to a high
frequency square wave which I measured to be about 50
kHz. A pair of transformers steps this up to about 180
V. The next stage is a full wave rectifier. The output
stage is another inverter which converts the rectified dc
to an approximate sine wave of 120 volts and 60 Hz.
The output stage is run by a Fairchild KA7500B
SMPS controller IC. The frequency is determined by
the capacitor (CT) on pin 5 and the resistor (RT) on pin 6.
Each of these components is tied to ground, pin 7. This
12V
dc
Inverter
(50 kHz)
Vector inverter has a fixed capacitor (0.047 µF) and a
resistor (51k) in series with a trimmer pot (30k).
I made some chenges in the values of these
components and determined that the output frequency of
the inverter could be adjusted up to about 2 kHz before
the output dropped off significantly. The test set up
consisted of a simple lightbulb load, DVM to measure
voltage and a PC oscilloscope to monitor frequency.
The best news was that the AMP transformers
seemed to take multi-hundred Hz line frequencies in
stride.
Next I acquired a 750 watt inverter and a surplus
5A 400 Hz autotransformer. The latter came from Fair
Radio Sales in Lima, OH. The new inverter had the
same SMPT controller IC and general architecture as the
lower power unit. Figure 5 shows the circuit board and
components of this inverter.
I removed the timing capacitor, the fixed timing
resistor and its associated trim pot. New values were
0.047 µF and 470 ohm respectively for the fixed
components. I ran a two conductor wire out of the case
to an externally mounted 100k pot. This arrangement
permits operation of the inverter over a range of 150 Hz
to over 2 kHz.
Compared with 60 Hz operation, the results with
400-600 Hz operation are spectacular. The only
downside is that I run the thing off of my trolling motor
battery so I have to keep it charged. However, it gives
the battery something to do when it’s not in the boat. A
picture of the inverter mounted on the power supply
stand is shown in Figure 6.
IV. MORE FUN WITH INVERTERS
Moving away from the voltage multiplier setup I
proceeded to investigate the possibilities of using these
inverters to drive a high voltage ferrite core transformer
at the 50 kHz input stage frequency. With an output of a
Full Wave
Rectifier
Inverter
(60 Hz)
Step-up to
180 volts
Figure 4 - Block Diagram of the Vector (Husky Tool) Inverter.
the Bell Jar, Vol. 10, No. 3/4, Summer/Fall 2001
8
120V
ac
Figure 5 - 750 Watt Vector (Husky Tool) Inverter. The top photo shows the inverter with the case removed. The
SMPS controller chip is at the upper left. The bottom photo shows the same inverter with the heatsink removed. The
low voltage components are at the bottom of the board. Ferrite core step-up transformers are across the center and
the line voltage components are across the top of the board.
Figure 6 - Power Supply with Vector 750 Watt
Inverter. The 400 Hz autotransformer is in the box on
the floor. In operation this would be remote from the
stand. The frequency adjustment pot is above and to
the left of the inverter.
few kV at several hundred watts I figured this could
make a useful supply for my small plasma reactor.
For the subsequent step-up I took one of the large
ferrite core transformers from a Hivolt cascade. These
look like overgrown TV flybacks. The secondary is a
double winding of 780 turns each with the center point
grounded. The primary is 22 turns of very heavy Litz
wire that is wound inside the secondary. The core
section is 1-¼ inch square and the overall core is about
7-½ inches on a side.
I got another inverter (this one was 400 watts) and
connected the output from the step-up transformers to
the outlet socket, thereby bypassing the rectifier and
output stages. With this simple change I had a simple
and cheap 180 volt, 50 kHz power supply. There is one
downside in that in making this modification I also
removed the overtemp circuit.
I pulled out the heavy primary winding and made a
new winding consisting of 75 turns of #14 stranded
hookup wire. To be safe I put a 4 amp fuse in series
with the primary. A block diagram is shown in Figure 7
and a photograph of the completed transformer is shown
in Figure 8.
the Bell Jar, Vol. 10, No. 3/4, Summer/Fall 2001
9
High Voltage/
High Frequency
Output
Front end of Vector
Inverter
12V
dc
Inverter
(50 kHz)
180 volts
step up
Figure 7 - Block Diagram of High Frequency/High Voltage Power Supply. In the author’s version the primary
was wound concentric with the secondary winding. Placing the winding as shown is entirely satisfactory.
The Hivolt/HiTek Power transformers are definitely
overkill for any use I have - anyone wanting to replicate
this could use a less massive ferrite core.
Driven by the 400 watt inverter, the output of this
transformer provides a very hot arc. The open circuit
voltage should be in the vicinity of 3500 volts but I did
not attempt to measure it. In continuous operation the
power supply did not seem to be taxed and the fuse
stayed intact. For more power & voltage I believe I
could safely remove a few primary windings.
To try out this supply, I connected it directly to the
internal electrodes of my small oxygen plasma etcher. I
have had some success using electronic neon sign
transformers (basically the same thing as this, just much
lower current output). The result was a very intense
plasma. I also tried capacitively coupling the supply to
the plasma and that also worked reasonably well.
V. NEXT STEPS
With regard to the Cockcroft-Walton multiplier the next
logical step would be to replace the AMP transformers
with ferrite core transformers wound in the correct ratio
to properly drive the cascade using the 180 volt high
frequency output of an inverter. This would provide
quite stunning performance.
With regard to the plasma reactor high frequency
supply. I plan to investigate the use of a larger inverter
(maybe 1000 watts) and also try some experiments with
increasing the frequency beyond 50 kHz.
VI. ROLLING YOUR OWN
While I have to consider myself fortunate to have
acquired (at an excellent price) the surplus Hivolt
multipliers and related components, much of what is
presented in this article can be accomplished with
discrete components, readily available ferrite core stock,
etc. The great find for me was discovering the ease of
modification and utility of inexpensive power inverters.
For those who might be on the lookout for the
cascade multipliers, ESS does maintain an eBay store
(esssurplus) and the Hivolt products do show up from
time to time.
Figure 8 - Modified Hivolt Transformer on
Wood Base. The primary is wound
concentric with the secondary. Fuse holder is
behind the core but is not connected in this
photo. For a size reference, the oak base is
10 inches long.
the Bell Jar, Vol. 10, No. 3/4, Summer/Fall 2001
10
Microwave Oven Plasma Reactor
Hideaki Page
I. MOTIVATIONS
I’m interested in doing some sputtering of various
semiconductor materials. Constructing a DC sputtering
system seems relatively straight forward. However RF
systems are needed for semiconductors. Generating an
RF plasma using a microwave oven seemed the simplest
approach to accomplish this. Also diamond films can be
grown under modest vacuum conditions using a
methane/hydrogen plasma. These are long term goals.
At present I am having fun generating the plasma.
discharge is typical for air. The first few tries didn’t
work. I think this was due to leaks on the pipe fittings.
Once these were thoroughly reworked with the jubilee
clips and PTFE tape I suddenly got results. I was very
surprised that the crude seal work as well as it did.
The system worked until the PVC seal failed
(burned) after a few runs of 10-20s each. The jam jar
got very hot but didn’t crack. Sometimes the oven’s
safety trip kicked in and I had to wait until everything
cooled down. However these initial results were very
promising.
II. FIRST EXPERIMENTS
III. SECOND SYSTEM
To test the feasibility of the generation of plasmas using
a microwave oven I constructed a quick and dirty
chamber. I removed the turntable in the oven and fitted
the vacuum outlet through the hole for the motor shaft.
The fitting was a 10mm diameter threaded pipe fitting
pirated from somewhere. I used common PVC piping to
the rotary vacuum pump. All pipe fittings were fixed
with jubilee clips and PTFE tape. I fabricated a simple
gasket from a sheet of ~1mm thick PVC sheet. I had to
press down on the jam jar and open the valve to the
pump to get the system to seal. However, once sealed I
couldn’t move the jar. After this I simply closed the
door of the oven and turned it on full power at first
(600W in my case). There is a sudden eruption of colour
as the plasma strikes. I believe the colour of the
In order to have a greater working volume and to
preserve the seal from the caustic effects of the plasma, I
opted to push the bell jar into the microwave oven
chamber though a hole cut in the bottom. I planned to
use a metal grill placed in the jar to confine the microwave energy in the top and hence separate the plasma
from the delicate seal. I chanced upon a large cylindrical
glass container at a boot fair (“Flea Market” to us
Yanks - Ed.), the standard source of much of my equipment, vacuum pump, microwave oven etc. Much to my
surprise it didn’t shatter under pump down. For a seal
I’ve used some rubber pipe (used for aerating fish
tanks). I split the pipe up its length and then work it
round the lip of the jar. The two ends are fixed in place
with super glue. The jar is simply placed on a metal
Figure 1 - Initial Microwave Plasma Generator
the Bell Jar, Vol. 10, No. 3/4, Summer/Fall 2001
11
base with a little vacuum grease. I’ve made a number of
vacuum chambers with Pyrex salad bowls using these
rubber seals. I’ve used a circular steel base from an old
lamp stand. I have problems trying to find thick metal
bases for my bell jars. The steel based does bow under
pump down but it does seem to effect the seal. I’ve also
tried aluminium cooking pots as they seem to have a
relatively thick based. However I’ve even managed to
deform one of these on pump down. Maybe I could get
better results with better materials but I’m working with
what I have for the moment.
Figure 2 shows some bell jars made from common
kitchen glass ware. The faint green tinge on the rim of
each jar is the seal made from a split rubber pipe. The
centre jar has a brass bolt electrode fitted though a hole
ground in the top. Figure 3 is a detail of the baseplate
shown at the center of Figure 2.
I cut a rough hole in the bottom of the microwave
(see Figure 4). I was very worried that the vibrations
from the cutting and filing of the hole could damage the
magnetron. However I seem to be lucky this time. I left
the whole rough cut to avoid unnecessary filing.
I made a cylindrical guard using a tin and piece of
Figure 3 - Base plate detail.
over the jar. When I turned the oven on the plasma
struck immediately. I could drop the power down to
almost half and maintain the plasma. The plasma did
penetrate the lower half of the jar but the small circular
grill seemed to be effective in stopping the plasma
attacking the seal. The jar gets very hot and I’m worried
about the lifetime of the system. I noticed that the
discharge is not uniform. There were hot spots. These
Figure 2 - Bell jars made from common
kitchen glassware.
grill to cover the lower half of the jar (see Figure 5).
This way I could monitor the penetration of the plasma
in the lower section without being cooked at the same
time. The guard was flush with the bottom of the oven
and the steel base. I sure that leakage of the ~12cm
wavelength radiation though the small gaps left over
was minimal. The jar in question has a smaller diameter
at the lip than in the body. This put a stop to my initial
idea of using a grill in limit the penetration of the
plasma. I compromised by cutting a small circle of grill
that would sit just inside the lip to the jar. First I
pumped down the jar. Then I placed the cylindrical
guard in place and finally I dropped the oven into place
Figure 4 - Oven with hole cut into
bottom of cavity.
may arise from imperfections on the inner surface of the
jar. There is also a non-uniform field distribution in the
oven.
IV. FUTURE PLANS
I would like to work on a system to seed the discharge
in the centre of the jar, maybe using a strategically
placed metal point or an electrode connected to a high
voltage unit. With this in place I would like to start
some preliminary experiments on etching various
materials with the plasma, even starting with air and
the Bell Jar, Vol. 10, No. 3/4, Summer/Fall 2001
12
Figure 5 - Jar, baseplate and guard, separately (left), together (right).
working my way though different gases, argon in
particular.
The weakness of the system is the glass jar. I’m not
sure how long it will last. I sure that a lot of energy is
wasted in heating up the glass rather than the plasma.
Finally, I’m considering build a metal vacuum chamber
that will double as a microwave resonant cavity. This
should improve the efficiency of the system.
Editor’s comments: There is a commercial adaptation of
a standard household microwave oven that is offered
as a low cost plasma cleaner & asher. This is the
“Plasma-Preen.” It is manufactured and sold by
Plasmatic Systems, Inc. of North Brunswick, NJ. The
developer of the product and the president of Plasmatic
Systems is Aaron Ribner. Unfortunately, the company
does not have a web site but the well-detailed patent
(4,804,431) can be viewed on the Bell Jar’s patent page.
Here also will be found a link to the manual for this
system.
the Bell Jar, Vol. 10, No. 3/4, Summer/Fall 2001
13
Bubbles and Gel Candles
A project inspired by gel candle maker Deb Puerini
Steve Hansen
I. INTRODUCTION
As I’ve mentioned before, I regularly receive a variety
of questions and requests from people who hear about
this publication. The ones from the technical community
are generally well reasoned. Some are obnoxious (“I’m
a student at XYZ College and have a paper due
tomorrow on vacuum gauges, please send me all the
information you have...”). Then there are the ones from
confused English majors who confuse vacuum bell jars
with something written by Sylvia Plath and then accuse
me of plagiarism. And then there was the “farmer” who
wanted to know how to freeze dry 2 lbs. of dirt (on
second thought, maybe he was trying to preserve
anthrax spores?).
A while ago I got an email message from Deb
Puerini, a dedicated gel candle maker who lives in
Rhode Island. She wrote:
“I just stumbled upon your site from a Google
search. I am a gel candle maker and recently heard about
making gel candles bubble-free by (and I quote): ‘...that
her Dad, an engineer, had built her some type of
contraption that has a vacuum pump or something to
cause the bubbles be under a vacuum pressure, and
when they were poured they had no bubbles. I think he
Figure 1 - Gel Candle (Fishbowl). Photo courtesy of
Deb Puerini, used with permission.
should market the contraption instead of selling the
candles.’
“Do you have a clue as to what this “contraption”
might be? I remember in high school we had a huge
glass jar (like the 5 gal water bottles) and the teacher put
marsmallows in it and closed the top. It had a vacuum
pump or something and the marshmallows got huge. Do
you know what I’m talking about? Well if you could let
me know if a thing like that could be made, I would be
ever grateful if you could build such a thing to help us
poor gel candlemakers who are sick of bubbles in
certain candles!”
From this it was obvious that she was describing a
vacuum deairing process but what the heck is a gel
candle? As I quickly found out, gel candles, rather than
using conventional paraffin wax, use a clear, proprietary
mix of mineral oil and a polymer to which are added
dyes and scents.
II. GEL CANDLE BASICS
After a bit of correspondence with Deb I learned that
these candles are made by melting the gel, mixing in the
various additives and then pouring the gel into a
container with, at the minimum, a wick. Because of the
number of degrees of freedom that one has with this
clear gel, the candle maker will usually add a variety of
other items. The photo of Figure 1 shows an ornate gel
candle that has been made to look like a fish bowl,
complete with glass fish. Since the candle maker inserts
objects into the gel, the clarity of the gel is very
important in many pieces and bubbles are something
that the candle maker tries to avoid. The traditional way
of doing this is to keep the gel hot for an extended
period, permitting at least some of the bubbles to rise to
the surface and break. Small bubbles and bubbles that
have adhered to the immersed objects are the hardest to
remove.
One of the largest manufacturers of this gel material
is Pennzoil’s Penreco Division (4401 Park Ave.,
Dickenson, TX 77539). Their gel candle product is
called Versagel™ C. The product bulletin describes the
generic candle making process as follows: 1) melting
the raw gel at a temperature of about 100 °C and mixing
in the additives, 2) pouring at about 90 °C and 3) letting
the candle set in an oven at about 65 °C to remove
bubbles. Hope (accompanied by a bit of cursing) is an
important part of the process.
the Bell Jar, Vol. 10, No. 3/4, Summer/Fall 2001
14
III. A SIMPLE PROCESS
I figured that while deairing is a common and simple
process (put the material under vacuum, pump down to
enlarge, dislodge and burst the bubbles, and then let
back up to atmosphere) there were some additional
challenges here in terms of the gel nature of the material
and having to complete the process before everything
turns gooey again. So, I asked Deb for some sample
candles with bubbles. These arrived within a few days.
My first attempt consisted of remelting the candles
in the kitchen oven (boy did our house smell good),
quickly transferring the candle to an improvised vacuum
chamber and then pumping with a small rotary pump.
Gauging was a simple Bourdon dial gauge, 0-30 inches
Hg, atmosphere referenced.
Disaster. There was obviously some volatile
component in the gel mix. The material bubbled out of
control and splattered all over the vessel. (Deb informed
me that bits of splattered gel are called gel boogers and
that quite accurately describes the texture of this stuff.)
On the plus side, the material (about half of the original
amount) that remained in the candle container was
bubble free.
The next attempt was more controlled. I added a
pressure control feature and dropped the pressure in
quick stages to about 20 inches Hg (gage reading) where
the bubbles got noticably large and mobile, and then to
28 where they moved upward quickly and broke upon
reaching the surface. In the range of 29 inches the
material looked like some volatile components were
coming out. So, 28 inHg looked like a good lower
pressure limit.
The final apparatus is depicted in Figure 2. The bell
jar was an old pyrex jar that I got from Fisher Scientific
many years ago. Inside dimensions are about 5.5”
diameter and 8” tall. To keep any boogers from getting
into the plumbing I put a PVC pipe cap with a small
hole drilled in the side over the outlet port as a
platform/baffle. The pipe nipple attached to the
mounting flange is plugged with epoxy. Pressure is
controlled by pinching the neoprene tubing with the
pinchclamp. The pump, not shown, is a small Robinair
1.2 cfm pump, model 15200.
Figuring I’d done all I could, I packed everything
up and sent it to Deb, the gel candle expert.
IV. FINAL RESULTS
Realizing that I was dealing with someone who’d never
operated a vacuum pump, I waited in suspense. Two
days after receiving the system Deb reported that she’d
not only set it up, she had tortured a marshmallow chick,
thereby replicating the classic vacuum experiment. The
next day she reported results:
“Well I think I’ve got the system down......the trick
is to color and scent the gel, stir it up well, then stick it
in the vacuum at 28 inches for at least 1 minute (still
very hot) and then pour into the designated container.
The proof of the pudding is waiting overnight to see
what has happened during the cooling off period....well
I must say this has *gotta* be the answer!!! I poured one
Figure 2 - Prototype Gel Candle
Deairing Apparatus
the Bell Jar, Vol. 10, No. 3/4, Summer/Fall 2001
15
last night with epsom salt at the base (for snow) and put
a glass penguin in...this morning there is NOT ONE
BUBBLE to be seen!!! Now the epsom salt usually
presents a big bubbling problem, but wow!!! clear clear
clear!!! I am sooooo excited about this!!! I poured
another one just a few minutes ago with glass flowers
and glass marbles in the bottom and even put glitter
in....wow!
“I have ‘run the controls’ in all ways and methods,
no matter how high the temperature of the gel is you
will get some bubbles then you have to reheat again to
get the bubbles out. Even then it always varies which is
the most aggravating part. But with the vacuum method,
it gets out so many bubbles as long as I have colored
and scented the gel to my satisfaction, the bubbles will
not come back. I’m sure if I stirred again after
vacuuming they would come back. I did the most
important test, silk flowers with gel, and put the
container in the vacuum and it’s really something.
Bubbled like all hell but then is still clear as anything!”
candles. (Now, can this gel stuff be used to pot high
voltage electrical assemblies?)
For anyone that is interested in Deb’s excellent
work, please visit her extensive Web photograph album
at http://www.netSnapShot.com/pcw/B?KEY=41&
ACCOUNT=684. She can also be reached by email at
[email protected].
FURTHER READING
An excellent resource for gel candle making is on the
Web at:
http://www.howtomakegelcandles.com/index.asp
POSTSCRIPT (Feb 2006)
Deb and I turned this gelcandle debubbing process into
a small business. Figure 3 shows one of our current
offerings. Full details on this aspect of gelcandle making
can be found at:
http://www.belljar.net/gelcandles/main.htm
V. CONCLUSION
I have to say this was a fun project since I not only got
someone introduced to using vacuum to practical ends
but also I learned about the wonderful technology of gel
Figure 3 - Gel Candle Deairing Apparatus with Metal Chamber
the Bell Jar, Vol. 10, No. 3/4, Summer/Fall 2001
16
Cartesian Divers - Part 2
From Cartesian Divers to PID Pressure Control
Steve Hansen
I. INTRODUCTION
In the previous issue we looked at Cartesian divers and
how they evolved into pressure measurement devices. In
this final installment we will see how the Cartesian diver
can be used as a simple pressure control device. The
article will conclude with a look at more contemporary
methods of controlling pressure within vacuum systems.
II. THE CARTESIAN DIVER AS A PRESSURE
CONTROLLER
In Part 1 we concluded with Gilmont’s Cartesian diver
manometer as described in his U.S. patent 3,261,207.
This patent alse describes a pressure controller based on
the Cartesian diver principle. The relevant illustrations
are contained in Figure 1 on the next page. The text that
follows is adapted from the description contained in the
patent and is specific to the device in the right-most
illustration.
Figure 1 depicts the invention as adapted for
functioning as a control device (“manostat”) to regulate
the vacuum applied to a system.
The housing 2' is similar to that of the pressure
gauge version except that the two outlet openings 6a and
6b are provided at the upper end of the tube 4' with the
opening connected to a nozzle 60 which extends
downward into the upper section of the tube 4',
terminating in valve orifice 62. The float 16' is
comprised of a thin-walled body 18' having an internal
diameter only slightly less than the tube 4'. The lower
end of the body 19' is constricted to form an opening
34' which has a small cross-sectional area as compared
with the main body of the tube 18'.
The upper end of the body 18' has a soft elastomeric
cap 24' that is in line with the opening of the nozzle 62.
The device is connected to the system being controlled
via port 6a and port 6b is connected to the vacuum
pump. As the system is evacuated the pressure in the
upper section of the chamber 4' is reduced and the float
16' rises. When the vacuum reaches a predetermined
value the float will rise and the cap will contact the
nozzle, closing the opening 62 and cutting off the
vacuum pump from the system being controlled. When
the pressure in the system rises, the float will fall
opening the nozzle and the process will repeat as
necessary to maintain a constant pressure in the system.
Operation is enhanced by making the system more
dynamic by introducing a small bleed in the system.
This improves the sensitivity of the control. The control
pressure is determined primarily by the amount of gas
that is present in the float 18'. Fine adjustment is
achieved by means of the position of the piston 36'
which is set by knob 44'. Moving the piston upward will
raise the pressure set point, lowering will reduce the
pressure.
Figure 2 shows a contemporary version of a
Cartesian diver vacuum controller. This one is made by
Ace Glass Corporation of Vineland, NJ.
For the remainder of this article we will skip to the
present and look at automated systems for active closed
loop pressure control of vacuum systems. A prerequisite
for full understanding of the following is the article
“Leaks, the Good, the Bad and the Ugly” which
appeared in Volume 7, No 1. This article will also be in
the second compendium.
III. MANUAL PRESSURE CONTROL
Consider the vacuum system shown in Figure 3 on page
18. Below. When the throttle valve (a variable
conductance) is open and the leak valve (another
variable conductance) is closed, the chamber will settle
at a base pressure determined by the pump’s
throughput* and the sum of the sources of gases within
the system. These would be from real and virtual leaks,
permeation and outgassing and represent the overall gas
load presented to the pump.
If we want the chamber to reach a specific pressure
then we would open the leak valve by some amount,
perhaps just under the desired pressure. Then we could
close the throttle valve by some amount to get the
system to the desired pressure.
While this technique will achieve the result of
realizing a specific pressure in the chamber, there are a
number of deficiencies:
y As system conditions change it will be
necessary to continuously monitor and
adjust the pressure control elements.
y The process requirements may require
multiple gases as would be the case
for a reactive process. Simple
metering (conductance) valves cannot
perform this task.
y It may be necessary to independently
control the flow of each of the
incoming gases while also controlling
pressure.
the Bell Jar, Vol. 10, No. 3/4, Summer/Fall 2001
17
Figure 1 - Gilmont’s Cartesian Diver Pressure Controllers.
the Bell Jar, Vol. 10, No. 3/4, Summer/Fall 2001
18
Figure 2 - Ace Glass 8741 Vacuum Regulator. “Increased sensitivity
and versatility over other models, mercury requirement is reduced to
20-30cc. A control point within 1mm Hg can be fine-tuned by adjusting
the height of the pump-out tubulation. The Cartesian driver float drops
away from pump-out orifice on an increas- ing system pressure and
reseals it when the reference pressure set within large bulb is
reattained. Reference pressure is easily set. The spherical joint allows
the attitude of the orifice to be adjusted to accomodate a small
continuous leak without hunting of the float.” $430.12 in 2007.
IV. CLOSED LOOP CONTROL
In “Leaks: the Good, the Bad and the Ugly” we saw
how closed loop control is applied in a mass flow
controller with the control input being supplied by the
flow sensor with a solenoid proportioning valve as the
variable flow control element. The same approach can
be applied on a larger scale to a vacuum system. Figure
4 on the next page represents an extension to the
previous example with closed loop pressure control.
This particular configuration is referred to as upstream
pressure control. This is because we are driving a valve
that is upstream of the chamber.
Proportioning valves are an important element in
vacuum systems. Figure 5 depicts the general
configuration of a solenoid proportioning valve.
This type of valve uses the magnetic field
developed by a solenoid to move a magnetic armature
Vacuum Chamber
Pressure
Gauge
Leak
Valve
Throttle Valve
To Pump
Figure 4 -
Figure 3 - Manual Pressure Control Elements
the Bell Jar, Vol. 10, No. 3/4, Summer/Fall 2001
19
Gas
Supply
Pressure
Reading
LO
Vacuum Chamber
P
Deviation
Error
I
HI
D
Set Point Input
Pressure
Gauge
Gas
Supply
Proportioning
Valve
Figure 5 Throttle Valve
To Pump
Figure 4 - System with Upstream PID Pressure Control
that is within the valve. A flat spring centers the
armature and also provides a countering force to the
magnetic field. The usual arrangement is normally
closed - when no current is applied to the solenoid the
face of the armature rests on the orifice. This face may
have an elastomeric material to seal the valve or it may
be a metal-non sealing configuration. It should be noted
that control valves of this type are not meant to be
positive shut off devices. If a positive shutoff is
required, there should be a dedicated isolation valve
downstream of the control valve.
The action of the valve is as a variable conductance
with very high resolution. Proportioning valves are
designed to be used as part of a closed loop control
system with constant feedback. They are not designed as
“set and forget” valves as the armature position will
wander without constant correction.
The orifice is sized to the flow range required by
application, and manufacturers will offer a range of
flows and guidelines for selection. A typical offering
would be several ranges from 10 sccm to 10,000 sccm.
withthe flow rating based on the orifice size under
typical upstream and downstream pressure conditions
Solenoid
Armature
Control
Voltage
Spring
Figure 6 -
Orifice
Figure 5 - Solenoid Proportioning Valve
the Bell Jar, Vol. 10, No. 3/4, Summer/Fall 2001
20
with nitrogen gas. A detailed discussion of orifices is
contained in another previous article, “The Speed of
Sound, Shock Tubes and Potato Cannons.” This article
was in Volume 8, No. 2 and will also be included in the
Second Five Years compilation.
V. PID CONROL
PID stands for Proportional - Integral - Derivative.
Referring back to Figure 4, the box on the left hand side
is the pressure controller. This controller has two inputs.
The first is for the setpoint. This is the adjustment for
the desired system pressure. The second is the actual
pressure input from the vacuum system’s pressure
gauge. The application usually requires a capacitance
gauge due to the need for accuracy, response speed and
gas-type insensitivity.
These two signals feed into an error circuit. The
error circuit determines the difference between the two
inputs and then provides an output related to the error.
To the left of the error element is a deviation indicator
that provides the operator with a graphical
representation of the magnitude of the error and whether
the error is on the high side of the setpoint or below.
The error signal then progresses to the PID
circuitry. The PID elements function as follows:
Proportional: This element provides
a response that is instantaneous and is
a directly proportional to the amount
of error. It is also called gain. If the
proportional setting is too low, there
will only be a weak response to a
large error. Conversely a high
proportional setting will produce too
large a response to a small error with
the result that the system may become
unstable and oscillate.
Integral: This element provides an
additional signal that is directly
related to the length of time that an
error signal has existed. For example,
if the pressure almost reaches the
setpoint but there exists a persistent
error, the integral element will
integrate the error with time and
provide a correction.
Derivative: This element provides a
signal that is proportional to the rate
of change of the error signal. It slows
down the response as the system
approaches the setpoint. This element
is used to reduce the amount of
overshoot that may be produced by
the other elements but will also slow
down the overall time for the system
to reach the setpoint.
As a thought experiment, think about your actions when
you step into a small shower stall and turn the water on
after entering. You become part of a closed loop control
system and unconsciously are using each of the
elements described above. Depending upon the
temperature of the water, your proportional element may
be set very high.
Some representative response curves are shown in
Figure 6. “A” represents the ideal response to the
setpoint change. The response in “B” is slow with no
C
A
D
B
E
Time
Figure 6 - System Response to Various PID Controller Settings.
the Bell Jar, Vol. 10, No. 3/4, Summer/Fall 2001
21
overshoot. In this case the derivative element would be
fairly strong. In the case of “C” the system reaches the
setpoint quickly but overshoots and oscillates about the
setpoint for a few cycles. Increasing the proportional
term would probably drive the system into oscillation.
“D” also overshoots but the system settles fairly quickly.
Finally, “E” represents a very slow response system
with a persistent error that requires attention from the
integral element.
The type of response that is applicable to a given
vacuum system is highly dependent upon the
application. In some cases overshoot is not desirable but
on the other hand, time is money and getting to setpoint
quickly can be very important in terms of manufacturing
efficiency.
Upstream control is the simplest pressure control
mode and can permit a single gas (or a premix of gases)
to enter the system. Common examples of systems using
upstream control include freeze dryers and single gas
sputter deposition. Both require accurate pressure
control and a specific gas for the process - nitrogen for
freeze drying and argon for sputtering.
VI. RATIO UPSTREAM CONTROL
This configuration is required where it is necessary to
control pressure and also introduce multiple gases where
the mass flows of the gases have to be supplied in a
specific ratios due to reaction requirements.
One of the most common examples of a process
that uses ratio control is reactive sputtering. The
parameters that must be controlled are the chamber
pressure and the ratio of argon to the reactive gas
(oxygen or nitrogen). A typical ratio for this application
might be 95% argon to 5% oxygen.
The solution is to replace the simple proportioning
valve with a pair of mass flow controllers. Each gas is
controlled by one of the MFCs in such a way that the
proper mass ratios are maintained.
Referring to Figure 7, the output of the pressure
controller is fed to a ratio control device. This simply
apportions the total signal required between the two
MFCs. If MFC “A” is defined as the master controller
that is delivering some time varying Q, then MFC “B”
will deliver some constant fraction of what “A” is
delivering. The net result is a constant split or ratio of Q
between the two MFCs but the total flow is adjusted in
response to the pressure controller.
Pressure
Reading
Deviation
Error
LO
HI
Flow Ratio Controller
I
D
Set Point Input
Vacuum Chamber
P
Pressure
Gauge
Q(t)
A
Gas 1
kQ(t)
B
Gas 2
Mass Flow
Controllers
Throttle Valve
To Pump
Figure 7 - Ratio Upstream Control
the Bell Jar, Vol. 10, No. 3/4, Summer/Fall 2001
22
VII. DOWNSTREAM CONTROL
This is the most complex and flexible of the pressure
control methods. Downstream control is utilized when it
is necessary to control the absolute quantities of each
gas admitted to the system while also controlling
pressure. Each gas will be controlled by an MFC, each
one of which is providing a specific Q. This setup only
controls the gas input to the system, not the pressure.
The pressure is controlled with a motorized throttle
valve that is located between the chamber and the pump.
The name of this configuration is derived from the fact
that the pressure control element is downstream of the
chamber. Figure 8 depicts this configuration.
Downstream control is commonly used with
processes such as chemical vapor deposition and
reactive etching where the reactant gases must be
admitted not only in a specific ratio but also at a specific
rate. This precludes ratio control as a method. In
addition to this, the process pressure also has to be
controlled within tight limits. Some processes may also
change the gas flow rates during the process or
introduce other gases through additional flow
controllers.
Setpoint 1
Vacuum Chamber
Setpoint 2
Pressure
Gauge
Q1
Gas 1
Q2
Pressure
Reading
Deviation
Error
LO
HI
P
I
D
Set Point Input
Gas 2
Mass Flow
Controllers
Motorized
Throttle
Valve
To Pump
Figure 8 - Downstream Control
the Bell Jar, Vol. 10, No. 3/4, Summer/Fall 2001
23