1
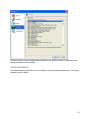
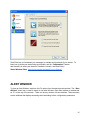
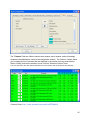
August 2013
Trade-Ideas Pro 3.x
User’s Guide
1
Introduction
Trade-Ideas Overview
Trade-Ideas Pro Overview
How to Download
System Requirements
How To
See Day Trading Opportunities
See Swing Trading Opportunities
Link with other software
Additional Linking Instructions
Uninstall
Starting Trade-Ideas Pro
Detailed List of Windows
Status Bar
File*
Tools
Windows
Help
Account
OPTIONS WINDOW
GENERAL
CONNECTION
LAYOUT
TIME ZONE
SOCIAL NETWORKS
Alerts
Window Contents
Alert Window
RIGHT CLICK MENU
Configure
Strategies Tab
Search
Select Alerts
Windows Specific Filters
Exchanges
Symbol Lists
Columns*
Window Name
Flip
RIGHT CLICK MENU (Continued)
Collaborate
History
Actions
Symbol Linking
2
Duplicate
Send [Symbol] To
Clear
Select Colors...
View Mode
Newest First
Group and Sort by
Don’t Repeat For
Resize Columns
Graphical Indicator
Speed
Freeze
Run OddsMaker
The OddsMaker Results Window
The Summary Tab
Metrics
Small Calendar
Charts
Equity Curve
Drawdown
Buying Power
The Calendar Tab
The Optimization Tab
Other Filters
The Settings Tab
Save As…
.csv file (Excel)
Save to Cloud... (See Section on Cloud)
Save Contents
Save As Default
Related Windows
Top List
Multi Strategy
Compare Count
External Linking
Symbol List
Cloud
Web Version is also available with subscription
3
Introduction
Trade-Ideas Overview
Trade-Ideas is one of the most powerful real-time stock scanners on the market today. We
develop trading software for individuals and large companies such as Etrade, Scottrade, TD
Ameritrade, Lightspeed, Interactive Brokers, and many more. Trade-Ideas offers an array of
statistical analysis and pattern recognition servers that connect directly to the exchanges and
monitor every tick for every trade on the NASDAQ, AMEX, NYSE, OTC BB, Pink Sheets,
Canadian, and European markets. Trade Ideas can be accessed via browser or a traditional
downloadable MS Windows based application.
Trade-Ideas Pro Overview
Trade-Ideas Pro is a standalone software program which provides the most advanced
streaming real-time statistical and technical analysis of the stock market.
Video: http://www.youtube.com/watch?v=rrZzUWgfT_s
How to Download
Click on the “Download” link on the Trade-Ideas’ website, located here:
http://www.trade-ideas.com/Application/Help.html
You can click on the “Download Now” button to install the latest version, or you can choose to
download the latest beta version. You can also download a previous version (Version 2.3.16)
(if)you use QuoteTracker, Cyborg Trading Systems, the TDA Robot, or the ActiveX control.
The window similar to the following will appear:
4
System Requirements
Trade-Ideas Pro is a 32-bit application for Windows. Therefore you must have at least Windows
XP installed on your machine. Some advanced features are supported only on Windows 7 and
above. You should have administrative privileges to install the software on the target machine. If
you have any troubles installing the software, please consult with your system administrator.
The downloadable version is compatible with Windows only, however, you can run Windows on
a Mac using additional software such as VMware Fusion or Parallels.
Product Overview Video: http://www.youtube.com/watch?v=c-05Ct_YmSw&feature=plcp
How To
See Day Trading Opportunities
Please visit our website: http://www.trade-ideas.com/Glossary/Day_Trading.html
See Swing Trading Opportunities
Please visit our website: http://www.trade-ideas.com/Traders_Swing.html
Video: http://www.youtube.com/watch?v=9TOFEkLJwaE&feature=plcp
Link with other software
Trade-Ideas offers numerous linking options. We are integrated with Power E*TRADE Pro and
Scottrade Elite. If you use one of these products, you do not need to download TI Pro from our
website. You can access Trade-Ideas and receive the same data within these programs.
There are some additional details associated with different trading applications such as Realtick,
Esignal, and Blackwood. Please read below for further details.
REALTICK
·
Alternate method should be selected on the Trade-Ideas External Linking window.
·
Link Trade-Ideas to a MarketMaker window without an Order Entry Panel visible.
·
Use Realtick’s internal linking to link the MarketMaker window to the chart(s).
ESIGNAL
·
Select ESIGNAL from the Rules Selection dropdown menu on the External Linking
window. Beginning is cut off and Alternate method should NOT be selected).
·
Link Trade-Ideas to a Detail window.
·
Use eSignal’s internal linking to link the Detail window to the chart(s).
5
BLACKWOOD
·
Must be using Trade-Ideas version 3.50 or later.
·
Select BLACKWOOD from the Rules Selection dropdown menu on the External
Linking window. (Alternate method will be selected)
·
Prior to linking to a chart, right click on the chart(s) and make sure SETTINGS is
checked and selected. This will open a toolbar panel with a symbol entry field visible.
·
Link Trade-Ideas via the External Linking window to the various charts.
Additional Linking Instructions
If you are still experiencing difficulties with the external linking, please follow these instructions
below:
1. Make sure the UAC in Windows System Configurations is turned off (usually a slider, make
sure it's all the way down to off). You may need to Google how to do so.
http://www.google.com/webhp?sourceid=chrome-instant&ix=seb&ie=UTF8&ion=1#hl=en&output=search&sclient=psyab&q=how%20to%20turn%20off%20uac&pbx=1&oq=&aq=&aqi=&aql=&gs_sm=&gs_upl=&fp=1
ed33cbea6c17507&ix=seb&ion=1&ix=seb&ion=1&bav=on.2,or.r_gc.r_pw.r_qf.,cf.osb&fp=1ed33
cbea6c17507&biw=1440&bih=779&ix=seb&ion=1
2. Reboot your computer.
3. Using TI Pro, inside of the External Linking window, make sure the "Alternate" is checked.
4. If you want to adjust the settings on double or single clicking, go to the main menu and select
Tools, then choose Options, and from there you can choose if want to single or double click a
symbol.
Additional help for external linking can be found in our video help section:
http://www.trade-ideas.com/VideoHelp/Menu.html
Uninstall
If for some reason you wish to uninstall Trade-Ideas Pro, you can remove it using Add/Remove
program in the Control Panel of your computer.
6
Starting Trade-Ideas Pro
Once you have downloaded TI Pro to your desktop, you can then start the program. To open
the program, double-click the Trade-Ideas Pro icon on the Windows desktop or select TradeIdeas Pro menu item from the Programs menu.
Detailed List of Windows
Status Bar
The status bar graphically displays the state of the connection to the Trade-Ideas web-server,
from which the program receives streaming alerts data (green color indicates normal connection
state), yellow (indicates a network issue), and red (indicates an account issue), and information
about account currently used. If you hover over the green ball in the status window, it will also
show you the current working status, date, and time. The number to the left of the status
indicator, provides the latency, in milliseconds. This is the time it takes for the data to be
transmitted from the Trade-Ideas datacenter to your local computer.
If you are experiencing account issues you will see red status marks. You can go to the Account
tab to check your account status. If for some reason you are logged out of the software, you
can double click on the ball to log back into TI Pro.
7
Within the status bar, you will find several menu items that run horizontally: File, Tools,
Windows, Help, and Account. Once you click on a tab, you will see a sub menu displayed
where you can make your selection.
File
Upgrade Now - Click here and you will be taken to the website where you can download the
latest version of TI Pro.
Login - Click here and you will be asked for your username and password to log into the
software. Type your username and password in the corresponding input fields and press the
"OK" button. Once you do so, you will begin receiving alerts data. If you entered the valid data,
the status bar will become green and you may start to receive alerts using Alert Windows. The
username and password are saved in the registry when you press the "OK" button in the login
dialog and are automatically restored next time you start the application.
If you log in incorrectly, the status bar will become red.
8
Reset Connection - If you are experiencing connectivity issues, click here to reboot the
streaming alerts server.
New Alert Window - This item is used to create a new Alert Window. There is no limit to the
amount of windows you can have open. These windows display streaming alerts according to
their configuration parameters. See "Alert Window" section below for more information about
Alert Window configuration.
Top List Window - This displays a list of symbols meeting your filtered criteria that is sorted on
one of our many Windows Specific Filters. These filter choices consist of price, volume,
volatility, buy/sell pressure, ranges, options volume, gaps, candle behavior, movement,
Bollinger Bands, moving averages and fundamentals. The top list window delivers the top 100
symbols based on your custom configuration and dynamically updates every 30 seconds.
Multi-Strategy Window - This is a proprietary window in Trade-Ideas that allows a user to
combine multiple independent alert strategies, inclusive of its own unique set of filters, into a
single container window. This approach is useful when screen real-estate is limited. This is an
efficient use of desktop space when numerous Trade-Ideas strategies are desired in a single
layout. A user can customize the color scheme for each strategy and can configure Window
Specific Filters and column choices in the window display.
Load Window - This is used to load an Alert Window which has been saved to file before. When
the menu item is selected, the standard Open file dialog will be displayed.
Save Layout - This menu item is used to save the current application's layout into the layout
file.
Load Layout - This menu item is used to load a layout that you previously saved as a file.
Save to Cloud - (See Section on Cloud)
Load from Cloud - (See Section on Cloud)
Exit - This menu item is used to exit the application. You can configure application to save the
layout automatically upon exiting or ask if you want to save layout.
Tools
9
Translator options - TI Pro now offers translations. You can choose from English, Deutsch,
Francais, Portugues, Chinese, and …
Symbol Lists - This menu item is used to open Symbol Lists window for creating, editing and
deleting stock symbol lists.
External Linking - This menu item is used to open the External Linking window for setting
external linking with the other applications.
Options - This menu item is used to open the "Options" window for configuring different
application settings such as: general, connection, layouts, timezone, and social networks.
Reset Font - This menu item is used to change the style and size of font that is displayed in the
alert windows.
Windows
Show All - This menu item allows you to bring up all windows on your desktop.
Minimize All - This menu item allows you to hide all windows on your desktop.
Minimize Toolbar Only - This menu item allows you to hide the status bar, while still keeping
your other windows open on your desktop.
note: the items in the menu below the blue line are the the windows or strategies that are
currently open on the desktop.
10
Help
Online Help - This menu item is used to open the Trade-Ideas Pro help and support page on
the Trade-Ideas Web-server.
OddsMaker Help - This menu item is used to open the help and support page for OddsMaker on
the Trade-Ideas Web-server.
Video Help - This menu item is used to open the Trade-Ideas Pro video lessons page on the
Trade-Ideas Web-server.
FAQ - This menu item is used to open the Trade-Ideas Pro Frequently Asked Questions page
on the Trade-Ideas Web-server.
About - This menu item is used to display the stand alone About dialog: (picture)
Account
Login as Demo - This menu option allows anyone to log in using our free demo version. Unlike
the regular login option, this option allows you to see data that is not in real-time. It is delayed
by 20 minutes.
Create Account - This menu option when selected will prompt you to the Trade-Ideas website
where you can create a Trade-Ideas account and subscribe to our service. Once you become a
subscriber, you receive alerts in real-time.
Activate Account - This menu option will prompt the customer to the Trade-Ideas website and
will allow him/her to reactivate their account if the account has expired.
11
Forgot my Password - This menu option will prompt the customer to the Trade-Ideas website
where they can enter their registered email address into the “Reminder” field. The customer will
soon receive an email with their login information including their username and password.
OPTIONS WINDOW
Options Window is used to configure different settings of Trade-Ideas Pro application. To open
Options Window, select "Options" from the "Tools" menu of Status Window.
Options Window contains four pages:
1.
2.
3.
4.
5.
General
Connection
Layouts
Time Zone
Social Networks
You can switch between different pages by clicking on the corresponding item in the list of
pages at the left of Options Window.
GENERAL
The General page is used to configure general application settings. The layout of General page
is shown below:
12
Use buttons inside "Integration support" section to configure alert selection method in the
Alert Window.
Select "Click on an alert" option to select an alert by single-clicking on it in Alert Window.
Select "Double-click on an alert" option to select an alert by double-clicking on it in Alert
Window.
Use "Enable Help" check box inside "Context sensitive help" section to enable/disable
context sensitive help for an alert. When this option is enabled, you can click on alert icon inside
Alert Window to display online help for that alert or filter.
Use “Appearance” if you want to show grid lines in an alert window or if you want to highlight
grid rows upon selection. Grid lines allow you to select content by rows/columns. This feature
comes in use especially when creating symbol lists within TI Pro. For instance, you can
highlight a column and then copy and paste the contents into a symbol list or spreadsheet.
Select “Font” to modify the font style and font size that will appear in the alert windows.
CONNECTION
The Connection page is used to configure network connection settings such as proxies and
network protocols used. The layout of Connection page is shown below:
Use “Connection Type” to select the connection status..... enable/disable HTTP tunneling. If
this option is enabled, all data is sent over an HTTP connection. By default this option is
disabled and a combination of HTTP and TCP/IP is used, which is more efficient.
13
Use "HTTP Options" slider to …..
Use controls inside "Socks Proxy" to inform the application about your current proxy
configuration. You can select type of the proxy server (HTTP or SOCKS) in the combo box, and
then enter host address, port and username/password for authorization (if required) in the
corresponding edit boxes.
Please ask your system administrator about proxy parameters.
LAYOUTS
The Layouts page is used to configure how application saves and restores layouts. The Layouts
page is shown below:
When "Always save layout" option is selected, application will save layout in the file every time
before exiting (old layout in the file will be overwritten).
When "Never save layout" option is selected, application will not save layout before exiting.
When "Ask to save layout" option is selected, application will display the following message
box before exiting:
TIME ZONE
The Time Zone page is used to configure the timezone of your present location. The layout of
the Time Zone page is below:
14
Under this option, select the appropriate timezone of your present location to reflect the times
displayed inside the alert windows.
SOCIAL NETWORKS
The Social Networks page allows you to configure your social network preferences. The Social
Networks layout is below:
15
StockTwits lets you broadcast your messages to multiple social networks if you choose. To
learn how to share your alerts using social media, see the “Collaboration” feature.
ded the ability to share your alerts on Facebook, Linkedin, and StockTwits(i
Status Window Video: http://www.youtube.com/watch?v=zu-vPanjxu0
ALERT WINDOW
To open an Alert Window, start from the File option from the status/console window. The “Alert
Window" menu item is used to create a new Alert Window. Each Alert window is marked with
an “A” on the top of the window. There can be any number of these windows. These windows
are the windows that displays streaming alerts according to their configuration parameters.
16
Notice the window name in the title bar. You will be able to change this using the config
window.
Alert Window Video: http://www.youtube.com/watch?v=hlDAUhPFb_o
Alerts
The alerts window shows you events as they happen.
RIGHT CLICK MENU
The following can be accessed by right-clicking over a window.
Configure
To access the Configuration window from the downloadable application, simply right-click over
any alert window and a menu will pop up. Select “Configure...”. This will bring up a configure
window.
Configure allows you to change the data that you are seeing in the window. The main
configuration window contains several pages for configuration of different parameters of the
current Alert Window. It is made up of several different tabs:
Strategies, Search, Select Alerts, Window Specific Filters, Exchanges, Symbol Lists, Columns,
Window Name.
[add hyperlink]
17
Configuration Overview Video: http://www.youtube.com/watch?v=kJZ6Ea1yHm4
Strategies Tab
18
The "Strategies" page allows (you) to select pre-configured strategies, recently used settings
from left panel of the window. It also displays the current settings of the Alert Window displayed
on the right panel of the window.
Select Pre-configured Strategies or Recently Used Settings from the corresponding folder on
the left panel. Press "Load Settings" button on the right panel to make a selection and hit “OK.”
19
Preconfigured Strategies
Recently Used Settings
By selecting a Preconfigured Strategy or Recently Used Settings, you can load it into the current
Alert Window. The Load button will be on the right panel of the Strategies panel with a
description of the strategy. By selecting Strategy or Settings, you can also read strategy
description and filters information on the right panel.
Strategies Tab Video: http://www.youtube.com/watch?v=_-_VprJ8uL4
20
Search
Note: Here, we have searched for alerts and filters with the word “High”
The “Search” page allows rapid and intuitive keyword search of all alert and/or filter
possibilities. Enter a keyword into the search field at the top of the Search window. This will
narrow down your candidates of alert and filter possibilities to only those that contain the
keyword you type in. The alerts and filters are also segmented into various searchable
categories. Scroll down to the bottom of the search tab to view these hyperlinked categories.
Similar to all windows within the Trade-Ideas interface, left click on an icon to be taken to a help
page that defines the alert or filter and right click on an icon to view or modify the respective
configuration setting.
Search Video: http://www.youtube.com/watch?v=S7bwOFH6Yu0
21
Select Alerts
Note: Here, we can see that “New High” is selected for this alert window.
The "Select Alerts" page allows to select alert types that should be displayed by the current
Alert Window and set their additional parameters:
If you are using the Top List window or Multi-Strategy window, please know that there will not be
a Select Alerts Tab.
Select Alerts Video: http://www.youtube.com/watch?v=PCyPokh-Pyw
Windows Specific Filters
22
Note: Here, we can see that the minimum and maximum Price filter has values in it along with
the minimum Volume Today filter.
The "Window Specific Filters" page allows to select specific alert filters for the current Alert
Window.
Windows Specific Filters Video: http://www.youtube.com/watch?v=a6g-HxE_970
Exchanges
23
Note: Here, we can see that several exchanges have been checked off showing the current
exchanges that are being used for the alert window.
The "Exchanges" page allows you to select stock exchanges that will be monitored by the
current Alert Window.
Exchanges Video: http://www.youtube.com/watch?v=jYWUJceBsxk
24
Symbol Lists
The "Symbol Lists" tab allows you to select symbol lists that should be used by the current
Alert Window for monitoring. You can choose to “Create New List” to start a new symbol list.
You will be taken to another window where you enter or paste in the symbols that you would like
to watch. There is no limit to the amount of symbols in a symbol list. Here, you can also
choose to load your symbols from a file, insert from file, or you can save your symbols to a file.
The symbol list you create will then show up on the drop down menu located on the right side of
the window. Next, simply click on the symbol list on the right and it will add it to the left panel of
the window. You can select to show only the following lists, all symbols, and to include or
exclude symbols from particular list. Make sure to select the symbol list(s) that you would like to
watch for that particular alert window.
The Symbol List feature can also be accessed in the Status Window under Tools. This menu
item is used to open Symbol Lists window for creating, editing and deleting stock symbol lists.
Symbol List Video: http://www.youtube.com/watch?v=JueEX_RHjmo
Columns
25
The "Columns" that are visible inside the alert window, top list window, and multi-strategy
window are assembled from inside of the configuration window. The Columns feature allows
you to change the list of columns that are displayed in the window for every received alert.
Select a filter(s) and use the arrows to move it into the “Selected Columns” area.
(You can see that in the alert window the filters from the columns tab are inside the alert window)
Columns Video: http://www.youtube.com/watch?v=BfFT9NlyXYk
26
Summary Tab
Note: Here, the window’s name is “Highs.”
The "Summary" tab allows you to set a window name (title) for the current Alert Window.
Summary Video: http://www.youtube.com/watch?v=rRde7X5glxA
27
Flip
This is a “Flipped” window. Notice the opposite Alert.
The "Flip" button in the bottom-right corner of the configuration window allows to switch
settings between a bullish strategy and a bearish strategy in one click. For example, if you look
at the two pictures above, you can see that the first window on the left has a green new high
alert. When you press the “Flip” button, it will switch the alert to the red “New Low” alert on the
right. It can switch opposite filters as well. For more information about alert types, parameters
and filters please see online help at http://www.trade-ideas.com/Help.html.
28
Config Window Video: http://www.youtube.com/watch?v=kJZ6Ea1yHm4
RIGHT CLICK MENU (Continued)
The following can be accessed by right-clicking over a window.
Collaborate
The “Collaboration” feature allows you to share strategies. This works on the the same data
as the configure window, and allows you to copy into an email, paste into a different type of
window, etc. The social media buttons allows you to share with StockTwits, Twitter, Facebook,
and LinkedIn. In addition, there is a QR code that you scan which will also upload your strategy
so you can share with others.
Collaborate Video: http://www.youtube.com/watch?v=CBUmfFpZ8WI
History
29
The “History” option is used to select the source of alerts – real-time data or historical data:
Select "Real Time" to view real-time alerts or select "Time Frame" to set time frame for the
historical data. If you selected "Time Frame,”, the following dialog window will be displayed:
Select a desirable time frame for the historical data and press the "OK" button. The Alert
Window will be filled with historical alerts according to the current configuration of Alert Window
and time frame selected. The caption of the Alert Window will be updated to show that historical
data is currently displayed and that additional portions of historical data are available. You can
request additional portions of historical data by selecting "More" item from the sub-menu.
History Video: http://www.youtube.com/watch?v=vRUjisBRUO4
Actions
30
The “Actions” option allows you to play sounds for the alerts coming through. If you wish to
hear a sound, simply check the “Play Sound” checkbox and then click the “Setup sound...”
button. This will let you search your computers default sound options and adjust the volume of
the sound. When you are finished, just select OK. If you do not wish to hear a sound, do not
check the “Play Sound” check box.
Actions Video: https://www.youtube.com/watch?v=kgbM2xqpO9Y
Symbol Linking
31
Duplicate
The "Duplicate window" menu item is used to create the new Alert Window which is
configured exactly like the current Alert Window.
Send [Symbol] To
The “Send To” feature allows you to share symbols and alerts with social networks and link
with external programs. It also allows you to Send to Web. By selecting a symbol in the alert
window and right clicking, you can use Send to Web to open a Trade Ideas browser displaying a
lookup of the symbol you selected on the Web. BigCharts, Yahoo, Scottrade eTrade, and TD
Ameritrade are a few online charting programs that are compatible with TI Pro.
videos:
Send To Video: http://www.youtube.com/watch?v=XMQvwuW9w0s
32
Clear
The "Clear" menu is used to clear all alerts currently displayed by the Alert Window.
Select Colors...
This “Select Colors” option is used to change the current color scheme of the Alert Window.
Select the desirable color scheme from the list and the Alert Window will be updated
immediately.
Select Colors Video: http://www.youtube.com/watch?v=M8oT4jzfw_0
View Mode
The “View Mode” is used to change the Alert Window’s current viewing system. You can
choose either Newest First, Group and Sort by, and Don’t Repeat For.
33
Newest First
The Newest First keeps the newest symbols starting from the top of the alert window. The
Group and sort by option gives you a window where you choose the symbol option: Keep
Newest or Keep Oldest.
Group and Sort by
Next, you have the option to sort the items by any of the columns within a window by double
clicking on them OR right clicking and choosing the Group & Sort by option. When using the
Grouping & Sorting feature inside of the right click menu, (located under View Mode), all new
data is highlighted in a different color. The Sort Direction can either be Ascending or
Descending.
Don’t Repeat For
The Don’t Repeat For feature allows you to select a time interval to not repeat a symbol within
the window. You will only see one alert per symbol for the time period selected.
View Mode Video: http://www.youtube.com/watch?v=5uymWAlaec8
Resize Columns
Right-click over an alert window and select “Resize Columns” to change the size of the
columns. You can adjust the window size by dragging the edges of the window.
Duplicate, Clear, Resize Columns, Small Borders Video:
https://www.youtube.com/watch?v=b_gKPwPdU94
34
Graphical Indicator
“Graphical Indicators” are easily understandable graphics that are used to view the current
performance value of the stock. Graphical Indicators can be used for a stock’s position in a time
range and volume %. These columns can be positioned anywhere inside of a window. When
the indicator gets more green, and when the green moves to the right, that means that the
stock's current price is closer to the high of the day. As you get more red, and as the red moves
to the left, that means the stock price is closer to the low of the day. A lot of the white color
means that it is near the middle of its trading range. You can still see the number values if you
like by hovering your mouse over the graphical indicator and you will see a tooltip displaying the
number. When you have multiple columns in an alert window, you can double click on a
particular column or filter so the graphical indicator for that particular filter will be present.
Speed
35
Right-click over the “Speed” option, and you can control how fast or slow you would like to see
alerts scrolling inside of the alert window. You have the ability to choose: Slowest, Slow,
Normal, Fast. Faster. Fastest. This feature is also available inside of the Multi-Strategy window.
Freeze
The “Freeze” option is found when you right-click over a Top-List window. You can choose to
freeze the data coming in through the window. You can duplicate the Top-List window and
freeze one of the windows for comparison.
Speed & Freeze Video: http://www.youtube.com/watch?v=qKiLIzqvdDo
Window Contents
This window is using the Heartbeat alert.
Heartbeat Alert
The Heartbeat alert will automatically appear if no other alert is selected since there has to be
at least one alert present in each strategy. By default the Heartbeat alert occurs once every 5
minutes for every stock. You can enter in a larger number to see the alert less frequently. For
36
example, you can enter 7.5 to see approximately one alert per stock every 7 and one half
minutes.
Alert Window Video: http://www.youtube.com/watch?v=hlDAUhPFb_o
TOP LIST WINDOW
To open a Top List Window, start from the File option from the status/console window. A “Top
List” is a window view that displays a list of symbols meeting your filtered criteria that is sorted
on one of our many Windows Specific Filters. Each Top List Window is marked with a “T” at the
top of the window. Instead of a stream of event based alerts as displayed in an Alert Window,
the Top List Window gives you data on a filtered list of symbols. Top Lists are filtered and sorted
in three different ways, first on the server, then by column, and finally with a visual color gradient
if you choose so. There are three ways to sort the columns: 1. double click on the filter itself
and the columns will sort according to that particular filter (The filter being sorted will then
depress. By doing this, the symbols in the window will be resorted based on that filter.), 2. rightclick on the icon at the top of the column and make a selection from the menu, 3. use the right
click feature and choose Configure, then open up the Columns tab. These filter choices consist
of price, volume, volatility, buy/sell pressure, ranges, options volume, gaps, candle behavior,
movement, Bollinger Bands, moving averages and fundamentals. A top list window delivers the
top 100 symbols based on your custom configuration and dynamically update every 30
seconds.
37
Please note that when you go inside of the Top List Config Window, you will notice that there
will not be a “Select Alerts” tab. Instead, you will be asked how to “Sort” your window first on
the server.
Top List Video: http://www.youtube.com/watch?v=ig3KIPDIeZM
MULTI STRATEGY WINDOW
To open a Multi-Strategy Window, start from the File option from the status/console window. A
“Multi-Strategy” window is a proprietary window in Trade-Ideas that allows a user to combine
multiple independent alert strategies, inclusive of its own unique set of filters, into a single
container window. This is an efficient use of desktop space when numerous Trade-Ideas
strategies are desired in a single layout. A user can customize the color scheme for each
strategy and can configure Window Specific Filters and column choices in the window display.
Each Multi-Strategy window is marked with an “M” at the top of the window.
38
39
When you right click over the Multi Strategy window, you will see a context menu similar
to the other windows. However, this menu extends to include all the different strategies
inside of it. You can choose to Configure each strategy or add a New Strategy. There
is an option to designate colors to differentiate strategies so you can differentiate them.
In addition, you have the ability to Open Alert Window from or Run OddsMaker for any
strategy in the Multi-Strategy Window.
Multi-Strategy Video: http://www.youtube.com/watch?v=9DqSjz6PoXA
40
COMPARE COUNT WINDOW
To open a Compare Count Window, start from the File option from the status/console window.
The “Compare Count” window allows for a visual comparison of how one strategy is doing
versus another. Typically, this is used when comparing a bearish strategy against a bullish
strategy. The compare count window gives you the ability to configure the red and green
strategies (see Compare Count 1 video).
(this window shows both the points and percent)
If you right click over the window, you will see options to Show Points, Show Percent, or Show
Both. The blue line is the Percent line. The percent line correlates with the Green strategy. The
Red and Green lines show the points which corresponds to the bar on the far left of the window.
To get to the Compare Count Config window, right click and choose Configure. A separate
window will appear with more options. This window allows you to configure the green and red
data separately. You can also choose the speed of the data as well the appearance of the EMA
41
lines by adjusting the slider. You can choose to view thick or thin EMA lines. Each time you
adjust the slider, a short description of your configuration will appear underneath the slider.
In addition, you can move a strategy into the compare count window from an alert window in to
use the Collaboration feature (see Compare Count 2 video).
Compare Count 1 video: http://www.youtube.com/watch?v=mFMxjCTxNCY&feature=plcp
Compare Count 2 video: http://www.youtube.com/watch?v=sGzyYfCRz64&feature=plcp
ODDSMAKER
42
The OddsMaker is an add-on module inside Trade-Ideas Pro application. It allows you to:
●
●
●
Calculate the odds of winning trades on any Trade-Ideas alert and filter combination.
Know in advance which trading strategy produce profitable trades in the market.
Evaluate strategies based on win rate of strategy, average winner, average loser, net
winnings.
The OddsMaker becomes a valuable tool in a trader’s arsenal so you can:
●
●
●
Avoid trading strategies without knowing their odds in the market.
Understand where profits can be taken and stops can be placed.
Instantly answer the following questions: Should I be going long or short?
breakouts following through or are they failing?
OddsMaker continued...
Are
The Configure OddsMaker screen appears:
43
The “OddsMaker” is located on the right-click menu in an alert window. Choose the Run
OddsMaker menu item to bring up the OddsMaker.
Click Simulate Buy or Simulate Sell to run the OddsMaker. As it is running the following window
will appear and show progress. The green portion of the progress bar indicates how many
trades so far have been winners and the red portion shows how many trades have been losers
so far. The alerts and filters used in the strategy that is being tested appears in the form of icons
in the top left part of the window.
OddsMaker continued...
44
(OddsMaker Progress Window)
The OddsMaker Results Window
After the completion of the simulation, the results window appears.
OddsMaker continued...
The Summary Tab
45
Metrics
The metrics section in the top right shows various performance metrics from the simulation.
Metric
Definition
Profit Factor
sum of profit from winning trades / sum of profit from losing trades
(greater than 1 = profit, less than 1 = loss)
Total Trades
number of trades taken in the backtest
Avg Winner/Loser
average dollar profit per winning trade and losing trade
Strategy Return
overall percentage return from the first trade to the last trade in the
backtest
Proj. Annual Return
this is the strategy return value projected out to an annual basis
Buying Power Req.
this is the maximum buying power required during the backtest
Starting Equity
account size to begin the backtest simulation with. The amount here
affects the strategy return and then projected annual return
Dollars/Shares
this field determines position sizing. When dollars is chosen, the value
for the field is the amount of dollars to allocate for the position. When
shares is chosen, a constant amount of shares is allocated for the
position.
Commission
per trade commission
Slippage
per trade slippage per share.
OddsMaker continued…
46
Small Calendar
The calendar view on the bottom left hand side of the window gives a daily view of the
performance of the strategy. Each day is color coded indicating if trades occurred and, if so,
how well they performed. A white background appears on the day if there were no trades or if
the profit was zero. If the trades that occurred on that day were profitable, the day will appear
with a lighter or darker shade of green depending on how profitable the day was. Lighter shades
equal smaller profits, darker shades equal larger profits. The same is true for losing days which
appear with a red background.
Hover your mouse over a day to see a tooltip that shows more details about the trades for that
day including number of winners and losers, total profit, and average gain. The section of the
equity curve for that day is highlighted as you hover over the day.
For strategies that are holding at least one night, a checkbox is shown below the calendar called
"Use Exit Date". By default, a day will have trades that were entered on that day. Checking this
checkbox will redisplay the calendar with each day having trades that exit on that day.
OddsMaker continued…
Charts
47
Equity Curve
The equity curve shows the change in your total equity over the simulation period. Most trades
are looking for a smooth, upward sloping equity curve. Often times just glancing at the equity
curve can identify problem areas that might not be obvious by looking only at the metrics. The
curves also make it easy to see the effect that commissions and slippage have on the strategy.
OddsMaker continued…
Drawdown
The drawdown graph shows the drawdowns over the simulation period. A drawdown is the peak
to trough decline of the equity curve. Large drawdowns are what make traders quit trading.
48
While there is no way to completely eliminate drawdowns, you should understand what
drawdowns are likely for a given system and size positions accordingly.
OddsMaker continued...
Buying Power
The buying power graph shows the minimum buying power required throughout the simulation
period. Strategies that hold many simultaneous positions will require more buying power. This
graph can help you determine how much money you'd need to allocate to trade every signal
49
that appears.
The Calendar Tab
The calendar tab gives a larger view of the small calendar on the Summary Tab with more
details. Each day has color coding as the smaller one, but each day where there are trades has
the win rate, number of trades, number of winners, total profit, and average gain per trade for
that day. Hovering over each day gives a tooltip with the 5 most profitable trades and the 5 least
profitable trades. Double left click on the day to bring up the trades viewer to view the trades
that occurred that day.
OddsMaker continued…
50
OddsMaker continued
51
The Optimization Tab
The optimization tab allows you to drill down into the details of the strategy to see what makes it
work. Each tab contains a reporting engine that can breakdown break down your strategy by
different filters allowing you to see which subsets of the trades work well and which don't. You
can use the information here to add additional filters to your strategy to improve it.
Each report has fields you can use to adjust the view. For example, the price report has a Price
OddsMaker continued…
Interval field which controls the upper and lower bounds for each bin in the report. The Having
At Least field let's you hide bins in the report that contain a small number of trades.
52
Use this field to hide segments that don't have a statistically significant number of trades.
On the right side of the report there is a graph. Most reports default to the Profit Factor graph.
(Drop down menu)
You can change the report by using the dropdown to choose a different style of report (picture
above). Where appropriate, a red line is drawn on the graph to indicate equilibrium. For
example on the Profit Factor graph the red line is drawn at 1 because above that level indicates
overall profit and below it indicates overall loss.
You can double left click on the left grid to display the trades associated with that bucket in the
report.
There are different viewing options inside of the Optimization tab. You can choose to view by
Price, Time of Day, Symbols, or Other Filters by clicking on either tab.
Other Filters
The Other Filters tab will appear if you have displayed additional columns in your strategy or
chosen to have additional columns sent to the OddsMaker report. You can choose the filter to
report on using the Column dropdown.
The Settings Tab
The Settings Tab is a brief summary of the configuration that was used on this OddsMaker run.
OddsMaker continued…
53
OddsMaker video: http://www.youtube.com/watch?v=Etgq-tJwADI&feature=plcp
Save As...
54
Save to Cloud... (See Section on Cloud)
Save Contents
You can save the current contents of an Alert Window to comma-separated values (*.CSV) file
by selecting "Save Contents…" item from the right click menu. The standard Save file dialog will
be displayed. Enter the file name, choose the file type, and press the "Save" button to save the
current contents of Alert Window into .CSV file. You can view them later with Microsoft Excel or
many other programs.
Save As Default
You can choose to save a layout as default under the Shortcut to Shared Default Files.
To retrieve the default layout, please follow the directions below.
From TI Pro, choose:
1. File
2. Load loadout
3. Find the shortcut folder called Shortcut to Shared Default Files
4. Choose the shortcut folder
5. Select DEFAULT_LAYOUT
55
Saving & Loading Video: http://www.youtube.com/watch?v=kMJ0WuKQ7yE
Related Windows
The Top List window is an alternative which shows you data which doesn’t update as fast. The
multi strategy window shows you similar data, but you can put several strategies into a single
window.
External Linking
Please Note: This feature requires Windows NT or Windows 2000 or better. It is not supported
on the Windows 95/98/Me. In addition, you must turn off the Windows UAC inside the User
Account Control of your computer for the external linking to work properly.
The Trade-Ideas Pro application may be configured so that when the new alert is received by an
Alert Window or a user double-clicks on alert in the Alert Window, the alert symbol is sent as a
text to the external (linked) window which belongs to other application. See "Actions" section
below for more information.
56
The symbol also could be sent manually by using "Set Up External Linking" window. This
window is displayed when you select the "External Linking…" menu item in the Main
Window's "Tools" menu.
The main list of external linked windows is called "MAIN LIST" and is always created upon
application startup. You can not delete or rename the main list.
You can create additional lists of linked windows by pressing "Create New List" button. The
program will automatically generate a new unique list name and display the following dialog
window:
Change the list name or accept automatically generated name and press the "OK" button. The
new list of linked windows will be created and its name will be selected in the "Current List
Name" section inside of the drop-down menu.
You can delete the list of linked windows by selecting its name in the "Current List Name"
section and then pressing the "Delete List" button. You can not delete the main list.
You can rename the list of linked windows by selecting its name in the "Current List Name"
section and then pressing the "Rename List" button.
Type a new name for the list of linked windows and press "OK" button to rename the list. You
can not rename the main list.
Rules Selection
This feature allows you to properly select the appropriate checkboxes (Beginning is cut off and
Alternate Method) depending on the platform selected, and it also allows for symbol mapping for
special symbols (ie Canadian) so that the program that Trade-Ideas links to, also sends the
appropriate symbology. The latest version of the External Connector does not allow for
automatic linking (where the symbol automatically is sent to the chart continually without having
to select it.
57
(please note that the list above is not limited to only these charting programs)
To link the external window with the Trade-Ideas Pro application, first select the name of the list
in the "Current List Name" combo box and then drag the crosshairs into external window. If the
window is valid for external linking, its name will be added to the selected list of linked windows
at the bottom of the "Set Up External Linking" window.
You can then use the "Set Up External Linking" window's controls to send symbols to the linked
windows. First select the name of required list in the "Current List Name" combo box, then
select one or more linked windows from the list using mouse with Ctrl and Shift keys.
Type the symbol you want to send in the "Symbol:" edit and press the "Send to Selected
Windows" button to send the symbol only to selected windows, or the "Send to All Windows"
to send the symbol to all linked windows in the list.
You can use the "Remove Selected Window" button to remove window from the currently
selected list of linked windows.
You can use the "Refresh Window List" button to refresh the currently selected list of linked
windows.
Symbol List
58
The Symbol Lists Window is used to perform different operations with the lists of stock
symbols. The layout of the Symbol Lists Window is shown below:
At the top of the window you can see the list box which contains the names of all your currently
existing symbol lists and the number of stock symbols in every list inside the brackets. You can
select one or several lists using the mouse with Ctrl and Shift keys.
At the bottom of the window there are the controls for different operations on the lists. These
controls and operations are described below.
Some operations are only valid when you select only one symbol list. The controls which
perform invalid operations will be automatically disabled.
The "Refresh from Server" button is used to clear the local symbol lists cache and reload it
with the symbol lists from the server. This operation is also automatically performed upon
application startup.
The "Edit list" button is used to edit the symbol list. This button is enabled only when exactly
one symbol list is selected. When this button is pressed, the following dialog is displayed:
59
You can add, edit and remove the symbols using the simple text editor at the top of the dialog.
The symbols should be added one line per symbol (as seen in picture).
Pressing the "OK" button will close the editor and apply the changes to the symbol list. The
program automatically will convert the symbols to the upper case, remove duplicate symbols
and sort the list.
Pressing the "Cancel" button will close the editor and reject all the changes.
You can also start editing the symbol list by double-clicking on its name in the list box of Symbol
Lists window.
Pressing the "Load From File…" button will display the standard Open file dialog which allows
you to load the symbols from the external text file (the current symbols in the editor will be
overwritten).
Pressing the "Insert From File…" button will display the standard Open file dialog which allows
you to insert the symbols from the external text file (the current symbols in the editor will be
saved).
Pressing the "Save To File…" button will display the standard Save file dialog which allows you
to save the symbols to the external text file.
The "Create New List" button is used to create a new symbol list. When this button is pressed,
the following dialog is displayed:
Type a name of the new symbol list and press the "OK" button to create the new list.
60
The "Rename List" button is used to rename the currently selected symbol list. This
button is enabled only when exactly one symbol list is selected. Type a new name for
the symbol list and press "OK" button to rename the list.
The "Delete List(s)" button is used to delete the currently selected lists. To delete a list,
just select the list you want to delete and then click on the “delete” button.
The "Copy List(s)" button is used to copy all the symbols from the currently selected
lists into new one. Type the name of the new symbol list and press the "OK" button to
copy the list and populate it with the symbols from the currently selected lists. The
program will automatically remove duplicate symbols.
The edit control labeled "Symbol:" and the two buttons "Add" and "Delete" at the
bottom of the Symbol Lists Window are used to add and remove symbols from the
currently selected lists. Type the name of the symbol you want to add or remove and
press "Add" or "Delete". The symbol will be added to or removed from all the currently
selected lists. The program will automatically remove duplicate symbols during addition
and ignore removing if the symbol does not exist in the symbol list.
Symbol List Video: http://www.youtube.com/watch?v=JueEX_RHjmo
Cloud
There are two functions of the Cloud. The user can “Save to Cloud” or “Load from Cloud.”
These options are located inside of the File menu of the status window.
61
With the Save to Cloud feature, first make a selection of the window(s) to save by checking the
checkbox(s). Next, name the layout and/or give a description of the layout and choose Save.
The layout(s) is automatically uploaded to the server or “cloud” and will remain there unless the
user chooses to later delete it. The user can Clear Previous Layout by checking the checkbox.
The user can select all windows by selecting Entire Layout and can uncheck all or multiple
windows by choosing Start from Scratch.
With the Load from Cloud feature, the user makes a selection of the window(s) or layout(s) by
choosing from the list of options. The window is sectioned off to display the Name, the Time,
62
the File Type, and the Window Count of the window(s) or layout(s). Initially, the window will
display all file types.
To narrow down the search, the user can type in a keyword into the
search box or can choose the file type from the drop down menu. The file types consist of: Alert
Window, Top List Window, Multi-Strategy Window, Compare Count Window, and Layouts.
You can also click on File Type and have the layouts sorted by type - Alerts, Compare Count,
Layout, Multi and then Top Lists.
Cloud Feature Video: http://www.youtube.com/watch?v=Br--EE_iB_c
END OF DOCUMENT
63