1
REAL TIME MONITORING SOFTWARE (RTMS)
INSTRUCTION MANUAL
2/95
COPYRIGHT (c) 1995 CAMPBELL SCIENTIFIC, INC.
LIMITED WARRANTY
Campbell Scientific, Inc. warrants that the magnetic diskette on which the accompanying computer
software is recorded and the documentation provided with it are free from physical defects in materials
and workmanship under normal use. Campbell Scientific, Inc. warrants that the computer software itself
will perform substantially in accordance with the specifications set forth in the Operator's Manual
published by Campbell Scientific, Inc. Campbell Scientific, Inc. warrants that the software is compatible
with IBM PC/XT/AT and PS/2 microcomputers and 100% compatible computers only. Campbell
Scientific, Inc. is not responsible for incompatibility of this software running under any operating system
other than those specified in accompanying data sheets or operator's manuals.
The above warranties are made for ninety (90) days from the date of original shipment.
Campbell Scientific, Inc. will replace any magnetic diskette or documentation which proves defective in
materials or workmanship without charge.
Campbell Scientific, Inc. will either replace or correct any software that does not perform substantially
according to the specifications set forth in the Operator's Manual with a corrected copy of the software or
corrective code. In the case of a significant error in the documentation, Campbell Scientific, Inc. will
correct errors in the documentation without charge by providing addenda or substitute pages.
If Campbell Scientific, Inc. is unable to replace defective documentation or a defective diskette, or if
Campbell Scientific, Inc. is unable to provide corrected software or corrected documentation within a
reasonable time, Campbell Scientific, Inc. will either replace the software with a functionally similar
program or refund the purchase price paid for the software.
Campbell Scientific, Inc. does not warrant that the software will meet licensee's requirements or that the
software or documentation are error free or that the operation of the software will be uninterrupted. The
warranty does not cover any diskette or documentation which has been damaged or abused. The
software warranty does not cover any software which has been altered or changed in any way by anyone
other than Campbell Scientific, Inc. Campbell Scientific, Inc. is not responsible for problems caused by
computer hardware, computer operating systems or the use of Campbell Scientific, Inc.'s software with
non-Campbell Scientific, Inc. software.
ALL WARRANTIES OF MERCHANTABILITY AND FITNESS FOR A PARTICULAR PURPOSE ARE
DISCLAIMED AND EXCLUDED. CAMPBELL SCIENTIFIC, INC. SHALL NOT IN ANY CASE BE
LIABLE FOR SPECIAL, INCIDENTAL, CONSEQUENTIAL, INDIRECT, OR OTHER SIMILAR
DAMAGES EVEN IF CAMPBELL SCIENTIFIC HAS BEEN ADVISED OF THE POSSIBILITY OF SUCH
DAMAGES.
Campbell Scientific, Inc. is not responsible for any costs incurred as a result of lost profits or revenue,
loss of use of the software, loss of data, cost of re-creating lost data, the cost of any substitute program,
claims by any party other than licensee, or for other similar costs.
LICENSEE'S SOLE AND EXCLUSIVE REMEDY IS SET FORTH IN THIS LIMITED WARRANTY.
CAMPBELL SCIENTIFIC, INC.'S AGGREGATE LIABILITY ARISING FROM OR RELATING TO THIS
AGREEMENT OR THE SOFTWARE OR DOCUMENTATION (REGARDLESS OF THE FORM OF
ACTION - E.G. CONTRACT, TORT, COMPUTER MALPRACTICE, FRAUD AND/OR OTHERWISE) IS
LIMITED TO THE PURCHASE PRICE PAID BY THE LICENSEE.
815 W. 1800 N.
Logan, UT 84321-1784
USA
Phone (435) 753-2342
FAX (435) 750-9540
www.campbellsci.com
Campbell Scientific Canada Corp.
11564 -149th Street
Edmonton, Alberta T5M 1W7
CANADA
Phone (403) 454-2505
FAX (403) 454-2655
Campbell Scientific Ltd.
Campbell Park
80 Hathern Road
Shepshed, Leics. LE12 9RP
ENGLAND
Phone (44)-50960-1141
FAX (44)-50960-1091
LICENSE FOR USE
This software is protected by both United States copyright law and international copyright treaty
provisions. You may copy it onto a computer to be used and you may make archival copies of the
software for the sole purpose of backing-up Campbell Scientific, Inc. software and protecting your
investment from loss. All copyright notices and labelling must be left intact.
This software may be used by any number of people, and may be freely moved from one computer
location to another, so long as there is no possibility of it being used at one location while it's being used
at another. The software, under the terms of this license, cannot be used by two different people in two
different places at the same time.
815 W. 1800 N.
Logan, UT 84321-1784
USA
Phone (435) 753-2342
FAX (435) 750-9540
www.campbellsci.com
Campbell Scientific Canada Corp.
11564 -149th Street
Edmonton, Alberta T5M 1W7
CANADA
Phone (403) 454-2505
FAX (403) 454-2655
Campbell Scientific Ltd.
Campbell Park
80 Hathern Road
Shepshed, Leics. LE12 9RP
ENGLAND
Phone (44)-50960-1141
FAX (44)-50960-1091
REAL TIME MONITORING SOFTWARE (RTMS)
TABLE OF CONTENTS
PAGE
SECTION 1. RTMS SYSTEM OVERVIEW ............................................................................. 1-1
SECTION 2. OS/2 OPERATING SYSTEM
2.1
2.2
2.3
User Interface ......................................................................................................................... 2-1
Priority, Multitasking, and System Resources ........................................................................ 2-1
Restarting OS/2 ...................................................................................................................... 2-2
SECTION 3. GETTING STARTED WITH RTMS
3.1
3.2
3.3
RTMS Installation ................................................................................................................... 3-1
Getting Help with RTMS Programs ........................................................................................ 3-1
RTMS Startup Overview......................................................................................................... 3-2
SECTION 4. DLSMGR
4.1
Introduction............................................................................................................................. 4-1
SECTION 5. NETADMIN
5.1
5.2
5.3
5.4
5.5
5.6
Overview................................................................................................................................. 5-1
Network Description (Nodes, Paths, and Addresses) ............................................................ 5-1
Clock Set/Check..................................................................................................................... 5-6
Program Download................................................................................................................. 5-8
Status/Warning/Fault Messages ............................................................................................ 5-9
RF Link Test ........................................................................................................................... 5-9
SECTION 6. RTM (REAL TIME MONITOR)
6.1
6.2
Introduction............................................................................................................................. 6-1
Monitor Mode.......................................................................................................................... 6-5
SECTION 7. DATA COLLECTION (DBSELECT)
7.1
7.2
7.3
7.4
Polling, Hole Detection, and Hole Collection Theory .............................................................. 7-1
Data File Names, Headers, Baling, and Archiving ................................................................. 7-2
Running DBSelect .................................................................................................................. 7-2
Hole Collection Status and Manual Hole Collection ............................................................... 7-5
SECTION 8. APPENDICES
8.1
8.2
8.3
8.4
8.5
8.6
Log Files ................................................................................................................................. 8-1
Extract Utility........................................................................................................................... 8-2
Format of the AUTOHOLE.DAT File ...................................................................................... 8-2
Radio Test Results ................................................................................................................. 8-3
CSI Logger Data Export Protocol ........................................................................................... 8-3
Sample ASCII File Created by DBSelect................................................................................ 8-7
i
APPENDIX A. TROUBLESHOOTING THE RTMS NETWORKS
A.1
A.2
A.3
A.4
Sample ASCII File Created by DBSelect................................................................................A-1
Communication Problems ......................................................................................................A-2
Computer Communicates with Datalogger, but RTM is not Displaying Data, and/or
DBSelect is not Storing or Routing Data ................................................................................A-7
DSMGR Messages and What They Mean .............................................................................A-9
GLOSSARY
SECTION 1. RTMS SYSTEM OVERVIEW
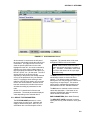
Real Time Monitoring Software (RTMS) is PC software designed to enhance the capabilities of the CR10T
and future Campbell Scientific dataloggers. RTMS provides data collection, monitoring, and control for
applications involving one or more CR10T dataloggers. RTMS is designed to do several tasks
concurrently. OS/2 was chosen as the operating system. Using OS/2 multitasking, data can be collected,
displayed, analyzed, routed, and archived simultaneously.
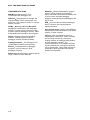
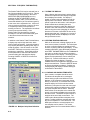
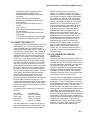
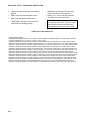
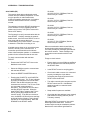
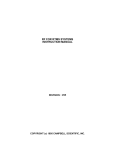
The computer running RTMS, dataloggers, and
the various communications interfaces (RF95T,
SC32A, MD9, phone modems, etc.) form a network with a physical communications path to
and from each of the dataloggers. The DataLogger Services Manager (DlsMgr) module
manages the network, organizing the exchange
of information between the computer and the
dataloggers. This information can be datalogger data, control information, datalogger
programs, etc. DlsMgr handles multiple data
requests from multiple CR10T sites simultaneously within the network. Since the most
common request is for datalogger data, this
communication is optimized so that datalogger
table data can be retrieved quickly in an
ongoing method. DlsMgr in turn makes the
datalogger data available to other applications
such as DBSelect and RTM.
NetAdmin
RTM
ASCII files
DlsApi
DlsApi
File Write
Datalogger
Network
BMP
DlsMgr
DlsApi
DbSelect
Named Pipe
(LDEP)
Pipe Client
Program
FIGURE 1-1. RTMS System
1-1
REAL TIME MONITORING SOFTWARE
COMPONENTS OF RTMS
BMP − Block Mode Protocol, use to
communicate with dataloggers, etc.
DBSelect − Data collection for storage, and
routing including TCP\IP, named pipes, and
ASCII files. This is data for archive or routing to
another computer.
DlsMgr − DataLogger Services ManaGeR.
Manages all communication with datalogger
network. Provides uniform interface for other
programs requiring datalogger services. Starts
automatically when needed by other programs.
DlsApi − Datalogger Services application
Interface, used by programs to access
datalogger services provided by DlsMgr.
Datalogger Network − The dataloggers and
communication hardware used with them.
EDLOG − Prompting editor for datalogger
programs. Used to create the “.DLD”
datalogger programs.
Extract − (Not shown) used to extract a specific
range of data from ASCII data files.
1-2
NetAdmin − Network Administration program,
Used to: monitor network communication,
status, and health, edit network descriptions, set
or check clocks, download datalogger
programs, interact directly with dataloggers, and
test RF links.
RTM − Real Time Monitor, Monitor datalogger
data in "real time" with various graphical
displays and tables.
Pipe Client Program − Used to route DBSelect
collected data to external database, user-written
program, or other computer.
DBSelect, RTM, and NetAdmin can be run
independently of each other. When more than
one is running concurrently, requests for
ongoing collection of datalogger data combine
to avoid redundant collection. The
interconnecting lines on the diagram represent
a protocol that the two connected components
use to communicate. Using RTMS requires no
knowledge of these protocols unless special
software is being written.
SECTION 2. OS/2 OPERATING SYSTEM
2.1 USER INTERFACE
Before RTMS can be installed, OS/2 (Version
2.1 or newer) must be installed and running.
The SYSTEM MONO-SPACED FONT should
be installed (this is default) as part of the OS/2
installation. Running the tutorial provided with
OS/2 is a good way to become familiar with the
OS/2 user interface. The manual ‘Using the
Operating System’ provided with OS/2 also
provides a good introduction to the OS/2
Workplace Shell. This RTMS document does
not give detailed explanations of common user
interface actions but offers the following brief
definition of some of the terms used.
Click or Click on − Press and release mouse
button (usually left button) while mouse cursor
is positioned on an object.
Select − Click on object, double click on object, or
press ENTER key when object is highlighted.
Buttons and menus usually require a single click.
Double Click − Click twice rapidly on an object,
often a shortcut for a common operation. For
example, double clicking on a file name (in a file
dialog box) is a shortcut for selecting a file
name and then selecting the OK button.
Drag − Press and hold the mouse button while
mouse cursor is over an object. Object is
moved while mouse is moved as long as the
mouse button remains pressed.
Drop − Releasing the mouse button after
dragging when the object is in desired position.
Icon − Graphical representation of the program
or other object. RTMS programs have icons,
as shown in Figure 3-1.
Folders − Icon containing other icons. Used to
organize programs, etc. Similar to a directory.
Start or Open − Double click on program icon
to start program, double click on folder icon to
open it.
Close − Remove the window, view, or folder.
Closing the main window of a program will halt
its execution as well. Clicking on the small box
located in the upper left corner of window next
to the title bar will display a menu of options
available for the window. Double clicking on the
box will usually close the window.
Minimize − Reduce the window to an icon.
Program execution continues. This option is
found on the option menu described in the close
section above. Selecting the minimize button
(button displaying a small box) will also minimize the window. This button is located in the
upper right section of the window between the
title bar and the maximize/restore button.
Maximize − Make the window as large as
possible. Use the pop-up option menu (described in Close) or select button in the upper
right corner next to the minimize button. When
a window is maximized, the maximize button
becomes a restore button and will return the
window to the size it was before maximizing.
Size − The Option menu previously described in
Close contains options to size the window.
Windows can also be sized using the maximize
button in upper right corner of window and by
dragging the sizing border when available.
Certain keys have special uses. The TAB key
moves the cursor to the next parameter, button,
or object. The SHIFT-TAB key moves to the
previous item. The ENTER key is used to indicate you are done with the current dialog box.
While many of the above actions can be
accessed from the keyboard, most are
designed for the mouse.
2.2 PRIORITY, MULTITASKING, AND
SYSTEM RESOURCES
Since OS/2 is a multitasking system, many
programs can be run at the same time. RTMS
uses this multitasking to collect, process,
display and store data at the same time. As
more programs are run, heavier demands are
made on finite system resources (i.e., memory,
microprocessor time (CPU time), disk space
etc.). At some level of activity the OS/2 system
cannot provide enough system resources for
RTMS to run correctly. Under normal
conditions, all of the RTMS programs can be
run concurrently without difficulty. However if
other programs are running, multiple copies of
some of the RTMS programs are running, or if
hardware resources are insufficient (e.g., not
enough RAM or disk space) OS/2 and RTMS
performance may suffer. The following are
indicators of insufficient resources:
2-1
SECTION 2. OS/2 OPERATING SYSTEM
•
Sluggish responses to mouse and keyboard.
•
Low memory warning on NETADMIN network health screen.
•
Real time displays (e.g., strip charts) do not
keep up.
•
Status, warning, fault messages indicating
queue overflows.
•
DBSelect stop collecting due to insufficient
hard disk space or because the Named
Pipe breaks.
Some suggestions to diagnose and remedy
these kinds of problems:
•
Keep plenty of disk space free. OS/2 does
not run well with less than 15+ megabytes
free.
•
OS/2 runs best with 8+ megabytes of
memory (RAM). 16 megabytes is desirable.
•
Do not run more programs than needed.
Close unused DOS and OS/2 full screens,
programs, folders, and windows.
•
The DBSelect status window gives indications of hard disk space and virtual memory
status.
•
The PULSE program (supplied with OS/2)
can be used to check CPU usage. If the
graph indicates complete usage of the
CPU, reduce the number of programs being
run.
•
The program on top of the OS/2 Desktop
(the program with the focus) has higher
priority than those running in the
background. Keep the focus on important
programs.
RTMS programs are compiled with priority so
the background module (DLSMGR) task that
communicates with the datalogger has highest
priority. This helps ensure that data will be
available for DBSelect and RTM. When system
resources are taxed, DBSelect and RTM may
not be able to process the data as fast as
DLSMGR collects it. DLSMGR uses buffering
and will keep the data until DBSelect and RTM
can process it, if the heavy demands on the
system resources are temporary. However
when running with a continual lack of system
resources, so RTM and DBSelect cannot keep
up, DLSMGR buffers will eventually overflow
and some collected data will be discarded.
DBSelect will request that this data be
2-2
recollected, provided the data is still available in
the datalogger. However, when all of the CPU
resources are being used, long-term operation
is not reliable.
2.3 RESTARTING OS/2
By default, OS/2 automatically starts all
programs that were running when OS/2 was
stopped. This means if the RTMS programs
were running when OS/2 was stopped, they will
automatically restart when OS/2 restarts. This
applies if they are started by double-clicking on
their icons. NetAdmin and DBSelect use
initialization (.ini) files to keep track of their state
and will continue where they were previously
when restarted. RTM will not automatically load
and monitor with a template unless configured
to do so. See Section 6.1.10 for information on
how to do this.
SECTION 3. GETTING STARTED WITH RTMS
3.1 RTMS INSTALLATION
To install RTMS, select a full OS/2 screen or an
OS/2 window. Change to the drive containing
the RTMS disk #1. At the OS/2 prompt type
INSTALL followed by ENTER. Follow the
prompts given. The installation program allows
the user to select whether it should modify the
CONFIG.SYS file. When the changes are
enabled, the install program:
•
Adds the RTMS directory to the SET PATH
directories.
•
Adds the RTMS directory to the LIBPATH
directories.
•
Adds the RTMS directory to the SET HELP
directories.
The installation program also allows the
selection of the subdirectories where the
programs will be installed. The default directory
is C:\RTMS. A data directory is also specified.
This directory will be used to store initialization
files, datalogger program file, log files, etc.
needed for RTMS. Normally datalogger data
files will be stored in subdirectories under the
data directory.
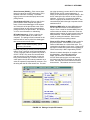
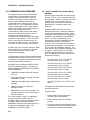
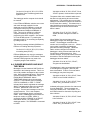
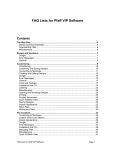
The installation program creates an RTMS
folder on the OS/2 desktop. This folder
contains ICONS for NetAdmin, RTM, DBSelect,
and EDLOG (DOS) (see Figure 3-1).
NOTE: EDLOG is a DOS program and
needs to be added to the OS/2 DOS PATH
before it can be used. The RTMS install
program does not do this as part of the
installation.
To add EDLOG to the path, start a DOS
session (full screen or windowed), change to
the root directory (CD\), and edit the
Autoexec.Bat file (EDIT AUTOEXEC.BAT).
Find the path statement and add the directory
where RTMS was installed. For example, the
following sample path statement:
PATH
C:\OS2;C:\OS2\MDOS;C:\OS2\MDOS\WINOS2;
should be changed to:
PATH
C:\OS2;C:\OS2\MDOS;C:\OS2\MDOS\WINOS2
;C:\RTMS;
if RTMS was installed in the C:\RTMS
subdirectory.
3.2 GETTING HELP WITH RTMS
PROGRAMS
The RTMS programs offer on-line help. Most
parameters and menu selections have help
available. Pressing F1 while an option is
highlighted will provide context-sensitive help.
Selecting the HELP button or selecting HELP
on the menu will also provide information about
specific parameters.
FIGURE 3-1. Contents of the RTMS Folder
3-1
SECTION 3. RTMS INSTALLATION
3.3 RTMS STARTUP OVERVIEW
Campbell Scientific dataloggers are general
purpose and require programming for specific
applications. The datalogger manuals describe
datalogger programming. EDLOG is a
prompting editor for creating datalogger
programs. EDLOG runs in a DOS window or
full screen. The RTMS installation program
created an icon for EDLOG. A separate manual
contains information on using EDLOG.
Before data can be collected or displayed each
datalogger site needs to be set up. Typically,
that can be accomplished with the following
sequence describing the task and the module
used.
1. Create a network description. Entering
stations and communication paths
(NetAdmin).
network description. Retries will be attempted if
any problems exist. With multiple remote sites
several tasks can be happening at the same
time. If several new sites have been added to
the network description all at once, it may be
difficult for the user to determine the status of
the remote sites during the startup period.
When problems exist (i.e., network description
errors, bad communication links, etc.),
DLSMGR will provide information on the
network health screen and in the message logs.
Some users have found it to be advantageous
to add stations one at a time, verifying communication with each before adding the next
station. With radio networks, using the RF link
test can help identify communication problems
with remote sites before adding them to the
network. Once the network has been described
and set up, the following can be done:
•
The data for archive or routing to other
programs or computers can be selected
and collection started (DBSelect).
•
Set up real-time graphical displays (RTM).
•
Set up computer/datalogger control (RTM).
•
Automate checking of the datalogger clocks
(NetAdmin).
2. Set or check the clock at each station
(NetAdmin).
3. Download a '.DLD' datalogger program
(created with EDLOG) to each datalogger
station as necessary (NetAdmin).
DLSMGR will attempt various communications
with all remote sites specified in the active
3-2
SECTION 4. DLSMGR
4.1 INTRODUCTION
DataLoggeR Services ManaGeR (DlsMgr)
provides all communication with the datalogger
network. RTMS users do not interact directly
with DlsMgr but it is helpful to have an
understanding of how it works.
DlsMgr is given information regarding the layout
of the network as a Net Description. NetAdmin
provides DlsMgr with this description based on
user-entered parameters. Once it has received
a Net Description, DlsMgr uses the dialing and
path information to communicate with the
dataloggers in the network.
When new dataloggers are listed in the Net
Description, DlsMgr queries each new
datalogger in the network to obtain a list of data
available at that site. This information, known
as Table Definitions, is used to provide lists of
what data is available to programs requiring
datalogger data. In addition, DlsMgr initiates an
ongoing system for delivery of information
(packets) both to and from the dataloggers.
With this packet delivery system in place,
programs such as RTM, NetAdmin, and
DBSelect can request services regarding the
dataloggers.
The DlsMgr provides services including: a list of
stations in the network, a list of data available at
any station, collection of specified data from
sites, reading and setting of clocks, reading and
setting of ports and flags, and others.
4.1.1 PACKET DELIVERY
DlsMgr implements a packet delivery system
that is independent of the information contained
in the packets. This means that multiple jobs
can be going on at once. For example, clock
sets can be done while the normal ongoing data
collection is taking place.
DlsMgr periodically checks each datalogger for
any packets the datalogger needs to send,
including data. This polling for packets is based
on the polling interval the user-specified with
NetAdmin. Most of this packet delivery system
is done by the computer, however the RF232T
(radio base station) takes an active role in the
delivery of packets through the radio network.
4.1.2 RETRIES
DlsMgr tracks jobs to ensure their completion.
DlsMgr will retry jobs that fail or jobs for which
DlsMgr does not receive a response in the retry
period specified by the user. In addition to
these ‘top level’ retries, the underlying packet
delivery system may attempt immediate local
retries. For example, if a packet transmitted
over a serial link fails a signature test the packet
will be sent again. As expected, the exact
behavior of the system varies with the link being
used.
Telephone − The packet delivery system will
make two attempts to establish a phone
connection. Once the phone connection is
established, the packet delivery system will
deliver any packets to the datalogger and will
pause briefly to accept any packets from the
datalogger. If transactions for other dataloggers
that require the phone line are pending, DlsMgr
will complete the transaction and accept one
additional packet from the datalogger before
terminating the connection. This prevents one
datalogger from monopolizing the phone line. If
all the stations utilizing the telephone are
scheduled to call at the same time then only
one packet will be accepted from each station
before calling the next. This can cause DlsMgr
to spend most of its time dialing and switching
from site to site. Using the same calling interval
for all stations, but using the offset parameter to
stagger the calls within the interval, leads to a
more efficient ratio of calling time versus data
collected.
RF − The base station takes an active role in
delivery of packets both to and from the remote
dataloggers accessed via radio. The base
station periodically does a broadcast based on
the user entered polling interval and offset.
When the remote RF95T modems hear the
broadcast, they check the CR10T they are
connected to for any packets. Each remote, in
turn, sends the packets back to the base. This
polling is normally used for data collection.
If repeaters are being used, the repeater will do
the broadcast and receive replies from the
remote RF95T modems. The repeater then
relays all the packets back to the base. When
the base receives packets destined for a
4-1
SECTION 4. DLSMGR
remote, the RF base will direct the packets to
the CR10T using the specified path and return
the response as soon as possible.
If directly routed packet deliveries fail, the base
will attempt several retries. Retries are done at
the end of each polling cycle for remotes that
failed to respond to the broadcast. When
retries fail consistently, the base will mark the
remote site as not responding and will not
attempt further packet delivery or collection
from that site until it responds to a broadcast.
Direct connect, short haul, and MD9 − The
computer handles packet delivery with these
systems. Signature and dialing failures are
retried immediately. The remote dataloggers
are checked at the user-entered polling interval
for any packets they need to send to the
computer (normally data). Direct connect
(SC32A) and short haul modems (Rad
modems) access one datalogger per serial port.
The MD9 modems allow multiple remotes on
the same serial port. With MD9 modems, the
computer accesses the remotes sequentially by
dialing the base MD9.
4.1.3 DATA COLLECTION
DlsMgr also oversees the data collection
process. If the current retry period or four times
the polling period (whichever is longer) elapses
without a valid data response from a datalogger,
DlsMgr will restart the data collection from that
site. The datalogger will send a valid response
even if it has no data to send as long as it is
configured to send data. This prevents DlsMgr
from restarting the data collection if slow data
(compared to the retry and polling interval) is
being collected. Normally DlsMgr will need to
restart data collection when the following type of
event occurs:
•
The datalogger is called by a computer
other than the RTMS computer (i.e.,
GraphTerm or other RTMS computer).
•
The datalogger has cancelled sending data
because a long period has elapsed since
the last valid collection.
•
The datalogger has lost power.
•
The datalogger has been reprogrammed.
4-2
SECTION 5. NETADMIN
5.1 OVERVIEW
NetAdmin provides seven basic functions for
setting up and maintaining the network. The
network health is displayed on the NetAdmin
main screen. The other functions are accessed
from the submenu displayed when VIEW is
selected from the NetAdmin main menu. Each
function is briefly introduced here and described
in detail in following sections.
NETWORK HEALTH (Main Screen)
Provides a pictorial representation of the
network with each station colored to show its
status, the time stamp the last data collected
from each station, the total number of stations
where data is being collected, and a graph
indicating the status of each station for the last
12 hours. Additional displays are provided to
monitor and log low-level port activity including
a slider control to pause all network
communication for a period of time.
NETWORK DESCRIPTION (View Submenu)
Used to describe the datalogger network. The
left side of the screen shows the pictorial
representation of the network as entered, the
right side shows specific information for the
selected device.
STATUS/WARNING/FAULT (View Submenu)
Displays color coded messages (Black for
status, Blue for warning, and Red for faults)
about the network. A setup screen allows the
selection of the type of messages (Status,
Warning, or Fault) and from which stations
messages should be displayed. These
messages can be logged to disk.
CLOCK CHECK/SET (View Sub menu)
Allows the clocks in the network to be set or
checked. This can be done manually or
automatically at a user-specified interval.
PROGRAM DOWNLOAD (View Sub menu)
Allows '.DLD' datalogger programs to be
downloaded to the dataloggers. Multiple
stations and programs can be selected and
queued.
KEYBOARD/DISPLAY (View Submenu)
Allows remote keyboard access of each
datalogger in the network.
RF LINK TEST (View Submenu)
Allows the testing of Radio (RF) links. To test
RF links the ID switch settings of the RF95T or
RF232T must be known. This allows testing of
the radio hardware before the stations are
brought on-line.
All of these functions, accessed from the VIEW
submenu, are active as long as NetAdmin is
running. The individual windows (views) may
be closed without affecting their operation if the
NetAdmin main program with the network
health display is left running (e.g., the automatic
clock sets will take place, even if the Clock
Check/Set window is closed, as long as
NetAdmin is running). NetAdmin can be
minimized and the functions will still be active.
5.2 NETWORK DESCRIPTION (NODES,
PATHS, AND ADDRESSES)
NetAdmin is used to create descriptions of the
datalogger network. When the MAKE THE
OPEN NET DESCRIPTION ACTIVE menu
option is selected, NetAdmin transfers the
current network description to DLSMGR.
DLSMGR will use the current information to
establish communication with the dataloggers
(stations). Net descriptions can be saved at any
time. Descriptions are saved with a ".NET"
extension. When a description is saved, a text
(printable) version is also saved with a ".TXT"
extension. Multiple descriptions can be entered
and saved but only one can be active at a time.
Once a description is made active, DLSMGR
will continue to use it even if NetAdmin is
stopped and restarted. It is unnecessary to
make a description active again unless the
description is changed or a different one is
used.
A network description contains information
regarding what dataloggers are in the network
and what devices are used to communicate with
the dataloggers. The dataloggers and
communication hardware are organized as a
hierarchy. This can also be thought of as a
5-1
SECTION 5. NETADMIN
parent-child organization or a tree structure.
Basically the structure starts with the Computer
(PC1) at the top, a datalogger (CR10T) at the
end of each branch, and various communication
hardware in between. Each entry in the
structure is referred to as a node. In the
pictorial representation, a child node is listed
under its parent and indented to the right.
Some examples should help clarify this
structure.
Consider a PC with a CR10T attached to each
of its four serial (COM) ports. The PC is
considered the parent and each of the CR10T
dataloggers is a child. Pictorially it would look
like this:
PC1
CR10T1 - COM1
CR10T2 - COM2
CR10T3 - COM3
CR10T4 - COM4
All the children nodes of a given parent
(siblings) do not have to be the same type of
devices. If there were 3 CR10T dataloggers
and a radio base station (RF232T) attached to
the PC and there were two remote radio sites
(CR10T and RF95T) attached the network
would look like:
PC1
CR10T1 - COM1
CR10T2 - COM2
CR10T3 - COM3
RF232T - COM4
CR10T4 - 1
CR10T5 - 5
Notice that the PC1 is always a parent, an
RF232T is a child of the PC but a parent to the
two remotes. The RF232T is also a sibling of
CR10T1, CR10T2, and CR10T3. The numbers
by CR10T4 and CR10T5 indicate their RF
modem addresses.
Nodes are entered by highlighting a parent node
and selecting the ADD CHILD button or
highlighting a child node and selecting the ADD
SIBLING or INSERT SIBLING button. The ADD
CHILD and ADD SIBLING buttons add the new
node at the bottom of the entered children or
siblings. The INSERT SIBLING button moves
the highlighted sibling and those under it down,
making a space for the new sibling.
5-2
Each device that DLSMGR will use (talk to or
dial) directly is entered as a node. All other
devices and information are entered as
parameters. For example, to communicate with
a datalogger over an RF (radio) link that uses a
repeater, DLSMGR must communicate directly
with the RF base; thus, the base is entered as
node. DLSMGR does not talk specifically to the
repeater, so it is not entered as a node. The RF
base does use the repeater so it is entered as
part of the RF path parameter. Once a parent
node has been defined, only certain devices
can be added as a child to that parent. For
example, an RF (radio) base station, when
entered as a parent node, can only have remote
RF stations as child nodes. The specific
examples below should help clarify what is
entered.
The user enters a descriptive name for each
station. All future reference to the station will be
by this name. The devices and information are
needed from the user: COM ports, devices
(e.g., SC32A, Hayes Modem, MD9, etc.), and
dial string (e.g., phone number). Addresses are
also entered for addressed peripherals (e.g.,
RF95T or MD9). In addition, the user enters the
interval at which the station should be checked
for new data. Once entered, these parameters
are saved by NetAdmin. The user can also
save the description to be edited later if the
network changes. This part of NetAdmin is not
used again unless stations are added or
removed from the network.
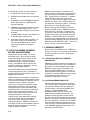
5.1.1 ENTERING A NETWORK DESCRIPTION
Open the RTMS folder by double-clicking on its
icon. This will display the icons for the RTMS
software. Start the NetAdmin program by
double clicking on its icons. The main
NetAdmin screen will be displayed.
Select VIEW from the main menu, and then
NETWORK DESCRIPTION from the submenu.
The screen in Figure 5-1 will be displayed if
NetAdmin is being run for the first time. This
network description indicates that the computer
(PC1) is the only node (device) in the network.
PC1 is always present in a network.
SECTION 5. NETADMIN
FIGURE 5-1. Initial NetAdmin Screen
As the network is constructed, the left part of
the screen will visually indicate the network as it
is described. The right part of the screen will
show the specific parameters for the node
highlighted on the left. As a node is entered by
selecting one of the child or sibling buttons, a
list box will allow the selection of the device (i.e.,
RF232T, CR10T, etc. ) for that node. The list of
devices offered in the list box will vary
depending on the parent node already selected
or may not be presented if only one selection
exists. For example, when entering a child
node for a RF232T base station, only a remote
CR10T site can be selected. After the device
has been selected, the left side of the screen
will allow the editing of parameters for that
node.
Section 5.1-2 describes all of these node
parameters. The actual parameters displayed
varies depending on the selected device.
5.1.2 DEVICE TYPE PARAMETERS:
The STATION NAME parameter is a userentered name for each node. NetAdmin will
supply a default name (Stn1, Stn2, etc.) for
each station but a more descriptive name is
suggested. The entered name will be used
throughout RTMS to refer to the station.
NOTE: Station names must start with a
letter and contain only letters, numbers or
the '_' character. Each station name must
be unique and names can be up to eight
characters long.
The NBR parameter is used to assign a unique
identification number to each node in the
network, The default number is adequate
although the user may change the numbers as
long as they are kept unique. This number
should not be confused with the address set
with switches in RF95T and MD9 modems.
The ON button is checked to allow communication with that station. If the button is not
checked, DLSMGR will inhibit all communication directed to that station.
BMP PARAMETERS (Block Mode Protocol)
The SECURITY CODE parameter is used to
specify the security code needed to use a given
node.
5-3
SECTION 5. NETADMIN
The DO___RETRIES USING A ____ SEC
PERIOD THEN USE ______ SEC. prompts
allow the scheduling of fast and slow retries.
When an operation (e.g., clock set) fails, it is
retried until it succeeds, is canceled by the user,
or is canceled by the program that initiated it.
This parameter allows the user to control how
often these retries occur. The number of retries
specified in the first blank are attempted at the
interval specified in the second blank. If the
operation is still unsuccessful it is then retried at
the second interval until it succeeds.
NOTE: These intervals must be long
enough to complete the entire operation
including telecommunication time. For
example, a large program may take 10 to 15
seconds to download and compile, even on
a direct connection. If the retry interval is not
long enough, the download will restart before
the previous one completes.
5.1.3 SERLINE PARAMETER (SERIAL LINE
COMMUNICATIONS)
The POLLING INTERVAL parameter is used to
specify how often the affected node (or child
nodes for some parent nodes) is checked for
data. Several factors are affected by it:
1. Delay from when data is stored in the
datalogger until it is available in the computer. Polling a station once a minute
ensures the data is available at (or at least
en route to) the computer within a minute of
it being stored in datalogger memory.
2. How much time the network is active and
busy versus amount of time idle. The delay
involved in non-data type operations (e.g.,
clock sets) is affected by how busy the
network is polling. Polling at fast rates may
cause other jobs of lower priority to be
delayed or even postponed indefinitely.
3. The cost of running the network is affected;
frequent polls means frequent phone calls
in telephone networks. Frequent polling in
other networks causes more power consumption, increasing demands on batteries.
NOTE: For RF Radio frequency, poll at
least every 20 minutes.
The OFFSET parameter is used to determine
when, in the polling interval, a poll is made. For
example, setting the polling interval to 60 and
the offset to 30, would cause the polling to take
5-4
place every minute (60 seconds) but 30
seconds into the minute.
The EXTRA COMMS ALLOWANCE (Msec) is
used to increase the amount of time DLSMGR
will wait for a response to serial packet data it
sends. Normally this is left at zero.
The MAX PACKET SIZE is used to manually
decrease the size of packets DLSMGR uses.
This is only required for special links. Normally
the default value is used.
The BAUD RATE parameter should be set to
match the selected device.
5.1.4 VIA PARAMETERS
This parameter is used to specify the link
between the node being described and the
parent node. For nodes connected directly to
the PC it specifies the COM port used. For a
remote station accessed by telephone it
specifies the telephone number dialed to reach
the station. For RF it is the hardware addresses
of the station and repeaters used to reach the
remote site. For MD9 networks it specifies the
hardware addresses of the remote MD9 nodes.
5.1.5 RF POLL OFFSET
In an RF network, the base polls the remotes at
the same interval it is polled by the computer.
This box is present for the first child of the RF
base node. It can be used to alter when, in the
polling interval, the RF begins polling. This
allows independent polling offsets for when the
computer polls the RF base and when the RF
base polls the remotes. For example, if the
datalogger stores data on the even minute,
starting the RF polling 5 seconds after that
ensures the most recent data is available.
5.1.6 STATUS LINE
The bottom of the screen contains a one line
status box. Relevant status information is
displayed.
5.1.7 EXAMPLES
Following is a description of what nodes need to
be entered for various communication
configurations. Network descriptions can use
multiple serial ports. For example, a modem on
COM1 can communicate with a network of
dataloggers via telephone lines while a RF base
on COM2 uses radio to communicate with other
dataloggers. The PC1 (computer) node is
present in all networks.
SECTION 5. NETADMIN
Direct Connect (SC32A) − Each remote datalogger is entered as a node (child node of PC1).
No other nodes are necessary. Each datalogger (each on its own serial port) has its own
polling interval.
Phone Modem (DC112) − Enter a node for the
phone modem at the computer site (phonebase). Each remote datalogger will be entered
as a child node of the phone-base node. Each
remote will have its own polling interval with no
polling interval for the phone-base. See Section
4.1.2 for more information on scheduling.
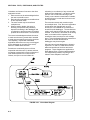
RF (radio frequency) − Enter a node for the
RF232T (RF base station) as a child of the
computer. The polling interval is entered for the
base and will be used to poll all the dataloggers
that communicate with the base.
NOTE: For RF Radio frequency, poll at
least every 20 minutes.
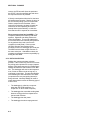
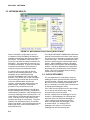
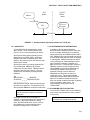
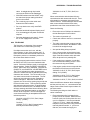
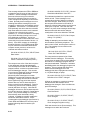
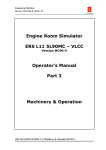
Repeater only sites (no CR10T) are not entered as
nodes. Enter a node for each remote datalogger.
To use a repeater (either a repeater only site or a
CR10T/ RF95T site), enter the communication
path as part of the node description for the site
being communicated with. Enter the communication path in the VIA RF network parameter as a
series of repeater IDs separated by commas. End
the string with the ID of the remote site. For sites
not using repeaters, just enter the ID of the remote
RF95T as the VIA RF network parameter. A
RF95T ID is determined by its switch settings. See
the RF manual for infor-mation on how to set the
switches. In Figure 5-2, a remote site (station
name of Logan) has its switches set as ID 1. The
communication path is through a repeater with the
switches as ID 4.
Multidrop (MD9) − Set the base MD9 address to
255 and set each remote so the addresses are
unique. Enter a node for the base MD9. Enter the
remote nodes as children of this node. Enter the
address (switch setting) for each remote in the VIA
MD9 parameter. See the MD9 manual for information on setting the switches. Each remote
CR10T will have its own polling interval.
Phone to RF or Phone to MD9 − Enter a node for
the phone modem. Enter Phone to RF base or
Phone to MD9 base as a child of this node. The
remote sites are children of this node. Phone to RF
and Phone to MD9 with measurement capability (a
CR10T at the site) is NOT supported by RTMS.
When the network description is complete, save
the description. Next select the option to
MAKE THE OPEN NET DESCRIPTION
ACTIVE. Both options (save and make active)
are found under the FILE selection on the main
menu. The status line at the bottom will confirm
these actions. This window can now be closed.
FIGURE 5-2. Editing a Sample RF Network
5-5
SECTION 5. NETADMIN
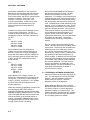
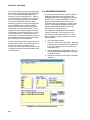
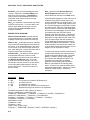
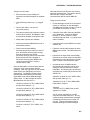
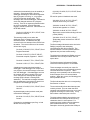
5.2 NETWORK HEALTH
FIGURE 5-3. Main NetAdmin Screen Showing Network Health
When a description is made active, the communications module (DLSMGR) will attempt to
establish communication with each new station in
the network. The NetAdmin main screen (see
Figure 5-3), will show each station entered in the
description. The stations will be black until communication is attempted. A green color indicates
successful communication, blue indicates a
warning occurred, and red indicates a fault.
If a station is blue or red, there will also be
warning or fault message generated. These
messages can be viewed by selecting
STATUS/ WARNING/FAULT from the VIEW
submenu. See Section 5.5 on SWF messages.
The net description should also be checked to
ensure the affected station was entered
correctly. Check the path, dialing strings, and
switch settings. Repeat the "make active"
procedure if any corrections are made.
A flashing indicator (the Memory Low Indicator)
will give warning when less than 2 megabytes of
virtual memory is available. OS/2 attempts to free
memory by swapping block to the hard disk. Low
virtual memory can indicate that hard disk space
is low. This may also be a sign that too many
programs are being run concurrently. Long term
operation with insufficient memory or hard disk
space is not reliable. The indicator appears in the
bottom right corner of the Communication and
Data Collection box.
5-6
The PAUSE NETWORK COMMUNICATION allows
pausing communication to all nodes in the network.
The pause time is increased by dragging the "slider"
control to the right. The box below the control indicates how much longer the communication will be
paused. When DLSMGR is started, it will pause
before starting communication with the datalogger
network. This allows NetAdmin to be started and
the paused time increased before communication
begins. This is only important when preventing
communication is necessary.
5.3 CLOCK SET/CHECK
For most applications it is important to keep the
datalogger's clocks synchronized with each other
and the computer. However when manually setting
the clocks or when scheduling unattended clock
sets, it is important to consider three consequences
of changing the datalogger's clocks.
First, make sure the computer clock is set correctly
as it is used as the reference time. Many
computers have inaccurate clocks.
Second, consider when the datalogger's clock is
changed. If the dataloggers are collecting data,
setting the clock may cause the datalogger to
miss or cause an extra output interval if the
clock is changed when the datalogger is near
an output interval. For example, if the
datalogger clock says it is 12:01 and the
datalogger has just stored hourly data
SECTION 5. NETADMIN
FIGURE 5-4. Clock Check/Set View
(at 12:00) setting the datalogger clock back to
11:59 will cause an additional 12:00 output to
be stored. The datalogger will store correct
data based on the number of samples, etc. but
two records will have the same time stamp of
12:00. The clock set utility allows the specification of when the clocks are automatically set.
Third, if the datalogger clock is outside the allowable tolerance (specified as the SET CLOCK IF
MORE THAN ___ SECONDS OFF parameter), the
clock set utility will attempt to set the clock (several
times if necessary) until the clock is within the
allowable tolerance. Even though it compensates
for the telecommunication link in use, if the
tolerance is too tight the clock utility maybe unable
to set or even check the clock accurately enough.
For example, it is difficult to set the clock at a
datalogger site where the communication path
utilizes several radio repeaters, to within one
second of the computer clock. With radio, a
tolerance of 5-10 seconds is more practical.
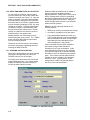
To set or check the datalogger clocks, select
CLOCK SET/CHECK from the VIEW sub menu. A
list of stations with clocks will be displayed in the
CHECK STATIONS box (see Figure 5-4). Select
all the stations where the clock will be set or
checked according to the computer's clock. The
ALL or NONE buttons can be used to select all or
none of the stations at once. Individual stations
can be selected or unselected by clicking on them.
If the SET CLOCK button just below the CHECK
STATIONS BOX is checked, the clocks will be set
if they are off by more than the value specified in
the IF MORE THAN _____ SECONDS OFF box.
Otherwise the clocks will just be checked.
Select CHECK CLOCKS NOW button to start
setting or checking the clocks. As each clock is
done a message will appear or will be updated in
the SUMMARY OF CLOCK CHECK ACTIVITY box
on the right part of the screen. Existing messages
for clocks being set are colored blue until the
operation is complete. The message will then be
colored black. If a clock cannot be set/checked, it
will be retried until the RESCHEDULE WDOG
period (watchdog period), specified in the lower left
hand part of the screen, elapses. If this occurs the
clock set for that station will be moved to the end
of the queue (list of clocks to be set) and the clock
set will continue with next station. This can be
done manually by selecting the RESCHEDULE
buttons in the CURRENT TRANSACTION box.
The CANCEL button there will cancel the current
clock set/check. Until the watchdog period
elapses, clocks will be retried at the intervals
specified in the network description.
5-7
SECTION 5. NETADMIN
You can manually force a retry by selecting the
KICK button in the CURRENT TRANSACTION
box. The STATION box displays the clock
set/check currently being worked on. Stations
will be retried each time they come to the top of
the queue until they succeed or are canceled.
The CANCEL PENDING CHECKS can be
selected to cancel all remain clock sets/checks.
If the AUTOMATICALLY CHECK CLOCKS
button is checked, the selected clocks will be
checked/set on the defined schedule. Enter a
starting time and interval just below the button.
The starting time box allows the day, hour, and
minutes to be entered. The interval box has
units of days. Each time the entered number of
days elapses, the clocks will be set/checked at
the time specified in the starting box.
Once the options have been selected, the clock
window can be closed. The selected operation
will continue as long as NetAdmin is left
running. The bottom line of the clock set screen
is a status line that will indicate the status of the
current operation.
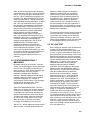
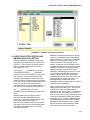
5.4 PROGRAM DOWNLOAD
The Program Download View is used to transfer a
datalogger program from the computer to the
datalogger (Download). Datalogger programs are
created on the computer with EDLOG. The programs are then transferred over the telecommunications link to the datalogger. No site visit is
required. The download window is displayed by
selecting PROGRAM DOWNLOAD from the
VIEW sub menu (see Figure 5-5).
The displayed sub window has a list of station
names, files with the “.DLD” extension, and a
list of disk drives and sub directories. For each
station needing a program downloaded, use the
following steps:
1. Select the desired station.
2. Select the “.DLD” file for that station. Selecting
a different drive or sub directory will update the
list of “.DLD” files with those contained in the
selected directory.
3. Add the station and accompanying “.DLD” file
to the DLD DOWNLOAD QUEUE by selecting
the INSERT button.
4. Repeat the process for each station requiring a
download.
FIGURE 5-5. DLD Program Download View
5-8
SECTION 5. NETADMIN
When all stations that need to have programs
downloaded are in the queue, select the START
button. The programs will be downloaded one
at a time. When a download is complete it will
be listed in the .DLD PROGRAM STATUS box
at the top of the window. This will replace any
earlier message regarding the station. A station
and “.DLD” file combination can be removed
from the queue by highlighting it and selecting
the DELETE button. The status line on the
bottom of the window will give information on
the current download. Once the start button
has be selected, the DLD PROGRAM
DOWNLOAD window can be closed at any
time. The downloads will continue as long as
NetAdmin is left running. A message indicating
successful download (including program
signature) will be displayed in the STATUS
WARNING FAULT message window.
NetAdmin will attempt to download each
program file until it is successful or the user
cancels that particular operation. If a site
cannot have a program downloaded (e.g., does
not respond), the other downloads following it in
the queue will not be attempted until the
download being attempted succeeds or is
canceled.
5.5 STATUS/WARNING/FAULT
MESSAGES
Messages relating to the computer, communications, and the dataloggers can be viewed and
stored to disk. Messages are classified as a
status, warning, or fault. Status messages give
information about clock sets, program
downloads, and datalogger data being
collected. Warning messages indicate that a
potential problem occurred or that something
unexpected happened. For example, a
communication retry occurred. Fault messages
indicate that an operation failed. Most
operations are retried after a fault.
Select STATUS/WARNING/FAULT from the
VIEW menu to display a list of these messages.
Clicking on any message or on the scroll bars
on the right side of the window will pause the
display of new messages at the end of the list.
To resume the display, select the VIEW END
OF LIST button on the bottom of the screen.
When this button is checked, the newest
messages will be displayed as they arrive.
The SETUP... button displays the setup window
when selected. The setup window allows the
selection of what messages are displayed.
Selections include which type of message
(status, warning, faults), which stations the
messages are about, and which stations the
messages are from. When the OK button is
selected, the display window is updated to
reflect current choices. NetAdmin buffers the
last 100 messages of each type regardless of
the setup selections, so it is possible to change
the selections and see a different display of the
same group of messages.
The messages logged to disk are also filtered by
the setup selections. The selections that are
current when the message arrives determine
whether the message is written to disk or not.
When logging messages to disk, they are written
to a file named SWF$.log (see Section 8.1).
5.6 RF LINK TEST
Before adding RF stations to the net description
or when checking existing stations, it is
desirable to test the radio communication path
to a site. Found on the NetAdmin VIEW menu,
this option allows low level testing of radio links.
Stations and repeater only sites can be tested.
Stations being tested do not have to be entered
into the NetAdmin description but the RF BASE
station does. To perform a test, select the
RFBASE station from the list of stations
displayed under the caption "RFBASE
STATION". Enter the address of the remote
RF95T to test in the [REPEATER] SWITCH
SETTING: box. To test a link using repeaters,
enter the repeater address or addresses
followed by the remote address. Separate
addresses with a space. Select the BEGIN
button to start the test. The results will be
displayed in the TEST STATUS/RESULTS
window at the bottom. A row of five numbers
will be returned for each RF95T in the test,
including the RF BASE. The first number in
each row indicates the size of the packet and
should be around 238, depending on the link
tested. If it is about one half that size or
smaller, then there is probably outside
interference on the frequency in use. The next
four numbers indicate the quality of the link and
should be around 80 to 125 (see Section 8.4).
Poor numbers here can indicate antenna, power
problems, or bad communication path. The
rows of numbers start at the remote and work
back to the RFBASE. Results are also written to
a file (see Section 8.1).
5-9
SECTION 5. NETADMIN
The RF Link Test also returns the signature of
the prom in the Remote RF95T. Featuring the
RFBASE address in the switch setting box will
file the signature of the prom in the RFBASE.
5.6.1 KEYBOARD/DISPLAY
5.6.2 NETADMIN COMMAND LINE
PARAMETERS
OLETS - Show options for OLETS
communication.
LT1 - Show options for Level Tech hardware.
This option provides CR10KD emulation on the
computer. The menu allows the selection of the
station to be communicated with.
FIGURE 5-6. Radio Link Test View
5-10
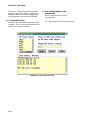
SECTION 6. RTM (REAL TIME MONITOR)
RTM is used to monitor data values from stations in the RTMS network. RTM offers a variety of data
displays including strip charts, bar charts, numerical displays, X/Y plots, etc. Multiple data displays, text,
rulers, and drawings (maps) can be combined by the user into a single template (Figure 6-1). Once created, a template can be named and saved for later use.
RTM has two modes; Edit and Monitor. The mode is changed from the mode submenu, accessed by
selecting MODE on the main menu.
6.1 EDIT MODE
The edit mode is used to create new templates
or edit existing templates. RTM automatically
enters the edit mode when it is started. When
RTM is monitoring, selecting EDIT from the
MODE submenu will halt the monitoring and
RTM will enter the edit mode.
6.1.1 BACKGROUND COLORS AND BITMAPS
(MAPS OR DRAWINGS)
Normally RTM templates have a solid white
background. Select BKGND COLOR from the
OPTIONS submenu (on the main menu) to
change the background color. If desired, a map
or drawing can also be used as the background
to give additional information about the
displayed data. For example, a map may be
used to show where the data was collected.
RTM will display .BMP type files. Many paint
and screen capture programs create .BMP files.
For example the paint program supplied with
WIN-OS2 can create bitmap files. Bitmaps are
added by selecting BITMAP BKGND from the
submenu displayed when OPTIONS is selected
on the main menu. Bitmaps are referenced to
the lower left corner of the display and must be
large enough to cover the desired area.
FIGURE 6-1. RTM Template Using Strip Chart, Bar Chart, and Numerical Displays
6-1
SECTION 6. RTM (REAL TIME MONTIOR)
6.1.2 CREATING A TEMPLATE
Creating a template consists of adding the
desired displays to the template. Data displays
are used to display data retrieved from the
dataloggers or to issue control commands to a
datalogger. This includes numeric, bar chart,
strip chart, X-Y plots, and other displays.
Accessory displays are used to enhance data
displays and give information about the computer.
Accessory displays include rulers (scales), text,
and computer date/time. Adding a new display
(either type) uses four basic steps repeated for
each display added. The four steps are:
1.
2.
3.
4.
Select the display to be added.
Position the display.
Describe/define the display.
Size the display.
6.1.3 SELECTING A DISPLAY
While in Edit mode, the cursor gives a visual
indication of the currently selected display type
while the cursor is positioned in an unused area
of the template. A display of the currently
selected type may be placed without using the
menu. If a different type display is desired,
move the cursor to 'INSERT' on the main menu.
The cursor will change back to the standard
pointer when the cursor leaves the template
area. Selecting INSERT gives a list of the
available displays. Highlight and select the
desired display. This becomes the default
display type until a different display type is
selected. The cursor will give visual confirmation of the display type selected when it is
placed back in the template area.
6.1.4 AVAILABLE DISPLAYS
The following displays are available under the
INSERT submenu:
NUMERIC − Displays single numeric field with
label. Allows color of label to be selected.
Display grays when data becomes old. Used to
set alarms. Label text color can be selected.
NUMGROUP − Used for easy selection of
multiple numeric fields from same datalogger
and table. Automatic arrangement and labeling
of fields.
BIG NUMERIC − Uses a large font, making
single numeric display stand out and easy to
read.
STRIP CHART − Plots up to 12 traces against
time. Each display can have a separate color
6-2
and separate Y axis. Simple cursor mode allows
numeric display of trace values.
X-Y PLOT − Plots points based on two fields;
one for the X value and one for the Y value.
BAR CHART − Rectangular box with color filled
height proportional to value. Allow selection of
color, minimum value, and maximum value.
PORT OR FLAG − Displays port or flag status.
Optionally allows port or flag to be toggled with
mouse. Ports and flags can be labeled for easy
identification.
INPUT LOC − Displays single numeric value.
Allows value to be edited, changing value in
datalogger.
CONTROL − Allows port, flag, numeric value
conditions in one datalogger to be used to
change port, flag, or Input location in another
datalogger.
RULER − Used to add scale to bar chart, etc.
Horizontal or vertical orientation with user
specified number of tick marks.
WIND VECTOR − Compass-like display of wind
speed and direction. Also numerically displays
wind speed and direction. Optionally leaves
dots for up to 99 values giving some historical
information.
RECORD DISP − Tabular display of entire data
table. Will scroll vertically through buffered
records. Buffers as many records as will fit in
32K characters. Scrolls horizontally for tables
wider than display.
TEXT − Places text on template. Allows
selection of text color.
TIME ON LAST REC − Gives time stamp of last
data received from selected station.
CURRENT TIME − Displays computer time
information on template.
6.1.5 POSITIONING THE DISPLAY
Once the display type has been selected, a
display of that type can be placed on the
template. A display is placed by moving the
mouse cursor to the desired position on the
template and clicking the left button once. The
mouse cursor position is where the lower left
hand corner of the display will be. A dialog box,
used to define the display, will appear when the
button is clicked. After the dialog box is filled
out, the actual display will appear.
SECTION 6. RTM (REAL TIME MONITOR)
FIGURE 6-2. RTM Screen Showing Station.Table.Field for a Numeric Display
To move a display, place the mouse pointer on
the display and click the left button. A four-headed
arrow will appear. Press and hold the left mouse
button and drag the display until it is in the desired
location. Clicking on some areas of the display
may not show the arrow, for example, the actual
strip chart area of the strip chart. Experience will
show which areas can be used. Dragging can be
used to position the display anywhere on the
screen; even on another display or partially out of
the template area. However, the part that is
partially covered will not be updated when
monitoring is started.
6.1.6 DEFINING THE DISPLAY
Each data value displayed must be defined in
terms of a Station.Table.Field expression.
These are selected from lists of those that are
available. These data display definitions can
also contain math expressions. The following
displays do not support expressions:
NumGroup
StripChart
Port/Flag
Input Loc
Ruler
RecDisplay
Text and Time of Last Rec
For example the expression "(DALLAS.MIN.TEMP)
*1.8+32" would take the temperature collected from
a station named "DALLAS", and convert it to
Fahrenheit. Available operators and functions are
listed below. Expressions may optionally contain
parentheses and floating point constants (e.g.,
Station.Table.Field - 32/1.8).
Available Operators and functions are: +, -, *, /,
>, >=, =, <=, <, <>, Not, Mod, Or, PF, Xor, And,
Sin, Cos, Log, Sqrt, Exp, Abs, Ave, Time, Pow,
and Trunc.
The resulting value could then be displayed with
any of the displays (e.g., bar chart). The
"(DALLAS.MIN.TEMP)" part of the expression is
a data value from a station named "DALLAS"
with a table named "MIN" (minute output) and a
field named "TEMP" (temperature).
6-3
SECTION 6. RTM (REAL TIME MONTIOR)
The Station.Table.Field can be selected from a
list of those available (see Figure 6-2). This list
is displayed by double-clicking in the FIELD
IDENTIFIER OR EXPRESSION box or by
selecting the DATA TABLE DEF'S button.
Selecting a station, table, or field from the list,
inserts that definition (as if it had been typed in)
at the cursor in the expression box. It does not
remove previous selections or entries. Be sure
to completely erase the old expression if
entering a new one. The expression box allows
cursor movement and editing. If the
Station.Table.Field elements are entered
manually be sure the case matches that given
in the lists as these elements are case
sensitive.
6.1.7 SIZING THE DISPLAY
In addition to the Station.Table.Field definitions,
a display may require high-low limits, alarm
limits or other parameters. Accessory displays
may require parameter regarding units, size, or
similar questions. Use the mouse or the TAB
and SHIFT-TAB keys to move the cursor from
parameter to parameter. When finished filling
out the parameters, select the OK buttons to
close the dialog box and show the display.
Pressing CANCEL or DELETE will remove a
new display.
6.1.8 EDITING EXISTING DISPLAYS
Once a display has been placed, and the dialog
definitions complete the final display will appear.
Some displays are sizable. If a display is
sizable, a sizing border will appear around the
display when it is selected. When the mouse
pointer is placed on this border, it will change to
double headed arrow indicating the axis
(horizontal or vertical) in which the display can
be sized. Click and hold the left mouse button
while moving the mouse (dragging) in indicated
direction to increase or decrease the size of the
display along that axis. Dragging on a corner of
the sizing border allows the display to be sized
along both axes at once.
While in the edit mode, existing displays can be
sized, moved, edited, or deleted. The techniques
to move or size the display are explained in the
sections on placing and sizing the display. To edit
a display's definition, select the display and then
select EDIT PARAMETERS from the COMMANDS
sub menu or double click the left mouse button
with the pointer on the display. The dialog box will
appear and the parameters can be edited (see
Figure 6-3). Press the OK button to use the
changes and show the display. Press the
CANCEL button to disregard the changes and use
the previous definition. Press the DELETE button
to remove the display completely. Deleting an
existing display will display a window asking for
confirmation of the deletion.
6.1.9 LOADING AND SAVING TEMPLATES.
FIGURE 6-3. Multipen Strip Chart Definition
6-4
Once created, a template should be saved.
This allows the template to be used again
without having to place and define all of the
displays. If the computer loses power (power
failure), is turned off, or is rebooted the current
template will be lost if it has not been saved.
Select the FILE option from the main menu and
a menu of file options including those to LOAD
and SAVE template will be shown. Selecting
SAVE allows a new template to be named and
saved, or an existing template to be saved with
the same name. The SAVE AS option allows a
template to be saved with a new name. The
LOAD option allows a different template to be
loaded. Loading a different template will erase
the current template if it is not saved first. The
NEW option clears the current template so a
new template can be started. The current
template will be lost if not saved before NEW is
selected.
SECTION 6. RTM (REAL TIME MONITOR)
6.1.10 STARTING RTM IN THE MONITOR MODE.
RTM normally starts in the edit mode. To have
RTM automatically start monitoring a given
template, enter the template name along with a
/F in the OS/2 setting for RTM. For example, to
have RTM start monitoring with a template
named LOGAN, the following would be entered
in PARAMETER box under the OS/2 settings
for RTM:
/F LOGAN
The .RTM extension is optional. The OS/2
setting for RTM are accessed by clicking the
right mouse button on the RTM icon. Then
select OPEN followed by SETTINGS. Select
the PROGRAM tab and fill out the
PARAMETER box.
Once these settings are done, RTM will load
and run the template when the associated RTM
icon is double-clicked. Different RTM icons can
be configure to load and run different templates.
These settings also allow RTM to start
monitoring with a template when it is restarted
automatically by OS/2 (i.e., following a power
failure). See Section 2.3 of this manual on
Restarting OS/2 in the Installing RTMS.
OPTIONS Sub Menu
Enabling HIPRIORITY (enabled when check
mark is visible) causes DLSMGR to attempt to
get data as rapidly as possible for the data used
on the current template. This must be selected
while in EDIT mode. By default, HIPRIORITY is
not enabled.
Enabling BACKFILL (also uses check mark)
causes RTM to request historic data from the
datalogger(s) to fill in all strip charts when
monitor mode is started. This may take a
minute or two depending on the number of
traces, dataloggers, and communication links.
This must be selected in EDIT mode.
BACKFILL is only done for interval tables.
Tables that output every execution or based on
a flag will not backfill.
The BKGND COLOR selection allows the
background template color to be selected. The
default color is white.
The BITMAP BKGD selection allows a .BMP file
to be displayed as the template background.
6.2 MONITOR MODE
When a template has been created (and saved)
monitoring can be started by selecting
MONITOR from the MODE submenu. The data
displays within the template are updated as
data is acquired from the dataloggers via
DLSMGR. The rate at which the data displays
will be updated depends on the frequency of
update of the data value in the datalogger, the
interval at which the datalogger is polled, the
HIPRIORITY setting, and the communication
path to the datalogger.
While RTM is running (in the Monitor mode)
display information will be updated whether the
display is visible or not. Monitorings continue
even if RTM is 'Minimized' (reduced to an icon)
or covered by another application. Alarm limits
will be checked and alarms requiring
acknowledgment will be displayed. When the
template is visible again the displays will be
updated so they are current.
Displays can be moved and sizable displays
can be sized while in monitor mode. Templates
may also be saved. Parameters cannot be
edited, however.
6-5
SECTION 7. DATA COLLECTION (DBSELECT)
DBSelect is used to select the data for archival or routing to a different application or a different computer.
7.1 POLLING, HOLE DETECTION, AND
HOLE COLLECTION THEORY
•
If DBSelect is stopped, the data stored
while DBSelect is stopped up to the new
Data Advise will be a hole.
The data collection done by DBSelect consists
of two processes; polling and hole collection.
DBSelect makes full use of polled data since it
provides the most efficient means of data
collection. DBSelect will also optionally use
hole collection to collect any data unavailable
with polling.
•
If DBSelect or any other program is
changed so its data requirement from a
datalogger changes, a new Data Advise will
be sent to that station. Changing from the
old Advise to the new Advise may cause a
hole that will be hole collected.
•
When a program is downloaded to a datalogger or if data cannot be collected for a long
period from a datalogger, it will cancel the
current data advise. The data stored will be a
hole until it receives a new Data Advise.
•
Any data sent from the datalogger but not
received or not correctly received by
DLSMGR (i.e., signature fails) will be a
hole. These occurrences are minimized by
local retries, signature checking, and error
detection.
After the user specifies what data is needed,
DBSelect sends a description of the data it
requires to DLSMGR. DLSMGR combines this
request with any requests for data from any
other programs (i.e., RTM) and advises each
datalogger what data is required from it. This is
done with a command known as a "Data
Advise". After being advised, the dataloggers
are checked for Data Advise data or "polled" at
the user specified polling interval. When polled,
the datalogger returns any advise data it has
stored since the last time it was polled. Since
the datalogger was advised before polling only a
simple short exchange is needed to check for
new data. In RF a poll can be broadcast.
When only polling is done, data stored in the
CR10T before the Data Advise will not be
collected. Despite retries, any data missed
because of adverse conditions encountered
during the polling process will not be collected
by polling. These holes may be acceptable if
receiving new data (for DBSelect or RTM) as
rapidly as possible is more important than
having a complete archive of old data. If it is
desirable to maintain a complete archive of
data, hole collection should be enabled along
with polling. When hole collection is enabled,
DBSelect will attempt to collect any data
records it determines are missing from the data
collected by polling (holes). Typically hole
collection is needed to collect data caused by
the following events:
•
When first starting DBSelect, the data
stored since the datalogger was
programmed until it receives a new "Data
Advise" (containing DBSelects
requirements) will be a hole.
Using hole collection, DBSelect can collect the
specific data records that are missing. Hole
collection happens concurrently with polling,
allowing newly stored data and older hole data
to be collected at the same time. Programs
requiring new data do not have to wait for the
missing hole data to be collected. The hole
collection process is slower and uses more
system resources than polling. In a normally
functioning network most data will be collected
with polling. Hole collection is the infrequent
exception, usually occurring as the result of a
user initiated change and occurs with small
holes that are rapidly filled. Usually, it is
possible to use hole collection and polling
without sacrificing timely data collection.
A user-entered polling interval (entered in
NetAdmin) determines how often the CR10T is
polled for data. Specifying a short interval will
reduce the time the stored data waits in the
CR10T before it collected thus reducing the
time before it is received by RTMS. However
short intervals (faster polls) also cause an
increase in network activity and battery drain
and can affect how long hole collection takes.
7-1
SECTION 7. DATA COLLECTION (DBSELECT)
A typical data collection sequence would be:
1. A Data Advise is sent to each station.
2. DLSMGR polls for data at the user entered
interval.
3. When data is received DLSMGR sends the
data to the module (i.e., DBSelect) that
requested the data.
4. If DBSelect detects that the data it received
was not the data it expected (i.e., one or
more records are missing) a hole collection
is started.
5. The polled data is stored in the shadow files
or sent through the Named Pipe.
6. When hole collection data is received, it is
also stored in the current shadow file or
sent through the Named Pipe. Polling
continues during the hole collection
sequence.
7.2 DATA FILE NAMES, HEADERS,
BALING, AND ARCHIVING
Data files are stored in ASCII in a comma
delineated format. Each file has an ASCII
header describing the field's names of data
contained in the file. Section 8.6 gives a
detailed description of the header and file
format. The DBSelect ASCII Data files are
suitable for archiving or importing to spreadsheet or other analysis software
When ASCII data files are created, DBSelect
continuously stores the data. Periodically it
produces (bales) data files that the user (or user
application) can access.
DBSelect stores the baled files for a particular
station in a subdirectory with the station's name.
A data file name consists of a filename (up to 8
characters) and a 3 character extension
(name.ext). The filename matches the table
name and the extension is a 3 digit number
(000-999) chosen to make the filename with
extension unique. For example, the first baled
data file from a table named 'HOURLY' in a
station named 'Dallas' will be stored in a sub
directory DALLAS\ in a file named
'HOURLY.000'. When data from a different
table at the 'Dallas' station is collected it is
stored in the same sub directory with an
appropriate filename. DBSelect will store the
next baled file with the next available extension.
When all 1000 file extensions are used the
oldest file will be overwritten.
7-2
DBSelect should produce a complete set of
data, however the records may not be sorted by
time and may be found across multiple baled
files. This is due to hole collection. A separate
utility EXTRACT.EXE can be used to sort,
merge, and check baled files producing a single
data file (see Section 8.2). DBSelect does not
use these files once they are baled. The baling
takes place on a user specified interval.
Between the times when DBSelect bales files
(during the baling interval), DBSelect stores the
data it collects in temporary or 'shadow' files.
These files, located in user selected directories,
should not be accessed by anything other than
DBSelect. A BALE NOW button is available if
current data is needed before the next time to bale.
After each baling, DBSelect will start execution of a
REXX file named "BALEEXIT.CMD". This can be
used to process or move the baled files.
7.3 RUNNING DBSELECT
Double click on the DBSelect icon. If DBSelect
has been run before, it will use the same settings
it used previously and resume collecting data
automatically.
7.3.1 SELECTING THE DATA'S PRIMARY
DESTINATION
DBSelect will collect and deliver a complete set
of the selected data to one of two destinations;
ASCII files or an Acknowledged Named Pipe.
DBSelect can only supply a complete set of
data to the selected destination. Only one of
these destinations maybe selected. When this
destination is changed, DBSelect will not resend
all data that was previously sent, so it is
important to have this set correctly.
7.3.2 ACKNOWLEDGED NAMED PIPE
The Acknowledged Named Pipe is used with
TCP\IP links to other computers or with custom
user supplied software such as a program to
feed the data to a commercial database (see
Figure 7-1). Select NAMED PIPE
ACKNOWLEDGED from the FILE menu to
enable the acknowledged named pipe. The
software receiving the data from the named
pipe (Named Pipe Client program) must also be
started. The protocol used with the named pipe
is found in Section 8.5. Sample source code for
client software is available, including C source
code for TCP\IP server and REXX source code
for an IBM DB/2 database feed program. The
pipe name is "\PIPE\RTMS."
SECTION 7. DATA COLLECTION (DBSELECT)
DBSelect
VAX,OS/2,
HP9000, ...
machine
OS/2
Machine
Ack. Named Pipe
TCPC or user
TCP program
TCPS
TCP\IP Network
FIGURE 7-1. Example Named Pipe Client Software for TCP/IP Use
7.3.3 ASCII FILES
To use ASCII files as the destination, select
ASCII FILES... off the FILES submenu (see
Figure 7.2). Fill out the parameters as follows:
Specify the location (parent directory) for the
'baled' files for the BALE PATH: parameter.
DBSelect will create a subdirectory for each
station in this directory where the data from that
station will be stored.
Specify the location for pending (shadow) files.
Like the bale path, DBSelect will create a
subdirectory for each station. DBSelect stores
temporary data in these locations. The files
should not be accessed by anything besides
DBSelect.
The
BALE EVERY: _______ MINUTES
STARTING _______ MINUTES AFTER
_________________
Entries allow an interval, offset and starting time
for baling to be specified. This determines how
often and when DBSelect will produce baled files.
NOTE: The ASCII FILES ENABLED button
must be checked for data to be stored in
ASCII files.
Select OK to accept and use changes or
CANCEL to disregard settings and use previous
selections. When data collection is taking
place, the BALE NOW button can be select to
force DBSelect to produce baled files now
instead of waiting until the next interval.
7.3.4 SECONDARY DATA DESTINATIONS
In addition to the two data destinations
described above, DBSelect will also route data
to two secondary destinations; an unacknowledged named pipe and DBSelect$.LOG ASCII
files. DBSelect does not track what data is sent
to these destinations that may result in duplicate
or missing data. DBSelect will send all data it
receives through an unacknowledged named
pipe regardless of whether a program is in
place to receive it. If selected (FILE submenu)
DBSelect will store all data it receives in files
named DBSelec0.log through DBSelec9.log
overwriting the oldest if all ten files exist,
otherwise creating a new file when the
DBSelect$.LOG file gets to be about 1.2
megabytes in size. The unacknowledged
named pipe and the DBSelec$.log files have
data from all station and tables intermixed.
Each row of data contains information regarding
its source (Station, table, fields). The
unacknowledge named pipe name is
"\PIPE\RTMA."
7.3.5 ENABLING HOLE COLLECTION
The COLLECT HOLES button on the DBSelect
main screen must be selected if hole collection
is to be used.
NOTE: If hole collection is not enabled an
incomplete set of data will be stored.
7-3
SECTION 7. DATA COLLECTION (DBSELECT)
7.3.6 SELECTING WHAT DATA IS COLLECTED.
To select data for collection, select a station
(from the station list in the left box) where data
collection is desired (see Figure 7-3). Once the
station is selected, a list of the tables available
from that station is displayed in the middle box.
Select the table to be collected. Multiple tables
may be selected by holding the CTRL key while
clicking on the tables. To add a selected table
(or tables) to the list of collected tables (right
box) select the button marked >>>>. Doubleclicking on a table will also add it to the list of
selected tables in the rightmost box.
Additional tables from other stations can be
selected using the same process. The *.TABLE
button will select tables with the same name
from the remaining stations.
Tables can be removed from the list of tables
that will be collected by highlighting them and
selecting the DELETE button.
7.3.7 STARTING DATA COLLECTION
When all the desired tables have been selected
(are listed in the rightmost box), select the
UPDATE button to use the changes.
The status line at the bottom of the screen will
indicate DBSelect status. The network health
displays in NetAdmin should be checked to
monitor the data collection process.
Additional tables and stations can be added or
deleted to the selected table list without
stopping DBSelect. Adding table is done just as
before, deleting tables is done by highlighting
the tables to delete in the right most column and
then pressing the DELETE button. When the
desired changes have been done, the UPDATE
button should be pressed.
DBSelect will stop collecting all data for the
following reasons:
•
DBSelect is closed (not minimized but closed).
•
Less than 5 megabytes of free disk space.
•
The Acknowledged Named Pipe client (e.g.,
TCPS TCP\IP program) is not acknowledging
data and DBSelect can buffer no more data
while waiting for acknowledgment (if the
acknowledged pipe is being used).
If the list of stations and/or tables available in
the network changes, data selected for
collection may no longer be available. In this
case, DBSelect will produce an error message
and keep checking the list of available stations
and tables to see if the data becomes available
again. This continues until the table becomes
available or the list of tables to be collected is
altered by a user. Typically the list of table
changes when a CR10T is powered down or
has a new '.DLD' file downloaded.
FIGURE 7-2. ASCII Files Setup
7-4
SECTION 7. DATA COLLECTION (DBSELECT)
FIGURE 7-3. Selection of Data to be Collected
7.4 HOLE COLLECTION STATUS AND
MANUAL HOLE COLLECTION
Selecting HOLES on the DBSelect main menu
displays the hole collection screen, as shown in
Figure 7-4. The box at the top shows all holes
that are pending including the one currently
being worked on. The
I WILL WAIT _____ SECONDS FOR A HOLE
I HAVE BEEN WAITING _____ SECONDS
parameter boxes give information on the current
hole collection. In the event that the full 900
seconds elapse without the current hole being
finished collecting, DBSelect will move that hole
to the end of the hole queue and proceed with the
next hole. This prevents a hole cannot be
collected from due to communication failure, and
also prevents hole collection at other stations.
The _____ HOLES ARE IN THE LIST
parameter gives the total number of holes in the
queue.
Message relating to hole collection will be
stored in a file named HOLE$.LOG (see
Section 8.1). This log is enabled from the FILE
entry on the DBSelect main menu. If
HOLE$.LOG is enabled, the box on the bottom
right portion of the screen will also display these
messages regarding the detection, queuing,
and collection of holes.
DBSelect will calculate whether the hole data
still exist in a datalogger before attempting to
collect a given hole. If the data is not available
DBSelect will not attempt to collect it. This
reduces unneeded communication in the
network. When this occurs, DBSelect writes a
message indicating the hole was too old to the
HOLE$.LOG file if the log is enabled. When
DBSelect requests a range of data from a
datalogger, the datalogger will return all, some,
or none of the requested data depending on
what is available. How long a given hole is
available depends on the size of the table, and
how rapidly data is written to the table. All
datalogger data is erased when a new
datalogger program is downloaded or if power is
removed from the datalogger.
Users can manually request a range of data by
adding a hole to the hole queue. This is done
by selecting a station and table and then
specifying a start and stop time. The boxes and
buttons to do this are located in the middle of
the hole collect screen. Once the desired range
is specified, selecting the ADD button adds the
hole to the queue. If a hole is added manually
and DBSelect automatically collects the data,
duplicate data will be stored. If the *.TABLE
buttons are selected after selecting a station,
table, and specifying a range of data, a
7-5
SECTION 7. DATA COLLECTION (DBSELECT)
FIGURE 7-4. Hole Collection View
hole of the specified range will be inserted into
the queue for each station in the network with
that table. Selecting one or more entries in the
hole queue and selecting the DELETE button
will remove the holes from the queue. This will
result in missing data if DBSelect added the
holes to the queue.
DBSelect will periodically check for a file named
AUTOHOLE.DAT. If this file exists, DBSelect
will add the holes contained in the file to its
queue of holes to collect. DBSelect will delete
the hole file after it adds the holes to the queue.
Section 8.3 describes the format for this file.
DBSelect Status
Selecting STATUS on the DBSelect main menu
displays information on disk space, rate of disk
usage, ASCII file baling, etc.
Multiple copies of DBSelect and command
line parameters
Under some conditions it may be desirable to
run two independent copies of DBSelect. When
two copies are run, the second copy MUST be
7-6
run in a separate directory and MUST use the
following command line parameters:
DBSelect name directory
where name is used to create the names for the
named pipes (acknowledged and unacknowledged)
associated with second DBSelect. Since named
pipes are global throughout OS/2 the second copy
must have different names even if the named pipes
are not being used. The acknowledged named pipe
"\PIPE\SECOND" uses the name as specified on
the command line. The unacknowledged named
pipe will use name with an 'a' appended to it. If
name were "SECOND" then the acknowledged
name pipe would be "SECOND" and the
unacknowledged would be "SECONDA".'
The directory specifies the directory where
DLSMGR can find its initialization files. This is
necessary when starting the second copy of
DBSelect that is not located in the main RTMS
directory. Each copy of DBSelect keeps its own
initialization files in their respective directories
but DLSMGR keeps its initialization files in the
directory of the program that started it. If the
second copy is started first at a later date,
DLSMGR will look in the second's DBSelect
directory for its files and not find them.
SECTION 8. FILES, PROTOCOLS, AND UTILITIES
8.1 LOG FILES
Log files are produced for several reasons.
Documenting events that occurred is a primary
reason. Logs are also useful as a diagnostic
tool. Some of the logs are optional, stored only
when enabled. Other logs are always active.
Most logs have built-in restrictions that prevent
them from consuming all available disk space
even if neglected.
Most log filenames contain a $ character in the
name. When the file reaches its maximum
allowed size, it is renamed, replacing the $ with
a single digit and the original name is reused.
When the rename is attempted, the oldest
existing file will be overwritten if all the allowable
filenames already exist.
For example, the SWF$.LOG files contain
Status, Warning, and Fault messages. When
this file is about 1.2 megabytes in size, it is
renamed to SWF0.LOG. The next time
SWF$.log is 1.2 megabytes big, it is renamed to
SWF1.log. This continues until files SWF0.log SWF6.log exist because only six SWF log files
can be created (see Section 8.1.1). The next
time SWF$.log gets to be 1.2 megabytes the
oldest file SWF0.log is overwritten and the
process continues. This process ensures that
the log files will not get too big to fit on a floppy
disk and that log files will not consume all hard
disk space if neglected.
8.1.1 NETADMIN AND DLSMGR
SWF$.LOG -- Creates up to six 1.2 megabyte
files containing Status, Warning, and Fault
messages. May be enabled and filtered with
the Status, Warning, Faults submenu in
Netadmin.
IO$COMx.LOG − Where x is the serial port
being logged. Contains a log of actual
communications through serial port. Enabled
and setup on NetAdmin network health screen
(main screen). Will create up to eleven 1.2
megabyte files.
CLKSET$.LOG − Log of each clockset. Does
not log clock checks. Always enabled. Will
create two files each 100k before overwriting
oldest.
LNKTEST$.LOG − Log of quality numbers from
RF link testing. Always enabled. Will create 2
files each 100k before overwriting oldest.
PROGDN$.LOG − Log of each ‘.DLD’ program
download. Always enabled. Will create 2 files
each 100k before overwriting oldest.
POSTED.LOG, HALTED.LOG,
DEADLOCK.LOG − Internal diagnostic
information. Will create one 10k file for each.
After file reaches 10k, no new information will
be logged until file is moved or renamed.
Always enabled.
8.1.2 DBSELECT
HOLE$.LOG − Log of hole collection activity.
Logs the detection, queuing, and removal of
holes from the hole queue. Primarily used as
diagnostic tool. Enable on DBSelect main
menu under FILE menu. Will create up to
eleven 1.2 meg. files.
DBSelec$.LOG − Log of all data collected by
DBSelect. May be used as diagnostic tool,
secondary data storage, or backup. These log
files are not intended to be used as a reliable
source of a complete set of data. Will create up
to eleven 1.2 megabyte files.
DBACK$.LOG − Log's indication of when data
was written to the named pipe and when it was
acknowledged. Used as a diagnostic tool.
Enabled when the Acknowledged Named pipe
is being used and the DBSelec$.LOG is
enabled. Will create up to eleven 1.2 megabyte
files.
QUEUE.DAT − DBSelect will buffer data it has
received but is unable to deliver via the named
pipe. Eventually when buffering is no longer
possible, DBSelect will append this data to
QUEUE.DAT before dumping it. When
enabled, hole collection from the dataloggers is
the primary means to recover this data. When
normal pipe operation is restored, DBSelect will
recollect all data that was not delivered through
the named pipe. If the data is no longer
available for hole collection because enough
time has elapsed that some of the datalogger
data tables have been overwritten, the user may
8-1
SECTION 8. FILES, PROTOCOLS, AND UTILITIES
be able to manually find the missing data in
QUEUE.DAT. QUEUE.DAT is not intended to
be used as a reliable backup for an intermittent
pipe connection. There is no size restriction on
QUEUE.DAT but it does not increase in size
under normal conditions.
8.1.3 RTM
Template.ALM − Where template is the name
of the RTM template detecting the user defined
alarm. Logging of alarms is optional, as part of
the RTM numeric display. This file continues to
grow until manually erased.
8.2 EXTRACT UTILITY
The Extract utility is used to sort, check, and
combine ASCII files created by DBSelect and
GraphTerm when used with a CR10T
datalogger. Extract will take data from multiple
files, sort the data based on the record
numbers, remove any duplicate records and
notify the user of any missing records. A start
and stop time may be specified.
Extract uses command line parameters. The
syntax is as follows:
EXTRACT <source> [<destination> [<begin>
[<end>]]]
Source − Is the name (without extension) of
data files. This is usually something like
"LgrName\TblName".
Destination − Is the complete path and file
name where the extracted records will be
written.
Begin and end − Are times used to specify the
time swath of data to be extracted. Extracted
records will be greater than or equal to 'begin'
and less than 'end'. The date/time field must be
enclosed in quotations if it contains spaces or
commas.
The [ ] brackets indicate optional parameters.
Only the source name is required. The default
destination filename is TEMP.DAT and all
records in the source files are included by
default.
The following gives an example of extracting
data from a site named mtlogan with a table
named one_min:
extract mtlogan\one_min temp.dat "3-8-94
00:00:00" "3-8-94 24:00:00"
8-2
In response, Extract gives the following type of
information:
Extracting 'one_min' from '1994-03-08 00:00:00'
to '1994-03-09 00:00:00'.
Scanned 'ONE_MIN', 181 records, 181 match.
First record starts at "1994-03-08 09:15:00".
Duplicate - "1994-03-08
09:15:00",0,13.44,1,0.017,1
Duplicate - "1994-03-08
09:15:00",0,13.44,1,0.017,1
Duplicate - "1994-03-08
10:04:00",49,12.89,50,0.766
Duplicate - "1994-03-08
10:05:00",50,12.88,51,0.777
Last record is at "1994-03-08 10:06:00".
52 records written to 'temp.dat'.
8.3 FORMAT OF THE AUTOHOLE.DAT
FILE
DBSelect looks for a file named
AUTOHOLE.DAT in its default directory. If such
a file exists DBSelect will read it and insert the
holes described there into the hole queue as if
they had been inserted by hand from the hole
dialog.
The format for the file is a follows:
NOTE: The format for the holes.ini is
identical.
HOLECOLLECT01
{stationname tablename start end flag CRLF}
examples:
HOLECOLLECT01
Stn2 ONESECND 631152000 1262304000 1
Stn2 Status 631152000 1262304000 1
Stn2 TimeSet 631152000 1262304000 1
Stn2 ErrorLog 631152000 1262304000 1
Stn2 ErrorLog 0 12 0
What it means:
The first line of the file is a validity check, this is
HOLECOLLECT version 01. Each successive
line contains:
SECTION 8. FILES, PROTOCOLS, AND UTILITIES
•
•
•
•
•
•
•
•
•
StationName Space TableName Space
Beginning Space End Space Flag.
StationName and TableName limited to 8
characters.
Space is the ASCII space character.
Beginning is the beginning time stamp or
record number.
End is the ending time stamp or record
number.
Flag is a 0 or 1.
Flag of 0 Indicates beginning and end are
Record Numbers.
Flag of 1 Indicates beginning and end are
time stamps.
Time stamps are represented as the number
of seconds since midnight January 1, 1990.
8.4 RADIO TEST RESULTS
Completed link test results are shown in the "Test
Status/Results" box. If successful, test results
show the PROM signature of the RF modem
whose switch setting is last in the RF path, and a
communication "Quality Report" with a record for
each hop specified in the path. The number of
"Quality Records" reported in the test response
depends on the number of RF modems listed in
the RF path. If one remote node is listed in the
command then there will be two quality records.
The first record shows how well the remote node
was able to receive from the base, the second
shows how well the base was able to receive from
the remote. With two or more modems listed in
the path, the first quality record will indicate how
well the most remote modem received. The rest
of the quality records show how well data was
received with each hop going from the most
remote node back to the base. So, if two RF
modems were listed in the test path, there would
be three quality records in the response. The
second quality record would apply to how well the
repeater received from the remote, and the third
record would apply to how well the base received
from the repeater.
A "Quality Record" is made up of five values as
follows:
First Value
Second Value
Third Value
Fourth Value
Fifth Value
test packet size;
front of 2T envelop;
back of 2T envelop;
front of 1T envelop;
back of 1T envelop.
The "test packet size" is usually around 238, but
varies a little depending on network layout. This
value will be half or less of the expected 238 if
packets are being lost for one reason or
another. For example, if packets are being
walked on by outside RF activity, the test packet
will not make it though and will be retransmitted
at a smaller size. Over RF, data is transferred
as a stream of bits encoded into short and long
periods of time between transitions. We call the
short time a "1T" period and the longer a "2T"
period. Each transition is expected to fall within
a certain window of tolerance to be valid. If
there is too much error in the signal and the
transition falls outside its allotted window, the
packet will be in error and be retried. As a
packet is received the RF95T keeps track of the
transition that occurred closest to the front of
the allowable window and closest to the back.
These values are kept for both the 2T and 1T
windows and are the last four values of the
"Quality Record". Both windows are 204 ticks
long, so if the transmission was perfect, the
data envelope front and back would both be
close to 102. The closer the front value gets to
0 and the closer the back value gets to 204, the
worse the quality.
8.5 CSI LOGGER DATA EXPORT
PROTOCOL
The CSI Logger Data Export Protocol (LDEP) is
used on top of network transfer protocols such as
OS/2 Named Pipes and TCP/IP Berkeley Sockets
to transfer datalogger measurement records from
one computer (or process) to another. The
computer responsible for collecting data from the
datalogger network (the server) will make a pipe
or socket connection available. The computer
that receives data (the client) must connect to the
provided pipe or socket to receive data.
The server has the responsibility to see that every
collectable record is collected from the network of
dataloggers. To ensure that all of these records
are transferred to the client, LDEP will make use of
an acknowledgment scheme. The basic idea
behind the protocol is that as each record is sent
to the client, the client will report the Station Name,
Table Name, and Record Number back to the
server after it has secured that record. The server
will use the acknowledgment to mark the progress
of the transfer. When the session is broken, the
server will buffer unacknowledged records until the
connection is re-established. The server will
maintain transfer progress information on disk so
that if the server goes down, it can recover and
continue to transfer all collectable records.
8-3
SECTION 8. FILES, PROTOCOLS, AND UTILITIES
Limitations and issues of concern to the client
application include:
1. Each record must be acknowledged before
the next record will be sent.
2. Records will occasionally be transferred out
of time sequential order.
3. The same record may be transferred
multiple times.
4. When a session breaks, the server's
buffering is limited and may ultimately
depend on buffering in the datalogger and
re-collection to provide as many records as
possible when the session is re-connected.
The record acknowledgment allows the server
to make sure that every record that it intended
to send was successfully received by the client.
This capability, coupled with reasonable
algorithms that make sure every record logged
by the datalogger is received by the server,
allows for reliable data collection.
Records are occasionally sent out of time
sequential order because 1) it allows real time
monitoring to take priority over the collection of
older data missed due to communication
failures, and 2) the user can initiate the
collection (or re-collection) of any records still
buffered in the datalogger. It is hard to predict
just how "out of order" records will get, but
usually, once network communication is stable,
records will come in order and as close to real
time as possible.
There are two reasons why records may be
sent multiple times. First, the server application
is shut down, then brought back up, and
second, the user initiated the re-collection of
records from the datalogger. The mechanisms
used to verify that all records are sent are state
oriented. If the server is shut down in the wrong
state, some states will be repeated, thus
causing the same records to be sent multiple
times. If the initialization files were erased from
disk, then all records still buffered in
dataloggers may be sent again.
Client and server state diagrams are shown in
Figures 8.5-11 and 8.5-12 that document the
states and activities of the client and server
programs. These diagrams are applicable to
either Named Pipe or Socket implementations.
1
The diagramming notation is by Booch who
2
claims to have adopted it from Harel .
FIGURE 8.5-1. Client State Diagram
8-4
SECTION 8. FILES, PROTOCOLS, AND UTILITIES
FIGURE 8.5-2. Server State Diagram
Key concepts from the state diagrams are
shown in the following tables with key words
(bold) from the diagrams.
CLIENT STATE DIAGRAM:
Test For Server Rdy − With Named Pipe and
Socket API's, there will usually exist a function
used to open the pipe or socket. In this state,
the client program should attempt to open the
pipe or socket. If Open Failed, the client
should wait a while (5 seconds) and try again.
Wait For Record − In this state the client is waiting
for the next data record from the server. When a
record is received it should be "secured" (saved to
disk or data base), then an acknowledgment
should be sent back to the server. Once the
server has processed the acknowledgment it will
not send that record again. The client should use
a watchdog timer while waiting for a data record. If
the client is in the Wait For Record state for
longer than expected (RecIntv2) then it should
assume that the server has died and close the
session. This watchdog operation may be difficult
to implement, but it seems that some implementations of pipes and sockets do not properly report a
broken pipe or socket, so the watchdog is
necessary for reliability.
Rec Intv 2 − This is an amount of time greater
than 2 times the expected interval between data
records. It is just longer than the longest period
between records the client would expect to receive
from the server. If the client goes longer than this
interval without receiving a new record then it
should close and reopen the pipe or socket thus
allowing the server to recover if it has broken
Secure Rec − The secure record action is
taken when a Record Rdy event occurs while
the client is in the Wait For Record state.
Before the client sends an acknowledgment to
the server it should secure the data record well
enough so that if a power failure or crash
occurs the data will be safe.
8-5
SECTION 8. FILES, PROTOCOLS, AND UTILITIES
Send Ack − The send acknowledgment action
is done in response to the Record Rdy event,
after the record is secured. In Send Ack the
client forms an acknowledgment record from
information taken from the data record and
sends it to the server.
Stop − It is important to note that the Stop event
could occur at any time. If it occurs while in the
Session Open state then the pipe or socket
should be closed (Close Session) before
program termination.
SERVER STATE DIAGRAM:
Wait For Record Available − In this state the
server is waiting for the next record to become
available from the server's data record source.
Wait For Ack − In this state the server is waiting
for the client to acknowledge that it has secured
the record. If an acknowledgment for the wrong
record comes in, the server will just continue to
wait. After waiting for a minute, the server will reissue the data record and wait again.
Advanced Rec − The advance record action is
executed after the server receives a valid
acknowledgment record from the client while in
the Wait For Ack Record state. This is the
point at which the server makes a note of the
fact that the client has secured a record and the
server relinquishes responsibility for the well
being of that record. The server moves on to
the next record.
Stop − Note that in the Session Open and
Server Registered states there are "exit"
actions that need executed on the Stop event.
Communication between the client and server is
conducted using ASCII records where each
record is terminated by a Carriage Return - Line
Feed (CRLF) pair. Record length varies quite a
bit. For each datalogger record there is exactly
one ASCII record. Because of the Block Mode
Protocol used to communicate with dataloggers,
the maximum size datalogger record is limited
to something less than 1024 field values.
Figuring 6 characters per value, 13 characters
per field name, and 6 characters per field type
designation, a single ASCII record could come
out to be a little longer than 25K characters.
Typical datalogger programming will produce
record sizes of about 150 characters. It would
not be unusual to see records that contain one
or two hundred values that would come out to a
length of 2 to 3K characters in ASCII.
To express the format of ASCII records used for
communication between the client and server,
we will use Extended Backus Naur−Formalism
(EBNF), a notation used to express syntax.
3
This notation was adopted from Wirth , and
extended here a little more by adding a
repetition count preceding some brackets.
EBNF is summarized in the following table
where A, B and C are syntactic entities of the
language being described. Where one of these
entities is a literal string it is enclosed in
quotations.
TABLE 8.5-1. ASCII Record Format
Expression
Means
A = BC
A=B|C
A = [B]
A = {B}
( )
The construct A consists of B followed by C.
A consists of B or C.
A consists of B or nothing.
A consists of any number of B's including none
Brackets used to group sections of an expression
The EBNF description of LDEP syntax is as follows:
Record = (DataRecord | AckRecord) CRLF.
DataRecord = StationName "," TableName " ("FieldSpecs ") VALUES (" FieldValues ")".
AckRecord = StationName "," TableName "," RecordNumber.
FieldSpecs = FieldName " " FieldType {"," FieldName " " FieldType}.
FieldValues = FieldValue {"," FieldValue}.
StationName = Label.
TableName = Label.
FieldName = Label.
Label = Letter { Letter | Digit }.
FieldType = ( "TIMESTAMP" | Decimal | "FLOAT" | "INTEGER" | VarChar ).
8-6
SECTION 8. FILES, PROTOCOLS, AND UTILITIES
Decimal = "DECIMAL(" Digit [ Digit ] "," Digit [ Digit ] ")".
VarChar = "VARCHAR(" Digit { Digit } ")".
FieldValue = ( TimeStamp | RecordNumber | Number | String ).
TimeStamp = "'" Year "-" Month "-" Day " " Hour ":" Minute ":" Second "'".
Year = 4( Digit ).
Month = 2( Digit ).
Day = 2( Digit ).
Hour = 2( Digit ).
Minute = 2( Digit ).
Second = 2( Digit ) [ "." { Digit } ].
RecordNumber = 10{ Digit }.
Number = { Digit } [ "." ] { Digit }.
String = "'" { Character } "'".
A typical data record might look something like this:
Lgr,Sec15 (TMSTAMP TIMESTAMP,RECNBR DECIMAL(10,0),Battery_V FLOAT,Temp FLOAT)
VALUES ('1993-12-08 15:02:00',123456,13.5,72.123)
only without the tabs and carriage return in the middle. One with strings might look like this.
PC1,StatMsg (TMSTAMP TIMESTAMP,RECNBR DECIMAL(10,0),SrcStn VARCHAR(256),AbtStn
VARCHAR(256),Hop DECIMAL(3,0),MessageVARCHAR(256)) VALUES ('1993-12-08
15:02:02.25',13355,'PC1',0,'DBSelect End Pipe Queue Dump')
The acknowledgment records to be sent back to the server for the two records shown above would be:
Lgr,Sec15,123456
and
PC1,StatMsg,13355
8.5.1 IMPLEMENTATION
With RTMS, a Named Pipe version of the
server is implemented in the DBSelect
program. DBSelect is used to select tables that
are made available via the Named Pipe and to
ensure that all collectable records are
transferred to the client.
The name of the Named Pipe provided by
DBSelect is "\PIPE\RTMS". With an
appropriate network operating system this pipe
can be accessed over the network.
DBSelect also provides an unacknowledged
version of LDEP on a pipe named
"\PIPE\RTMA". On this pipe the server sends
data records in the exact same format as
specified by LDEP, but the server does not wait
for acknowledgment records to come back. It
is a simple one way unacknowledged flow that
can be used by programs like "copy".
The TCPS program, when used with DBSelect,
is used to provide the TCP/IP Sockets version
of LDEP. TCPS reads records from the Named
Pipe and writes them to a TCP/IP Socket.
TCPC is an example program used to show
how a user-written client would connect to the
TCPS server.
8.5.2 REFERENCES
1
Booch, Grady 1994. Object-Oriented Analysis
and Design, Second Edition. The Benjamin/
Cummings Publishing Co., Inc.
2
Harel, D. 1987. Statecharts: A Visual
Formalism for Complex Systems. Science of
Computer Programming vol. 8.
3
Wirth, Niclaus 1983. Programming in Modula2, Second, Corrected Edition. Springer-Verlag.
Part 1.3 (A notation to describe syntax).
8.6 SAMPLE ASCII FILE CREATED BY
DBSELECT
The following describes the header found in this
ASCII file created by DBSelect:
8-7
SECTION 8. FILES, PROTOCOLS, AND UTILITIES
•
TOACI1 indicates the file type and is always
present.
•
RECNBR is the field name for the record
number field and is always present.
•
MD91 is the user specified station name.
•
•
Min2 is the user specified table name.
Battery_V -to- Pot are the user specified
field names for each of the fields.
•
TMPSTAMP is the field name for the time
stamp field and is always present.
NOTE: The text names (labels) are quoted
as is the time stamp field. There is a CRLF
after the table name, the last field name,
and separating each record (row of data).
TABLE 8.6-1.Sample ASCII File
"TOACI1","MD91","Min2"
"TMSTAMP","RECNBR","Battery_V","Count_sec","Sine","WindDir","WindSpd","Single_n","Panel_DegC","seconds"
,"minutes","Sawtooth","TC1_F","TC2_F","TC3_F","TC4_F","Pot"
"1994-06-21 09:40:00",54749,13.35,84,0.995,357,13.96,2.486,26.52,0.125,40,0.234,78.12,-7999,-7999,78.34,50
"1994-06-21 09:42:00",54750,13.36,204,-0.407,106.2,4.153,-1.017,26.49,0.125,42,0.567,77.87,-7999,-7999,78.28,50
"1994-06-21 09:44:00",54751,13.35,324,-0.588,73.78,2.885,-1.47,26.49,0.125,44,0.901,77.75,-7999,-7999,78.22,50
"1994-06-21 09:46:00",54752,13.33,84,0.995,357,13.96,2.486,26.29,0.125,46,0.234,77.31,-7999,-7999,77.78,50
"1994-06-21 09:48:00",54753,13.4,204,-0.407,106.2,4.153,-1.017,26.46,0.125,48,0.567,77.62,-7999,-7999,78.15,50
"1994-06-21 09:50:00",54754,13.35,324,-0.588,73.78,2.885,-1.47,26.46,0.125,50,0.901,77.66,-7999,-7999,78.15,50
"1994-06-21 09:52:00",54755,13.35,84,0.995,357,13.96,2.486,26.46,0.125,52,0.234,78,-7999,-7999,78.23,50
"1994-06-21 09:54:00",54756,13.41,204,-0.407,106.2,4.153,-1.017,26.43,0.125,54,0.567,78.07,-7999,-7999,78.43,50
"1994-06-21 09:56:00",54757,13.35,324,-0.588,73.78,2.885,-1.47,26.43,0.125,56,0.901,78.19,-7999,-7999,78.46,50
"1994-06-21 09:58:00",54758,13.35,84,0.995,357,13.96,2.486,26.44,0.125,58,0.234,78.24,-7999,-7999,78.52,50
"1994-06-19 10:00:00",53319,13.34,178,0.035,185.3,7.245,0.087,26.67,0.125,0,0.495,78.76,-7999,-7999,78.78,50
"1994-06-19 10:02:00",53320,13.34,298,-0.883,20.95,0.819,-2.207,26.67,0.125,2,0.828,78.7,-7999,-7999,78.79,50
"1994-06-19 10:04:00",53321,13.34,58,0.848,330.8,12.94,2.12,26.67,0.125,4,0.161,78.88,-7999,-7999,78.8,50
"1994-06-19 10:06:00",53322,13.35,178,0.035,185.3,7.245,0.087,26.67,0.125,6,0.495,78.87,-7999,-7999,78.73,50
8-8
APPENDIX A. TROUBLESHOOTING THE RTMS NETWORKS
A.1 STATION TEST
The best tool for determining network status is
NetAdmin. Examine the network health screen
(main NetAdmin screen). Is each station shown
on the NetAdmin network health screen?
Stations must be part of the Net Description if
data is to be collected.
If not, there are two things to check:
•
Check if Terminal Mode or a clock check
with the datalogger works. If it does work,
communication with the datalogger is
probably fine, but data is not being
collected. Data collection can stop because
the datalogger program has been changed,
datalogger was reset due to battery failure,
communication has been paused, or data is
no longer being requested by DBSelect
and/or RTM (see Section 3).
•
If the clock check or Terminal mode fails,
there is probably a communication problem
with datalogger. See Section 2
If a station is not shown, check the following:
•
•
If the station was never added to Net
Description, it should be added. Otherwise
the Net Description has been changed or
has become invalid (computer or hard disk
failure/crash).
Reload Net Description from netname.NET
file. If netname.NET file is corrupt or missing,
restore a good copy from backup. If a good
netname.NET file is unavailable, re-enter Net
Description by hand The netname.TXT file
can be used if a good copy exists.
NOTE: Netname is the name the user
specified when the Net Description was
saved. Whenever the Net Description is
changed select the MAKE THE OPEN NET
DESCRIPTION ACTIVE option found under
the FILE selection on the EDIT NET
DESCRIPTION menu.
•
Total number of stations being collected from.
•
The COLLECTING RECORDS FROM ______
STATIONS indicator. This box indicates the
total number of stations where data is being
retrieved for RTM or DBSelect. If this number
is less than expected, try the communication
test listed in Section 1.2.
A1.2 COMMUNICATION TEST
Use this section to determine if the computer
and datalogger are communicating.
View each station on the NetAdmin main screen
noting the color and the time of the last data
collected. Is the time of last data current and the
color of each station green? If so communication
with the station is probably fine. If not, check the
time of last data displayed on the screen. If it is
current communication with the datalogger is
probably fine (see Section 1.3.).
A1.3 CHECK LAST 12 HOURS OF
COMMUNICATION
Check communications indicators for last 12
hours (COMMS 12HR) on the network health
display. There are 72 pixels each representing
a 10 minute period of the last 12 hours (720
minutes), and one pixel for the current 10
minute period. The color of each pixel
represents the “worst” type of message that
occurred during the period. If any faults
occurred the pixel will be red. If warnings
occurred but no faults, the pixel will be blue. If
no warnings or faults occurred, only successful
communications, the pixel will be green. If no
pixel is drawn, no communication took place.
The height of the trace (each pixel) is
determined by the ratio of successful
communications to total communications during
the 10 minute period. If the trace is high and
green then communication is good. If the trace
is high and occasionally blue, communication is
still probably good. With most communication
links serial errors will occur as characters are
occasionally missed. This results in a warning
message like those described in Section 4.
These can occur more frequently on machines
that run OS/2 more slowly, i.e., 386 with 8 meg.
RAM and where polling is done frequently.
These serial errors are retried and usually
succeed. Repeated failure will result in a fault
message being generated. If a trace is red and
very low then some problem does exist (see
Section 2).
A-1
APPENDIX A. TROUBLESHOOTING
A.2 COMMUNICATION PROBLEMS
The approach taken here is to isolate where
communication is having difficulty and then
attempt to remedy the problem. There is a
section for each type of communication link.
Keep in mind that DlsMgr will attempt to
communicate with a datalogger when it has a
reason to do so. The most common reason is
to poll the datalogger for data. Other reasons
include checking the clock, terminal mode, etc.
When these operations fail due to
communication problems, they will be retried
based on the retry values entered in the net
description. Messages relating to
communication are only generated when these
operations are taking place. Some operations
(like the clock set) have a button to force an
immediate retry (KICK button). The Terminal
mode also will force a communication attempt.
If RTMS or the OS/2 computer is suspect, DOS
based GraphTerm (GT) Version 2.2 or newer
can be used to verify the communication
hardware and datalogger.
It is important to try some of these troubleshooting
techniques while a network is functional. It can be
very difficult to recognize abnormal behavior when
not familiar with normal operations.
A2.1 DIRECT CONNECTION (SC32A OR RAD
MODEMS)
With direct connection there are several things
to check. Section 1.2 will verify that data is not
being updated. Attempt a clock check or try the
terminal mode. If they succeed then it is
probably not a communication problem but a
data selection or computer problem (see
Section 3).
Check the PORT ACTIVITY box on the
NetAdmin main screen. Select the COM port
used to communicate with the station. Select
the RESET COUNTERS buttons. Examine the
CHARS TX, and CHARS RX, and RETRIES
boxes. The TX box indicated how many
characters are sent to the datalogger and the
RX indicates how many characters are
received. The TX box will be non-zero when
communication is attempted. The RX will be
non-zero when the datalogger responds. The
most common case is when the datalogger fails
to respond. In this case the TX box will be
growing larger while the RX box remains at
zero. The SWF$.LOG will have warnings and
faults like the following:
'08-18-94 15:01:17','W','PC1','CR10T',
'SerLine timeout retry on: COM1.'
'08-18-94 15:01:18','W','PC1','CR10T',
'SerLine timeout retry on: COM1.'
Messages from the NetAdmin SWF$.LOG are
used in the following sections. The format of
these messages is TIMESTAMP,TYPE,FROM,
ABOUT,MESSAGE.
'08-18-94 15:01:18','W','PC1','CR10T',
'SerLine timeout retry on: COM1.'
•
TIMESTAMP indicates when the message
occurred
'08-18-94 15:01:19','W','PC1','CR10T',
'SerLine timeout retry on: COM1.'
•
TYPE indicates type of message: STATUS,
WARNING, or FAULT
'08-18-94 15:01:20','F','PC1','CR10T',
'SerLine timeout retry on: COM1.'
•
FROM indicates which station originated the
message.
'08-18-94 15:01:28','F','PC1','CR10T','Link
failed.'
•
ABOUT indicates which station the
message is about.
This pattern will repeat with several warnings
preceding each fault.
•
MESSAGE is the text of the message. The
messages shown here came from several
example networks.
Things to check:
PC1 is the computer, CR10T is a datalogger
directly connected to COM1. Stn2 is a
datalogger site accessed via telephone modem
on COM1. MD91 is accessed via MD9.
RF2BASE is a RF232T base station and RF1 is
a radio remote datalogger station. The
RF2BASE is connected to COM1.
A-2
•
Ensure that the correct COM port is
selected in the Net Description.
•
Ensure that each cable is connected
properly.
•
The cable connecting the computer and the
SC32A should not be a “Null Modem” cable,
but should be a standard serial RS232
APPENDIX A. TROUBLESHOOTING
cable. A straight through 9-pin cable
connects the SC32A to the datalogger.
•
With RAD modems and the SC932, verify
the switch and jumper setting with those
given in the manual.
•
Do a continuity test on the cable used
between the RAD modems.
•
Do a loop back test to verify each RAD
modem.
•
Does the hand-held keyboard display work?
If so, the datalogger has power and should
respond.
•
Does the datalogger have power? Check
the 12 Volt supply with a volt meter.
A2.2 TELEPHONE
'08-24-94 13:41:38','F','PC1','Stn2','Link
failed.'
When communication with the base fails any
communication with remotes will also fail. There
will probably be messages generated for the
various remotes. These messages should cease
when communication with the base works,
provided the rest of the communication is fine.
Check the following:
•
Ensure the correct COM port is selected in
the Net Description for the modem.
•
The modem is powered up?
•
Check each cable to ensure it is connected
properly.
•
The cable connecting the computer and the
modem should not be a “Null Modem” cable
but should be straight through.
•
Are special dialing strings required?
•
Once communication works with the base
modem, the phone line should be checked.
Again if the base modem works with other
sites, the phone line is probably fine.
•
If the modem has a speaker, can the dial
tone be heard when dialing occurs? Does
the remote site ring and answer?
•
If the remote modem does not respond then
the SWF$.LOG will have errors like these:
The first step is to determine if the computer
and modem are communicating correctly.
If multiple remote sites are in use, with the
phone modem, do any of the remotes work? If
some sites work that would indicate either a Net
Description problem or a hardware problem for
the remote sites that do not work.
To check communication with the modem. Check
the PORT ACTIVITY box on the NetAdmin main
screen. Select the COM port used to communicate
with the modem. Select the RESET COUNTERS
button. Wait until a call is attempted. Examine the
CHARS TX, and CHARS RX, and RETRIES boxes.
The TX box indicates how many characters are
sent to the modem and the RX indicates how many
characters are received. The TX box will be nonzero when communication is attempted. The RX
will be non-zero when the modem responds or
echoes characters. When the modem fails to
respond, the TX box will be growing larger while the
RX box remains at zero. This can also be verified
with external modems that have TX and RX lights.
If the RX box remains at zero, the SWF$.LOG file
will have warnings and faults like the following. Note
that STN2 is the datalogger station not the phone
modem at the computer. The first message will
occur whenever dialing is attempted and does not
indicate a problem.
'08-24-94 13:38:57','S','PC1','Stn2','Hayes
dialing: '' (COM1).'
'08-24-94
13:39:06','F','PC1','Stn2','Communication
with Hayes modem failed (COM1).'
'08-24-94 13:42:15','S','PC1','Stn2','Hayes
dialing: '513' (COM1).'
'08-24-94 13:42:52','F','PC1','Stn2','Hayes
modem failed to detect carrier (COM1).'
'08-24-94 13:42:53','F','PC1','Stn2','Link failed.'
Notice the difference between these messages
and the previous ones, i.e., communication with
Hayes modem failed versus Hayes modem did
not detect carrier.
The following are things to check when no
carrier is detected:
•
Ensure that phone line is plugged in the
proper jack on the modem. Most modems
have two jacks, one for the phone line and
one for a telephone. Use the jack labeled
“Teleco or To Line”. Attach the standard
telephone to the phone line being used and
manually dial the number. If you hear a
dial tone, the remote site ringing, the
A-3
APPENDIX A. TROUBLESHOOTING
remote site answering and then a high pitch
tone, then the phone line is probably fine.
•
If the modem dials but the remote site does
not answer, the SWF$ messages will be the
same as those given previously. First,
ensure that the correct number is being
called. Check the Net Description for the
remote site.
If the remote just rings and never answers,
check the following:
•
•
Does the datalogger and DC112 have
power? Check 12 Volt supply for the
datalogger. The DC112 modem gets its
power (5 volts) from pin 1 on the 9-pin
SERIAL I/O connector.
Check the 9-pin cable connecting the
DC112 to the datalogger. It should be
straight through, i.e., no lines crossed.
Check connections at both ends. Try a
spare 9-pin cable if available.
•
Check the phone line at the remote site with
a standard telephone. Is the telephone line
properly connected to the DC112.
•
The DC112 has a jumper to enable it to
answer the phone. Check that this jumper
is in the correct position.
If the phone is busy:
•
Is someone else calling the site?
•
If the line is always busy, disconnect the
DC112 modem and try the line. If the line is
still always busy there may be a problem
with the line and it should be checked by
the phone company. If the line is always
busy only when the DC112 is connected the
DC112 or datalogger may have a hardware
problem and should not be left connected
until the problem is determined.
•
A-4
If the two modems seem to get a phone
connection but the base modem does not
detect carrier, or if carrier is detected but
communication is poor with many retires,
the phone line may be noisy or of poor
quality and should be checked by the phone
company. Experience has also shown that
some base modems do not perform as well
as others.
A2.3 MD9 COMMUNICATION.
The MD9 at the computer (MD9 base) should
be connected to the computer through an
SC532 interface. The switches in the base
MD9 should be set so the address is 255. The
computer dials the base MD9 to communicate
with remote dataloggers much like it would dial
a telephone modem. The first step is to verify
communication with the base MD9. Carefully
examine the network health screen. Note if the
base MD9 is red or blue along with the remote
that is not communicating or if just the remote.
This helps determine if the base is working or
not.
If multiple remote sites are in use with the base
MD9, do any of the remotes work? If some
sites work that would tend to indicate either a
Net Description problem or a hardware
problem for the remote sites that do not work.
To check communication with the base MD9,
examine the PORT ACTIVITY box on the
NetAdmin main screen. Select the COM port
used to communicate with the base MD9.
Select the RESET COUNTERS buttons.
Examine the CHARS TX, and CHARS RX, and
RETRIES boxes. The TX box indicates how
many characters are sent to the base MD9 and
the RX indicates how many characters are
received. The TX box will be non-zero when
communication is attempted. The RX will be
non-zero when the base MD9 responds. When
the base MD9 fails to respond, the TX box will
be growing larger while the RX box remains at
zero. If the RX box remains at zero, the
SWF$.LOG file will have warnings and faults
like the following. This indicates the base is not
communicating. Note that MD91 is the
datalogger station trying to be communicated
with.
'08-24-94 14:27:52','F','PC1','MD91','MD9
base failed to respond.'
'08-24-94 14:27:56','F','PC1','MD91','MD9
base failed to respond.'
'08-24-94 14:27:57','F','PC1','MD91','Link
failed.'
When communication with the base fails, any
communication with remotes will also fail. The
will probably be messages generated for the
various remotes. These messages may cease
when communication with the base works.
APPENDIX A. TROUBLESHOOTING
Things to check include:
•
Ensure that the correct COM port is
selected in the Net Description for the Base
MD9.
Note that when the link does not work several
warnings precede a fault. This pattern repeats
each time the computer attempts
communication with the remote MD9 site.
Things to check include:
•
Is the SC532 is powered up, i.e., plugged
in?
•
Check each cable to be sure it is
connected properly.
•
The cable connecting the computer and the
SC532 should not be a “Null Modem” cable
but should be standard serial RS232 cable.
•
Swap cables if spares are available.
•
Check that the base MD9 address is set to
255 with the switches.
•
Power down the base MD9 by
disconnecting the 9-pin cable from the I/O
port. Disconnect the serial cable coming
from the computer to the SC532.
Reconnect the 9-pin cable to the base MD9.
Ensure that the SC532 is plugged in.
Reconnect the serial cable between the
computer and the SC532. Examine
communication again.
Once the base MD9 is communicating with the
computer, verify communication with the
remote(s). Here, the only clues are the network
health screen, the SWF$.LOG, and user's
observations. The SWF$.LOG will indicate
problems with messages like the following.
Again MD91 is the remote MD9-datalogger
station name. For this example the remote
MD9 Switches were set for ID = 1.
'08-24-94 14:28:41','W','PC1','MD91','MD9
dial operation failed (id = 1).'
'08-24-94 14:28:45','W','PC1','MD91','MD9
dial operation failed (id = 1).'
'08-24-94 14:28:48','W','PC1','MD91','MD9
dial operation failed (id = 1).'
'08-24-94 14:28:52','W','PC1','MD91','MD9
dial operation failed (id = 1).'
•
Do the datalogger and DC112 have power?
Check 12 Volt supply for the datalogger.
The MD9 gets its power from pin 1 on the 9pin SERIAL I/O connector (5 Volts).
•
Check the 9-pin cable connecting the MD9
to the datalogger. It should be straight
through, i.e., no line crossed. Check
connections at both ends. Try a spare 9-pin
cable if available.
•
Check that each remote MD9 has a unique
address (ID).
•
Check the coaxial cable between the base
MD9 and the remote. See MD9 manual for
details.
•
Disconnect the 9-pin cable from the MD9.
Disconnect the coaxial cable from the MD9.
Reconnect the 9-pin cable then the coaxial
cable. Examine communications again.
•
Occasional errors on MD9 networks.
Occasionally the computer may fail in its
attempt to communicate with or dial the
base MD9. The following type of warnings
and faults may occasionally be found in the
SWF$.LOG.
'08-24-94 14:29:06','W','PC1','MD91','MD9
dial operation failed (id = 1).'
'08-24-94 14:27:46','F','PC1','MD92','MD9
base failed to respond.'
'08-24-94
13:48:40','W','PC1','MD92','SerLine bad
signature on: COM1.'
This is normal, especially on an OS/2
computer with limited resources. As long
as data is being collected these messages
occasionally occurring are no reason for
concern. Failures are characterized by
repeated warnings and fault messages.
'08-24-94 14:28:52','F','PC1','MD91','Link
failed.'
A-5
APPENDIX A. TROUBLESHOOTING
'08-24-94
14:26:00','W','PC1','RF2Base','SerLine
timeout retry on: COM1.'
A2.4 RADIO (RF)
This section deals with troubleshooting radio
network from the software perspective. It does
not give specifics on radio transmission
problems regarding antennas, etc. Information
on these can be found in the RF Telemetry
manual.
'08-24-94
14:26:01','W','PC1','RF2Base','SerLine
timeout retry on: COM1.'
'08-24-94
14:26:02','W','PC1','RF2Base','SerLine
timeout retry on: COM1.'
The switches in the base RF232T should be set
so the address is unique regarding other RF
stations and not set to 255 (255 is reserved for
Phone to RF bases).
'08-24-94
14:26:03','W','PC1','RF2Base','SerLine
timeout retry on: COM1.'
The first step is to verify communication with the
base RF232T. Carefully examine the network
health screen, note if the base RF232T is red or
blue along with the remote that is not
communicating or if just the remote. This helps
to determine if the base is working or not.
'08-24-94
14:26:03','F','PC1','RF2Base','SerLine
timeout retry on: COM1.'
If multiple remote sites are in use with the base
RF232T, does any of the remotes work. If
some sites work that would tend to indicate
either a Net Description problem or a hardware
problem for the remote sites that do not work.
When communication with the base fails any
communication with remotes will also fail.
There will probably be messages generated for
the various remotes. These messages may
cease when communication with the base
works.
To check communication with the base
RF232T:
Things to check include:
•
Ensure that the correct COM port and Baud
rate are selected in the Net Description for
the RF232T Base.
Select the COM port used to communicate
with the base RF232T.
•
Is the RF232T turned on and plugged in.
•
Select the RESET COUNTERS buttons.
•
•
Examine the CHARS TX, and CHARS RX,
and RETRIES boxes. The TX box indicates
how many characters are sent to the base
RF232T and the RX indicates how many
characters are received. The TX box will be
non-zero when communication is
attempted. The RX will be non-zero when
the base RF232T responds. When the
base RF232T fails to respond, the TX box
will be growing larger while the RX box
remains at zero. If the RX box remains at
zero, the SWF$.LOG file will have warnings
and faults like the following. This indicates
the base is not communicating. Note that
RF2BASE is the RF232T station.
Check each cable to ensure it is connected
properly including the 9-pin ribbons
connecting the small circuit board to the
RF95T inside the RF232T.
•
The cable connecting the computer and the
RF232T should not be a “Null Modem”
cable but should be a standard serial
RS232 cable.
•
Swap cables if spares are available.
•
Check that the base address is set correctly
with switches including switch 9 (see RF
Telemetry manual).
•
Examine the PORT ACTIVITY box on the
NetAdmin main screen.
•
A-6
When the RF232T is powered on, the carrier
detect light should blink twice. If it blinks
continuously there maybe a hardware problem.
Note that the carrier detect light flashes in
APPENDIX A. TROUBLESHOOTING
response to transmissions the radio hears. If
the frequency is in use, turn off the radio and
repeat the power up test.
With successful communication to the base
RF232T, the remotes should be verified. The
best tool for verifying RF communication with a
remote is the RF LINK TEST found in NetAdmin.
Section 2.4 of the RF Telemetry manual gives
information on using this test. Section 4.2.2 of
the RF Telemetry manual describes the RF LINK
TEST using the DOS-based GT program. The
following type messages CAN indicate a RF
remote failure. Note that RF1 is the remote site
and RF2BASE is the RF232T base. With a
failure, several warnings will usually precede a
fault message. This pattern is repeated each
time polling occurs.
'08-24-94 14:22:02','W','RF2Base','RF1','
RF Broadcast failure.'
'08-24-94 14:22:02','W','RF2Base','RF1','
RF Broadcast failure.'
'08-24-94 14:22:02','W','RF2Base','RF1','
RF Broadcast failure.'
'08-24-94 14:22:02','F','RF2Base','RF1',' RF
Poll failure.'
For direct maintenance operations (e.g., clock
set) the following type messages indicate a
failure.
Net Description has been changed. As long as
data is collect properly, occasional messages
are probably no reason for concern. Failures
are characterized by repeated warning; followed
by a fault.
A.3 COMPUTER COMMUNICATES WITH
DATALOGGER, BUT RTM IS NOT
DISPLAYING DATA, AND/OR
DBSELECT IS NOT STORING OR
ROUTING DATA.
Is DBSelect program started? If started, is data
collection running? The title bar of DBSelect
should indicate the data collection status
(running or stopped). If the title bar says that
DBSelect is stopped or does not indicate status,
check the SWF$.LOG to see if any messages
indicate why DBSelect stopped. The common
reasons are indicated by the following type
messages:
'08-18-94 15:44:13','F','PC1','PC1',
'DBSELECT Acknowledged Named pipe
broken, Memory low'
'08-18-94 15:44:13','F','PC1','PC1',
'DBSELECT shutting down too little disk
space'
'08-18-94 15:44:13','F','PC1','PC1',
'DBSELECT detected less than 3760128
bytes Free'
'08-24-94 14:26:15','W','PC1','RF1','SerLine
timeout retry on: COM1.'
'08-18-94 15:44:13','S','PC1','CR10T','Send:
Data Advise.'
'08-24-94 14:23:38','F','PC1','RF1','Link
failed.'
'08-18-94 15:44:14','S','PC1','PC1',
'DBSELECT Stopped'
The following message indicates a link that was
failing is working again.
'08-24-94 14:25:22','S','PC1','RF1',
'Communication restored with: RF1.'
Section 2.5 of the RF Telemetry manual gives
suggestions of things to check when a remote
RF station does not respond.
The RF Broadcast failure warning message
may occur occasionally on RF networks that are
functioning properly. These can be caused by
outside interference or conditions affecting the
quality of the link. They also can occur if the
These indicate either there was insufficient hard
disk space or that there was not enough
memory (these can be related). See Section
2.2 of the RTMS manual for specific OS/2
requirements.
DBSelect will also stop if the program receiving
data via the named pipe stops acknowledging
data. The following type messages will be
generated when this happens.
'08-18-94 15:30:00','S','PC1','PC1',
'DBSELECT DosWrite error on
Acknowledged named pipe 109'
A-7
APPENDIX A. TROUBLESHOOTING
'08-18-94 15:30:00','S','PC1','PC1',
'Transaction was canceled by client.'
'08-18-94 15:30:00','S','PC1','PC1',
'DBSELECT Begin Pipe Queue dump to
C:\RTMS\DATA\QUEUE.DAT'
and will need to be updated to solve this
problem. Table names like T01 indicate
that the datalogger has no data labels in the
program. This can result from using a
keyboard display to program the datalogger.
DBSelect and RTM will generate messages
like the following when data selections and
the data available from the datalogger do
not match:
'08-18-94 15:30:01','S','PC1','PC1',
'DBSELECT Dumping 20 Queue Records'
'08-18-94 15:01:38','F','PC1','PC1',
'RTMadviseWait:DlsBadTable: One_min'
'08-18-94 15:30:01','S','PC1','PC1',
'DBSELECT End Pipe Queue Dump to
C:\RTMS\DATA\QUEUE.DAT'
'08-18-94 15:07:36','S','PC1','PC1',
'DBSELECT DlsWaitForTable returned
DlsBadTable CR10T.Five_min'
'08-18-94 15:30:01','S','PC1','PC1',
'DBSELECT Acknowledged Named Pipe
\PIPE\RTMS Server Waiting for connection'
'08-18-94 15:07:36','S','PC1','PC1',
'DBSELECT DlsFieldListGet returned
DlsBadTable'
'08-18-94 15:30:00','S','PC1','PC1',
'DBSELECT Stopped'
Sections 7 and 8 in the RTMS manual give
information on use of Named Pipes and the
Queue.Dat file.
To start data collection with DBSelect:
•
Press the UPDATE button.
•
With RTM, ensure that MONITOR MODE is
selected.
If the DBSelect and/or RTM program is running
and is collecting data but no data is displayed,
check the following:
•
•
•
A-8
Has enough time elapsed that the data has
been collected. For example, daily data
may only be available at midnight. With
radio or phone there may be some delay as
data is being collected.
Check that the correct data are selected
and that they matched what is available
from the datalogger. To check the list of
available data tables from the station, add a
new display in RTM or highlight the station
name in DBSelect. With RTM the field
selections should also be checked.
If the list of tables has changed then the
data the datalogger is storing no longer
matches what is selected for collection.
Either the datalogger program or the
DBSelect or RTM selections are incorrect
The following messages from the datalogger
can indicate that its programming was changed:
'08-18-94 15:01:38','S','PC1','CR10T','Send:
Get Table Definitions.'
'08-18-94 15:01:39','S','PC1','CR10T','Table
Definitions from 'CR10T' changed.'
If the list of tables for a datalogger only contains the
INLOCS, STATUS, TIMESET, and ERRORLOG
tables with no user defined data tables (created with
P84 in datalogger program.DLD file), the datalogger
has probably lost power or has not been
programmed. If so the .DLD program should be
downloaded. Downloading will erase all data in the
datalogger so download with caution. Along with
the messages above, the following message may
also be logged if power was lost.
'08-18-94 15:01:39','W','PC1','CR10T',
'Program not downloaded'
'08-18-94 15:07:34','W','PC1','CR10T',
'Station Number changed from 0000 to
0002 '
If RTM strip charts are not displaying data,
check the current time on the strip chart display.
If the current time is red the datalogger clock is
ahead of the computer's clock (used as the
reference for strip charts). The following
messages will also be found in the SWF$.LOG.
APPENDIX A. TROUBLESHOOTING
'08-18-94 15:21:42','W','PC1','PC1','RTM:
StripChart, Data TimeStamp greater than
System Time'
The datalogger and/or computer clock should
be checked.
If the RTM and DBSelect selection are correct
and match the data available from the
datalogger, and RTM, DBSelect, or both are
running, then there may be communication
problem between DlsMgr and DBSelect or
RTM. This may be caused by insufficient
computer resources or running to many
programs on the OS/2 computer. See Section
2.2 in the RTMS manual. Try reducing the
demands on the PC or increasing its capability
by adding RAM, etc.
The following message indicating DBSelect or
RTM are not reading data they requested..
'08-18-94 15:11:53','W','PC1','PC1','Client
not reading data (CR10T).'
RTM and DBSelect may also give messages
indicating Bad Sessions or DLS Halted, in which
case the RTMS programs may need to be
completely stopped and restarted.
A.4 DLSMGR MESSAGES AND WHAT
THEY MEAN
Messages from the NetAdmin SWF$.LOG are
described in the following sections. This is not
a list of all possible messages but the common
ones. Other messages can occur. The format
of these messages is TIMESTAMP,TYPE,
FROM,ABOUT,MESSAGE. Where
TIMESTAMP indicates when the message
occurred. TYPE indicates type of message;
STATUS, WARNING, or FAULT. FROM
indicates which station originated the message.
ABOUT indicates which station the messages
are about. MESSAGE is the text of the
message. These actual messages come from
several networks. PC1 is the computer,
CR10T is a datalogger directly connected to
COM1. Stn2 is a datalogger site accessed via
telephone modem on COM1. MD91 is
accessed via MD9. RF2BASE is an RF232T
base station and RF1 is a radio remote
datalogger station. The RF2BASE is connected
to COM1.
'08-18-94 14:58:22','S','PC1','CR10T','Pkt to
'CR10T' rejected, communication is paused.'
The pause slider on the network health screen
has been moved pausing all communication
with network. This message also occurs when
DlsMgr is first started as it pauses the network a
few seconds when starting. This allows time to
start NetAdmin and extend the pause time if it is
important to stop the actual communication
before it starts.
'08-18-94 15:01:37','W','PC1','CR10T',
'Station Number changed from 0000 to
0002 '
When DlsMgr first communicates with a
datalogger it assigns the datalogger a station
number. The datalogger remembers this
number until it is assigned a new one. When a
new number is assigned, the datalogger
generates a warning message. When the
station number changes from 0000 the
datalogger is being communicated with for the
first time since it was powered up. If the
number changes, GT may have been used with
the station or the Net Description involving the
datalogger has been edited.
'08-18-94 15:01:39','W','PC1','CR10T',
'Program not downloaded'
The datalogger is being communicated with but
is indicating that no program (.DLD file) has
been downloaded. If this is not a new station
the datalogger may have lost power.
'08-18-94 14:59:54','S','PC1','CR10T','Data
CR10T.InLocs RecNbr 18280 for 1.'
'08-18-94 15:01:03','S','PC1','CR10T','Data
CR10T.One_min RecNbr 3119 for 1.'
Indicated polling type collection of a data record
from the datalogger. These messages are
normal and should occur. See Section 7.1 of
the RTMS manual for discussion of polling and
hole collection.
'08-18-94 15:06:01','S','PC1','CR10T','Send:
Hole Collection.'
'08-18-94 15:06:02','S','PC1','CR10T','Hole
CR10T.One_min RecNbr 0 for 2.'
A-9
APPENDIX A. TROUBLESHOOTING
First message indicates the RTM or DBSelect
requested a specific range of data using hole
collection. Second message indicates what
data was collected using hole collection.
Several hole collections may be required to
collect a single hole depending on the amount
of data. Normally these messages can occur
following Data Advise messages (see next
message) or when holes are manually entered
in DBSelect. See Section 7 in RTMS manual.
RTM optionally uses hole collection to backfill
strip charts when the monitor mode is started.
Frequent hole collection during routine
operation (i.e., no user intervention or changes)
may indicate that data is being lost en route
from datalogger to DBSelect. A poor but
sometime functional communication link could
cause this (check communication Section 1.3
above). If the OS/2 computer is exceedingly
burdened (Section 2.2 in RTMS manual) data
may be collected but discarded because the
computer cannot process it as fast as it is
collected and buffers overflow.
'08-18-94 14:59:52','S','PC1','CR10T','Send:
Data Advise.'
'08-18-94 15:01:24','W','PC1','CR10T',
'Advise Transaction re-started (CR10T).'
The computer sent a list of the data it requires
to the datalogger (advised the datalogger).
This normally occurs when RTM or DBSelect is
stopped, started, or edited so the data needed
from the datalogger changes. This can also
occur when the datalogger clock has changed
or has a new program downloaded.
Abnormally these messages occur when
DlsMgr tries to reset data collection with a given
datalogger. DlsMgr does this when it detects
that a significantly long period has elapsed
without data or a valid no data response is
being received from the datalogger. Period is
current retry period or four times the polling
interval (whichever is longer). Note that the
datalogger will return a valid no-data response
as long as it has been “advised” of what data to
return. This prevents DlsMgr from resetting
data collection when slow data is being
collected. If DlsMgr successfully restarts the
transaction data should resume. Check
communication with datalogger (see Section 2).
Check RTM and DBSelect to see if they have
stopped collecting data from station (see
Section 3).
A-10
'09-02-94 16:03:59','S','PC1','RF1','Unused
'Data Advise Notification' from 'RF1'.'
This indicates that data from a previous data
advise arrived. These messages occur
normally when the list of data to be collected
has been changed. Data already en route to
the computer will be based on the old list of
data to be collected (data advise) and will not be
used by the computer. Once the new data
advise is in place, these messages should stop.
Note that when the data advise changes,
usually there will be some data hole collected.
'08-24-94 13:42:15','S','PC1','Stn2','Hayes
dialing: '513' (COM1).'
DlsMgr is attempting communication with a
remote station accessed by telephone. The
station name is Stn2, and the phone number is
513. This message occurs each time the
phone is dialed.
'08-18-94 15:01:38','S','PC1','CR10T',
'Send: Get Table Definitions.'
The computer has requested a list of data
available from the datalogger. This normally
occurs when the station has just been added to
the network or a datalogger program.DLD file
has been downloaded. Otherwise, it indicates
that DlsMgr thinks the datalogger program has
changed. This can indicate that power has
been lost at the datalogger site or the
datalogger has been reprogrammed manually,
i.e., keyboard display or laptop.
'08-18-94 15:01:39','S','PC1','CR10T','Table
Definitions from 'CR10T' changed.'
A follow up message to a previous message
indicats that the data available from a
datalogger has changed. Same conditions as
previous message.
'08-18-94 15:02:31','S','PC1','CR10T','Send:
Clock Set/Check.'
'08-18-94 15:02:31','S','CR10T','CR10T',
'Clock changed'
'08-18-94 15:19:11','S','CR10T','CR10T',
'Clock changed; Program running'
Clock was checked or set (first message). This
message occurs when the clocks are
APPENDIX A. TROUBLESHOOTING
set/checked automatically (must be enabled) or
manually. Second message is from the
datalogger indicating its clock was changed but
that no program is running, i.e., no program
(.DLD file) has been downloaded. Third
message, also from the datalogger, indicates its
clock was changed and there is a program
running. There is no response generated when
the clock is checked. Clock changes are
logged in CLKSET$.LOG files. See Section 8 in
the RTMS manual.
'09-02-94 14:50:08','W','PC1','CR10T','Hole
detected in table 01'
This warning usually occurs when the
datalogger clock is changed so an output
interval is missed. It indicates that a gap
occurred in the time stamps of the records from
the tables. The record numbers of the records
will not have a gap.
'08-18-94 15:03:24','S','PC1','CR10T','Send:
Program Download.'
'08-18-94 15:03:37','S','CR10T','CR10T',
'Download complete; Signature: +56647.'
08-18-94 15:19:58','S','PC1','CR10T','Send:
RF Link Test.'
RF test link option in NetAdmin was used.
'08-18-94 15:01:18','W','PC1','CR10T',
'SerLine timeout retry on: COM1.'
'08-24-94 13:48:40','W','PC1','CR10T',
'SerLine bad signature on: COM1.'
'08-24-94 13:48:40','W','PC1','CR10T',
'Bytes were received while sending low level
packet (COM1).'
'08-18-94 15:01:37','W','PC1','CR10T',
'Redundant packet received from 'CR10T'
(PktType 7).'
The first message indicates that the device the
DlsMgr (computer) was attempting
communication with did not respond. The
second indicates a received packet failed the
signature test (and was retried usually).
The third packet indicates the DlsMgr received
characters on the serial port when it did not
expect them.
'08-24-94 13:49:20','F','PC1','CR10T','E22'
'08-24-94 13:50:11','F','PC1','CR10T','E99'
A datalogger program was downloaded to
datalogger. If the datalogger can compile and
use program, the second message is returned
from the datalogger. If the datalogger receives
the program but cannot compile it due to an
error, it will return a message like the third
message (E22 indicates a missing END
statement). The last fault messages indicates
that the datalogger received the file but did not
recognize it as a datalogger program.
'08-18-94 15:19:58','S','PC1','CR10T','Send:
User I/O.'
Keyboard display mode (terminal mode) was
used with the datalogger.
08-18-94 15:19:58','S','PC1','CR10T','Send:
Control.'
Command to set datalogger port, flag, or load
INLOC was sent by RTM.
The fourth message indicates the DlsMgr
received an extra response to a command.
These messages are usually not cause for
concern when they occur occasionally as serial
communications are not perfect. When
warnings occur repeatedly and are followed by
fault messages, there is a communication
problem. When this occurs, the following gives
some probable causes:
The first indicates the device is not responding.
See Section 3.0 above.
The second would indicate that characters are
routinely missed. This can mean the OS/2
computer has insufficient resources or too many
programs are being run concurrently. It may
also indicate a bad serial port or device.
The third indicates that the wrong device may
be attached to the COM port and is echoing
characters when it is not expected. For
example a Hayes modem echoes characters
while a MD9 base does not. If the Net
Description incorrectly specifies the COM port
A-11
APPENDIX A. TROUBLESHOOTING
or device, DlsMgr may be attempting
communication with the wrong device.
The third can indicate that DlsMgr is retrying
operations before the previous one completes.
This usually indicates that the retry periods
specified in the Net Description are too short.
Otherwise, operations are taking longer than the
should and there may be other communication
problems.
A.4.1 RTM MESSAGES
'08-18-94 15:21:42','W','PC1','PC1',
'RTM:StripChart, Data TimeStamp greater
than System Time'
RTM strip charts cannot display data properly
because the datalogger clock is ahead of the
computer clock.
The current time displayed on the strip chart will
also be shown in red.
Section 3 contains additional information and
RTM messages.
A.4.2 DBSELECT MESSAGES
'08-18-94 15:05:16','S','PC1','PC1',
'DBSELECT Acked Pipe Name set to
\PIPE\RTMS'
'08-18-94 15:05:16','S','PC1','PC1',
'DBSELECT Non Acked Pipe Name set to
\PIPE\RTMA'
'08-18-94 15:05:16','S','PC1','PC1',
'DBSELECT Background modules will get
INIs from C:\RTMS\'
'08-18-94 15:05:16','S','PC1','PC1',
'DBSELECT Will get INIs from
C:\RTMS\DATA\'
'08-18-94 15:05:27','S','PC1','PC1',
'DBSELECT Advise Started 0'
DBSelect has requested the data it needs from
DlsMgr.
'08-18-94 15:06:00','W','PC1','PC1',
'DBSELECT table wraparound in
CR10T.One_min'
A table in a datalogger has the record number
go from a large number to a smaller one. This
indicated that the datalogger was
reprogrammed (with the same table names) or
the table numbers reached the largest possible
record number and then wrapped around to
one. The record number would probably only
wrap around on fast tables or where the
datalogger has been running with program
change for a long time.
'08-18-94 15:09:23','W','PC1','PC1',
'DBSELECT Data Base Will be collecting
Data and Not Storing or Exporting it'
DBSelect has been started and updated but no
data destination (ASCII files or Named Pipe)
has been specified. This should be corrected,
as data will not be stored or recollected
automatically!
'08-18-94 15:09:49','S','PC1','PC1',
'DBSELECT Baling Begin'
'08-18-94 15:09:54','S','PC1','PC1',
'DBSELECT Baling End'
DBSelect has moved data files from the
SHADOW directory to the data directory. This
is done on the user-specified interval. This is
normal when ASCII files are in use. See
Section 7 of the RTMS manual for information
on baling of files.
'08-18-94 15:05:16','S','PC1','PC1',
'DBSELECT Unacknolwaged Named Pipe,
\PIPE\RTMA Server Waiting for connection'
'08-18-94 15:09:51','F','PC1','PC1',
'DBSELECT Non data file in SHADOW
directory Q.BAK'
'08-18-94 15:05:24','S','PC1','PC1',
'DBSELECT ASCII files Enabled'
'08-18-94 15:09:51','F','PC1','PC1',
'DBSELECT DosDelete
d:\BIN\BCAHAGBG.000 returned 5'
The above messages indicate the selections
made with the DBSelect menus. DBSelect
gives these type of messages when it is started
or when a selection is changed.
A-12
These messages indicate error conditions. The
first is that a file that is not a DBSelect data file
was found in the SHADOW directory. Users
should not access the SHADOW directory or
APPENDIX A. TROUBLESHOOTING
the files contained there at all. The second
error indicates the DBSelect could remove a file
from the shadow directory after it baled it.
DBSelect needs full rights to the SHADOW
directory and the data directory.
'08-18-94 15:26:50','S','PC1','PC1',
'DBSELECT Stopped'
DBSelect has stopped. The program is running
but no data is being collected. See Section A3
above and Section 7 of the RTMS manual for
more information.
Section 3 contains additional information and
DBSelect messages.
A-13
GLOSSARY
Acknowledged Named Pipe − See Named
Pipe. Exchange of data through a named pipe
where the program or process (client) receiving
data must acknowledge each record of data it
receives.
Coaxial cable − Special type of cable with two
conductors (center conductor and outer shield
conductor). Classified by size, impedance, and
loss characteristics. Used to connect MD9
modems and to connect radios to antennas.
Advise − See Data Advise
COM Port − RS-232 Serial port, i.e., COM1,
COM2, etc.
Baling − When DBSelect stores data in ASCII
files, it periodically makes data files available for
the user or user programs. This process is
known as baling and happens on a user
specified interval.
CR10T − Campbell Scientific datalogger
supported by RTMS, used to make
measurements at remote sites.
Baud rate − Communication speed between
two serial devices. Baud rates must match for
successful communication.
Data Advise − List of data to be collected,
usually from a datalogger. Sent to “advise”
datalogger of what data is needed. Based on
dataloggers Table Definitions.
Block Mode Protocol − Protocol used by
DlsMgr to communicate with CR10T
dataloggers and RF95T RF modems.
Data Advise Notification − Packet of data sent
by datalogger based on the Data Advise it
received.
BMP- See Block Mode Protocol.
DBSelect − RTMS program for data collection,
storage, and routing including named pipes, and
ASCII files.
Broadcast − Part of the radio (RF) technique of
polling remote radio modem dataloggers sites.
A single modem sends a message (broadcast)
that all affected remotes hear and respond to.
DC112 − 1200 Baud telephone modem for use
with a CR10T datalogger. Powered by the
CR10T datalogger.
Carrier − An electrical signal used to convey
data or other information. For example, radio
and phone modems use carrier signals. Phone
modems attempt to detect carrier when the call
is placed. The red LED on the RF95T lights
when the modem detects carrier.
DLD file − See EDLOG. CR10T datalogger
programs are usually developed on the
computer and then sent to the datalogger.
These datalogger programs have a .DLD
extension.
Chars. RX − Number of characters (bytes)
received by the computer. Part of NetAdmin
network health display.
DlsMgr − Datalogger Service ManaGeR.
Manages all communication with datalogger
network. Part of the RTMS programs.
Chars. TX − Number of characters (bytes)
transmitted by the computer. Part of NetAdmin
network health display.
Extract − Utility program to extract ranges, sort,
check, and merge ASCII data files created with
DBSelect.
Child node − See node. A node that is
accessed through another device (parent node).
For example a remote radio (RF) site is
accessed through the base RF232T. All nodes
are children nodes of the PC.
Fault − Message relating to network activity
where repeated problems or errors have
occurred. Repeated faults usually indicate a
failure of some kind.
Health − See Network Health.
Hole − See hole collection. Because of the way
current and older datalogger data are collected
simultaneously, there can be sequences of
older data that are available from the datalogger
but have not yet been collected. DBSelect
tracks and optionally collects these holes
Hole Collection − See Hole. Process used to
collect a specific range of data from a
datalogger. Usually used to collect data to fill
RTM strip charts or to collect data not collected
with Data Advise.
Keyboard display − A hand-held display and
keyboard used to access CR10T datalogger
programming, and star mode (* mode)
information directly. Model CR10KD.
Kick − When a transaction fails, it is usually
retried until it succeeds. Retries are based on
intervals specified by user. To “kick” a
transaction is to force an immediate retry.
Link − Communication route between to
devices, e.g., phone link between two phone
modems.
MD9 − A mutidrop modem where several
CR10T dataloggers (with MD9 modems) are
attached to a single coaxial cable along with a
MD9 at the computer. DlsMgr “dials” the base
MD9 to access the remote dataloggers. The
MD9 are individually addressed.
Named Pipe − See Acknowledged Named Pipe
and Unacknowledged Named Pipe. Method
provided by OS/2 for two programs or process
to exchanged data. Used with RTMS to make
datalogger data available to user-written
programs. DBSelect provides an
Acknowledged Named Pipe and an
Unacknowledged Named Pipe.
Net Description − Description of dataloggers
and communications devices that form the
datalogger network. Entered as with NetAdmin
and used by DlsMgr to communicate with the
various dataloggers.
NetAdmin − Network Administration program,
Used to: monitor network communication and
health, edit network descriptions, set/check
clocks, download datalogger programs, interact
directly with dataloggers, and test RF links.
Network Health − Pertaining to DlsMgr ability
to collect data and communicate with the
datalogger in the datalogger network. Network
Health indicators are displayed on the main
NetAdmin screen.
Node − Part of the description of a datalogger
network (Net Description). Represents a device
that DlsMgr will directly communicate with or
dial. Nodes are organized as a hierarchy with
all nodes accessed by the same device (parent
node) grouped as children nodes. A node can
be both a parent and child node.
Packet − A unit of information sent between two
devices that are communicating, can contain
data, messages, programming, etc. Usually
contains addressing and routing information.
Path − A list of modems or devices used to
communicate with a remote site datalogger.
Pipe − See Named Pipe.
Polling − Process where a datalogger or other
communication device is periodically checked
for any packets it needs to send. DlsMgr polls
dataloggers for most communication links.
With radio (RF) the base RF232T or repeaters
can poll datalogger sites.
Polling Interval − See Poll. The userspecified interval that determines when to poll a
given device.
RAD Modems − Short haul modems for
communicating with a CR10T datalogger over
twisted pair wire connection. RAD is the
trademark name for the modems manufactured
by RAD Data Communictions, Inc.
Real-Time Monitoring Software − Collection
of OS/2-based software for automated data
acquisition, monitoring, and control of CR10T
datalogger networks.
Remote Keyboard − A mode provided by
NetAdmin that emulates the functionality
available with a Keyboard display.
Remote site − Usually refers to the site where a
datalogger is located at other end of
communication link. Also can refer to site
where a radio (RF) repeater is located.
Repeater − A radio (RF) site that relays packets
of information to a remote site. Used to extend
the range of radio transmissions. Any remote
datalogger site with radio can act as a repeater.
Retries − When a transaction or
communication between two devices or
programs fail. The transaction or
communication is usually repeated until it
succeeds. These “retries” occur based on user
entered parameters (in Net Description).
RF − Dealing with radio telemetry. Stands for
Radio Frequency.
RF232T − A base station radio and modem.
Contains radio, SC532, RF95T, and power
supply in an enclosure.
RF95T − Modem for use with radio (RF)
telemetry.
RTM − Real Time Monitor, Program to monitor
datalogger data in "real-time" with various
graphical displays and tables.
RTMS − See Real-Time Monitoring Software
SC12 cable − 9-pin cable (subminature D-type
connectors) used to connect dataloggers and
peripherals.
SC32A − A device for connecting a CR10T
datalogger to an RS-232 serial port.
SC532 − Interface device to connect an MD9
modem or RF95T modem to an RS-232 serial
port.
SC932 − Interface device for connecting RAD
modems to datalogger.
SerLine − Dealing with the serial port or serial
connection. Usually used in SWF messages.
SHADOW directory − DBSelect temporarily
stores the data it receives in subdirectories
under the SHADOW directory. The user should
access or place files in these directories.
DBSelect needs full rights to these directories.
Sibling Nodes − See Node, Child Node, and
Parent Node. Two or more nodes accessed by
the same parent node.
Signature − Number calculated to verify both
sequence and validity of bytes within a packet.
Station number − DlsMgr assigns and uses
station numbers for routing of packets.
NetAdmin allows the user to specify these
numbers but the defaults are usually adequate.
Status − Message relating to current network
activity.
SWF logs − Messages indicating Status,
Warnings, and Faults within the datalogger
network. May be filtered and logged to disk.
Table Definitions − List of data available from
a datalogger. Datalogger supplies this list on
request. Based on the datalogger
programming. Used by DlsMgr to form Data
Advise.
Terminal Mode − See Remote keyboard.
TimeStamp − Date and time information for
data or message.
Transaction − Exchange of data or information
between two devices or programs. For
example setting of the clock in a datalogger is a
transaction between DlsMgr and the datalogger.
Unacknowledged Named Pipe − See Named
Pipe. Exchange of data through named pipe
where sending program (DBSelect) sends data
regardless of whether receiving program (client)
is ready to receive (or even present).
View − NetAdmin function that can be accessed
and configured but runs even when not being
accessed.
Warning − Message relating to network activity
where a potential problem or error has been
identified. Usually occasional warnings are not
cause for alarm.