1
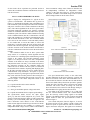
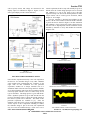
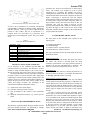
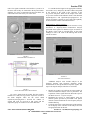
Session T3H
Laboratory set-up for Real-Time study of Electric
Drives with Integrated Interfaces for Test and
Measurement
Fong Mak, Ram Sundaram, Varun Santhaseelan, and Sunil Tandle
Gannon University, [email protected], [email protected], [email protected], [email protected]
Abstract-This paper presents a real-time instrumentation
setup for laboratory experiments in the course on electric
drives that is adapted to incorporate the integrated
response and analysis interfaces developed in the course
on test and measurement. The experimental setup is
modeled after the one proposed by the University of
Minnesota. However, the setup along with the
modification to the model with the electric drives
assembly as hardware-in-the-loop (HIL) is first correctly
executed under the RT-LAB real-time system solution.
The paper focuses on the design and validation of the
electric drives experiments with RT-LAB solution and the
LabVIEW API capability provided by RT-LAB that
allows user-designed virtual instrumentation-based
human-machine interfaces. With this setup, students are
not only able to use the same laboratory platform for
electric drives studies in the electric drives class, but are
also able to study LabVIEW design as part of the Test and
Measurement class. The intention is to further develop
this setup as a central laboratory platform for use in
other courses such as electronics system design, and
control. However, for this paper, the focus is on the
illustration of how this setup can benefit the subject
matter in two courses: electric drives and test and
measurement.
Index Terms - Electric drives, Hardware-in-the-loop,
LabVIEW, Test and measurement
INTRODUCTION
This paper presents a real-time instrumentation setup that
benefits the subject matter in two courses: electric drives and
test and measurement. The paper discusses virtual
instrumentation-based interfaces for real-time control and
display of electric machine drives. This approach will lead to
the flexibility of applying this setup as a platform to study
electric drives as well as the LabVIEW-based (from National
Instruments, Inc.) experimentation design.
In this lab, the machine drive is implemented using a
distributed real-time simulation system from Opal-RT [1]
with machines and power electronics drive board as
hardware-in-the-loop (HIL). The simulation executes on a
hardware configuration consisting of the Command Station
(host PC) communicating with the target node (another PC)
via Ethernet communication links, I/O boards interfaced to
HIL. The Command Station serves as the user interface to
edit and modify models, to view model data, to execute the
model, to convert the model into C code and compile the
code in the target node, and load the code onto each target
node. The target nodes perform real-time execution of the
model simulation and include a real-time communication
interface between the nodes and I/O modules. The models
are designed and implemented in Simulink (from The
Mathworks Inc.). For instance, the experiment to perform a
closed-loop control of a dc motor consists of the following
HIL setup: a dc motor under test coupled with a DC motor
as load, and a power-electronics drive board interfaced to the
dc motor under test. For the experiment, students are to
design and implement a closed-loop speed control of a DC
motor drive. The steps may involve (a) creating a Simulink
model for the dc motor, (b) designing and testing the
controller on the simulation model of the DC motor, (c)
replacing the DC motor model with the real motor, (d)
implementing the tuned controllers in real-time on the target
node, and (e) building the LabVIEW interface with controls
for variables such as the reference speed of the motor (rpm),
the reference frequency (Hz), numerical indicators to display
the frequency of the induction motor, the speed of the DC
motor, and graphs for phase voltage and phase current
waveforms.
The experimental setup is modeled after the one
proposed by the University of Minnesota [2], [3]. However,
the setup along with the modification to the model with the
dc motor assembly in the loop (HIL) is first correctly
executed under the RT-LAB real-time system solution. This
paper will (a) give a description of a real-time controlled
machine drive experiment; (b) explain the design of the
LabVIEW interface for test and measurement which serves
to enhance the flexibility and capability to provide
measurement analysis and control with visual interfaces. Not
only does this LabVIEW application enhance the
functionality of this experiment, but it also provides a
platform of implementation and testing for the students
studying LabVIEW design as part of the Test and
Measurement class.
The paper consists of five sections. Section 2 provides a
brief description of a real-time controlled dc machine drive
experiment as an illustration. Section 3 presents the
LabVIEW-based virtual instrumentation (VI) interface to this
experiment. In this section, response and analysis interfaces
978-1-4244-1970-8/08/$25.00 ©2008 IEEE
October 22 – 25, 2008, Saratoga Springs, NY
38th ASEE/IEEE Frontiers in Education Conference
T3H-1
Session T3H
for the electric drives experiment are presented. Section 4
outlines the conclusions and future considerations. Section 5
lists the references.
SECTION 2: HIL EXPERIMENTAL SETUP
Figure 1 displays the configuration of a typical dc drive
system as an illustration. The machine drive [1] shown in
Figure 1 is implemented originally using a distributed realtime simulation system from Opal-RT with electric machines
and power electronics drive board as hardware-in-the-loop
(HIL). The control algorithm for the dc drive system and its
associated monitoring graphical user interface (software
model) are modeled in Simulink and resides in the Opal-RT
simulation system. The software model simulation executing
on the Command Station (host PC) communicates with the
target node (another PC) via Ethernet communication links,
and I/O boards interfaced to HIL. The Command Station
serves also as the user interface to edit and modify models,
to view model data, to execute the model, to convert the
model into C code and compile the code on target node, and
load the code onto the target node. The target node performs
real-time execution of the model simulation and includes a
real-time communication interface between the node and I/O
modules.
The simulation model for the dc drive system under
study consists of a closed-loop control algorithm and the
user interface for controlling inputs and monitoring selected
signals as the outputs. The Opal-RT simulation system
requires two subsystem blocks. The main computational
elements of the model are always contained in the master
subsystem that starts with “SM_”. The console subsystem is
the subsystem operating on the command station that
enables the user to interact with the system. It contains all
the Simulink blocks related to acquiring and displaying data.
In RT-LAB, OpComm blocks are used to enable and save
communication setup information. All inputs to top-level
subsystems must first go through an OpComm block before
they can be used. The two subsystems are shown in Figure 2.
The details of the master subsystem, SM_Controller, are
shown in Figure 3. The master subsystem consists of the
following blocks:
(a) a speed controller and a current controller
(b) a PWM generator
(c) Analog In model that captures voltage and current
(d) a Speed measurement block to capture speed readings
The speed-control model receives the input signal,
Speed_ref, from the Console subsystem, SC_Console. This
signal is a slider gain (shown in Figure 4) and is used to alter
the duty cycle of the PWM pulses that are applied to the
Power Electronics Drive Board via the multi-function
OP5110-5120 digital I/O board for speed control of the DC
motor. This board has the capability to generate two
independent PWM voltage sources (A1B1C1 and A2B2C2)
from a constant DC voltage source. Hence two machines can
be independently controlled for independent control
variables, at the same time. However, for this experiment,
only phase A1 and B1 of one PWM voltage source is used as
in the H-bridge format for the dc motor control.
FIGURE 1
REAL-TIME CONTROLLED DC-DRIVE SYSTEM
FIGURE 2
SUBSYSTEMS OF THE MOTOR MODEL
The speed measurement model, on the other hand,
provides information on the speed, frequency, position, and
direction of rotation of the motor. This model makes use of
the event detector feature in the OP5110-5120 and the RealTime Events (RTE) library block from Opal-RT to generate
signals into states and times before converting into digital
waveform. The motor current, dc-voltage etc. from the
Power Electronics Drive Board are fed through analog-todigital module before going into the OP5110-5120.
The output of the speed controller is ia_ref that feeds
into the current-controller block. The current-controller
gives the necessary control voltage signal to the PWM
generator. The PWM generator in turn generates the PWM
signals needed to drive the power-electronics board as
shown in Figure 3.
The Console subsystem, shown in Figure 4, is used as
the human-machine interface (HMI). A slider is used as the
desired set point for speed reference which is fed back as
input to the master subsystem. The signals to be monitored,
978-1-4244-1970-8/08/$25.00 ©2008 IEEE
October 22 – 25, 2008, Saratoga Springs, NY
38th ASEE/IEEE Frontiers in Education Conference
T3H-2
Session T3H
such as speed, current, and voltage are connected to the
display scope as in indicated in Figure 4. Figures 5 and 6
show typical displays on the console indicators.
control experiment, the drive setup will naturally be given as
default where the control design principle can be exercised
and validated. It is one of the goals to have this HIL
experiment setup to be used as the central platform for other
subject matters such as control, power electronics, FPGA
design, etc. to be taught.
Once the controller is designed and validated on the
host PC, the DC motor model is removed and the controller
is put in the form as shown in Figure 3 for HIL simulation
and validation. Figure 5 shows the results collected in realtime and can be superimposed with the simulation results
obtained by Simulink to verify and validate the controller
design as well.
SC_Console
FIGURE 4
CONSOLE SUBSYSTEM
FIGURE 3
MASTER SUBSYSTEM
NON REAL-TIME EXPERIMENT SETUP
Non real-time experiment basically is the work required on
the host PC for controller design or any other validation
work needed before implementing the controller on the
target node for HIL simulation. For this particular
FIGURE 5
experiment, students are to design controller first on a
SPEED STEP CHANGE FROM 200 RAD/S TO 400 RAD/S
simulation model of the DC motor using Simulink. Students
are to design both the inner-loop current controller and the
outer-loop speed controller. The two control loops are PI
type of controllers. The design process is given and the DC
motor’s dynamic equations are given and derived from the
previous experiment. Figure 7 shows the cascade control of
DC motor at system level in Simulink. The details of this
particular experiment are available in [6]. Since the
intention of the drive lab is to focus on the understanding of
various aspects of drive components including its control,
FIGURE 6
the controller design is part of the work, but emphasized
THE CORRESPONDING CURRENT RESPONSE
only for a basic PI controller design. If this were to be a
978-1-4244-1970-8/08/$25.00 ©2008 IEEE
October 22 – 25, 2008, Saratoga Springs, NY
38th ASEE/IEEE Frontiers in Education Conference
T3H-3
Session T3H
FIGURE 7
SIMULINK MODEL FOR CASCADE CONTROLLER
As far as drive experiments are concerned, the inherited
Opal-RT HMI is sufficient for editing, loading, monitoring,
and data collection. Table 1 gives a list of experiments that
pertains to drive studies. This list of experiments is a
complete make over from those of [1] that have been
structured to work with Opal-RT system. They are available
at [6].
TABLE 1
ELECTRIC DRIVES EXPERIMENTS
Experiment
1
2
3
4
5
6
7
8
Topic
Introduction to the FPGA-based electric drives
system
Simulation and real-time implementation of a
switch-mode DC converter
No-load DC motor test
Characterization of DC motor
DC motor speed control
Four-quadrant operation of DC motor
Characterization of induction motor
V/F speed-control of a three-phase induction motor
SECTION 3: THE LABVIEW INTERFACE
As an alternative to the inherited Opal-RT HMI, the
LabVIEW interface is developed. The intention is to allow
students to study LabVIEW design as part of the Test and
Measurement class using electric drives setup as a platform.
The LabVIEW interface for this experiment is displayed
in Figure 8. This is a real-time interface with a single panel
comprising (a) controls for motor input variables such as the
reference speed, (b) numerical and graphical indicators to
display the speed of the DC motor, and (c) graphs for the
current and voltage waveform. The advantages of the
LabVIEW-based HMI are identified as follows:
enrolled in the Advanced Instrumentation & Measurement
course. The students were assigned to work in teams
comprising 2 to 3 members. The students were given a
working Simulink model of the DC motor drive. This model
consisted of the Master and Console subsystems as shown in
Figure 3 and Figure 4, respectively. First, the students
ensured that the model executed under RT-Lab control. To
do so they had to compile the model, assign the model to a
target, load the model, and execute the model. If this was
successful, they reset the model in RT-Lab. In this
experiment, the students had to build the LabVIEW GUI [4],
[5] shown in Figure 9 and execute the DC motor model
using their LabVIEW GUI. A template of the LabVIEW GUI
was provided to the students.
LABVIEW MODEL: FRONT PANEL
The front panel of this LabVIEW GUI consisted of the
following tabs.
(a)
(b)
(c)
(d)
Model Configuration
Model Manager
Model Controls - response interface
Model Analysis - analysis interface
The steps to build and execute the model using this GUI are
described as follows:
Model Configuration:
To load and connect to the model, first specify the path to
the model. The model is executed under the mode
“Hardware synchronized”. The target platform operates in
Windows NT and the embedded node is QNX195. The
model is executed on startup and reset before it is quit.
Model Manager:
In LabVIEW, the three choices to manage the model are (1)
Execute (2) Pause (3) Restart. For example, the model state
is “Running” when the model is executing.
Model Controls- response interface:
This portion of the front panel contains the user-defined
control signals and model time responses or indicators. The
control signals such as the desired direction of rotation are
sent to the model while the model responses such as speed,
voltage and current (functions of time) are received from the
(a) organized record of control inputs,
model. Figure 8 displays the front panel of the response
(b) systematic tracking of motor responses,
interface.
(c) clear presentation of the evidence of the experiment,
In order to integrate RT-Lab with LabVIEW, certain
and
subVI’s may be used to interact with the RT-Lab API. This is
(d) advanced measurement analysis (e.g. Fourier spectra, illustrated in one of the LabVIEW block diagrams in Figure
THD)
9. To send signals to the model, first find the sequence titled
Send data to target in the Acquisition section of the block
diagram of the LabVIEW GUI. Provide the signals to a Build
TYPICAL LABVIEW EXPERIMENT SETUP
Array node. Then, the wire coming out from this node is sent
to the SM_Controller subsystem through a subVI called
The laboratory experiment titled ‘Design LabVIEW APIs for OpalSetSignal2.vi. If one must send more signals to the
RT system models with HIL’ was performed by students model, increase the number of inputs in the Build Array
978-1-4244-1970-8/08/$25.00 ©2008 IEEE
October 22 – 25, 2008, Saratoga Springs, NY
38th ASEE/IEEE Frontiers in Education Conference
T3H-4
Session T3H
node. The signals connected to the Build Array must be in
the same order as they are connected to the OpComm block.
Similarly, if a vector is connected to the OpComm block, the
order must be the same as they are in the vector.
To send the desired signal to the appropriate indicator,
use an Index Array and specify the index which corresponds
to the position of the signal in the OpComm of the
SC_Console subsystem. Then wire the output of the Index
Array to the terminal of the indicator chosen. Note that both
OpalSetSignal2.vi and OpalGetAcqGroupSignals2.vi are
subVIs provided by Opal-RT as part of their API capability
to allow interface to other custom built interface.
Model Analysis- analysis interface:
This portion of the front panel contains the outcomes of any
time-based or frequency-based measurement analysis
performed on the signals. For instance, Figure 10 consists of
the display of the result of averaging done on the speed
readings as well as the result of the filtering done on the
current waveform.
FIGURE 8
LABVIEW-BASED RT INTERFACE
FIGURE 10
ANALYSIS INTERFACE
Additional analysis tools include analysis in the
frequency domain, total harmonic distortion (THD)
measurements for the specified motor response signals. The
steps to develop the analysis interface are as follows:
FIGURE 9
BLOCK DIAGRAM FOR LABVIEW MODEL
1.
Identify the signals received from the motor model on
which measurement analysis must be performed. The
acquisition of these signals has been discussed as part of
To receive signals from the model, find the sequence
the Model Controls - response interface.
titled Receive data from target in the Acquisition section of
the block diagram. Then use the subVI called 2. Implement the process of signal analysis using the
function palette provided by LabVIEW. This palette
OpalGetAcqGroupSignals2.vi. Provide the number of
includes virtual instruments for time-frequency analysis
signals that must be received in that group and the
and data filtering.
acquisition group one wishes to receive the data from.
3. Create the tab on the overall front panel of the interface
for the display of the outcomes of the analysis. Provide
an appropriate label for this tab.
978-1-4244-1970-8/08/$25.00 ©2008 IEEE
October 22 – 25, 2008, Saratoga Springs, NY
38th ASEE/IEEE Frontiers in Education Conference
T3H-5
Session T3H
At present, the students in the course on test and
measurement build only the response interface. The students
in each team had to properly identify and wire the signals
sent to the model (control inputs) as well as signals received
from the model (motor responses) as described above.
Thereafter, the DC Motor model was executed using their
LabVIEW GUI. The students had to observe and record the
motor variables for different settings of the real-time control
inputs. In future, the lab exercises in this course will include
both interfaces.
SECTION 4: CONCLUSIONS AND FUTURE WORK
The integration of the LabVIEW-based virtual
instrumentation with real-time control and display of electric
machine drives was successful. The LabVIEW interface
improves the laboratory experience for students in both
courses. Students in the electric drives course can monitor
and analyze the signals with more precision while those in
the instrumentation & measurement course can build and
customize the HMI for specific applications. In addition, the
LabVIEW-based interface promotes cross-course interaction
without either group required to have the knowledge of the
other group. For instance, the detail of the DC motor
experiment (motor equations, field analysis) is not required
in the design of the interface by the students of the
instrumentation course. Likewise, the execution of the DC
motor experiment with a well designed custom HMI does
not require knowledge of advanced LabVIEW concepts. The
details of the experimental setup for both the electric drives
[6] and the LabVIEW interface [7] are provided at the web
site.
The students in the instrumentation & measurement
course can employ LabVIEW to design and build the
integrated interface (the response interface and the analysis
interface) for the real-time study of electric drives. For the
analysis interface, the appropriate function blocks are
provided by LabVIEW. An alternate approach to perform the
real-time study of drives is to include the desired SIMULINK
blocks from MATLAB (e.g. FFT, filters) in the original drive
model prior to the creation of the LabVIEW interface for the
signals.
The introduction of real-time system control and data
acquisition in the Advanced Instrumentation & Measurement
course is the logical first step to train the students to become
effective design engineers in the workforce. However, the
following issues must be addressed for continuous growth
and improvement.
(a) include some theory sessions to reinforce RT concepts
and support the lab activity
(b) develop additional LabVIEW exercises with RT-HIL
control & analysis
(c) emphasize the use of LabVIEW tools for RT-HMI
design
(d) incorporate in-class lab demonstrations and student
presentations
(e) promote goal-oriented collaborative learning by
encouraging the students in the instrumentation class to
interact with the students in the electric drives class
(f) extend the coverage of the course or offer follow up
courses to include advanced RT data analysis and
interpretation
SECTION 5: REFERENCES
[1]
“Distributed Real-Time Power System,” Opal-RT manuals, 2007.
http://www.opal-rt.com.
[2]
Mohan, Ned, “DSP Based Electric Drives Laboratory – User Manual,”
Department of Electrical and Computer Engineering, University of
Minnesota, July 2007.
[3]
Mohan, Ned, “Electric Drives – An Integrative Approach,” MNPERE,
2003.
[4]
Ertugrul, Nesimi, “LabVIEW for Electric Circuits, Machines, Drives,
and Laboratories,” Prentice Hall, 2002.
[5]
Travis, Jeffrey and Kring, Jim, “LabVIEW for Everyone,” Third
Edition, Prentice Hall, 2007.
[6]
Mak, Fong, “OpalRT-based Real-Time Controlled Electric Drives
Laboratory – User Manual,” Department of Electrical and Computer
Engineering, Gannon University, December 2007.
http://ece.gannon.edu/labs.
[7] Sundaram, Ram, “LabVIEW-based Virtual Instrumentation with RealTime Control Experiments,” Department of Electrical and Computer
Engineering,
Gannon
University,
December
2007.
http://ece.gannon.edu/labs.
AUTHOR INFORMATION
Fong Mak, Associate Professor & Chair, ECE Dept.,
Gannon University, [email protected]
Ram Sundaram, Associate Professor, ECE Dept., Gannon
University, [email protected].
Varun Santhaseelan, Graduate student, ECE Dept., Gannon
University, [email protected]
Sunil Tandle, Graduate student, ECE Dept., Gannon
University,[email protected]
978-1-4244-1970-8/08/$25.00 ©2008 IEEE
October 22 – 25, 2008, Saratoga Springs, NY
38th ASEE/IEEE Frontiers in Education Conference
T3H-6