1
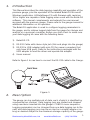
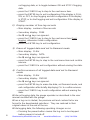
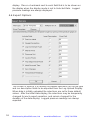
BETALOG
Data Logging User’s Manual
Distributed by MicroDAQ.com, Ltd
www.MicroDAQ.com
(603) 746-5524
BETALOG
Data Logging User’s Manual
1. Introduction
. . . . . . . . . . . . . . . . . . . . . . . . . . . . . . . . . . .1
2. Description . . . . . . . . . . . . . . . . . . . . . . . . . . . . . . . . . . . .1
3. Gauge Operation . . . . . . . . . . . . . . . . . . . . . . . . . . . . . . . .5
3.1 Data Logging Disabled . . . . . . . . . . . . . . . . . . . . . . . . . . . .5
3.2 Download Mode . . . . . . . . . . . . . . . . . . . . . . . . . . . . . . . . .5
3.3 Demand Mode . . . . . . . . . . . . . . . . . . . . . . . . . . . . . . . . . .7
4. BetaLOG Microsoft Windows Application . . . . . . . . . . . .9
4.1 Installation and Registration . . . . . . . . . . . . . . . . . . . . . . . . .9
4.2 Menus . . . . . . . . . . . . . . . . . . . . . . . . . . . . . . . . . . . . . . . .10
4.3 Main Display . . . . . . . . . . . . . . . . . . . . . . . . . . . . . . . . . . .12
4.4 Log Upload Display . . . . . . . . . . . . . . . . . . . . . . . . . . . . . .16
4.5 Display Options . . . . . . . . . . . . . . . . . . . . . . . . . . . . . . . . .17
4.6 Export Options . . . . . . . . . . . . . . . . . . . . . . . . . . . . . . . . .18
5. Excel Templates . . . . . . . . . . . . . . . . . . . . . . . . . . . . . . .21
5.1 Single Run Graph . . . . . . . . . . . . . . . . . . . . . . . . . . . . . . .22
5.2 Single Run Pressure and Tempeature Graph . . . . . . . . . . .22
6. Warranty . . . . . . . . . . . . . . . . . . . . . . . . . . . . . . . . . . . . .23
TRADEMARKS . . . . . . . . . . . . . . . . . . . . . . . . . . . . . . . . . . . . .24
Distributed by MicroDAQ.com, Ltd
www.MicroDAQ.com
(603) 746-5524
1.
Introduction
This Manual describes the data logging capability and operation of the
pressure gauge, plus the operation of the related BetaLOG Microsoft
Windows application. All BetaGauge PI's with firmware with revision
3.0 or higher are capable of data logging when used with the BetaLOG
software. This manual complements and extends the user manual
received with the pressure gauge. Please refer to the gauge manual for
additional information on its operation.
The BetaLOG application is used to configure logging parameters in
the gauge, and to retrieve logged data from the gauge for storage and
analysis on a personal computer. Before you start check to make sure
your data logging kit came with the following items:
1) BetaLOG CD
2) RS-232 Cable with stereo style jack (this end plugs into the gauge)
3) RS-232 to USB adapter (with mini-CD) for newer computers that
only have USB ports. Refer to the instructions packaged with the
USB adapter to load the driver and operate the adapter.
4) Users manual
Refer to figure 1 to see how to connect the RS-232 cable to the Gauge.
Figure 1
2.
Description
The gauge can log multiple sets of data, each of which is identified by
a sequential run number. Data logging runs are started and stopped
using new items inserted into the gauge's CONFIG menu sequence.
Logging parameters can be changed from one data logging run to the
next, and data logging runs may be as short as a single sample or as
long as desired subject to the maximum storage capacity of the gauge.
Distributed by MicroDAQ.com, Ltd
www.MicroDAQ.com
(603) 746-5524
1
The gauge can log pressure only for each sample, or it can log
pressure and temperature for each sample. This selection applies to
all runs and must be made prior to starting the first run.
When logging pressure only, the gauge has a capacity of 8500 data
records for storing run identification data and log sample data. Each
new data logging run requires 7 records for run identification overhead.
One record is required to log each sample, except for the triple value
case (average, minimum, maximum) where 3 records are required to
log each sample set.
Assuming a single run, the maximum capacity for all but the triple
value case is 8493 samples, and the maximum capacity for the triple
value case is 2831 sample sets.
When logging pressure and temperature, the gauge has a capacity of
5100 data records for storing run identification data and log sample
data. Each new data logging run requires 7 records for run
identification overhead. One record is required to log each sample,
except for the triple value case (average, minimum, maximum) where 3
records are required to log each sample set.
Assuming a single run, the maximum capacity for all but the triple
value case is 5093 samples, and the maximum capacity for the triple
value case is 1697 sample sets.
The interval time setting determines the frequency of sample
calculation and storage. Eleven discrete interval times are available,
ranging from 1 second to 1 hour.
A sample value is calculated at the end of each interval based on all of
the pressure measurements made during that interval. The sample
value may be the last measurement made in the interval, or it may be
the average, minimum, maximum, or median of all of the
measurements made during that interval.
A sample value may be stored for every interval during the run, only for
those intervals where the sample value exceeds a specified high or low
limit, or only for those intervals where the pressure differential during
the interval exceeds a maximum span.
The data logging function is disabled by default in all new gauges.
The BetaLOG application is used to enable and disable the data log
function in a gauge.
Two data logging modes are available, Download and Demand.
Multiple log runs are allowed in either mode, with the potential number
of runs dependent on the number of samples logged in each run and
the capacity of the gauge.
When the data logging mode is set to Download, the BetaLOG
application is used to enter or change the data logging parameters and
send them to the gauge. The gauge remains in this mode until either
2
Distributed by MicroDAQ.com, Ltd
www.MicroDAQ.com
(603) 746-5524
the BetaLOG application or the gauge 'CLEAr DATA' function is used
clear the logged data in the gauge, at which time the mode is set to
Demand. In Download mode none of the parameters may be changed
using the gauge menus and the downloaded values are always used
for each new log run. The BetaLOG application may be used to
change the logging parameters between runs without affecting
previously logged data stored in memory. The Download mode data
logging parameters are:
• Interval time selection:
- 1, 2, 5, 10, 30 seconds
- 1, 2, 5, 10, 30 minutes
- 1 hour
• Maximum number of samples to store per run. This may range from
1 to the full capacity of the gauge.
• Log type selection:
- Continuous. This is the most commonly used log type where a
sample is stored at every interval during the run. The sample
value stored is defined by the sample type selection below. The
run can be stopped manually, or stops automatically when the
log memory is full or the maximum number of samples per run is
logged.
- Trip high, where interval samples are stored during the run only
when the sample values exceed a high limit. Sample storage
starts when an interval's sample value becomes greater than the
trip setpoint, and continues at every interval until a subsequent
interval's sample value becomes less than the trip reset. Sample
storage then stops until a sample value again becomes greater
than the trip setpoint. The sample value stored, and used for
comparison, is defined by the sample type selection below. The
run can be stopped manually, or stops automatically when the
log memory is full or the maximum number of samples per run is
logged.
- Trip low, where interval samples are stored during the run only
when the sample values exceed a low limit. Sample storage
starts when an interval's sample value becomes less than the trip
setpoint, and continues at every interval until a subsequent
interval's sample value becomes greater than the trip reset.
Sample storage then stops until a sample value again becomes
less than the trip setpoint. The sample value stored, and used for
comparison, is defined by the sample type selection below. The
run can be stopped manually, or stops automatically when the
log memory is full or the maximum number of samples per run is
logged.
Distributed by MicroDAQ.com, Ltd
www.MicroDAQ.com
(603) 746-5524
3
- Trip Range, where interval samples are stored during the run
only when the pressure differential during the interval exceeds a
maximum span or range of values. Sample storage starts when
the difference between an interval's maximum and minimum
measurements becomes greater than the trip setpoint, and
continues at every interval until a subsequent interval's difference
becomes less than the trip reset. Sample storage then stops until
an interval's difference again becomes greater than the trip
setpoint. The run can be stopped manually, or stops
automatically when the log memory is full or the maximum
number of samples per run is logged.
• Sample type selection:
- Last measurement made in the sample interval.
- Average of all measurements made in the sample interval.
- Minimum of all measurements made in the sample interval.
- Maximum of all measurements made in the sample interval.
- Median of all the measurements made in the sample interval, the
midpoint between minimum to maximum measurements.
- Average, minimum, and maximum of all measurements made in
the sample interval. This requires 3 records of storage per
logged sample set and reduces capacity by a factor of 3.
• Log pressure unit selection. All supported pressure units including
custom.
• Trip setpoint expressed in log unit selection.
• Trip reset expressed in log unit selection.
• Log custom pressure unit factor.
When the data logging mode is set to the Demand mode the user can
set the gauge up to data log without the need to first connect it to the
computer. The gauge menus are used to enter and change some data
logging parameters, while the remaining parameters default to fixed
values. The gauge menus may be used to change the logging
parameters between runs without affecting previously logged data
stored in memory. The demand mode data logging parameters are:
• Interval time selection:
- 1, 2, 5, 10, 30 seconds
- 1, 2, 5, 10, 30 minutes
- 1 hour
• Maximum number of samples to log. This may range from 1 to the
full capacity of the gauge.
• Log type selection fixed at 'Continuous'.
4
Distributed by MicroDAQ.com, Ltd
www.MicroDAQ.com
(603) 746-5524
• Sample type selection fixed at 'Last measurement made in the
sample interval'.
• Log pressure unit selection. The unit is selected with the existing
configuration function before the log run is started.
• Trip setpoint not used.
• Trip reset not used.
• Log custom pressure unit factor. The factor is selected with the
existing configuration function before the log run is started
The gauge does not have real time clock capability, so the time stamp
on all samples in a run is elapsed days, hours, minutes and seconds
from run start. The BetaLOG application provides a feature for relating
each uploaded run start point to a real time base date and time. When
this feature is used, all uploaded elapsed time stamps in the run are
recalculated accordingly to get true time stamps of the form year,
month, day, hour, minute, second.
3.
Gauge Operation
3.1 Data Logging Disabled
Until data logging functionality is enabled using the BetaLOG
application, the gauge operates as described in the user manual
received with the gauge. You must connect the gauge to the
BetaLOG software to enable the logging function. This is true
for both Demand and Download modes.
3.2 Download Mode
Once data logging functionality is enabled, a new item is inserted at
the start of the gauge configuration menu tree to direct the user to a
completely separate branch which contains all data logging functions.
This new menu item shows 'LOG' in the main display and 'DATA' in the
secondary display. Press the CONFIG key to proceed to the existing
configuration functions, or press the ENTER key to proceed to the new
data logging branch. The data logging configuration menu sequence
(new branch) is as follows:
1) Start or stop data logging
• Main display: LOG
• Secondary display: FULL if the log memory is full, OFF if not
logging data, else ON if logging data.
• the ▼ and ▲ keys are ignored if the log memory is FULL,
otherwise press either key to toggle between OFF and START if
Distributed by MicroDAQ.com, Ltd
www.MicroDAQ.com
(603) 746-5524
5
not logging data, or to toggle between ON and STOP if logging
data.
• press the CONFIG key to step to the next menu item.
• press the ENTER key to exit configuration if the display is FULL,
ON, or OFF, to stop logging and exit configuration if the display
is STOP, or to start logging and exit configuration if the display is
START.
2) Display number of free log records
• Main display: number of free records
• Secondary display: FREE
• the ▼ and ▲ keys are ignored.
• press the CONFIG key to step to the next menu item if not
logging, otherwise it exits configuration.
• press the ENTER key to exit configuration.
3) Erase all logged data and set to Demand mode
• Main display: CLEAr
• Secondary display: DATA
• the ▼ and ▲ keys are ignored.
• press the ENTER key to step to the next menu item and confirm
erasure.
• press the CONFIG to exit configuration without erasing the data.
4) Confirm erasure of all logged data and set to Demand
mode
• Main display: CLEAr
• Secondary display: CNFRM
• the ▼ and ▲ keys are ignored.
• press the ENTER key to erase the data, set Demand mode, and
exit configuration after briefly displaying CLr to confirm erasure.
• press the CONFIG key to exit configuration without erasing the
data.
While not logging data, the gauge operates as described in the user
manual received with the gauge.
When a log run is started, the pressure unit and custom factor are
forced to the downloaded selections. They are restored to their
original values at the end of the run.
While logging data, the following operating changes occur:
6
• Pressing the power button causes the log run to be stopped
before power is turned off.
Distributed by MicroDAQ.com, Ltd
www.MicroDAQ.com
(603) 746-5524
• Forced power off on low battery detection causes the log run to
be stopped before power is turned off.
• The zero key is active and an event record (including the change
in the zero offset value) is placed in the log.
• Auto off is disabled. It is restored to its original value at the end
of the run.
• The engineering units, damp, sample rate, tare, and custom
factor items on the existing configuration menu are disabled.
• The units field on the display cycles between the units, the text
LOG, and the text RUN at a rate of once per second. This
provides visual feedback that data logging is active, and the
number after the text RUN identifies the run number for later
reference.
3.3 Demand Mode
The Demand mode allows the user to conduct an impromptu data
measurement/log without the need of a computer to configure all of the
logging parameters.
Once data logging functionality is enabled, a new item is inserted at
the start of the configuration menu tree to direct the user to a
completely separate branch which contains all data logging functions.
This new menu item shows 'LOG' in the main display and 'DATA' in the
secondary display. Press the CONFIG key to proceed to the existing
configuration functions, or press the ENTER key to proceed to the new
data logging branch. The data logging configuration menu sequence
(new branch) is as follows:
1) Start or stop data logging
• Main display: LOG
• Secondary display: FULL if the log memory is full, OFF if not
logging data, else ON if logging data.
• the ▼ and ▲ keys are ignored if the log memory is FULL,
otherwise press either key to toggle between OFF and START if
not logging data, or to toggle between ON and STOP if logging
data.
• press the CONFIG key to step to the next menu item.
• press the ENTER key to exit configuration if the display is FULL,
ON, or OFF, to stop logging and exit configuration if the display
is STOP, or to start logging and exit configuration if the display is
START.
Distributed by MicroDAQ.com, Ltd
www.MicroDAQ.com
(603) 746-5524
7
2) Display number of free log records
• Main display: number of free records
• Secondary display: FREE
• the ▼ and ▲ keys are ignored.
• press the CONFIG key to step to the next menu item if not
logging, otherwise it exits configuration.
• press the ENTER key to exit configuration.
3) Select logging interval
• Main display: interval choice presently selected, one of 1, 2, 5,
10, 30 for seconds, or 1, 2, 5, 10, 30 for minutes, or 1 for hours.
• Secondary display: time unit SEC, MIN, or HOUR as appropriate
for the choice presently selected
• press the ▼ key to decrease the interval selection, stopping at 1
second.
• press the ▲ key to increase the interval selection, stopping at 1
hour.
• press the CONFIG key to step to the next menu item.
• press the ENTER key to exit configuration.
4) Select maximum number of samples
• Main display: number of samples presently selected
• Secondary display: SAMPL
• press the ▼ key to decrease the number, stopping at 1.
• press the ▲ key to increase the number, stopping at the
maximum number of records 8500.
• press the CONFIG key to step to the next menu item.
• press the ENTER key to exit configuration.
5) Erase all logged data and set to Demand mode
• Main display: CLEAr
• Secondary display: DATA
• the ▼ and ▲ keys are ignored.
• press the ENTER key to step to the next menu item and confirm
erasure.
• press the CONFIG to exit configuration without erasing the data.
8
Distributed by MicroDAQ.com, Ltd
www.MicroDAQ.com
(603) 746-5524
6) Confirm erasure of all logged data and set to Demand
mode
• Main display: CLEAr
• Secondary display: CNFRM
• the ▼ and ▲ keys are ignored.
• press the ENTER key to erase the data, set Demand mode, and
exit configuration after briefly displaying CLr to confirm erasure.
• press the CONFIG key to exit configuration without erasing the
data.
While not logging data, the gauge operates as described in the user
manual received with the gauge.
When a log run is started, the pressure unit and custom factor are left
at the values set by the existing configuration functions.
While logging data, the following changes occur:
• Pressing the power button causes the log run to be stopped
before power is turned off.
• Forced power off on low battery detection causes the log run to
be stopped before power is turned off.
• The zero key is active and an event record (including the change
in the zero offset value) is recorded in the log.
• Auto off is disabled. It is restored to its original value at the end
of the run.
• The engineering units, damp, sample rate, tare, and custom
factor items on the existing configuration menu are disabled.
• The units field on the display cycles between the units, the text
LOG, and the text RUN at a rate of once per second. This
provides visual feedback that data logging is active, and the
number after the text RUN identifies the run number for later
reference.
4.
BetaLOG Microsoft Windows Application
This application provides the following features:
• set up data logging configuration in a gauge
• upload logged data from the gauge, including export of run data to
text, CSV, and Excel format files
• clear logged data from the gauge
The application requires Microsoft Windows 2000 (SP4), XP (SP2), or
Vista. Exporting data to Excel files requires Microsoft Excel version
2002 or later.
Distributed by MicroDAQ.com, Ltd
www.MicroDAQ.com
(603) 746-5524
9
4.1 Installation and Registration
Insert the distribution CD into the drive on your computer. The install
should start automatically. If it does not, navigate to the drive
containing the CD and run the program "setup.exe". Follow the
prompts on the screen to install the application.
BetaLOG must be registered and activated within seven days of
installation. Full operation is available for seven days, but is then
restricted until activation is completed. A registration screen is
displayed at startup until activation is completed. Click Cancel to
proceed directly to the application. Fill in the requested information
and click REGISTER to save it to a text file on disk. Email this file to
Martel as an attachment, or print and fax it, per the contact information
on the support screen. When Martel returns the activation key, enter it
at the bottom of the registration screen and click ACTIVATE to
complete the process.
BetaLOG must be registered and activated separately on each
computer on which it is installed.
4.2 Menus
The control buttons on the Main Display are intended to be the primary
method used to operate the application. The menu items duplicate the
functions of these buttons for those users who are more comfortable
with menu style operation.
The terms of the software license permit the installation of the BetaLOG
application on a single computer. Please contact technical support for
re-installation or to move the application to another computer.
4.2.1 File Menu
The File Menu contains the application exit function:
Exit
Exit the Data Log Utility.
4.2.2 Gauge Menu
The Gauge Menu contains the functions required to interact with the
gauge:
10
Connect
Connect to the gauge and retrieve the gauge
description and data logging setup. The
communications port to which the gauge is
connected must be selected on the Main Display
before using this item. See the Connecting to a
Gauge description in the Main Display section 4.3.
Disconnect
Disconnect from the gauge. See the Disconnecting
from a Gauge description in the Main Display
section 4.3.
Distributed by MicroDAQ.com, Ltd
www.MicroDAQ.com
(603) 746-5524
Upload Data
Upload all data logging runs from the gauge and
show them on the Log Upload Display described in
section 4.4. The data may be exported from that
display. See the Uploading Logged Data description
in the Main Display section 4.3.
Clear Data
Erase all data logging runs from the gauge. See the
Clearing Logged Data description in the Main
Display section 4.3.
Send Setup
Send the setup data to the gauge. See the Sending
Setup Configuration description in the Main Display
section 4.3.
Retrieve Setup
Retrieve the setup data from the gauge. See the
Retrieving Setup Configuration description in the
Main Display section 4.3.
4.2.3 Options Menu
The Options Menu contains functions for specifying the default display
and export options. These functions are described in detail in sections
4.5 and 4.6 below.
4.2.4 Help Menu
The Help Menu contains the functions required to obtain help and
support information:
Help
Display online help
Support
Display customer support information.
Registration
Register BetaLOG and display registration
information
About
Display application description and version
information.
Distributed by MicroDAQ.com, Ltd
www.MicroDAQ.com
(603) 746-5524
11
4.3 Main Display
The top portion of the display contains controls to connect to a gauge,
disconnect from a gauge, upload logged data, clear logged data, and
exit the application. Once connected to a gauge, it shows the model,
serial number, and firmware version of the gauge, plus the number of
data logging records presently used and free.
The lower portion of the display contains controls to configure data
logging parameters in a gauge, send the configuration to a gauge, and
retrieve the present configuration from a gauge.
Connecting to a Gauge
Select the communications port to which the gauge is connected and
click the Connect button. The gauge description, present capacity,
and present setup are retrieved from the gauge and displayed in the
appropriate fields. The button description and function changes to
Disconnect. A connection must be established before any other
actions may be performed. To change to another gauge, first
disconnect from the present gauge and reconnect.
Disconnecting from a Gauge
Click the Disconnect button. The button description and function
changes to Connect and all displayed data is cleared.
Uploading Logged Data
Click the Upload button. The logged data is uploaded and shown on
the Log Upload Display described in section 4.4. A progress display
shows percent complete and an estimate of the time remaining in the
upload.
12
Distributed by MicroDAQ.com, Ltd
www.MicroDAQ.com
(603) 746-5524
Clearing Logged Data
Click the Clear button. After confirmation of the action, all logged data
is cleared from the gauge, the data logging mode is set to Enabled,
Demand, and all data on the display is refreshed.
Sending Setup Configuration
After making the desired selections, click the Send button. The
configuration is sent to the gauge and all data on the display is
refreshed. The data logging mode must be set to Enabled, Download
to change anything more than the mode.
Retrieving Setup Configuration
Click the Retrieve button. The gauge description, present capacity,
and present setup are retrieved from the gauge and displayed in the
appropriate fields.
Setup Configuration Fields
Data Logging
Disabled
Disable data logging in the gauge. All data
logging functions are removed from the
gauge's CONFIG menu sequence.
Enabled, Download
Enable data logging in the gauge with all
logging parameters downloaded from this
application. All data logging functions
associated with parameter changes are
removed from the gauge's CONFIG menu
sequence. The only gauge functions
available are starting and stopping data
logging, displaying the number of free
records, and clearing all logged data.
Enabled, Demand
Enable data logging in the gauge with all
logging parameters set in the gauge. This
application may only be used to upload
logged data, clear all logged data, retrieve
data logging parameters, and change the
data logging mode. The data logging
functions available in the gauge's CONFIG
menu sequence are starting and stopping
data logging, displaying the number of free
records, changing the logging interval,
changing the samples per run, and clearing
all logged data. The log type is fixed at
Continuous and the sample type is fixed at
Interval End.
Distributed by MicroDAQ.com, Ltd
www.MicroDAQ.com
(603) 746-5524
13
Interval
One of the following sampling intervals:
1, 2, 5, 10, or 30 seconds
1, 2, 5, 10, or 30 minutes
1 hour
Samples/Run
The maximum number of samples to log per run. This may range
from 1 to 8500.
Log Temperature
– Yes
– No
Log Type
14
Continuous
A sample is stored at every interval during
the run. The sample value stored is defined
by the sample type selection below. This is
most common type of logging.
Trip high
Interval samples are stored during the run
only when the sample values exceed a high
limit. Sample storage starts when an
interval's sample value becomes greater
than the trip setpoint, and continues at every
interval until a subsequent interval's sample
value becomes less than the trip reset.
Sample storage then stops until a sample
value again becomes greater than the trip
setpoint. The sample value stored, and
used for comparison, is defined by the
sample type selection below.
Trip low
Interval samples are stored during the run
only when the sample values exceed a low
limit. Sample storage starts when an
interval's sample value becomes less than
the trip setpoint, and continues at every
interval until a subsequent interval's sample
value becomes greater than the trip reset.
Sample storage then stops until a sample
value again becomes less than the trip
setpoint. The sample value stored, and
used for comparison, is defined by the
sample type selection below.
Distributed by MicroDAQ.com, Ltd
www.MicroDAQ.com
(603) 746-5524
Trip range
Interval samples are stored during the run
only when the pressure differential during
the interval exceeds a maximum span or
range. Sample storage starts when the
difference between an interval's maximum
and minimum measurements becomes
greater than the trip setpoint, and continues
at every interval until a subsequent interval's
difference becomes less than the trip reset.
Sample storage then stops until an interval's
difference again becomes greater than the
trip setpoint.
Sample Type
One of the following:
- Interval end, the last measurement made in the sample
interval
- Average of all measurements made in the sample interval
- Minimum of all measurements made in the sample interval
- Maximum of all measurements made in the sample interval
- Median of all measurements made in the sample interval,
the midpoint between minimum and maximum
- Average, minimum, and maximum of all measurements
made in the sample interval. This requires 3 records of
storage per logged sample set and reduces capacity by a
factor of 3.
Unit
Any pressure unit supported by the present gauge configuration,
including custom.
Custom Factor
Custom unit conversion factor expressed as units per psi.
Trip Setpoint
Trip setpoint as defined for the Log Type selected above,
expressed in the log unit selected above.
Trip Reset
Trip reset as defined for the Log Type selected above, expressed in
the log unit selected above.
Distributed by MicroDAQ.com, Ltd
www.MicroDAQ.com
(603) 746-5524
15
4.4 Log Upload Display
The top portion of the display lists the individual data logging runs
found in the uploaded data. To display a run's data in the lower portion
of the display, highlight it by clicking on it.
Use the Display Mode box to select the subset of run data displayed:
All Data, Selected Data, or Readings Only. When the Display Mode is
set to Selected Data, click the Change Selection button to modify the
display options. This is described further under Display Options in
section 4.5.
The gauge has no realtime clock so the uploaded data samples are
initially tagged by elapsed day and time from run start. Also the runs
are described simply by numeric position within the uploaded data. To
enter a more descriptive label and a true calendar base date and time
for a run, highlight the run and click the Set Date/Label button. The
base date and time are added to the elapsed day and time for each
sample to provide a true calendar date and time for each sample.
To export an individual run, highlight the run and click the Save Run
button. The Export Options screen is shown to allow the options to be
customized for exporting this run. Next, a standard Save As screen is
shown for selecting the file name and the folder where the file is to be
placed. Click the Cancel button of either screen to skip the export.
16
Distributed by MicroDAQ.com, Ltd
www.MicroDAQ.com
(603) 746-5524
The Export Options screen is described further under Export Options in
section 4.6.
To export all runs, click the Save All button. The Export Options screen
is shown to allow the options to be customized for exporting these
runs; the same options are used for all runs. For each run, a standard
Save As screen is shown for selecting the file name and the folder
where the file is to be placed. Click the Cancel button of the Save As
screen for an individual run to skip the export of that run. Click the
Cancel button of the Export Options screen to skip the export of all
runs. The Export Options screen is described further under Export
Options in section 4.6.
Export to an Excel file requires Excel 2002 or later to be installed on
your computer.
The default location for files is the folder "Martel BetaLOG" in "My
Documents".
4.5 Display Options
This screen is used to modify the default selections for the run
description fields shown on the Log Upload Display when the display
mode is set to Selected Data. When data is initially uploaded the
selections are set to these default values. After the initial data display,
the selections may be temporarily changed for the duration of the data
Distributed by MicroDAQ.com, Ltd
www.MicroDAQ.com
(603) 746-5524
17
display. Place a checkmark next to each field that is to be shown on
the display when the display mode is set to Selected Data. Logged
pressure readings are always displayed.
4.6 Export Options
This screen is used to it to modify the default selections for the file type
and run description fields to be exported from the Log Upload Display.
When data is initially uploaded the selections are set to these default
values. After the initial data display, the selections may be temporarily
changed for each export operation, and remain changed for the
duration of the data display. Logged pressure readings are always
exported.
18
Distributed by MicroDAQ.com, Ltd
www.MicroDAQ.com
(603) 746-5524
The selections are as follows:
File Type
TXT File
A formatted text file that may be printed
directly or opened in a text editor. The run
description fields are placed on separate
lines at the beginning of the file, followed by
a line for each logged data sample and zero
change.
CSV File
An Excel Comma Separated Variable file
where each data item on a line is enclosed
in quotation marks and all items are
separated by commas. The run description
fields are placed on separate lines at the
beginning of the file, followed by a line for
each logged data sample and zero change.
New Excel File A new Excel spreadsheet (xls) file. The
locations of the run description fields,
logged data samples, and zero changes
within the spreadsheet are specified in the
Excel Cell column below. This option
requires Excel 2002 or later to be installed
on your computer.
Excel Template An Excel spreadsheet (xls) file based on a
predefined Excel template (xlt) file. The
locations of the run description fields,
logged data samples, and zero changes
within the spreadsheet are specified in the
Excel Cell column below. These locations
must be coordinated with the fixed data in
the template. This option requires Excel
2002 or later to be installed on your
computer.
Multiple runs in
Single File
When the upload contains multiple data
logging runs, export all runs to a single file.
Separate Files When the upload contains multiple data
logging runs, export each individual run to a
separate file.
Excel Template
When the file type is set to Excel Template, the template to
be used is selected here. Click on the Browse button and
navigate to the desired template file. See section 5 for more
information on Excel templates.
Distributed by MicroDAQ.com, Ltd
www.MicroDAQ.com
(603) 746-5524
19
Include Field
Place a checkmark next to each field that is to be exported.
Logged pressure readings are always exported.
Insert Description
An optional field description may be included for each field
being exported. Place a checkmark on each field
description that is to be included.
Excel Cell
Enter the cell location where the data is to be placed. Cell
columns may range from A to YZ. Cell rows may range from
1 to 99999. The data fields are placed as follows:
Run description fields
If the field description is included, the field
description is placed in the specified cell and the
field value is placed in the next cell to the right. If
the field description is not included, the field value is
placed in the specified cell. The Gauge Description
has 4 values (manufacturer, model, serial number,
and firmware version) all in one cell separated by
commas. The Log and Data Type, Trip Setpoint and
Reset, and Initial Zero and Tare fields each consist of
two data items which occupy two rows, each with its
own description and field value, with the second row
immediately below the first.
Zero Changes
Zero changes are listed one per row starting at the
specified cell row. There are four field values for
each zero change: the date, the time, the new zero
setting, and the pressure unit. The second, third,
and fourth values are placed in the immediately
adjacent cells to the right of the first. If the field
description is included, the field description is
placed in the specified cell column and the field
values are placed in the next cell columns to the
right. If the field description is not included, the field
values are placed in the specified cell columns.
Pressure Readings
Pressure readings are listed one per row starting at
the specified cell row. There are four field values for
each single value pressure reading: the date, the
time, the reading, and the pressure unit. The
second, third, and fourth values are placed in the
immediately adjacent cells to the right of the first.
20
Distributed by MicroDAQ.com, Ltd
www.MicroDAQ.com
(603) 746-5524
There are six field values for each triple value
pressure reading: the date, the time, the average
reading, the minimum reading, the maximum
reading, and the pressure unit. The second, third,
etc. values are placed in the immediately adjacent
cells to the right of the first. If the field description is
included, the field description is placed in the
specified cell column and the field values are placed
in the next cell columns to the right. If the field
description is not included, the field values are
placed in the specified cell columns.
Temperature Readings
If temperature readings are available in the uploaded
data, they are listed one per row starting at the
specified cell row. There are two field values for
each single value sample: the temperature, and the
temperature unit. The second value is placed in the
immediately adjacent cell to the right of the first.
There are four field values for each triple value
sample: the average temperature, the temperature at
the time of the minimum pressure, the temperature
at the time of the maximum pressure, and the the
first. If the field description is included, the field
description is placed in the specified cell column
and the field values are placed in the next cell
columns to the right. If the field description is not
included, the field values are placed in the specified
cell columns.
5.
Excel Templates
An Excel template contains predefined text, titles, graphs, and
calculations which are merged with uploaded pressure data to form a
more complete spreadsheet presentation. A template may be reused
many times, thus avoiding unnecessary work reformatting raw data.
Templates are created with Excel in the same manner as normal
spreadsheets and they support all Excel features. They are stored with
the special ".xlt" suffix to differentiate them from normal spreadsheets,
and to avoid overwriting them when saving merged data.
The field options and Excel cell locations specified on the Export
options screen must be coordinated with the predefined data in the
template to ensure a correct merging of the data.
The sample templates provided with BetaLOG are described below.
They are provided in a separate folder on the distribution media and
must be manually copied to your hard drive.
Distributed by MicroDAQ.com, Ltd
www.MicroDAQ.com
(603) 746-5524
21
5.1 Single Run Graph
This template provides custom titles and a graph of the merged data.
The graph vertical axis is scaled to the range of the uploaded pressure
values and the horizontal axis is scaled to the number of samples
uploaded.
The template file name is:
BetaLOG-template-single-run-pressure-graph.xlt
The Export options corresponding to this template are as follows:
Field
Include Field
Insert Description
Excel Cell
Run # or Label
Yes
No
B3
Gauge Description
Yes
No
B5
Log and Sample Type
Yes
No
B10
Interval Time
Yes
No
B12
Pressure Unit
Yes
No
B8
Custom factor
Yes
Yes
B18
Trip Setpoint and Reset
Yes
Yes
B16
Initial Zero and Tare
Yes
Yes
B14
Zero Changes
Yes
No
J24
Temperature Readings
No
No
any
Pressure Readings
Yes
No
B24
5.2 Single Run Pressure and Temperature Graph
This template provides custom titles and a graph of the merged data.
The pressure graph vertical axis is scaled to the range of the uploaded
pressure values and the horizontal axis is scaled to the number of
samples uploaded. The temperature graph vertical axis is scaled to
the range of the uploaded temperature values and the horizontal axis is
scaled to the number of samples uploaded.
The template file name is:
BetaLOG-template-single-run-pressure-temperature-graph.xlt
The Export options corresponding to this template are as follows:
22
Distributed by MicroDAQ.com, Ltd
www.MicroDAQ.com
(603) 746-5524
Field
Include Field
Insert Description
Excel Cell
Run # or Label
Yes
No
B3
Gauge Description
Yes
No
B5
Log and Sample Type
Yes
No
B10
Interval Time
Yes
No
B12
Pressure Unit
Yes
No
B8
Custom factor
Yes
Yes
B18
Trip Setpoint and Reset
Yes
Yes
B16
Initial Zero and Tare
Yes
Yes
B14
Zero Changes
Yes
No
N44
Temperature Readings
Yes
No
I44
Pressure Readings
Yes
No
B44
Note: Additional templates may be available on the software CD-ROM
or by download from our website. Detailed descriptions for each are in
the template file.
6.
Warranty
The media on which you receive this software is warranted not to fail,
due to defects in materials or workmanship, for a period of 90 days
from date of shipment. Martel Electronics Corporation will, at its
option, repair or replace the media upon notice of such failure. Martel
Electronics Corporation does not warrant that the operation of the
software shall be uninterrupted or error free. In no event shall Martel
Electronics Corporation be liable for any damages arising out of, or
related to, the use of the software.
Martel Electronics Corporation has carefully reviewed all
documentation related to the software for technical accuracy. In the
event that technical or typographical errors exist, Martel Electronics
Corporation reserves the right to make changes to subsequent
revisions of the documentation without prior notice to holders of the
current revision. In no event shall Martel Electronics Corporation be
liable for any damages arising out of, or related to, the use of the
documentation, or the information contained in it.
The foregoing warranties are in lieu of all other warranties, express or
implied, including but not limited to the implied warranties of
merchantability and fitness for a particular purpose.
Distributed by MicroDAQ.com, Ltd
www.MicroDAQ.com
(603) 746-5524
23
TRADEMARKS
Trademarks or trade names are subject to state and federal laws
concerning their unauthorized use or other infringements. The fact that
the product marks or names in this software, and related
documentation, do not bear a trademark symbol does not mean that
the product mark or name is not registered as a trademark or trade
name. Any queries concerning ownership or existence of any
trademarks or trade names mentioned in this software, and related
documentation, should be independently confirmed with the
manufacturer or distributor of the product.
24
Distributed by MicroDAQ.com, Ltd
www.MicroDAQ.com
(603) 746-5524
Distributed by MicroDAQ.com, Ltd
www.MicroDAQ.com
(603) 746-5524
www.martelcorp.com
e-mail: [email protected]
Tel: (603) 434-1433 800-821-0023
Fax: (603) 434-1653
Martel Electronics
3 Corporate Park Dr.
Derry, NH 03038
0200041 Rev A 10/09
Distributed by MicroDAQ.com, Ltd
www.MicroDAQ.com
(603) 746-5524