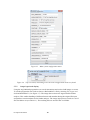
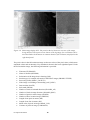
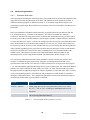
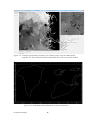
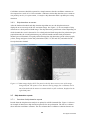
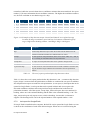
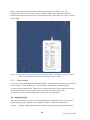
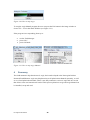
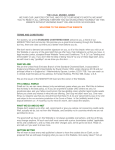
1
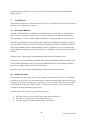
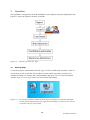
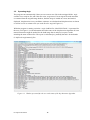
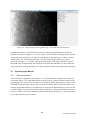
FFI-rapport 2013/01858
Aegir installation and user manual
Tonje Nanette Hannevik and Richard B. Olsen
FFI
Forsvarets
forskningsinstitutt
Norwegian Defence Research Establishment
FFI-rapport 2013/01858
Aegir installation and user manual
Tonje Nanette Hannevik and Richard B. Olsen
Norwegian Defence Research Establishment (FFI)
19 November 2013
FFI-rapport 2013/01858
1210
P: ISBN 978-82-464-2318-0
E: ISBN 978-82-464-2319-7
Keywords
Syntetisk Aperture Radar (SAR)
Automatisk skipsdeteksjon
RADARSAT-2
Konfidensestimat
Polarimetri
Approved by
Richard B.Olsen
Project Manager
Johnny Bardal
Director
2
FFI-rapport 2013/01858
English summary
There have been many civilian Synthetic Aperture Radar (SAR) satellites in orbit. The
Norwegian Defence and the Norwegian Coast Guard have used the Canadian SAR satellites
RADARSAT-1 and RADARSAT-2 operatively for fisheries surveillance in the Northern areas
since 1998. Around 1900 SAR images are ordered and analysed by the Norwegian Defence each
year.
To ease the task of monitoring Norway’s vast economic and fisheries protection zones in the
North, it is helpful to have an automatic ship detection tool. Aegir is a SAR ship detection tool
developed at the Norwegian Defence Research Establishment (FFI). Aegir ingests and loads data
on screen and analyses each polarisation channel separately. Aegir can also combine polarisation
channels for better ship-to-sea contrast to be able to detect more ships, and the ship detection
algorithm can be run on the fused polarisation channel.
There are two versions of Aegir. The first version is fully automatic. A status window is
presented and the user also gets to see a SAR image where the land mask and the ship detections
are added. In the end the program produces ship detection reports. The second version gives the
possibility for the user to actively manage how the program will run and it also has the possibility
for the user to make a manual mask, for example over sea ice.
This user manual explains how Aegir can be installed, set up and used.
FFI-rapport 2013/01858
3
Sammendrag
Det har vært mange sivile Syntetisk-Aperture-Radar-satellitter (SAR) i bane. Forsvaret og
Kystvakten har brukt SAR-satellittene RADARSAT-1 og RADARSAT-2 operativt siden 1998 til
fiskeriovervåking i nordområdet. Ca. 1900 SAR-bilder blir hvert år bestilt og analysert av
Forsvaret.
For å lette overvåkingen av Norges store økonomiske soner og fiskerisoner i nord, er det nyttig å
ha et automatisk skipsdeteksjonsverktøy. Ægir er et SAR skipsdeteksjonsverktøy som er utviklet
ved Forsvarets forskningsinstitutt. Ægir leser og laster data opp på skjermen og analyserer hver
polariseringskanal for seg. Ægir kan også slå sammen polariseringskanaler for å bedre skip-tilsjø-kontrasten og dermed detektere flere skip. Skipsdeteksjonsalgoritmen kan kjøres på denne
sammenslåtte polariseringskanalen.
Ægir finnes i to versjoner. Den første versjonen er en fullautomatisk versjon der brukeren får
presentert et statusvindu under analysen og i tillegg får se et SAR-bilde der landmasken og
skipsdeteksjonene blir lagt på. Til slutt lager programmet skipsdeteksjonsrapporter. Den andre
versjonen gir mulighet for brukeren til aktivt å være med og styre hva programmet skal gjøre og
manuelt lage en maske, for eksempel over is.
Denne brukermanualen forklarer hvordan Ægir kan installeres, settes opp og brukes.
4
FFI-rapport 2013/01858
Contents
Contents
5
1
Introduction
7
1.1
Aegir
7
1.2
Aegir Manual
7
2
Installation
8
2.1
IDL Virtual Machine
8
2.2
Setting up Aegir
8
3
Operation
10
3.1
Starting Aegir
10
3.2
Operating Aegir
11
3.3
Operating Aegir Manual
12
3.3.1
Main configuration
12
3.3.2
Image ingest and display
13
3.4
Land mask generation
16
3.4.1
Automatic land mask
16
3.4.2
Manual land mask
18
3.5
Fusing polarimetric channels
19
3.6
Ship detection
19
3.6.1
Target detection
19
3.6.2
Confidence estimates
21
3.6.3
Ship detections on screen
22
3.7
Ship detection reports
22
3.7.1
Overview of ship detection reports
22
3.7.2
kml report for Google Earth
23
3.7.3
Manual reports
24
3.8
Stopping Aegir
24
4
Summary
25
References
26
FFI-rapport 2013/01858
5
6
FFI-rapport 2013/01858
1
Introduction
There have been many civilian Synthetic Aperture Radar (SAR) satellites since ERS-1 and ERS-2
were launched in 1991 and 1995. Then RADARSAT-1, ENVISAT, RADARSAT-2, ALOS,
TerraSAR-X, TanDEM-X and the COSMO SkyMed satellites followed. The Norwegian Defence
and the Norwegian Coast Guard have used the SAR satellites RADARSAT-1 and RADARSAT-2
operatively for fisheries surveillance in the Northern areas since 1998.
Aegir is a SAR ship detection tool, developed at the Norwegian Defence Research Establishment
(FFI), which can ease the task of monitoring Norway’s vast economic and fisheries protection
zones in the North. Aegir ingests and loads data on screen and analyses each polarisation channel
separately. Aegir can also combine polarisation channels for better ship-to-sea contrast to be able
to detect more ships, and the ship detection algorithm can be run on the fused polarisation
channel.
There are two versions of Aegir. The first version is fully automatic. A status window is
presented and the user also gets to see a SAR image where the land mask and the ship detections
are added. In the end the program produces ship detection reports. The second version gives the
possibility for the user to actively manage how the program will run and it also has the possibility
for the user to make a manual mask, for example over sea ice.
This user manual describes how to install and run the SAR marine imagery analysis tool Aegir 1
using the IDL virtual machine. Aegir is currently a prototype written in the IDL language. In
order to run Aegir, you will need either a full version of IDL or an installation of the IDL Virtual
Machine, available from Exelis (www.exelisvis.com/idlvm). Two versions are available, Aegir
and Aegir Manual.
1.1
Aegir
The first version, Aegir, is a fully automatic ship detector that searches for new files in a folder,
and runs automatically throughout the whole algorithm. The outputs are different ship detection
reports. Aegir is used on all incoming SAR images. Aegir produces a text file with file names of
SAR image files that should be analysed manually by Aegir Manual.
1.2
Aegir Manual
The second version, Aegir Manual, is also an automatic ship detector, but here the user can
interact more throughout the algorithm. The outputs are different ship detection reports. The
program displays the different SAR images in the available polarisations on screen. When the
1
Aegir is the god of the sea in Norse mythology. He was both worshipped and feared by sailors. They
believed that Aegir would occasionally appear on the surface to take ships, men and cargo alike, with him
to his hall at the bottom of the ocean. Sacrifices were made to appease him, particularly prisoners, before
setting sail.
FFI-rapport 2013/01858
7
ship detection algorithm is run, the user can look at the ship detections displayed on the SAR
image on screen.
2
Installation
This section describes how to install and set up Aegir. If you already have IDL or the IDL Virtual
Machine, you can proceed to Section 2.2.
2.1
IDL Virtual Machine
The IDL Virtual Machine is a runtime version of IDL that can execute IDL sav files without an
IDL license. It is designed to provide IDL users with a simple no-cost method for distributing
IDL applications. It runs on all IDL supported platforms, and does not require a license to run.
The IDL Virtual Machine can be installed either from an IDL distribution CD-ROM or from the
Exelisvis IDL web site: www.exelisvis.com/idlvm. Installations of IDL 6.0 and later include the
IDL Virtual Machine, but the Virtual Machine can also be installed by itself. To install the IDL
Virtual Machine from the IDL installer on the IDL 8.1 CD-ROM or from the EXELIS Download
Web site:
Windows users - click the IDL Virtual Machine button at the IDL Selection screen.
UNIX users - if you have the IDL CD-ROM, select IDL Virtual Machine from the Product menu
on the Product Information screen. If you have downloaded the IDL Virtual Machine from the
RSI web site, simply follow the on-screen instructions.
Mac OS X users - select IDL Virtual Machine from the Choose Install Set screen.
2.2
Setting up Aegir
The operation of Aegir requires access to the following folders shown in Table 2.1. The Default
folder needs to be set up as a system environment variable named AegirDIR. This can be done by
entering Control Panel, selecting System and Security, System, Advanced System Settings, and in
the end clicking on the Advanced tab. Figure 2.1 shows how to define a system environmental
variable for the fully automatic program Aegir.
Once the folders have been set up, do the following steps:
•
•
•
Place the coastline.zip file in the coastline data folder and unzip it.
Place the etc.zip file in the etc data folder and unzip it.
Place the Aegir.zip file in the Default folder, and unzip it.
8
FFI-rapport 2013/01858
Figure 2.1 Definition of a system environment variable for Aegir.
Folder name
Folder address
Folder purpose
Default folder:
G:\MyTools\Aegir
Main folder for program and temporary work files
Work folder:
G:\MyTools\Aegir\work\
Holding intermediary files
Etc folder:
G:\MyTools\Aegir\etc
Configuration files
Products folder: G:\MyTools\Aegir\products
Output of analyses end up here
Data folder
G:\MyTools\Aegir\unzipped
Main input data directory
Manual folder
G:\MyTools\Aegir\manual_files
List over files to be analyzed manually and image data
folders of these files
Coastline data
G:\Data\coastline
Table 2.1
FFI-rapport 2013/01858
Coastline data files for land masking
Folders needed to operate Aegir.
9
3
Operation
The algorithm is configured to run on RADARSAT-2 data single-pol, dual-pol and quad-pol data.
Figure 3.1 shows the general work flow of AEGIR.
Figure 3.1 General work flow for Aegir
3.1
Starting Aegir
To start the program, either double-click the Aegir.sav file to start the fully automatic version or
Aegirmanual.sav file to start the version where user intervention is possible (see Figure 3.2).
Another possibility is to start the IDL Virtual Machine, then press Click To Continue and then
open the Aegir.sav or the Aegirmanual.sav file located at the Desktop.
Figure 3.2 To start the programs, double-click the Aegir icon (left) to run the fully automatic
version and the Aegirmanual icon (right) on the Desktop to run the version where it
is possible with user intervention.
10
FFI-rapport 2013/01858
3.2
Operating Aegir
The program runs automatically if there are one or more new files in the unzipped folder. Aegir
searches for a ready.txt file, and if this file exists, Aegir starts. First an ingest file with meta data
is extracted from the original image headers, then the image is loaded on screen, land mask is
displayed, ship detection is run, confidence estimates are calculated and ship detections are shown
on screen as well as written to file (see work flow for Aegir in Figure 3.1).
While the program is running a window “Aegir SAR DATA ANALYSIS TOOL” is presented for
the user (see Figure 3.3) with information about the status of the ship detection algorithm. If some
manual interaction might be needed for the SAR image that is analysed, a report is made
including the name of these files. The report is called analyze_manually.dat and is located under
G:\MyTools\Aegir\manual_files.
Figure 3.3 Window presented for the user with status of the ship detection algorithm.
FFI-rapport 2013/01858
11
Figure 3.4 Image display showing SAR image, land mask and ship detections.
If manual interactions are needed, the user can use the program Aegir Manual to do manual
analysis as needed (see chapter 3.3). If a user wants to use the analyze_manually.dat file, and the
Aegir program is running, the user needs to copy the file to somewhere else, so there is no user
conflict on the file. If no manual interaction is needed, ship detection reports are made as
described in chapter 3.7. A window showing the SAR image, SAR image with land mask and
then SAR image with land mask and detections in all polarisation channels are shown while the
Aegir program is working (see Figure 3.4). Key metadata is shown to the right of the SAR image.
3.3
3.3.1
Operating Aegir Manual
Main configuration
The main system configuration menu (Figure 3.5) is found under the Configure item on the top
level menu (Figure 3.6). It determines where necessary files go, and also controls features of the
image display GUI, such as the size of the overview display of the whole image (see Figure 3.8).
This menu should generally only be used in connection with the initial system setup. The work
directory and products directory are required to be located in the Default directory. Likewise, the
Coastline folders are required to be located in the data directory. The help tab shown at the top of
Figure 3.7 displays the Aegir Configuration information (shown in Figure 3.5), and it is possible
to save this information in text format.
12
FFI-rapport 2013/01858
Figure 3.5 Main system configuration menu.
Figure 3.6 Top level menu, illustrating where the main configuration menus are found.
3.3.2
Image ingest and display
Using the Aegir Manual program the user can do interactions and see the SAR images on screen.
To run the program the user needs to choose a RADARSAT-2 file by selecting File, Ingest and
load and RADARSAT-2 (see Figure 3.7). The image data set chosen is ingested before further
analyses. This enables handling of different formats and metadata during the original file input,
and produces consistent data sets for further analyses. The image ingest process results in a set of
files for further use (see Table 3.1). The resulting files are stored in the work folder.
FFI-rapport 2013/01858
13
Figure 3.7 How to start the ship detection.
File name
File purpose
<filename>.ing
Ingest file with meta data extracted from original image headers
<filename>.XX
Image data file for each polarisation, where ‘XX’ can be ‘HH’,’VV’,
‘VH’, or ‘HV’ according to transmitted and received polarisation
<filename>.XX.tif
Tiff file for each polarisation in the data set, at reduced resolution, used
in the overview panel of the Image Display GUI.
Table 3.1 The set of files produced after the ingest process.
After the ingest process is finished, the file is loaded to screen, and can be viewed at the end of
the ship detection process. The Image Display GUI (IDGUI) shows an overview of the image to
the left in low resolution with the ship detections done, and allows the user to move a square
cursor around to examine details in the image (see Figure 3.8), displayed to the right in full
resolution. The square is 600 pixels x 600 pixels. Under the full resolution image, information
about the pixels in the image is shown. It is possible to move the cursor around in the small
image, and the following information is shown below the image:
•
•
•
•
•
•
•
•
Longitude and latitude of the cursor
Pixel and line value of the cursor. The lower left corner has the value (0,0) and the upper
right part has the value (600,600).
Pixel value
Average pixel value of the 600 pixels x 600 pixels frame
Average pixel value in dB of the 600 pixels x 600 pixels frame
Sigma0 value of the pixels inside the frame
Incidence angle in the middle of the frame
Reference position which is the pixel and line number of the lower left corner of the
square in the big low resolution image.
14
FFI-rapport 2013/01858
Figure 3.8 Main image display GUI. The panel on the left shows an overview of the image
being analysed. The square cursor shown in the big image (low resolution) can be
moved around with the mouse to examine details in full resolution, displayed in the
right hand panel.
The pixel values in the full resolution image are the true values of the pixel values, which mean
amplitude values and not intensity. Key metadata is shown in the lower right hand panel. Under
the full resolution image, the following information is provided:
•
•
•
•
•
•
•
•
•
•
•
•
•
•
•
•
Filename (FILENAME)
Name of satellite (SENSOR)
Polarisation of the image that is showing (POL)
Product type, for example AP mode for ENVISAT images (PRODUCTTYPE)
Processing facility (PROC_FACILTY)
If the image is ascending or descending (ASC_DESC)
Date and time (DATE)
Sub swath (BEAM)
Number of looks in azimuth direction (NLOOKS_AZ)
Number of looks in range direction (NLOOKS_RNG)
Number of pixels in entire image (NLINES)
Number of lines in entire image (NPIXELS)
Length of one pixel in meters (DX)
Length of one line in meters (DY)
Mean value of pixels in image (MEAN_VAL)
Variance of pixels in image (VARIANCE)
FFI-rapport 2013/01858
15
3.4
Land mask generation
3.4.1
Automatic land mask
After ingesting and loading the SAR image data, a land mask must be produced and applied to the
image files before the ship detection can be done. The land mask can be produced by either 1)
different coastline polygons of different accuracy or 2) a baseline along the Norwegian coast
(grunnlinjen), Spitsbergen, Bear Island, Novaya Zemlya, Franz Josef Land, Kola, Jan Mayen and
Greenland.
In the first method the standard coastline data files are adapted from an open data set from the
U.S. Geological Survey, available on the Internet. The data are available in 5 different
resolutions, with the best being about 100 m resolution and an absolute accuracy of about 500 m.
For many parts of the world this method is good enough to produce a land mask that is sufficient,
even for ship detection. Figure 3.9 shows an example from the Norwegian coast which shows that
many small islands are not contained in the database. We can also see a small offset, which is to
be expected, given the accuracy of the coastline data, the geo-referencing data based on predicted
orbits, and the algorithm used to project the coastline data onto the image. In the second method
territorial sea borders have been used to make a boundary that covers all small islands in the
northern areas. This method is used to be sure that small islands and part of land are not
misinterpreted as vessels using the first method. The land mask is shown in Figure 3.10 .
Geo-referencing information from the image metadata is used to calculate the presence and
location of coastline polygons in the image. Polygons are subsequently filled with a userspecified mask value beside Coast data file on the Land Mask Tool Configuration menu (Figure
3.11), and subsequently applied to the image data to create a masked file. The Land Mask Module
produces two files, located in the work folder (see Table 3.2). Once the land mask step is done,
the program starts to apply the geophysical analysis algorithms. Each of the major steps is carried
out by corresponding modules. The behaviour and performance of each module is controlled
through a configuration menu. The configuration parameters are stored in separate files that are
automatically loaded when a given module is activated.
File name
File purpose
<filename>.msk.XX
Masked image data file for each polarisation, where ‘XX’ can be
‘HH’,’VV’, ‘VH’ or ‘HV’ according to transmitted and received
polarisation
<filename>.msk.XX.tif
Tiff file for each polarisation in the data set, at reduced resolution, used
in the overview panel of the IDGUI.
Table 3.2
The land mask module produces two files.
16
FFI-rapport 2013/01858
Figure 3.9 Example of land mask generated for an example image using the land mask file
high.dat. It is shown that all land and small islands are not covered by this method.
Figure 3.10 Land Mask produced based on territorial sea borders.
FFI-rapport 2013/01858
17
Figure 3.11 Left: Where to find the Land Mask Tool Configuration. Right: Configuration parameters
for the Land Mask module.
3.4.2
Manual land mask
It is possible to define a manual land mask. This can be used for example if there is ice in the
image, so the ice should not be misinterpreted as vessels. The manual land mask can be started by
pressing the “Define mask” button (red oval in Figure 3.12). Then the manual land mask can be
defined by clicking on several points with the left mouse button, and when finished clicking the
right mouse button. Then the land mask generation starts. The manual land mask is made together
with the land mask made using the coast data file defined under the Land Mask Tool
Configuration (see Figure 3.11). Figure 3.10 shows how the manual and automatic land mask
generation can be combined. The manual land mask is shown in black to the left and the
automatic land mask is shown in the upper right corner of the figure.
Figure 3.12 Land Mask produced based on a manual defined mask and a land mask made based
on territorial sea borders.
18
FFI-rapport 2013/01858
3.5
Fusing polarimetric channels
Two different polarimetric fusions for enhancing vessels have been implemented in Aegir, one
for dual-polarimetric SAR images and one for quad-polarimetric SAR images. When dualpolarised images are available, Aegir combines the two polarimetric channels by multiplying the
amplitude of the two channels (co-polarisation and cross-polarisation) and dividing by a constant
(average sea background in the image):
| co − pol | ⋅ | cross − pol |
const
(3-1)
When quad-polarised data are available, the amplitude values of the VV-channel are subtracted
from the amplitude values in the HH-channel (double bounce), and the result is multiplied by the
volume scattering (HV):
| HH − VV | * | HV |
(3-2)
Combining the polarimetric channels is done automatically when starting the ship detection. It is
possible to view the additional polarimetric “channel” (see Figure 3.13). Ship detection is run on
the fused polarimetric channel in addition to the other polarimetric channels.
Figure 3.13 The location where it is possible to choose the fused polarimetric “channel” (see red
circle to the left).
3.6
3.6.1
Ship detection
Target detection
The Ship Detection module has a large configuration menu, found by choosing Configure, Tools
and Ships in the Aegir SAR Data Analysis Tool status window, shown in Figure 3.14.
FFI-rapport 2013/01858
19
Figure 3.14 How to find the Configure Ship Detection Tool.
Figure 3.15 General parameters for the Ship Detection module.
The Configuration Ship Detection Tool menu contains a general section, a section for the Kdistribution algorithm and a section for confidence estimate. The configuration menu also allows
the user to enable or disable the confidence estimate procedures. Furthermore the operator can
specify parameters as follows:
•
•
•
•
•
Minimum separation distance (in meters): Targets closer than this are merged into a
single target for further analysis.
Minimum distance to land (meters): Buffer zone to prevent small islands and intertidal
zone being detected as vessels.
Minimum and maximum number of target pixels: Targets outside these limits are rejected
either as noise or as something too big to be a vessel.
Maximum and minimum acceptable ship length (meters): Targets outside these limits are
rejected as unreasonable.
Size of imagette, pixels (x) and lines (y): An imagette (area around each target) is
extracted for calculation of target to background contrast ratios.
20
FFI-rapport 2013/01858
The ship detection algorithm that is used is the K-distribution algorithm, and it is based on the
Probability Density Function (PDF). A threshold value and model parameters are estimated for
each frame. The three main parameters are the L (Equivalent Number of Looks), the order
parameter, ν, of the K-distribution and the Constant False Alarm Rate (CFAR) [1].
3.6.2
Confidence estimates
Figure 3.16 Configuration parameters for detection confidence estimation in the Ship Detection
module
Approaches to confidence estimates are discussed in [2]. The implemented algorithm uses
estimates of ship size, ship to sea contrast and target shape to estimate confidence. The operator
may specify weights for each “piece of evidence”, according to preference and experience. The
configuration parameters for this module need to be tuned according to the discussion in [2]. The
Confidence section in the Configure Ship Detection Tool is shown in Figure 3.16.
Confidence estimates are estimated for each polarisation channel and also for the combined
polarisation channel. The incidence angle of the detected target is taken into account. A limit is
set at 35°, and targets detected below this angle for co-polarisation are weighted lower than
targets located above 35°. For cross-polarisation the incidence angle dependence is not so
important. Which channels and how many channels the targets are detected in are also taken into
account. These factors are used to increase or decrease the confidence estimates (see [2] for more
details).
FFI-rapport 2013/01858
21
Confidence measures should be reported in a simple manner, thus the confidence estimates are
also reported on a scale of 0-3. Here a number 3 indicates certain ship detection (or as certain as
one possibly can be), 2 is quite certain, 1 is maybe a ship detection and 0 is probably not a ship
detection.
3.6.3
Ship detections on screen
After the land mask module and ship detection algorithm are run, the ship detections are
displayed on screen on top of the low resolution image. See Figure 3.17 for an example of ship
detections on a dual-polarised SAR image. The ship detections get different colours depending on
which channel the vessel is detected in. For a dual-polarised SAR image the first polarisation gets
purple diamonds, the second polarisation gets yellow diamonds and the fused polarimetric
channel gets red diamonds. For quad-polarised images the ship detections get the colours purple,
yellow, orange and green for the four polarisations (HH, VV, HV and VH), and white for the
fused polarisation channel.
Figure 3.17 Main image display GUI. The panel on the left shows an overview of the image
being analysed. The square cursor shown in the big image (low resolution) can be
moved around with the mouse to examine details in full resolution, displayed in the
right hand panel.
3.7
3.7.1
Ship detection reports
Overview of ship detection reports
Results from the ship detection analysis are printed in ASCII formatted files. Figure 3.18 shows
an example of data from a ship detection report file for one polarisation. The last two columns
show detection confidence estimates. The first column shows confidence estimates that are not
22
FFI-rapport 2013/01858
normalized, while the second column shows confidence estimates that are normalized. See report
number [2] for more information about confidence estimates. The higher the confidence numbers
are, the more confident we are that the target is a ship.
# of
ID pixels Peak val
CmassX CmassY Longitude Latitude LOA
Beam
Hdg1
Hdg2
Confi- Confidence dence2
1 142
1.8868385e+009 1294.49 985.013 8.1030310 66.044412 122.94156 7.8400450 2.0698947 182.06989 738
3
2 15
1.1631063e+009 1377.88 1236.95 8.1262675 66.030652 14.225390 2.5995044 356.05120 176.05120 26
2
3 112
2658065.0
3
4 27
1.3825874e+009 1233.71 1810.06 8.0575033 66.012689 112.17421 63.581889 359.75828 179.75828 17
2
5 30
3.1711562e+008 1183.16 2394.01 8.0225994 65.990521 164.62504 97.278747 1.2817049 181.28170 18
2
6 98
1.3056598e+009 1114.24 2472.31 7.9953512 65.990065 124.85661 44.630403 0.48380694 180.48381 92
3
1302.90 1410.11 8.0940248 66.026470 217.31832 15.423478 356.20206 176.20206 523
Figure 3.18 Example of ship detection output. CmassX and CmassY are weighted average
locations in image coordinates (pixel and line). LOA means estimated length of
target, Hdg1 means heading estimate 1 and Hdg2= Hdg1+180 degrees.
File name
File purpose
.ships
Common ship detection report where the results from all detections in all
polarisation channels available are combined into one report
XX.ships
One text report for each polarisation, where ‘XX’ can be ‘HH’,’VV’, ‘VH’, or
‘HV’ according to transmitted and received polarisation.
XX.ships.kml
One report for each polarisation that can be opened in Google Earth.
HH.ships_maria.xml
One xml report for each polarisation that can be opened in Maria.
HH_IncConf.ships
One text report for each polarisation with increased confidence estimates after
using the incidence angle and detection information from all polarisation
channels.
Table 3.3
The set of reports produced after ship detection is done.
Table 3.3 shows the set of reports produced after ship detection is run. A common ship detection
report (.ships) is written where the polarisations available are combined in one report. In addition
four ship detection reports are made for each polarisation: 1) text report, 2) kml report that can be
opened in Google Earth, 3) xml report that can be opened in Maria and 4) text report with
increased confidence estimates after using incidence angle and detection results from all
polarisation channels. All of the reports, except ships_maria.xml report, have two numbers for
heading, where one is the estimated heading and the other is the estimated heading + 180°. The
ships_maria.xml report only reports course, which is heading1, because this is what maria
supports. The heading/course can be the reported number or the reported number + 180°.
3.7.2
kml report for Google Earth
If Google Earth is installed on the computer, the kml file can be opened in Google Earth. An icon
is shown at the coordinates of each of the detected targets. When an icon is selected using the
FFI-rapport 2013/01858
23
mouse, a label containing information about the target appears (see Figure 3.19). This
functionality can be used to compare targets detected in SAR images with AIS (Automatic
Identification System) messages from vessels in the same area, since these also can be viewed in
Google Earth.
Figure 3.19 Targets shown as green diamonds in Google Earth. Clicking one green diamond, a
white label with information about the detected target is shown.
3.7.3
Manual reports
Aegir does some tests throughout running the program. If manual user intervention is needed, due
to for example ice in the SAR image, a report, analyze_manually.dat, is produced under
G:\MyTools\Aegir\manual_files. Then the user can open this report, and see which SAR image
files that need manual user intervention under the analysis. The user can press the
Aegirmanual.sav file on the Desktop and run Aegir with user intervention
3.8
Stopping Aegir
When Aegir is started by the user, it will keep running until stopped by the user. The user can
stop the program by pressing the Cancel button (see Figure 3.20) on the “Waiting for 5
minutes…” window, which appears between each time the program analyses SAR image files.
24
FFI-rapport 2013/01858
Figure 3.20 How to stop Aegir.
To stop the Aegir Manual program, the user can press the Exit button in the image window or
choose File – Exit in the Status Window (see Figure 3.21).
If the program is not responding, then try to:
•
•
•
use the Task Manager
press Ctrl C
press Ctrl Break
Figure 3.21 How to stop Aegir Manual.
4
Summary
The SAR automatic ship detection tool, Aegir, has been developed at the Norwegian Defence
Research Establishment. Aegir runs ship detection on all polarisation channels separately, as well
as on a fused polarisation channel. There is one fully automatic version of Aegir and one version
that allows some user interaction if needed. This report explains how Aegir and Aegir Manual can
be installed, set up and used.
FFI-rapport 2013/01858
25
References
[1] C. Brekke, "Automatic Ship Detection Based on Satellite SAR," FFI rapport 2008/0084,
2008.
[2] T. N. A. Hannevik and R. B. Olsen, "Automatic ship detection and confidence estimates"
FFI Rapport-2013/01859, 2013.
26
FFI-rapport 2013/01858
Acronyms
AIS
CFAR
Co-pol
Cross-pol
Dual-pol
FFI
H
HH
HV
IDGUI
IDL
PDF
Quad-pol
SAR
V
VH
VV
Automatic Identification System
Constant False Alarm Rate
Co-polarisation
Cross-polarisation
Dual-polarisation
Forsvarets Forskningsinstitutt
Horisontal polarisation
Horisontally transmitted – Horisontally received polarisation
Horisontally transmitted – Vertically received polarisation
Image Display GUI
Interactive Data Language
Probability Density Function
Quad-polarisation
Synthetic Aperture Radar
Vertical polarisation
Vertically transmitted – Horisontally received polarisation
Vertically transmitted – Vertically received polarisation
FFI-rapport 2013/01858
27