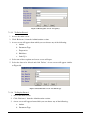
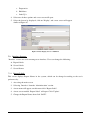
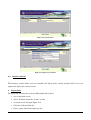
1
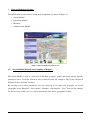
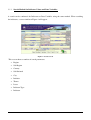
Africa Environment Outlook Environment Information System
(AEO-EIS)
AEO-EIS
User Manual
January 2005
1
Table of Contents
TABLE OF CONTENTS ...................................................................................................................................................... 2
LIST OF FIGURES ............................................................................................................................................................... 3
1
INTRODUCTION........................................................................................................................................................ 7
HOW TO RUN AEO-EIS............................................................................................................................................ 8
3
DATA AND INDICATORS SYSTEM:...................................................................................................................... 9
3.1
SEARCH MODULE METHODS AND COMPILING OF REPORTS: ................................................................................. 9
DATA ENTRY MODULE ........................................................................................................................................ 25
METADATA MODULE .......................................................................................................................................... 29
ADMINISTRATION MODULE ................................................................................................................................. 33
EXPERTS DATABASE: ........................................................................................................................................... 48
4.1
SEARCH COMPONENT: ......................................................................................................................................... 48
DATA ENTRY OF EXPERTS DATABASE ................................................................................................................. 56
ADMINISTRATION COMPONENT ...................................................................................................................... 60
REFERENCE ......................................................................................................................................................... 60
INTERFACE: ......................................................................................................................................................... 65
6
DOCUMENTS DATABASE:.................................................................................................................................... 68
SEARCH MODULE METHODS AND COMPILING OF REPORTS: ............................................................................... 68
GEOGRAPHIC PREFERENCE GROUP ..................................................................................................... 70
6.2
DATA ENTRY MODULE:....................................................................................................................................... 75
ADMINISTRATION ................................................................................................................................................. 79
REFERENCE ......................................................................................................................................................... 79
INTERFACE SCREENS: .......................................................................................................................................... 85
8
SECURITY MODULE .............................................................................................................................................. 87
8.1
REFERENCE SECTION ........................................................................................................................................... 87
8.2
INTERFACE SECTION ............................................................................................................................................ 90
EXPORT DATA......................................................................................................................................................... 90
2
List of Figures
FIGURE 1 LOG IN SCREEN.......................................................................................................................... 8
FIGURE 2 MAIN MENU ............................................................................................................................ 8
FIGURE 3 DATA AND INDICATORS MAIN SCREEN ...................................................................................... 9
FIGURE 4 SEARCH SCREEN ..................................................................................................................... 10
FIGURE 5 REPORT TYPE LIST .................................................................................................................. 14
FIGURE 6 SPATIAL REPORT .................................................................................................................... 15
FIGURE 7 EXTRACTING INDICATOR VALUES FOR KENYA........................................................................ 19
FIGURE 8 GRAPH ILLUSTRATING INDICATOR VALUES FOR KENYA ......................................................... 20
FIGURE 9 SEARCHING FOR INDICATOR VALUES FOR GHANA .................................................................. 20
FIGURE 10 GRAPH ILLUSTRATING INDICATOR VALUES FOR GHANA ....................................................... 21
FIGURE 11 GRAPH ILLUSTRATING INDICATOR VALUES FOR WESTERN AFRICA ...................................... 21
FIGURE 12 SEARCHING FOR INDICATOR VALUES FOR TUNISIA ............................................................... 22
FIGURE 13 PRINTABLE VERSION OF THE TUNISIA COUNTRY DATASHEET ............................................... 23
FIGURE 14 INDICATOR DATASHEET (COUNTRY) FOR TUNISIA ................................................................ 23
FIGURE 15 DATA VARIABLE SEARCH SCREEN ........................................................................................ 24
FIGURE 16 MAIN DATA ENTRY SCREEN ................................................................................................. 25
FIGURE 17 WORLD DATA ENTRY SCREEN .............................................................................................. 27
FIGURE 18 ENTERING WORLD DATA...................................................................................................... 27
FIGURE 19 DATA UPDATE SCREEN ......................................................................................................... 28
FIGURE 20 DATA DELETION SCREEN ...................................................................................................... 28
FIGURE 21 DATA DISPLAY SCREEN ........................................................................................................ 29
FIGURE 22 METADATA SEARCH SCREEN................................................................................................ 30
FIGURE 23 METADATA RESULT SCREEN ................................................................................................. 30
FIGURE 24 METADATA ADDITION SCREEN ............................................................................................. 31
FIGURE 25 HOW TO ADD DATA TO THE METADATA ............................................................................... 32
FIGURE 26 ELEMENT NAME SCREEN ....................................................................................................... 32
FIGURE 27 ELEMENT DETAIL DATA ENTRY SCREEN............................................................................... 33
FIGURE 28 MAIN REFERENCE SCREEN .................................................................................................... 34
FIGURE 29 NEW DATA ENTRY – SUB NATIONAL .................................................................................... 35
FIGURE 30 DATA UPDATE SCREEN – COUNTRY ...................................................................................... 36
FIGURE 31 DATA DELETION SCREEN – COUNTRY ................................................................................... 37
FIGURE 32 DATA DISPLAY SCREEN – COUNTRY ..................................................................................... 38
FIGURE 33 ADDING A NEW THEME ......................................................................................................... 39
3
FIGURE 34 ADDING NEW ISSUES ............................................................................................................. 40
FIGURE 35 ADDING A NEW INDICATOR ................................................................................................... 41
FIGURE 36 INDICATOR TYPE ................................................................................................................... 41
FIGURE 37 SPECIFYING THE INDICATOR TYPE ......................................................................................... 41
FIGURE 38 MAIN SCREEN - SELECTING THEMES INDICATOR MATRIX .................................................... 42
FIGURE 39 ADDING A NEW INDICATOR AND LINKING IT TO A THEME ..................................................... 42
FIGURE 40 MATRIX SCREEN – THEME, INDICATOR, ISSUE AND INDICATOR TYPE ................................... 43
FIGURE 41 THEME - INDICATORS MATRIX .............................................................................................. 43
FIGURE 42 IMPORT DATA SCREENS ......................................................................................................... 45
FIGURE 43 SELECT DATA SHEET ............................................................................................................. 45
FIGURE 44 DATA SHEET AFTER SELECTION ............................................................................................. 45
FIGURE 45 CHANGING A REPORT NAME ................................................................................................. 46
FIGURE 46 CHANGING A FIELD NAME ..................................................................................................... 46
FIGURE 47 CHANGING SCREEN NAMES ................................................................................................... 47
FIGURE 48 EXPERT DATABASE MAIN SCREEN......................................................................................... 48
FIGURE 49 EXPERT DATABASE SEARCH SCREEN ..................................................................................... 49
FIGURE 50 REPORT TYPE LIST ................................................................................................................ 51
FIGURE 51 EXTRACTING EXPERTS FOR EGYPT ........................................................................................ 52
FIGURE 52 REPORT ILLUSTRATING EXPERT MALE FOR EGYPT ................................................................. 53
FIGURE 53 SEARCHING SPECIFIED SPECIALTIES ...................................................................................... 53
FIGURE 54 REPORT ILLUSTRATING EXPERT RESUME FOR SOIL DEGRADATION ........................................ 54
FIGURE 55 SEARCHING FOR EXPERTS WITH SPECIALTY OF AIR POLLUTION AND PH.D DEGREE .............. 54
FIGURE 56 COUNTRY BRIEF REPORT OF EXPERT ..................................................................................... 55
FIGURE 57 SEARCHING FOR EXPERT FROM ALGERIA .............................................................................. 55
FIGURE 58 SPECIALTY BRIEF REPORT FOR EXPERT FROM ALGERIA......................................................... 56
FIGURE 59 MAIN DATA ENTRY SCREEN ................................................................................................. 56
FIGURE 60 EXPERT DATA MANIPULATION SCREEN ................................................................................ 58
FIGURE 61 UPDATE / DATA ENTRY SCREEN ............................................................................................ 58
FIGURE 62 DATA DELETION SCREEN ...................................................................................................... 59
FIGURE 63 DATA DISPLAY SCREEN......................................................................................................... 59
FIGURE 64 MAIN REFERENCE SCREEN .................................................................................................... 60
FIGURE 65 NEW DATA ENTRY – SUB NATIONAL .................................................................................... 61
FIGURE 66 DATA UPDATE SCREEN – COUNTRY ...................................................................................... 62
FIGURE 67 DATA DELETION SCREEN – COUNTRY ................................................................................... 63
FIGURE 68 DATA DISPLAY SCREEN – COUNTRY ..................................................................................... 64
4
FIGURE 69 LOOK UP’S SCREEN ............................................................................................................... 65
FIGURE 70 LOOK UP’S SCREEN- ADD ..................................................................................................... 65
FIGURE 71CHANGING A REPORT NAME .................................................................................................. 66
FIGURE 72 CHANGING A FIELD NAME ..................................................................................................... 67
FIGURE 73 CHANGING SCREEN NAMES ................................................................................................... 67
FIGURE 74 DOCUMENTS DATABASE MAIN SCREEN ................................................................................. 68
FIGURE 75 DOCUMENTS DATABASE SEARCH SCREEN ............................................................................. 69
FIGURE 76 REPORT TYPE LIST ................................................................................................................ 71
FIGURE 77 EXTRACTING DOCUMENTS FOR KENYA ................................................................................. 72
FIGURE 78 REPORT ILLUSTRATING DOCUMENTS FOR KENYA ................................................................. 72
FIGURE 79 SEARCHING FOR PUBLISHER VALUES FOR CEDARE ............................................................ 73
FIGURE 80 REPORT ILLUSTRATING DOCUMENT VALUES FOR CEDARE ................................................ 73
FIGURE 81 REPORT ILLUSTRATING DOCUMENT VALUES FOR CEDARE (PAGE 2) .................................. 73
FIGURE 82 SEARCHING FOR DOCUMENT VALUES FOR CALL NUMBER: 55454........................................ 74
FIGURE 83 REPORT FOR DOCUMENT VALUES FOR CALL NUMBER = 55454 ............................................. 74
FIGURE 84 MAIN DATA ENTRY SCREEN ................................................................................................. 75
FIGURE 85 MAIN DATA ENTRY SCREEN TO ADD .................................................................................... 76
FIGURE 86 MAIN DATA ENTRY SCREEN TO QUERY AND UPDATE ............................................................ 77
FIGURE 87 UPDATE SCREEN.................................................................................................................... 77
FIGURE 88 DATA DELETION SCREEN ...................................................................................................... 78
FIGURE 89 DATA DISPLAY SCREEN......................................................................................................... 78
FIGURE 90 MAIN REFERENCE SCREEN .................................................................................................... 79
FIGURE 91 NEW DATA ENTRY – SUB NATIONAL .................................................................................... 80
FIGURE 92 DATA UPDATE SCREEN – COUNTRY ...................................................................................... 81
FIGURE 93 DATA DELETION SCREEN – SUB REGIONS ............................................................................. 81
FIGURE 94 NEW DATA ENTRY – AUTHOR ............................................................................................... 83
FIGURE 95 DATA UPDATE SCREEN – FREQUENCY .................................................................................. 84
FIGURE 96 DATA DELETION SCREEN – DOCUMENT TYPE ....................................................................... 84
FIGURE 97 DATA DISPLAY SCREEN – PUBLISHER .................................................................................... 85
FIGURE 98 UPDATE SCREENS .................................................................................................................. 86
FIGURE 99 USERS AND SECURITY SCREEN .............................................................................................. 88
FIGURE 100 USER NAMES AND SYSTEM NAMES ..................................................................................... 89
FIGURE 101 ADDING A NEW USER .......................................................................................................... 89
FIGURE 102 SYSTEM NAMES ................................................................................................................... 90
FIGURE 103 UPDATE SYSTEM NAME....................................................................................................... 90
5
FIGURE 104 THE EXPORT SCREEN ............................................................................................................ 91
FIGURE 105 THE MESSAGE AFTER EXPORT .............................................................................................. 91
FIGURE 106 THE FILES EXPORTED ........................................................................................................... 91
6
1
Introduction
The objective of the Africa Environment Outlook – Environment Information System (AEO-EIS) is to
act as a standard information system for African nations to acquire, process, and disseminate
information relevant to sustainable development. A key feature of AEO-EIS is to assist in developing
State of Environment reports on the national, sub-regional and regional levels. AEO-EIS provides
tabular, graphical, and spatial reports. AEO-EIS has multiple language interface; English, French, and
Arabic.
This user manual familiarizes users with the different databases; Data and Indicators, Experts
Database, Documents Database, Security Module, and their data entry, search, and reporting
capabilities with simple step-by-step instructions and images.
The Data and Indicators module allow users to acquire and search for data variables and indictors that
can assist in identifying the state of environment and development on national, sub-regional, and
regional levels. Users can receive outputs as tabular, graphical, and geographical reports.
The Experts database acts as a standard Experts information system for African nations to acquire,
process, and disseminate information relevant to environment and development Experts, especially
worked on producing national and regional state of environment reports. A key feature of the Experts
database is to assist in identifying experts on the national, sub-regional and regional levels.
The Documents database provides a standard Document management information system for the
African nations to acquire, process, and disseminate information relevant to available documents and
reports. The database would contain all the reference that is being used in producing national, subregional, and regional state of environment reports.
This user manual familiarizes users with the different data entry, search, and reporting capabilities of
Africa-Documents with simple step-by-step instructions and images.
7
2 How to Run AEO-EIS
Select from the Start Menu > Programs > AEO-EIS > AEO-EIS. The system will start as shown in
Figure 1
Figure 1 Log in Screen
•
Enter User Name and Password.
•
Select default Interface language (English – Arabic – French).
•
Click the OK button.
Main Menu will start as in Figure 2.
Figure 2 Main Menu
8
3
Data and Indicators System:
This information system consists of four main components (as shown in Figure 3):
•
Search Module
•
Data Entry Module
•
Metadata
•
Administration Module
Figure 3 Data and Indicators main Screen
3.1
Search Module Methods and Compiling of Reports:
The Search Module is used to extract data in the form of reports, graphs and spatial reports. Specific
parameters can be set for the Search, in order to filter the data and compile it. The Search consists of
Indicator Values and Data Variables.
By entering several search parameters, you can extract up to 12 reports and 10 graphs, on several
geographic levels (Regional – Sub-regional – National – Sub-national – City). You can also compile
the data in a map, which serves to clearly illustrate the data and its geographic location.
9
3.1.1
Search Method for Indicator Values and Data Variables:
A search can be conducted for Indicators or Data Variables using the same method. When searching
for indicators, a screen similar to Figure 4 will appear.
Figure 4 Search Screen
This screen shows a number of search parameters:
•
Region
•
Sub Region
•
Country
•
Sub National
•
City
•
Initiative
•
Theme
•
Issues
•
Indicator Type
•
Indicator
10
This screen has several important buttons are follows:
Button
Title
Function
Query
Producing reports
Save Query
Saving queries
Open Query
Opening a new query
Clear Query
Deleting query
Clear all Query
Deleting all query
Exit
Exiting screen
Report Type List
Displaying report type list
Copy
Copying graph
Print
Printing
3.1.1.1
3.1.1.2 How To Use the Search Screen
The Search Screen can be used to extract data and compile reports on this data. We will go over more
than one example of these queries. While entering the Search parameters, it is also possible to save
these parameters for later use by clicking on the Save Query button
clicking on the Open Query button
, and later recalled by
, and selecting the saved query parameters.
You can cancel your selected query by clicking the ‘Clear’ button or cancel all queries by clicking
‘Clear All’. The Search Screen contains the following:
•
Geographic Area
•
Indicator Group
3.1.1.2.1 Geographic Area:
The Geographic group consists of:
•
Region
•
Sub Region
•
Country
11
•
Sub National
•
City
The user can choose any of these options by double clicking with the mouse and selecting from the
menu. Users can make multiple selection by mouse click and then press OK.
3.1.1.2.2 Searching and Compiling Reports by Geographic Area
•
Double click the ‘Region’ field and select a region.
•
Double click the ‘Sub Region’ field and select a sub region.
•
Double click the ‘Country’ field and select a country.
•
Double click the ‘Sub National’ field and select a sub national region.
•
Double click the ‘City’ field and select a city.
•
Click the ‘Report Type’ button and select the proper type.
•
Click the ‘Query’ button.
Note that you can select the Region, Sub Region or Country only, then click on the ‘Report Type’
button and choose the proper report type and click ‘Query’ to produce the report.
3.1.1.2.3 The Indicator Group:
The indicator group consists of the following:
•
Initiative
•
Theme
•
Environmental issue
•
Indicator Type
•
Indicator
Here you can specify the geographic area for which you wish to compile data. Alternatively, you can
choose not to specify a geographic area, but specify the Indicator or the Theme. You can also select a
Country or a City or specify the Theme and Indicator. Now choose a report type by clicking on the
arrow and then click ‘Query’ to compile. Note that the reports are divided according to geographic
area, for e.g., if you select ‘Region’, only Region reports are displayed.
3.1.1.2.4 Searching and Compiling Reports by Indicators
•
Double click the ‘Initiative’ field.
•
Select a specific Initiative.
•
Double click the ‘Theme’ field.
•
Select a specific Theme.
•
Double click the ‘Environmental Issue’ field.
12
•
Select a specific Environmental Issue.
•
Double click the ‘Indicator Type’ field.
•
Select a specific Indicator Type.
•
Double click the ‘Indicator’ field.
•
Select a specific Indicator.
•
Click on the ‘Report Type’ button, and choose a specific report type.
•
Click on the ‘Query’ button.
Note that you may choose only a specific Theme or Indicator, then click on the arrow for ‘Report
Type’, and choose the proper report type, then click ‘Query’ to compile the report. The following table
shows the relation between Geographic area and Report Type.
Area
1
2
3
4
5
6
Region
Sub Region
Country
Sub National
City
Unspecified
Report Title
Type
Region Bar Graph
Graph
Region Line Graph
Graph
Region Datasheet
Report
Indicator Datasheet (Region)
Report
Sub Region Bar Graph
Graph
Sub Region Line Graph
Graph
Sub Region Datasheet
Report
Indicator Datasheet (Sub Region)
Report
Sub Region Pie Graph
Graph
Country Bar Graph
Graph
Country Line Graph
Graph
Country Datasheet
Report
Indicator Datasheet (Country)
Report
Country Pie Graph
Graph
Sub National Bar Graph
Graph
Sub National Line Graph
Graph
Sub National Datasheet
Report
Indicator Datasheet (Sub National)
Report
City Bar Graph
Graph
City Line Graph
Graph
City Datasheet
Report
Indicator datasheet (City)
Report
Indicators List
Table
13
7
Unspecified
GIS Report
Map
8
Unspecified
Indicators Matrix
Table
9
Unspecified
Theme Indicators Matrix
Table
As Figure 5 illustrates, when a country is selected, a country report type must be chosen from the
report list, and when a city is selected, a city report type must be selected. The previous table
illustrates the relationship between geographic area and report type. We will review briefly the
function of each report.
Figure 5 Report Type List
3.1.1.2.5 How to Compile Spatial Reports:
It is possible to compile show the indicator values on a map. Here we can compile a map of Africa
with the extracted Indicator Values for a specific indicator, by following these steps:
•
Double click the ‘Region’ field.
•
Select a specific Region.
•
Double click the ‘Sub Region’ field.
•
Select a specific Sub Region.
Go to the ‘Indicator’ field, double click and select a specific Indicator, then fill in the time period:
from - to.
•
Click the ‘Report Type’ button and choose Geographic Maps.
•
Click the ‘Query’ button; the map will appear as in Figure 6.
14
Figure 6 Spatial Report
3.1.1.3 Reports & Graphs
Reports and Graphs can be extracted for different geographic preferences as follows:
•
Regional Level
•
Sub-Regional Level
•
Country Level
•
Sub-national Level
•
City Level
3.1.1.3.1 Regional Level
3.1.1.3.1.1 Region Bar Graph
Graph illustrating indicator values or data for the specified region in the form of bars in different
colors, one for each year.
3.1.1.3.1.2 Region Line Graph
Graph illustrating Indicator Values or Data for the specified region in the form of lines and dots where
the X axis represents years and the Y axis represents the values.
3.1.1.3.1.3 Region Datasheet
Report illustrating the regional data: theme, indicator and indicator value for each year, in addition to
the Data Source.
3.1.1.3.1.4 Indicator Datasheet (Region)
15
This Report illustrates the indicator data, the theme, and the indicator value for the region each year.
3.1.1.3.2 Sub-Regional Level
3.1.1.3.2.1 Sub Region Bar Graph
Graph illustrating Indicator Values or data for the specified Sub Region in the form of bars in different
colors, one for each year.
3.1.1.3.2.2 Sub Region Line Graph
Graph illustrating Indicator Values or Data for the specified Sub Region in the form of lines and dots
where the X axis represents years and the Y axis represents the values.
3.1.1.3.2.3 Sub Region Pie Graph
Graph illustrating Indicator Values or Data for the specified Sub Region in the form of pie charts
divided into specific countries represented by different colors.
3.1.1.3.2.4 Sub Region Datasheet
Report illustrating the Sub Regional data: theme, indicator and indicator value for each year, in
addition to the Data Source.
3.1.1.3.3 Indicator Datasheet (Sub Region)
This Report illustrates the indicator data, the theme, and the indicator value for the Sub Region each
year.
3.1.1.3.4 Country Level
3.1.1.3.4.1 Country Bar Graph
Graph illustrating Indicator Values or data for the specified Country in the form of bars in different
colors, one for each year.
3.1.1.3.4.2 Country Line Graph
Graph illustrating Indicator Values or Data for the specified Country in the form of lines and dots
where the X axis represents years and the Y axis represents the values.
3.1.1.3.4.3 Country pie Graph
16
Graph illustrating Indicator Values or Data for the specified Country in the form of pie charts divided
into specific sub-national regions represented by different colors.
3.1.1.3.4.4 Country Datasheet
Report illustrating the Country data: theme, indicator and indicator value for each year, in addition to
the Data Source.
3.1.1.3.4.5 Indicator Datasheet (Country)
This Report illustrates the indicator data, the theme, and the indicator value for the Country each year.
3.1.1.3.5 Sub-National Level
3.1.1.3.5.1 Sub National Bar Graph
Graph illustrating Indicator Values or data for the specified Sub National region in the form of bars in
different colors, one for each year.
3.1.1.3.5.2 Sub National Line Graph
Graph illustrating Indicator Values or Data for the specified Sub National region in the form of lines
and dots where the X axis represents years and the Y axis represents the values.
3.1.1.3.5.3 Sub National Datasheet
Report illustrating the Sub National region data: theme, indicator and indicator value for each year, in
addition to the Data Source.
3.1.1.3.5.4 Indicator Datasheet (Sub National)
This Report illustrates the indicator data, the theme, and the indicator value for the Sub National
region each year.
3.1.1.3.6 City Level
3.1.1.3.6.1 City Bar Graph
Graph illustrating Indicator Values or data for the specified City in the form of bars in different colors,
one for each year.
17
3.1.1.3.6.2 City Line Graph
Graph illustrating Indicator Values or Data for the specified City in the form of lines and dots where
the X axis represents years and the Y axis represents the values.
3.1.1.3.6.3 City Datasheet
Report illustrating the City data: theme, indicator and indicator value for each year, in addition to the
Data Source.
3.1.1.3.6.4 Indicator Datasheet (City)
This Report illustrates the indicator data, the theme, and the indicator value for the City each year.
3.1.1.3.7 Common Reports
There are common reports that serve all the geographic levels or the Data variables and indicator
infrastructure.
3.1.1.3.7.1 GIS report
GIS data map of Africa showing the indicator values for a specific year.
3.1.1.3.7.2 Indicators List
This Table lists all Indicators and Data Variables available in the database.
3.1.1.3.7.3 Indicators Matrix
This Report lists the relation between indicators, themes, and environmental issues available in the
database.
3.1.1.3.7.4 Themes Indicators Matrix
This Report lists the relation between themes, environmental issues and indicators available in the
database.
18
3.1.2
Examples
Below are examples to train the user on using the query screen.
3.1.2.1 Example 1
To extract data for the Indicator (Emissions of N2O Total (RIVM)) for Kenya, as shown in Figure 7,
follow these steps:
Figure 7 Extracting Indicator Values for Kenya
•
Double click the ‘Country’ field and select Kenya.
•
Double click the ‘Indicator’ field and select (Emissions of N2O Total (RIVM)).
•
Double click ‘Report Type’ button.
•
Select ‘Country Bar Graph’.
•
Click ‘Query’, the graph will appear as in Figure 8.
19
Figure 8 Graph Illustrating Indicator Values for Kenya
Note that you can click the ‘Print’ button or copy the graph onto a Microsoft® Word or Excel file by:
•
Clicking ‘Copy’.
•
Opening a Word or Excel file.
•
Opening the ‘Edit’ Menu, and clicking on ‘Paste Special’.
3.1.2.2 Example 2:
To extract data for the Indicator (Arable Land), which is part of the Land Theme, for Ghana, a country
in West Africa, follow these steps (Figure 9):
Figure 9 Searching for Indicator Values for Ghana
20
•
Double click the ‘Sub Region’ field and select ‘Western Africa’.
•
Double click the ‘Country’ field and select ‘Ghana’.
•
Double click the ‘Theme’ field and select ‘Land’.
•
Double click the ‘Indicator’ field and select ‘Arable Land’.
•
Click the ‘Report Type’ button.
•
Choose ‘Country Line Graph’, and click on ‘Query’. The graph will appear as in Figure 10.
Figure 10 Graph Illustrating Indicator Values for Ghana
For a Pie Graph, enter the ‘Year From’ and ‘Year To’ fields.
Select ‘Sub Region Pie Graph’, and click on ‘Query’. The graph will appear as in Figure 11.
Figure 11 Graph Illustrating Indicator Values for Western Africa
21
3.1.2.3 Example 3:
To extract data on the Indicator (Fish Catch – Marine), of the ‘Coastal and Marine Environment’
Theme, for Tunisia, a country in North Africa, and part of the AEO Initiative (Figure 12):
Figure 12 Searching for Indicator Values for Tunisia
•
Double click the ‘Region’ field and select ‘Africa’.
•
Double click the ‘Sub Region’ field and select ‘North Africa’.
•
Select Tunisia from the Country Menu.
•
Double click the ‘Initiative’ field and select ‘AEO’.
•
Double click the ‘Theme’ field and select ‘Coastal and Marine Environment’.
•
Double Click the ‘Indicator’ field and select ‘Fish Catch – Marine’.
•
Click the ‘Report Type’ button.
•
Select ‘Country Datasheet’ report type.
•
Click ‘Query’. The Country Datasheet report will appear. The printed version of the report will
be similar to Figure 13.
22
Figure 13 Printable Version of the Tunisia Country Datasheet
However, to compile an Indicator Datasheet (Country), follow these steps:
•
Click the ‘Report Type’ button.
•
Select Indicator Datasheet (Country).
•
On the data review screen, click ‘Print’ and the report will appear on screen before printing, as
in Figure 14.
Figure 14 Indicator Datasheet (Country) for Tunisia
It is also possible to enter an Indicator value, or enter a value range (bigger than or smaller than the
Indicator value), and extract the data that meets this requirement only. It is also possible to specify a
year and extract only its data.
23
The following are the main buttons on the report:
Button
3.1.3
Title
Function
Print
Printing the Report
Export
To paste the report onto a Text, Word, or Excel File.
Close
Exiting
Data Variables
3.1.3.1 How to Search for Data Variable Values
To search for Data Variable values, follow these steps:
•
Access the main menu and select ‘Search’.
•
Select the ‘Data Variable’. A screen similar to Figure 15 will open.
Figure 15 Data Variable Search Screen
This is the same as the ‘Indicator’ search screen, but instead of Indicators, the search is for Data
Variables. This screen can be used for the same functions mentioned above, and can compile the same
reports.
24
3.2
Data Entry Module
The Data Entry module consists of two sections:
•
Indicators.
•
Data Variable.
3.2.1
Indicators
This section consists of a number of screens, as shown in Figure 16:
•
World
•
Region
•
Sub Region
•
Country
•
Sub National
•
City
Figure 16 Main Data Entry Screen
Buttons employed for Data Entry:
Button
Title
Function
Add
Adding data
Update
Updating data
Delete
Deleting Data
Display
Displaying data
25
Confirmation
Confirming
Delete entered data
Exiting the screen without any changes
Finish entering data Confirming and going to back
3.2.1.1 Data Manipulation:
During the data entry process, you may:
•
Enter new data.
•
Update data
•
Delete Data
•
Display data
3.2.1.1.1 To Enter New Data
•
Access the main Data Entry screen.
•
Select ‘Indicator’.
•
Screen similar to Figure 16 will Popup.
•
Select any of the following choices:
o
World
o Region
o Sub Region
o Country
o Sub National
o City
•
Screen similar to Figure 17 will start.
26
Figure 17 World Data Entry Screen
•
Click ‘Add’. A new screen will open as shown in Figure 18.
•
Enter the new data.
•
Click ‘Save’.
•
If you need to add more values to the Metadata click on the Metadata button (Go to Metadata
section for further information)
Figure 18 Entering World Data
3.2.1.1.2 To Update Existing Data
•
Access the main screen and the ‘Data Entry’ menu.
•
Click ‘Indicator’.
•
Select the data to be updated. Click ‘Update’.
•
A screen will open similar to Figure 19.
•
Enter the new data. Click ‘SAVE’.
27
Figure 19 Data Update Screen
3.2.1.1.3 To Delete Existing Data
•
Access the Main Screen and the Data Entry menu.
•
Click ‘Indicator’.
•
Select the data to be deleted.
•
A screen similar to Figure 20 will open. Click ‘SAVE’.
Figure 20 Data Deletion Screen
28
3.2.1.1.4 To Display Existing Data
Access the Main Screen and the Data Entry menu.
•
Click ‘Indicator’.
•
Select the data to be displayed.
•
Click ‘Display’.
•
The Display Screen will appear similar to Figure 21. Click ‘SAVE’.
Figure 21 Data Display Screen
3.2.2
Data Variables
Data Variable screens are similar to Indicator screens. All the previous functions can be used with
Data Variables, by following the same data entry steps.
3.3
Metadata Module
The Metadata standard that is used for AEO—EIS is Dublin core standard / ISO 15836:2003
(E). Users must be aware of the Dublin Core standards before using this section. Through this
module users can add, update or delete metadata records for indicators and data variable
values. The Metadata Module consists of:
•
Search Module.
•
Data Entry Module
•
Element Name Module
•
Element Details Module
29
3.3.1
Search Module
In this section it is possible to search for data and compile reports by:
•
Accessing the main screen and selecting ‘Metadata’.
•
A menu will open, on this menu click ‘Search’, the Search Screen will appear (Figure 22).
•
Double click ‘Indicator Name’, and select the Indicator whose data is being extracted.
•
Double click ‘Element Name’, and ‘Element Details’ to choose from either or both of them.
•
Click ‘Query’ and Result Screen will popup as shown in figure 8.
•
Click Print and the Metadata Report will start.
Figure 22 Metadata Search Screen
Figure 23 Metadata Result Screen
30
3.3.2
Data Entry Module
This section can be used to enter data, and can be accessed by:
•
Accessing the main screen and selecting ‘Metadata’.
•
A menu will open, on this menu click ‘Data Entry’. A data entry screen will appear (Figure
24).
Figure 24 Metadata Addition Screen
•
Click ‘Add’, to add new data. A new screen will appear (Figure 24).
o Click ‘Update’ to update selected Indicators metadata or ‘Display’ to
display selected Indicator metadata record.
o Alternatively, you can click ‘Delete’ to delete selected Indicator
metadata record.
•
Select type of Metadata Element from the tabs: Creator, Subject Keywords, Subject Controlled
vocabulary, Subject Classification, Description, Publisher, Contributor, Date, Type, Format,
Identifier URL, Identifier, Sources, Language, Relation, Coverage, and Keyword.
•
Double click on the element details field, List of values will pop up.
•
Select the required value from the list of values and enter data in the TEXT field.
•
If the TEXT field color is dark yellow, this indicates that there is a list of value you can
choose from. Double click on the TEXT field and a pop up menu will appear.
•
Click ‘Save’ to save the metadata record.
31
Figure 25 How to Add Data to the Metadata
3.3.3
Element Name Module
In this section it is possible to enter basic data of the Dublin Core Element Name by:
1. Accessing the main screen and selecting ‘Metadata’.
2. A menu will open, from this menu click ‘Element Name’, the Screen in Figure 26 will
Popup.
3. In the ‘Data Entry’ screen, click ‘Add’ to add new data or ‘Delete’ to delete selected
record.
4. Click ‘Update’ to update or ‘Display’ selected record.
Figure 26 Element Name Screen
32
3.3.4
Element Details Screens
In this section, it is possible to enter detailed data of the Dublin Core Element Names by:
•
Accessing the main screen and selecting ‘Metadata’.
•
A menu will open, from this menu click ‘Element Details’, the Screen in Figure 27 will open.
•
In the ‘Data Entry’ screen, click ‘Add’ to add new data or ‘Delete’ to delete selected data.
•
Click ‘Update’ to update data or ‘Display’ to display data.
Figure 27 Element Detail Data Entry Screen
3.4
Administration Module
The Administration module is made up of two menus:
•
Reference.
•
Interface.
These screens can be used to add new records, update records or delete records of the data and
indicators system infrastructure. These screens should only be used with system administrators.
3.4.1
Reference
The Reference menu is made up of two sub menus (Figure 28):
•
Geographic sub-menu.
•
Indicator sub-menu.
33
Figure 28 Main Reference Screen
3.4.1.1 Geographic Menu
•
City
•
Country
•
Institution
•
Region
•
Sub National
•
Sub Region
In each of the previous screens, you can:
•
Enter new record.
•
Update existing record.
•
Delete existing record.
•
Display available records.
We will go over these commands on one of the Geographic menu screens.
3.4.1.1.1 Entering New Data:
•
Access the main screen.
•
Click ‘Reference’ from the Administration section.
A popup menu will start on which you can select any of the following:
•
City
•
Country
•
Institution
34
•
Region
•
Sub National
•
Sub Region
o Click one of these options and a new screen will open.
o Click ‘Add’. A screen will appear similar to Figure 29.
o Enter the new data.
o Click ‘Save’.
Figure 29 New Data Entry – Sub National
3.4.1.1.2 Updating Data:
•
Access the main screen.
•
Click ‘Reference’ from the Administration section.
A new screen will appear from which you can select any of the following:
o City
o Country
o Institution
o Region
o Sub National
o Sub Region
35
Click one of these options and a new screen will appear.
Select the data to be updated, then click ‘Update’, and a new screen will appear similar to Figure 30.
•
Enter the new data.
•
Click ‘Save’.
Figure 30 Data Update Screen – Country
3.4.1.1.3 Deleting Data:
o Access the main screen.
o Click ‘Reference’ from the Administration section.
A new screen will appear from which you can choose any of the following:
o City
o Country
o Institution
o Region
o Sub National
o Sub Region
o Select one of these options and a new screen will open.
o Select the data to be deleted and click ‘Delete’. A new screen will appear similar to Figure
31.
36
Figure 31 Data Deletion Screen – Country
3.4.1.1.4 Displaying Data:
o Access the main screen.
o Click ‘Reference’ from the Administration section.
A new screen will appear from which you can choose any of the following:
o City
o Country
o Institution
o Region
o Sub National
o Sub Region
Select one of these options and a new screen will open.
Select the record to be displayed, click ‘Display’ and a new screen will appear as shown in Figure 32.
37
Figure 32 Data Display Screen – Country
3.4.1.2 Indicator Menu
Indicator data is managed through the Indicator menu, by adding, updating or deleting data. It is also
possible to control the relation between Theme, Indicator, and Indicator Type. The menu consists of
the following:
•
Data Variable
•
Issues
•
Indicator
•
Indicator Type List
•
Indicator Units
•
Initiative
•
Initiative Theme
•
Theme
•
Theme Dataset Matrix
•
Theme Indicator Matrix
•
Units
38
3.4.1.3 Examples
The following examples train the users on using the references menus
3.4.1.3.1 Example 1: How to add a ‘Theme’.
•
Access the main screen.
•
Select ‘Reference’ from the Administration section.
•
A new menu will appear, from this new menu, select ‘Theme’.
•
Select the data to be displayed. Click ‘Add’. A new screen will appear. Figure 33.
•
Click ‘SAVE’.
Figure 33 Adding a New Theme
3.4.1.3.2 Example 2: Adding a new ‘Issue’
•
Access the main screen.
•
Select ‘Reference’ from the ‘Administration’ section.
•
A new menu will appear, select ‘Issues’.
•
Click ‘Add’. A new screen will appear. Figure 34.
•
Click ‘SAVE’.
39
Figure 34 Adding New Issues
3.4.1.3.3 Example 3: How to Enter and Select a New Indicator:
•
When entering a new Indicator, we must specify whether it is an Indicator or a Data Variable
or both.
•
Access the main screen.
•
Select ‘Reference’ from the ‘Administration’ section.
•
A new menu will appear, from this new menu, select ‘Indicator’.
•
The ‘Indicator’ screen will appear. Click ‘Add’, a new screen will appear similar to Figure 35.
•
Enter the Code.
•
Enter the Optimum Value.
•
Enter the Indicator Name.
•
Enter the Indicator Description (optional).
•
Enter the Source (optional).
40
Figure 35 Adding a New indicator
Select whether it is an ‘Indicator’, a ‘Data Variable’, or both, from the option fields similar to those in
Figure 36.
Figure 36 Indicator Type
By using the option fields in Figure 37, this indicator described also as a Data Variable.
Figure 37 Specifying the Indicator Type
41
3.4.1.3.4 Example 4: How to Link Theme, Issue and Indicator Type through a Matrix:
Each Theme has relation with one or more issues, and each issue has a relation with one or more
indicators. Each Indicator also has a classification of Indicator Type (DPSIR) within each theme. We
will illustrate how to link Themes, Issues, Indicators and Indicator Type.
•
Access the main screen.
•
Select ‘Reference’ from the ‘Administration’ section.
•
A new menu will appear. Select ‘Themes Indicators Matrix’ as shown in Figure 38.
•
The Themes Indicators Matrix screen will start as in Figure 39.
•
Click ‘Add’. A new screen will appear similar to Figure 40.
Figure 38 Main Screen - Selecting Themes Indicator Matrix
Figure 39 Adding a new Indicator and Linking It to a Theme
42
Figure 40 Matrix screen – Theme, Indicator, Issue and Indicator Type
•
Double click to select ‘Theme’. If you do not find the theme you want, click ‘Add’ to add a
new theme.
•
Double click to select ‘Environmental Issue’. If you do not find the Environmental Issue you
want, click ‘Add’ to add a new Environmental Issue.
•
Double click to select ‘Indicator’. If you do not find the Indicator you want, click ‘Add’ to add
a new Indicator.
•
Double click to select ‘Indicator Type’. Figure 41.
•
The same steps can be followed to link Theme, Environmental Issue, Data Variable and
Indicator Type.
Figure 41 Theme - Indicators Matrix
43
3.4.2
Interface:
‘Interface’ screens are used to manage field titles, essentially giving the user control over the system,
to change what he/she wants when he/she wants:
•
Import Data
•
Report Labels
•
Screen Labels
•
Screens
3.4.2.1 Import Data
To import data from a Microsoft® Excel sheet to the Data and Indicators system:
1. Prepare the Excel Sheet to be in the GEO Data Portal Excel format
2. Access the main screen.
3. Select ‘Interface’ from the ‘Administration’ section.
4. Popup menu will start. Click ‘Import Data’.
5. A new screen entitled ‘Import Data’ will open (Figure 42).
6. Click ‘File to Import’ button to select the data sheet (Figure 43).
7. After selecting the data sheet, the screen will be similar to Figure 44.
8. Select from list the Geographic preference of the data (National – Sub Regional –
Regional – Global –Metadata).
9. Click the ‘Load All’ button to load all data onto your system.
10. Click ‘Load World’ button to load world data only.
11. Click ‘Load Region’ button to load Region data only.
12. Click ‘Load Sub Region’ button to load Sub Region data only.
13. Click ‘Load Country’ button to load Country data only.
14. Click ‘File to Import’ to select another file.
44
Figure 42 Import data Screens
Figure 43 Select data sheet
Figure 44 Data sheet after selection
45
3.4.2.2 Report Labels
This screen displays Report Names in the system, which can be changed according to the user’s
preference by:
•
Accessing the Main screen.
•
Selecting ‘Interface’ from the ‘Administration’ section.
•
Popup menu will start, from this menu click ‘Report Label’.
•
A new screen entitled ‘Report Label’ will open. Click ‘Update’, a screen similar to that in
Figure 45 will open.
Figure 45 Changing a Report Name
•
Change the Report Name, then click ‘SAVE’.
3.4.2.3 Screen Labels
Here it is possible to display the field labels of the system, and change them according to the user’s
preference by:
•
Access the main screen.
•
Select ‘Interface’ from the ‘Administration’ section.
•
A new menu will appear, on this menu click ‘Screen Label’.
•
The ‘Screen Label’ screen will open. Figure 46.
•
Change the name. Click ‘SAVE’.
Figure 46 Changing a Field Name
46
3.4.2.4 Screen Names
It is also possible to review Screen Names of the system and change them according to the user’s
preference by:
•
Access the main screen.
•
Select ‘Interface’ from the ‘Administration’ section.
•
Popup menu will start. Click ‘Screens’.
•
A new screen entitled ‘Screens’ will open. Figure 47.
Figure 47 Changing Screen Names
•
Click ‘Update’.
•
A new screen will appear, change the name then click ‘SAVE’.
47
4
Experts Database:
The Expert database consists of three components (as shown in Figure 48):
•
Search Module
•
Data Entry Module
•
Administration Module
Figure 48 Expert database Main Screen
To start the Expert database, login to the system and select Expert database from the Main Menu.
Search Module Methods and Compiling of Reports:
The Search Module is used to extract data in the form of reports. Specific parameters can be set for the
search, in order to filter the data and compile it.
By entering several search parameters, you can extract up to 3 reports, on several geographic levels
(Regional – Sub-regional – National – Sub-national – City). You can also compile the data in a
geographic location.
4.1
Search Component:
Select Search from the Expert Menu and the Query screen will start as shown in Figure 49. Experts
can be allocated by providing criteria by using the following fields:
•
Expert Name, serial number
•
Age, Gender
•
Region
•
Sub Region
48
•
Country
•
Sub National
•
City
•
Specialties
•
Category
•
Nationality
•
Language
•
Degree
Figure 49 Expert database Search Screen
The buttons of this screen are similar to the Data and Indicators search screen.
4.1.1
How To Use the Search Screen:
The Search Screen can be used to extract data and compile reports on this data. We will go over more
than one example of these queries. While entering the Search parameters, it is also possible to save
these parameters for later use by clicking on the Save Query button
clicking on the Open Query button
, and later recalled by
, and selecting the saved query parameters. You can
cancel your selected query by clicking the ‘Clear’ button or cancel all queries by clicking ‘Clear All’.
The Search Screen contains the following:
•
Geographic Group
•
Experts Data Group
49
4.1.1.1 Geographic Group
The Geographic group consists of:
•
Region
•
Sub Region
•
Country
•
Sub National
•
City
The user can choose any of these options by double clicking with the mouse and selecting from the
menu.
4.1.1.2 Searching and Compiling Reports by Geographic Area:
•
Double click the field entitled ‘Region’, and then select a region.
•
Double click the field entitled ‘Sub Region’, and then select a sub region.
•
Double click the field entitled ‘Country’, and then select a country.
•
Double click the field entitled ‘Sub National’, and then select a sub national region.
•
Double click the field entitled ‘City’, and then select a city.
•
Click the ‘Report Type’ button and select the proper type.
•
Click the ‘Query’ button.
Note that you can select the Region, Sub Region or Country only, then click on the ‘Report Type’
button and choose the report type and click ‘Query’ to produce the report.
4.1.1.3 The Expert Data Group:
The Expert data group consists of the following:
•
Expert Name, serial number
•
Age, Gender
•
Specialties
•
Category
•
Nationality
•
Language
•
Degree
User can specify the Expert parameters to provide criteria for selection. Choose a report by clicking on
the ‘Report Type’ button and then click ‘Query’ to produce the required report.
50
4.1.1.3.1 Searching and Compiling Reports by Experts data
•
Double click the ‘serial number’ field.
•
Select a specific Expert name.
•
Select a specific ‘Gender’.
•
Double click the ‘Specialties’ field and select specialties.
•
Double click the ‘Category’ field and select a specific category.
•
Double click the ‘Nationality’ field and select a specific nationality.
•
Double click the ‘Degree’ field and selecting a specific degree.
•
Click the Report Type icon, and choose a specific report type.
•
Click the ‘Query’ button.
Report Title
1
Expert Directory
2
Expert Directory (Country Brief)
3
Expert Directory (Specialty Brief)
As Figure 50 illustrates, a report must be chosen from the report list, we will review below the
function of each report.
Figure 50 Report Type List
51
4.1.2
Reports
4.1.2.1 Expert Directory
This Report provides resume for each Expert that meets the query criteria. The Report contains
Name, Title, Nationality, Address, Country, E-Mail, Telephone, Fax, Language, University, in
addition to Degree and Organization of the Expert.
4.1.2.2 Expert Directory (Country Brief)
This Report provides experts ordered by countries. This report act as a directory with illustrating the
Name, Title, Nationality, Address, Country, E-Mail, Telephone, Fax, Language, University, in
addition to Degree and Organization for each Expert
4.1.2.3 Expert Directory (Specialty Brief)
This Report provides experts ordered by speciality. This report act as a directory with illustrating the
Name, Title, Nationality, Address, Country, E-Mail, Telephone, Fax, Language, University, in
addition to Degree and Organization for each Expert
We will be further illustrating the Search process with more than one example.
4.1.3
Examples
4.1.3.1 Example 1:
To extract data for all experts from ‘Egypt’, gender ‘male’, as shown in Figure 51, follow these steps:
Figure 51 Extracting Experts for Egypt
1. Double click the ‘Country’ field and select Egypt.
2. Select ‘Male’ from Gender options box.
52
3. Double click ‘Report Type’ Icon.
4. Select ‘Expert Directory’.
5. Click ‘Query’, and the report will appear as in Figure 52.
Figure 52 Report illustrating expert male for Egypt
Note that you can click the ‘Print’ button to print the report.
4.1.3.2 Example 2:
To extract data for experts, with specialty ‘Soil Degradation’, follow these steps (Figure 53):
Figure 53 Searching specified Specialties
1. Double click the ‘Specialties’ field and select ‘soil degradation’.
2. Click the ‘Report Type’ icon.
53
3. Choose ‘Expert Directory (Specialty Brief)’ report, and click on ‘Query’. The report will
appear as in Figure 54.
Figure 54 Report illustrating Expert resume for soil degradation
4.1.3.3 Example 3:
To extract data of ‘Air pollution’ experts, with a PhD Degree (Figure 55):
Figure 55 Searching for Experts with specialty of Air pollution and Ph.D degree
1. Double click the ‘Specialties’ field and select ‘Air Pollution’.
2. Double click the ‘Degree’ field and select ‘PhD’.
3. Click the ‘Report Type’ icon.
4. Choose ‘Expert Directory country “brief report”, and click on ‘Query’. The report will appear
as in Figure 56.
54
Figure 56 Country brief report of Expert
4.1.3.4 Example 4:
To extract data of ‘Algerian’ experts, for a specialties report (Figure 57):
Figure 57 Searching for Expert from Algeria
1. Double click the ‘Country’ field and select ‘Algeria’.
2. Click the ‘Report Type’ icon.
3. Choose ‘Expert Directory Specialty brief’, and click on ‘Query’. The report will appear as in
Figure 58.
55
Figure 58 Specialty brief report for Expert from Algeria
4.2
Data Entry of Experts database
This section is made up of a number of tab screens, as shown in Figure 59:
1. Main Data
2. Phone/Fax
3. Language
4. Specialties
5. Education
6. Experiences
7. Categories
8. Publication
9. Projects
Figure 59 Main Data Entry Screen
56
During the data entry process, you may:
1. Enter new data.
2. Update data
3. Delete Data
4. Display data
4.2.1
To Enter Expert Data
1. Access the main Expert screen.
2. Click ‘Add’ from the data entry menu.
3. The screen will be similar to Figure 60.
You can select any of the following:
A. Main Data
B. Phone/Fax
C. Language
D. Specialties
E. Education
F. Experiences
G. Categories
H. Publication
I. Projects
4. Enter the new data.
5. click the Tab screen to add another screen
6. Click ‘SAVE’.
4.2.2
To Update Expert Data:
1. Access the main experts screen.
2. Select edit to open a screen as in Figure 60.
3. Click the ‘Query’ button.
4. Select the Expert to be updated. Click ‘Update’.
5. A screen will open similar to Figure 61.
6. Enter the new data. Click ‘SAVE’.
57
Figure 60 Expert Data Manipulation Screen
Figure 61 Update / Data Entry Screen
4.2.3
To Delete Data
1. Access the main Expert screen.
2. Select Edit to open a new screen.
3. Click the ‘Query’ button and select the data to be deleted.
4. Click 'Delete'.
5. A screen similar to Figure 62 will open. Click ‘SAVE’.
58
Figure 62 Data Deletion Screen
4.2.3.1 To Display Expert Data
1. Access the Main expert screen.
2. Select ‘Edit’ to open a new screen.
3. Click ‘query’.
4. Select the data to be displayed.
5. Click ‘Display’.
6. The Display Screen will appear similar to Figure 63. Click ‘SAVE’.
Figure 63 Data Display Screen
59
5
Administration Component
The Administration component is made up of two sections:
A. Reference.
B. Interface.
Users can use these sections to add new data, update data or delete data of the Expert database data
infrastructure. These sections should only be used by system administrator.
5.1
Reference
The Reference menu consists of
a- Geographic menu
b- Look up's menu (Figure 64):
Figure 64 Main Reference Screen
5.1.1
Geographic Menu
A. City
B. Country
C. Institution
D. Regions
E. Sub National
F. Sub Regions
60
In each of the previous screens, you can:
1. Enter new data.
2. Update data.
3. Delete data.
4. Display data.
We will go over these commands on one of the Geographic menu screens.
5.1.1.1 To Enter New Data:
A. Access the main screen.
B. Click ‘Reference’ from the Administration section.
C. A new menu will open on which you can select any of the following:
1. City
2. Country
3. Institution
4. Region
5. Sub National
6. Sub Region
D. Click one of these options and a new screen will open.
E. Click ‘Add’. A screen will appear similar to Figure 65.
F. Enter the new data.
G. Click ‘Save’.
Figure 65 New Data Entry – Sub National
61
5.1.1.2 To Update Data:
1. Access the main screen.
2. Click ‘Reference’ from the Administration section.
3. A new screen will appear from which you can select any of the following:
1. City
2. Country
3. Institution
4. Region
5. Sub National
6. Sub Region
4. Click one of these options and a new screen will appear.
5. Select the data to be updated, then click ‘Update’, and a new screen will appear similar to
Figure 66.
6. Enter the new data.
7. Click ‘SAVE’.
Figure 66 Data Update Screen – Country
5.1.1.3 To Delete Data:
1. Access the main screen.
2. Click ‘Reference’ from the Administration section.
3. A new screen will appear from which you can choose any of the following:
1. City
2. Country
3. Institution
4. Region
62
5. Sub National
6. Sub Region
4. Select one of these options and a new screen will open.
5. Select the data to be deleted and click ‘Delete’. A new screen will appear similar to
Figure 67.
Figure 67 Data Deletion Screen – Country
5.1.1.4 To Display Data:
1. Access the main screen.
2. Click ‘Reference’ from the Administration section.
3. A new screen will appear from which you can choose any of the following:
1. City
2. Country
3. Institution
4. Region
5. Sub National
6. Sub Region
4. Select one of these options and a new screen will open.
5. Select the data to be displayed, click on ‘Display’ and a new screen will appear similar
to Figure 68.
63
Figure 68 Data Display Screen – Country
5.1.2
Look Up's Menu
You can enter, update, delete or display values for Look Up's by:
1. Accessing the main screen.
2. Selecting ‘Reference’ from the ‘Administration’ section.
3. A new menu will appear, on this menu click ‘Look up’s’.
4. A new screen entitled ‘Look up’s screen’ will open. As figure 69.
5. Click ‘add’, a screen similar to that in Figure 70 will open.
6. Enter the new value and click ‘Save’.
7. Or Click ‘update’, enter the new value and click ‘Save’.
64
Figure 69 Look Up’s Screen
8. Or click ‘Delete’ to delete the values selected then click ‘Save’.
9. Click ‘Display’ to see the values.
Figure 70 Look Up’s Screen- add
5.2
Interface:
‘Interface’ screens are used to manage field titles, essentially giving the user control over the system,
to change what he/she wants when he/she wants:
1. Report Labels
2. Screen Labels
3. Screens
65
5.2.1
Report Labels
This screen displays Report Names in the query screen, which can be changed according to the user’s
preference by:
1. Accessing the main screen.
2. Selecting ‘Interface’ from the ‘Administration’ section.
3. A new menu will appear, on this menu click ‘Report Label’.
4. A new screen entitled ‘Report Label’ will open. Click ‘Update’, a screen similar
to that in Figure 71 will open.
5. Change the Report Name, then click ‘SAVE’.
Figure 71Changing a Report Name
5.2.2
Screen Labels
Here it is possible to display the field names in the system, and change them according to the user’s
preference by:
1. Accessing the main screen.
2. Selecting ‘Interface’ from the ‘Administration’ section.
3. A new menu will appear, on this menu click ‘Screen Label’.
4. The ‘Screen Label’ screen will open. Figure 72.
5. Change the name. Click ‘SAVE’.
66
Figure 72 Changing a Field Name
5.2.3
Screens
This screen is used to manage the Screen Names and change them according to the user’s preference
by:
1. Accessing the main screen.
2. Selecting ‘Interface’ from the ‘Administration’ section.
3. A new menu will open. Click ‘Screens’.
4. A new screen entitled ‘Screens’ will open. Figure 73.
5. Click ‘Update’.
6. A new screen will appear, change the name then click ‘SAVE’.
Figure 73 Changing Screen Names
67
6
Documents Database:
The Document database consists of three main components:
1. Search Module
2. Data Entry Module
3. Administration Module
Login to the system and select Document database from the Main Menu. Figure 74 shows Document
database menu.
Figure 74 Documents database main Screen
6.1
Search Module Methods and Compiling of Reports:
The Search Module is used to extract data in the form of reports. Specific parameters can be set for the
Search, in order to filter the data and compile reports.
By entering several search parameters, you can extract reports on several geographic levels (Regional
– Sub-regional – National – Sub-national – City).
6.1.1
Search Method for Documents
To search for a document select Search from the Document database menu, a screen similar to Figure
75 will appear.
68
Figure 75 Documents database Search Screen
This screen has a number of search parameters:
1. Document Title, serial number
2. Publisher Date From - To
3. Region
4. Sub Region
5. Country
6. Document type
7. Publisher
8. Keywords
9. Call Number
6.1.2
How To Use the Search Screen:
The Search Screen can be used to extract data and compile reports on this data. While entering the
Search parameters, it is also possible to save these parameters for later use by clicking on the Save
Query button
, and later recalled by clicking on the Open Query button
selecting the saved query parameters. The Search Screen contains the following:
A. Geographic Area
B. Documents Data Group
69
, and
6.1.2.1 Geographic Preference Group
The Geographic preference group consists of:
1. Region
2. Sub Region
3. Country
The user can choose any of these options by double clicking with the mouse and selecting from the
menu.
6.1.2.2 Searching and Compiling Reports by Geographic Area
1. Double click the field entitled ‘Region’ then select a region.
2. Double click the field entitled ‘Sub Region’ then select a sub region.
3. Double click the field entitled ‘Country’ then select a country.
4. Click the Report Type icon and select the proper type.
5. Click the ‘Query’ button.
Note that you can select the Region, Sub Region or Country only, then click on the ‘Report Type’
button and choose the proper report type and click ‘Query’ to produce the report.
6.1.2.3 The Document Data Group
The Document data group consists of the following:
1. Document Title, serial number
2. Publisher Date From - To
3. Document Type
4. Publisher
5. Keywords
6. Call Number
Here you can specify the Document data for which you wish to compile data. Alternatively, you can
choose not to specify a Document Title, or specify the Serial number. You can also select a document
type, a publisher, keywords and/or specify the Call Number. Now choose a report type by clicking on
the Icon and then click ‘Query’ to compile. Note that the report type is ‘Document Report’.
6.1.2.3.1 Searching and Compiling Reports by Document Data
1. Double click the ‘serial number’ field and select a specific ‘serial number’.
2. Write a specific ‘pub. Date From - To’.
3. Double click the ‘Document type’ field select a document type.
4. Double click the ‘Publisher’ field and select a specific Publisher.
5. Click the ‘Call Number’ field and enter a specific Call Number.
70
6. Click on the Report Type icon, and choose a specific report type.
7. Click on the ‘Query’ button.
Report Title
1
Document Report
As Figure 76 illustrates, when a report type is selected, a report type must be chosen from the report
list, we will review briefly the function of each report.
Figure 76 Report Type List
6.1.3
Document Database Examples:
6.1.3.1 Example 1:
To extract data for all Documents published at Kenya as shown in Figure 77, follow the following
steps:
1. Double click the ‘Country’ field and select Kenya.
2. Double click ‘Report Type’ Icon and select ‘Document Report’.
3. Click ‘Query’, the Report will appear as in Figure 78.
71
Figure 77 Extracting Documents for Kenya
Figure 78 Report Illustrating Documents for Kenya
Note that you can click the ‘Print’ button to print.
6.1.4
Example 2:
To extract data for documents with publisher ‘CEDARE ‘, follow these steps (Figure 79):
1. Double click the ‘Publisher’ field and select ‘CEDARE’.
2. Click the ‘Report Type’ icon.
3. Choose ‘Document Report’ report, select the report and click on ‘Query’. The report will
appear as in Figure 80 and Figure 81.
72
Figure 79 Searching for Publisher Values for CEDARE
Figure 80 Report Illustrating Document Values for CEDARE
Figure 81 Report Illustrating Document Values for CEDARE (page 2)
73
6.1.5
Example 3:
To extract data on the Document with the Call Number '55454 ' (Figure 82):
1. Double click the ‘Call Number’ field and enter '55454'.
2. Click the ‘Report Type’ icon.
3. Choose ‘Document Report’, and click on ‘Query’. The report will appear as in Figure 83
Figure 82 Searching for Document Values for Call Number: 55454
Figure 83 Report for Document Values for call number = 55454
74
6.2
Data Entry Module:
This section is made up of a number of tab screens, as shown in Figure 84:
A. Main Data
B. Copies
C. Authors
D. Keywords
E. Language
F. Footnotes
G. Collation
Figure 84 Main Data Entry Screen
The data entry module allows the users to:
1. Enter new data.
2. Update data
3. Delete Data
4. Display data
6.2.1
To Add Record
1. Access the Documents main screen.
2. Choose ‘Add’ from data entry.
3. The screen will be similar to Figure 85.
4. You can select any of the following:
A. Main Data
B. Copies
75
C. Authors
D. Keywords
E. Language
F. Footnotes
G. Collation
5. Enter the new data.
6. Click the Tab screen to add another screen
7. Click ‘SAVE’.
Figure 85 Main Data Entry Screen to Add
6.2.2
To Update Record:
1. Access the Documents main screen
2. Click ‘Edit’ from data entry. A screen will appear similar to Figure 86.
3. Click ‘Query’ and select the data to be updated.
4. A screen will open similar to Figure 87.
5. Enter the new data. Click ‘SAVE’.
76
Figure 86 Main Data Entry Screen to query and update
Figure 87 Update Screen
6.2.3
To Delete Record
1. Access the Documents main screen
2. Click ‘Edit’ from data entry.
3. Click ‘Query’ and select the data to be delete.
4. A screen similar to Figure 88 will open. Click ‘SAVE’.
77
Figure 88 Data Deletion Screen
6.2.4
To Display Records
1. Access the Documents main screen
2. Click ‘Edit’ from data entry.
3. Click ‘Query’ and select the data to be display.
4. The Display Screen will appear similar to Figure 89. Click ‘SAVE’.
Figure 89 Data Display Screen
78
7 Administration
The Administration component is made up of two menus:
A. Reference.
B. Interface.
These screens can be used to add new data, update data or delete data. These screens are not used
often, since they control data in the system’s infrastructure.
7.1
Reference
The Reference menu is made up of a geographic sub menu, and a document information sub menu
(Figure 90):
Figure 90 Main Reference Screen
7.1.1
Geographic Menu
A. City
B. Country
C. Institution
D. Regions
E. Sub National
F. Sub Regions
In each of the previous screens, you can:
1. Enter new data.
2. Update existing record.
3. Delete existing record.
4. Display existing record.
79
7.1.1.1 To Add Record:
A. Access the main screen.
B. Click ‘Reference’ from the Administration section.
C. A new menu will open on which you can select any of the following:
1. City
2. Country
3. Institution
4. Region
5. Sub National
6. Sub Region
D. Click one of these options and a new screen will open.
E. Click ‘Add’. A screen will appear similar to Figure 91.
F. Enter the new data.
G. Click ‘Save’.
Figure 91 New Data Entry – Sub National
7.1.1.2 To Update Record:
A. Access the main screen.
B. Click ‘Reference’ from the Administration section.
C. A new screen will appear from which you can select any of the following:
1. City
2. Country
3. Institution
4. Region
5. Sub National
6. Sub Region
D. Click one of these options and a new screen will appear.
80
E. Select the data to be updated, then click ‘Update’, and a new screen will appear similar to
Figure 92.
F. Enter the new data.
G. Click ‘SAVE’.
Figure 92 Data Update Screen – Country
7.1.1.3 To Delete Record:
A. Access the main screen.
B. Click ‘Reference’ from the Administration section.
C. A new screen will appear from which you can choose any of the following:
1. City
2. Country
3. Institution
4. Region
5. Sub National
6. Sub Region
D. Select one of these options and a new screen will open.
E. Select the data to be deleted and click ‘Delete’. A new screen will appear similar to Figure 93.
Figure 93 Data Deletion Screen – Sub regions
81
7.1.1.4 To Display Records:
A. Access the main screen.
B. Click ‘Reference’ from the Administration section.
C. A new screen will appear from which you can choose any of the following:
1. City
2. Country
3. Institution
4. Region
5. Sub National
6. Sub Region
D. Select one of these options and a new screen will open.
E. Select the data to be displayed, click on ‘Display’.
7.1.2
Document Information Menu
A. Author
B. Document Type
C. Frequencies
D. Publishers
E. Look Up’s
In each of the previous screens, you can:
1. Enter new data.
2. Update data.
3. Delete data.
4. Display data.
We will go over these commands on one of the Document information menu screens.
7.1.2.1 To Enter Record:
1. Access the main screen.
2. Click ‘Reference’ from the Administration section.
3. A new menu will open on which you can select any of the following:
a. Author
b. Document Type
c. Frequencies
d. Publishers
e. Look Up’s
4. Click one of these options and a new screen will open.
82
5. Click ‘Add’. A screen will appear similar to Figure 94.
6. Enter the new data, Click ‘Save’.
Figure 94 New Data Entry – Author
7.1.2.2 To Update Record:
1.Access the main screen.
2.Click ‘Reference’ from the Administration section.
3.A new menu will open on which you can select any of the following:
a. Author
b. Document Type
c. Frequencies
d. Publishers
e. Look Up’s
4.Click one of these options and a new screen will open.
5.Select the data to be updated, then click ‘Update’, and a new screen will appear
similar to Figure 95.
6.Enter the new data.
7.Click ‘SAVE’.
83
Figure 95 Data Update Screen – Frequency
7.1.2.3 To Delete Record:
1. Access the main screen.
2. Click ‘Reference’ from the Administration section.
3. A new screen will appear from which you can choose any of the following:
a. Author
b. Document Type
c. Frequencies
d. Publishers
e. Look Up’s
4. Select one of these options and a new screen will open.
5. Select the data to be deleted and click ‘Delete’. A new screen will appear similar
to Figure 96.
Figure 96 Data Deletion Screen – Document type
7.1.2.4 To Display Record:
1. Access the main screen.
2. Click ‘Reference’ from the Administration section.
3. A new screen will appear from which you can choose any of the following:
a. Author
b. Document Type
84
c. Frequencies
d. Publishers
e. Look Up’s
4. Select one of these options and a new screen will open.
5. Select the data to be displayed, click on ‘Display’ and a new screen will appear
similar to Figure 97.
Figure 97 Data display Screen – Publisher
7.2
Interface Screens:
‘Interface’ screens are used to manage user-interface. Users can change the following:
A. Report Labels
B. Screen Labels
C. Screen Names
7.2.1
Report Labels
This screen displays Report Names in the system, which can be changed according to the user’s
preference by:
1. Accessing the main screen.
2. Selecting ‘Interface’ from the ‘Administration’ section.
3. A new menu will appear, on this menu click ‘Report Label’.
4. A new screen entitled ‘Report Label’ will open. Click ‘Update’.
5. Change the Report Name, then click ‘SAVE’.
85
7.2.2
Screen Labels
Here it is possible to display the field names in the system, and change them according to the user’s
preference by:
1. Accessing the main screen.
2. Selecting ‘Interface’ from the ‘Administration’ section.
3. A new menu will appear, on this menu click ‘Screen Label’.
4. The ‘Screen Label’ screen will open
5. Change the name. Click ‘SAVE’.
7.2.3
Screens
Here it is possible to review Screen Names of the Document system and change them according to the
user’s preference by:
1. Accessing the main screen.
2. Selecting ‘Interface’ from the ‘Administration’ section.
3. A new menu will open. Click ‘Screens’.
4. A new screen entitled ‘Screens’ will open. Figure 98.
5. Click ‘Update’.
6. A new screen will appear, change the name then click ‘SAVE’.
Figure 98 Update Screens
86
8
Security Module
This module is responsible for managing user’s privileges. The System administrator can add a new
User to the system, delete a User, or display User data, specify the default user-interface language to
be used by each user (English – French – Arabic); and the privileges authorized for each User. The
Security module has two sections; Reference and Interface.
8.1
Reference Section
This section consists of three menus; Institutions, Users and Security, and Systems. The Institution
menu manages the details of the Systems available, Users and Security menus manage user’s
privileges and System menu manages system titles.
To manage any of the three menus, these are the steps for managing users and security which is similar
for the three systems:
•
Accessing the log in screen.
•
Selecting ‘Security module’ from the ‘log in’ screen.
•
A new screen will open as figure 99.
•
Select users and security from reference menu the screen similar to figure 100 is open.
•
Click ‘Add’, a screen similar to that in Figure 101 will open.
•
Enter the new User Name and Password.
•
Confirm Password.
•
Specify the language (English – French – Arabic).
•
You can select the institution by clicking ‘Institution’.
87
Figure 99 Users and security Screen
•
Choose the systems to be used by the User from the following:
o Data and indicator
o Experts database
o Documents database
o Security module
•
Chooses the authorization privileges for the User from the following:
o Search
o Data Entry
o Metadata
o Administration
•
Click ‘SAVE’.
88
Figure 100 User Names and System Names
Figure 101 Adding a New User
It is also possible to change any User’s password by clicking ‘Update’, changing the Password,
confirming it, then clicking ‘SAVE’. You can delete any user by clicking 'Delete'.
8.1.1
Systems
Users can update or display System / Database name by the following steps:
•
Selecting ‘System’ from the Reference menu. A screen similar to Figure 102 will open.
•
Clicking ‘Update’ to modify the system name as in Figure 103, then clicking ‘Save’.
89
Figure 102 System Names
Figure 103 Update System Name
8.2
Interface Section
The Interface section allows users to customize the labels of the security module fields. Users can
update and display the current records.
9 Export Data
To export any data from the system to Microsoft® Excel sheet:
•
Access the main screen.
•
Select ‘Indicator’ from the ‘Search’ section.
•
A search screen will open Figure
•
Select the indicator from list.
•
Select 'export data' from report type list.
.
90
Figure 104 the export screen
•
Click the ‘Query’ button to load all data of query.
•
After loading the excel sheet the message appear as figure 105.
Figure 105 the message after export
•
The excel files are found in the application root directory under export folder as figure 106.
Figure 106 the files exported
91