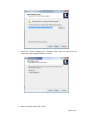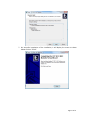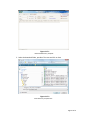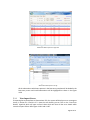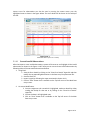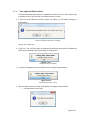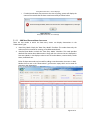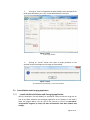
1
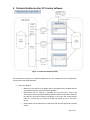
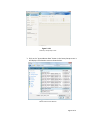
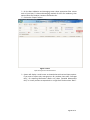
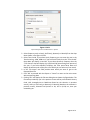
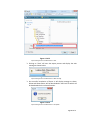
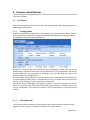
International Comparison Program [07.01] ICP COUNTRY SOFTWARE (Household Consumption Items) User Manual Version 1.0 Global Office 2nd Regional Coordinators Meeting April 14-16, 2010 Washington, DC Contents 1. INTRODUCTION ................................................................................................................................ 4 1.1 1.2 1.3 ABOUT THIS GUIDE .............................................................................................................................. 4 SCOPE ............................................................................................................................................... 4 DEFINITIONS AND ACRONYMS ................................................................................................................ 4 2. SYSTEM REQUIREMENTS .................................................................................................................. 6 3. TECHNICAL ARCHITECTURE FOR ICP COUNTRY SOFTWARE .............................................................. 7 4. SOFTWARE INSTALLATION ............................................................................................................... 9 5. HOUSEHOLD PRICE COLLECTION MODULE FEATURES ..................................................................... 12 5.1 DATA ENTRY APPLICATION .................................................................................................................. 13 5.1.1 Launch the Data Entry application ....................................................................................... 13 5.1.2 Setup Survey Setup/Import Data – Initial Setup ................................................................... 14 5.1.3 Export Survey Setup Data ..................................................................................................... 18 5.1.4 Add Locations and Outlets .................................................................................................... 20 5.1.5 Modify/Add Survey Setup Data ............................................................................................ 20 5.1.6 Set Exchange Rate between Local Currency and Foreign Currency ...................................... 20 5.1.7 Download Data Entry Template ........................................................................................... 21 5.1.8 Import Observations ............................................................................................................. 23 5.1.9 View Import Errors ................................................................................................................ 26 5.1.10 Correct Invalid Observations ................................................................................................. 27 5.1.11 Save Imported Observations ................................................................................................. 28 5.1.12 Add New Observations via screen......................................................................................... 29 5.1.13 Change on screen Data entry mode...................................................................................... 32 5.1.14 View existing Observations ................................................................................................... 32 5.1.15 Modify Observations via screen ............................................................................................ 33 5.1.16 Filter Observations ................................................................................................................ 33 5.1.17 Delete existing Observations ................................................................................................ 35 5.1.18 Export Existing Observations in an Excel file ......................................................................... 37 5.1.19 Modify existing observations using the exported Excel file .................................................. 39 5.1.20 Change the Rejected status of an Observation ..................................................................... 39 5.1.21 Change the row highlighting color of the rejected observations .......................................... 40 5.1.22 Change the row highlighting color of the invalid observations ............................................ 41 5.1.23 Change the Default Database ............................................................................................... 42 5.1.24 Create an empty Database ................................................................................................... 44 5.2 DATA VALIDATION AND AVERAGING APPLICATION ................................................................................... 46 5.2.1 Launch the Data Validation and Averaging application ....................................................... 46 5.2.2 View Observation Summary for Products ............................................................................. 47 5.2.3 Filter Observations Summary ................................................................................................ 49 5.2.4 Validate and calculate Average Prices for Products ............................................................. 51 5.2.5 Set MinMax Price Ratio Limit................................................................................................ 53 5.2.6 Set Coefficient of Variation Limit .......................................................................................... 54 5.2.7 View Observation Details ...................................................................................................... 55 5.2.8 Set Deviation Limit ................................................................................................................ 58 5.2.9 Set T Ratio Limit .................................................................................................................... 59 5.2.10 Modify Observation Details .................................................................................................. 59 5.2.11 Save Validated Observations ................................................................................................ 60 5.2.12 Reject Observation ................................................................................................................ 60 5.2.13 Change the row highlighting color of the rejected observations .......................................... 61 Page 2 of 73 5.2.14 5.2.15 5.2.16 6. Change the row highlighting color of the invalid observations ............................................ 62 Change the Default Database ............................................................................................... 63 Export Average Prices and Observation Details .................................................................... 65 COMMON CONTROL FEATURES ...................................................................................................... 69 6.1 GRID CONTROL ................................................................................................................................. 69 6.1.1 Grouping Rows...................................................................................................................... 69 6.1.2 Sorting Records ..................................................................................................................... 69 6.1.3 Filtering Records ................................................................................................................... 70 6.1.4 Hiding Unused Columns ........................................................................................................ 71 6.1.5 Selecting Multiple Rows ........................................................................................................ 71 6.2 TREE CONTROL.................................................................................................................................. 71 6.2.1 Resizing Nodes and Columns ................................................................................................ 72 6.2.2 Controlling the Visibility of Columns ..................................................................................... 72 6.2.3 Reordering Columns and Nodes ............................................................................................ 72 6.2.4 Sorting .................................................................................................................................. 73 Page 3 of 73 1. Introduction The ICP Country Software is a part of the International Comparison Program which includes a series of statistical surveys held worldwide to collect price data for a sample of commonly bought goods and services. This document is mainly focused towards the Household Price Collection module of the ICP Country software. The ICP Household Price Collection module is divided into two sub modules: 1.1 ● Data Entry Data Validation and Averaging About this Guide This guide acts as a reference manual for the User and features the following sections: 1.2 ● Installation ● Feature Overview ● User Guide Scope The scope of this document at present covers only installation process and features of the Household Price Collection Module of the ICP Country software. 1.3 Definitions and Acronyms Following are the definitions and abbreviations used in this document: Term Description ICP International Comparison of Prices Price quotation This is the price quoted by a vendor for a product item as specified in the ICP product list. The price quotation is basically the complete database record that includes information on the product, the outlet (shop, where this product is priced, the type of that outlet code) the monthly price, the variety description, the geographic area code, the month the price was collected, and all other attributes such as rural/urban, domestic/imported, sale price/regular price, seasonal/non-seasonal, etc. These are attributes that classify the demography of the survey location, for example- Rural/Urban, High/Mid/Low Income etc. The list of attributes would be configurable by the Region for their countries This is used to take multiple logical Location Types Page 4 of 73 views on the same physical Location hierarchy. The physical nature of the Location hierarchy, which remains the same across all the logical views, is preserved by the parent child relationship. Weights This refers to the purchasing power information that is captured at the elementary product level. UI User Interface UoM UOM / Unit of Measurent PC Price Collector HHC Household Consumption Items Basic Heading In principle, basic heading consists of a group of similar well-defined products, from which sample of products can be selected that are both representative of their types and purchases in participating countries. In practice, a basic heading is defined as the lowest level of final expenditure in the GDP, for which explicit expenditures can be estimated. IHSN ToolKit International Household Survey Network’s (IHSN) software tools which provide features for storing survey questionnaires, documentation on the surveys as well as survey responses (data). The IHSN Toolkit uses international standards called Data Documentation Initiative (DDI) for documenting the data. Set of five or six choices that characterize an outlet where price observations are collected. These can be: Department Store, Market, Street Vendor etc. These types could vary from region to region. Outlet Types Preferred Quantity The quantity that is set as the standard quantity by which a product’s converted price is to be measured. A product basket is defined in terms of the Products comprising the list taken along with their preferred measures and preferred quantities. Preferred UOM The UoM that is set as the standard measure by which a product’s converted price is to be measured. A product basket is defined in terms of the Products comprising the list taken along with their preferred measures and preferred quantities. Page 5 of 73 Previous Period Price This selection means that the reference price in the compare process is arrived at using the period prior to the selected period for fetching the reference set of observations. 2. System Requirements The World Bank recommends a standard set of hardware and software requirements that are conducive for optimal installation and functioning of the PCM module: Software Requirements The best suitable software configuration is recommended below: Operating System: Windows® XP or later Application Software: Microsoft Excel® 2003 and above Others: Adobe acrobat 9.0 and above Screen Resolution: 1280x1024 Hardware Requirements The best suitable hardware configuration is recommended below: For Windows® XP - Intel Pentium® IV, 1 GB RAM Page 6 of 73 3. Technical Architecture for ICP Country Software Figure 1: Technical architecture (HHC) This architecture represents a standalone application for each module and all the modules will be using the same SQLite database. Data Entry Module o Master lists received from the Region will be uploaded into this module and the uploaded data will be stored into SQLite database o Observations will be entered / uploaded into the data entry screen and observations will be stored into SQLite database. Already saved master data will be used here to perform the basic validations in the screen like invalid product code, etc, and also user can select the master list lookup to pick an item from the list o Observations can be exported into excel sheet and manually imported into IHSN tool kit. Page 7 of 73 Data Validation and Averaging Module o Observations entered/uploaded through the data entry module that are already stored in SQLite database will be used for validation and averaging observations o This module will validate the observations and system will calculate & display averages in the screen o Validated observations can be saved and the data will be stored in SQLite database o The average calculated data can be exported into excel in a predefined template o Validated and averaged data can be exported into excel sheets and those are manually imported into IHSN toolkit. SQLite Database o Both modules share common SQLite database which is being used to store the data from the data entry and data validation & averaging modules. IHSN Toolkit o The exported excel sheet from data entry or data validation & averaging module will be manually imported into IHSN toolkit. IHSN toolkit internally stores the uploaded metadata and micro data into its own format and that data will be transferred into the Region. Page 8 of 73 4. Software Installation Please follow the steps as mentioned below to install the Household Price Collection module of the ICP Country software: 1. Uninstall previous version of the software if it was installed. 2. To begin the installation, click on the “ICP 2011 HHC Modules.exe” which will launch the screen shown below. 3. Click on the “Next” button 4. Select the Folder/Directory where you want to install this software by clicking on the “Browse” and then click “Next”. Page 9 of 73 5. Leave the “Create a desktop icon” checkbox check to get the shortcut of the software on your desktop and then click “Next”. 6. Now on the next screen Click “Install”. Page 10 of 73 7. On successful completion of the installation, it will display the screen as shown below. Click on “Finish”. Page 11 of 73 5. Household Price Collection Module Features The Household Price Collection Module (HHC) is a Desktop application that is provided to the country offices for capturing and then validating and averaging the price data for the Household consumption items. The HHC Module comprises of two sub modules, both of which are independent Desktop applications and share the same database. Data Entry: To capturing the Price data for the predefined products/Items Data Validation and Averaging: To Validate the data that is captured in the Data Entry Module and then generating the Average prices. This user manual describes following usage scenarios for both Data Entry and Data Validation & Averaging application. Data Entry Application o How to launch the Data Entry application o How to Setup/Import Survey Setup Data – Initial Setup o How to Add Locations and Outlets o How to Modify/Add Survey Setup Data o How to Export Survey Setup Data List o How to Set Exchange Rate between Local Currency and Foreign Currency o How to Download Data Entry Template o How to import Observations o How to view Import Errors o How to Correct Invalid Observations o How to Save Imported Observations o How to Add New Observations via screen o How to Change on screen Data entry mode o How to Modify Observations via screen o How to view existing Observations o How to filters Observations o How to View filters o How to Delete existing Observations o How to Export Existing Observations in an Excel file o How to modify Existing Observations using the exported Excel file o How to Change the Rejected status of an Observation o How to Change the row highlighting color of the rejected observations o How to Change the row highlighting color of the invalid observations Page 12 of 73 5.1 5.1.1 o How to Change the Default Database o How to Create an empty Database Data Validation & averaging Application o How to launch the Data Validation and Averaging application o How to View filters o How to filters Observations o How to view Observation Summary for Products o How to Set MinMax Price Ratio Limit o How to Set Variation Coefficient Limit o How to Validate and calculate Average Prices for Products o How to Set Deviation o How to Set T Ratio Limit o How to View Observation Details o How to modify Observation Details o How to Save Validated Observations o How to Reject Observation o How to Change the row highlighting color of the rejected observations o How to Change the row highlighting color of the invalid observations o How to Change the Default Database o How to Export Observation Summary for Products and Observation Details Data Entry Application Launch the Data Entry application After the installation The HHC Module on installation creates a Shortcut along with an icon for the Data Entry application on the desktop. It also adds it under the Program Menu. User can click on the shortcut or click on the Start Menu->Programs/All Programs (in Vista)->ICP 2011 HHC Modules->HHC Data Entry. Page 13 of 73 Figure 5.1.1.1 Data Entry Shortcut on the Desktop Figure 5.1.1.2 Data Entry Option in the Start Menu 5.1.2 Setup Survey Setup/Import Data – Initial Setup After Launching the Data Entry Application first time, it is very important to set up the Survey data without which both Data Entry as well Data Validation and Averaging application cannot be used. Each country office will receive a master list in the form of an Excel sheet which will contain seven worksheet each of which is described below: 1. Country Details: This is a read only worksheet, which will have following details prefilled for the Country: Country Code: Three digit code for the country Country Name: Name of the Country Description : Additional Details if any Page 14 of 73 Local Currency: Official Local currency(National currency) of the Country Foreign Currency: Secondary Currency that is being used in the country, if there is any. 2. Product Mater: This is also a read-only worksheet, which will have list of all products for which the country is suppose to collect the price data. 3. Location Type: This worksheet will be pre-filled with list of Location types. You can modify all the details of a location type except the Location Type Code. You can also add a new Location type in the first empty row that is available at the end of this list. 4. Location Type: This worksheet will be pre-filled with list of Location types. You can modify all the details of a location type except the Location Type Code. You can also add a new Location type in the first empty row that is available at the end of this list. 5. UoM Master: This worksheet will be pre-filled with list of Units of Measurement (UoM). You can modify all the details of a UoM except the UoM Code. You can also add a new UoM in the first empty row that is available at the end of this list. 6. UoM Conversion Factors: This worksheet will be pre-filled with Conversion factors for all available UoMs. You can modify all the details of a UoM Conversion factors except the Source and Target UoM Codes. You can also add new UoM conversion factors for newly added UoM in the first empty row that is available at the end of this list. 7. Location Outlets: The master list sent by the Region will not have any entry for the Locations and Outlets in this worksheet which means this will be sent as a blank list with only column headers. You will have to add details of all the Locations in your country along with their corresponding outlets in this Excel sheet. Once you make all the correction/modification in the Master list, save it. Now to setup the Survey Data follow the steps mentioned below: Launch the Data Entry application and click on the “Setup” button that is available on the top left corner of the screen. Before the Survey Data Setup the screen will look like as shown below. Note: You will only be able to import Survey Setup data at this point of time and rest of the application features will be disabled. Once you complete the Survey Data Setup, all other feature of the application will be enabled. Page 15 of 73 Figure 5.1.2.1 Data Entry Survey Setup screen Click on the “Import Master Data” button in the Survey Setup screen. It will display a file selection screen as shown below: Figure 4.1.2.2 Master Data Excel File Selection Page 16 of 73 Select the Master List (Excel) file that is sent by the region and modified/Saved by you. Click “Open”. System will start the data setup process by first validating the data in all worksheets and then importing and saving it in to its own database. While import is in process a wait dialog along with a progress bar will be displayed. Figure 4.1.2.3 Survey Setup Data Import progress If there was no error in the data, system will complete the import and display Import successful message as shown below and populate Country detail e.g. Country Name, Local Currency and Foreign Currency( if there is any) etc on the Survey setup screen. Figure 4.1.2.4 Survey Setup Data Import Completed In case the Excel file has invalid or incorrect data in e.g. Location name is empty, UoM Code is empty, Same record added twice in a worksheet,; the Data setup(import) will fail and display an error as shown below: Figure 4.1.2.5 Survey Setup Data Import Error Message It will also display a Hyperlink “View Error Details” just above the “Import Master Data” button. Clicking on this Hyperlink will open an Excel file which will have details of all errors in the Master List data along with Work Sheet Name and Row Number. Page 17 of 73 Figure 4.1.2.6 Survey Setup Data Import Error Hyperlink Figure 4.1.2.7 Survey Setup Data Import Error Hyperlink 5.1.3 Export Survey Setup Data The Survey Setup data can be exported to an Excel file. The Exported Excel file will have the same format as the Master Data file sent by the regional office. Steps for exporting the Survey Setup Data are mentioned below: Page 18 of 73 Click on the “Export Master Data” button that is available on the Survey Setup screen. Figure 4.1.3.1 Exporting Survey Setup Data Select the folder where you want to save the exported file, provide the file name and click on “Save”. Figure 4.1.3.2 Survey Setup Data Export file name Data Export will start and system will display Wait Dialog along with a progress bar as shown below: Figure 4.1.3.3 Page 19 of 73 Survey Setup Data Export Progress Once the Export is completed, system will display “Exported Successfully” message as shown below: Figure 4.1.3.4 Survey Setup Data Export Completed 5.1.4 Add Locations and Outlets Process of adding locations and outlets during the initial setup is already described in Point 7 of Section 4.1.2. After the initial setup if you want to add new locations or outlets or both then export the Survey Setup Data in an Excel file (steps mentioned in section 4.1.3) and then add new Location and outlet details in the “Location Outlets” worksheet of this Excel and save. Now Import this excel file by following the steps mentioned in section 4.1.2. 5.1.5 Modify/Add Survey Setup Data Process of adding or modifying the Survey Setup Data ( Location type, Outlet Type, UoM and UoM conversion Factors) during the initial setup is already described in Point Section 4.1.2. But you want to add/modify Survey setup Data after the initial setup is done, then follow the steps as mentioned below: Export the Survey Setup Data in an Excel file (steps mentioned in section 4.1.3), Add new Records at the end of the worksheet or modify the existing records Save the Excel file. Import this excel file by following the steps mentioned in section 4.1.2. 5.1.6 Set Exchange Rate between Local Currency and Foreign Currency The Exchange Rate can be set only when Foreign Currency present for a Country. The Exchange Rate is nothing but the conversion factor between the Local Currency and Foreign Currency. Since the Exchange rate keeps on changing with time, you can change it as and when required. Once you set the value for Exchange Rate, it will be used as the default Exchange rate for all future Data entry (Observations) for which, Observed price is collected in foreign currency and Exchange is rate is not provided explicitly. To Set the Exchange Rate follow the steps as mentioned below: Page 20 of 73 Navigate to the Survey Setup screen Enter the Exchange in the “Exchange Rate” field Click on the “Apply” button Figure 4.1.6.1 Set Exchange Rate System will display a message as shown below Figure 4.1.6.2 Set Exchange Rate Save Message 5.1.7 Download Data Entry Template The Data entry Template is nothing but a blank Excel sheet with only column headers which are required for capturing an Observation. Columns with a “*” sign in the column header represents Mandatory columns and all other columns are optional. Follow the steps as mentioned below to download the Data Entry Template file: Click on the “Download Data entry Template” hyperlink Page 21 of 73 Figure 4.1.7.1 Download Data Entry Template Select the download folder, provide a file name and click on Save Figure 4.1.7.2 Save Data Entry Template File Page 22 of 73 Data Entry Template download will start and system will display a wait dialog message as shown below Figure 4.1.7.3 Download Data Entry Template File Wait Message Once the Template is downloaded successfully, System will display message “Exported Successfully” Figure 4.1.7.4 Download Data Entry Template File Completed 5.1.8 Import Observations The Data entry application provides three ways of entering a new Observation. 1. Using the data entry Template which is described below in this section 2. Using the Exported Observation sheet which is described in section 4.1.20 3. Through main screen of the data entry application which is described later in section 4.1.14 For bulk data entry, importing the observation using the Data entry Template file is the fastest method. Following are the steps for this method: Download a Data entry Template file ( Refer Section 4.1.7) Open the Excel file and enter data in all mandatory columns. Optional columns can be left empty if you do not want to enter data explicitly. If you already have observations in more than one excel file then you can either import each of those files one by one or copy all observations from those excel files into one file (Data entry template) and then import them together. Please note that importing an Excel file with more than 2000 records might take more time (slow). Save the Excel file and close it before importing. Click on the “Import” button that is provided on the Main screen of the Data entry application. System will show a file selection dialog box. Page 23 of 73 Figure 4.1.8.1 Import Observations using Data Entry Template Figure 4.1.8.2 Select Data Entry Template File for Import Select the Data Entry Template file in which you have entered the observations. Click “Open”. System will start the import process by first validating the data in the file and then importing and saving it in to its own database. While import is in process a wait dialog along with a progress bar will be displayed. Page 24 of 73 Figure 4.1.8.3 Observation Data Import progress If there was no error in the data, system will complete the import and display Import successful message as shown below: Figure 4.1.8.4 Observation Data Import Completed Click on “Save” button to save all the imported records to the database. In case the Excel file has invalid or incorrect data e.g. Invalid or empty product code, Invalid foreign Currency etc, Same record added twice in a worksheet, System will display an error as shown below: Figure 4.1.8.5 Observation Data Import Error Message It will also display a Hyperlink “View Error Details” on the Top of the main screen. Clicking on this Hyperlink will open an Excel file which will have details of all errors in the Master List data along with Work Sheet Name and Row Number. All the observations which were present in the Data entry template will be loaded in the Data entry screen and invalid observations will be highlighted as shown in the figure 4.1.8.6. Page 25 of 73 Figure 4.1.8.6 Observation Data Import Error Hyperlink Figure 4.1.8.7 Observation Data Import Error Log All the observations which were present in the Data entry template will be loaded in the Data entry screen and invalid observations will be highlighted as shown in the figure 4.8.6. 5.1.9 View Import Errors If importing Survey Setup Data or Observations fails, the system will display an error message as shown in section 4.1.2 and 4.1.8. To view the error details you can click on the “view Error Details” hyperlink which will open an Excel sheet which will have all the error details which cause the import failure. Refer figure 4.1.8.6 and 4.1.8.7. Page 26 of 73 Import errors for observations can also be seen by moving the mouse cursor over the highlighted rows as shown in the figure below. The error details will be shown in the Tooltip of the row. Figure 4.1.9.1 Observation Data Import Error in Tooltip 5.1.10 Correct Invalid Observations After the import or save invalid observations, system will show error and highlight all the invalid observations as shown in the figure 4.1.8.7. Now you can correct these invalid observations by following either of the two methods mentioned below: 1. Using Excel: View the Error Details by clicking on the “View Error Details” Hyperlink and then modify the corresponding Observations in the Data entry Template excel file. Save the Excel file Import it again by following the steps mentioned in Section 4.1.8 Click on “Save” button that is available on the Top left corner of the Main Data entry screen. 2. On screen Modification: You can navigate to each row which is highlighted, read error details by either reading the tooltip for that row or by clicking on the “View Error Details” Hyperlink. Correct the data in all highlighted rows. Click on “Save” button that is available on the Top left corner of the Main Data entry screen Page 27 of 73 5.1.11 Save Imported Observations Once the Observation Data import is completed successfully, Click on “Save” button that is available on the Top left corner of the Main Data entry screen. If there are some duplicate records, system will display a confirmation message as shown below: Figure 4.1.11.1 Saving with duplicate Observations -Validating Clicking “No” will stop save. If you click “Yes” or if there were no duplicate observations system will first validate the observations and display the wait message as shown below Figure 4.1.11.2 Saving Observations -Validating It will start saving observations and display wait message as shown below Figure 4.1.11.3 Saving Observation Data - Saving After the observations are saved, it will display a messages as shown below: o If all observations were valid: Figure 4.1.11.4 Page 28 of 73 Saving Observation Data – Success Message o If invalid records were also present at the time of saving, system will display the count of the records that has been saved successfully as shown below: Figure 4.1.11.5 Saving Observation Data –Error Message 5.1.12 Add New Observations via screen There are two modes in which the Data entry screen can display observations in the “Observations” grid. 1. Data Entry Mode: Check the “Data Entry Mode” Checkbox. This mode shows only the columns which are useful for entering a new Observation detail. 2. Detailed View Mode: Uncheck the “Data Entry Mode” Checkbox. This mode provides detailed information about Observations. Along with the columns that are displayed in Data entry Mode, it also displays columns such as Product Name, Location Name, Outlet Name, UoM Name etc. Either of these two modes can be used for adding a new observation via screen. In both Modes the first row in the “Observations” grid remains empty which can be used for entering a new observation. Page 29 of 73 Figure 4.1.12.1 Empty row in Data entry Mode Figure 4.1.12.2 Empty row in Detailed View- Data Entry To add new observations follow the steps as mentioned below: Navigate to the first row (empty row) in the “Observations” grid. Navigate to each column by either using mouse or Tab button. Enter data in all columns e.g. observation date, product code, location code etc All master data column such as Product Code/Name, Location Code/Name, and Outlet Code/Name etc shows a prefilled list of available codes and names on mouse click. You can either pick the code from these lists or enter it using the keyboard. Page 30 of 73 Figure 4.1.12.3 Entering new Observation - Data Entry Entering an invalid code in these columns displays an error message and blanks out that column. For example if you enter an invalid Product code and try to navigate to the next column by hitting the Tab button or mouse, system will display a message as shown below along with the code entered by you. Figure 4.1.12.4 Invalid Code Message - Data Entry If you want to enter more than one observation, then keep after completing the data entry for first observation hit tab on the last column. It will add the newly entered observation to the “Observations” grid and add a new empty row on the top. Now you can add a new observation. Keep on repeating these steps until you have added all the observations. Click on “Save” button that is available on the Top left corner of the Main Data entry screen. Now follow steps as mentioned in section 4.1.11. Page 31 of 73 5.1.13 Change on screen Data entry mode As mentioned in section 4.1.12 there are two modes available for the data entry in the “Observations” grid, Data Entry Mode or Speed Mode and Detailed View mode. You can switch between these two modes by checking or un-checking the “Data entry Mode” Checkbox. Figure 4.1.13.1 Entering new Observation - Data Entry 5.1.14 View existing Observations You can view the existing observations by loading them in the “Observations” grid. To load the observations follow the steps as mentioned below: On the data entry screen select appropriate filter criteria such as From Date and To date both are mandatory, then Products and file Names both are optional. Click on the “Get Data” button It will display a wait message box as shown below Figure 4.1.14.1 Loading Observation Message Page 32 of 73 Grid will be loaded with all observations that match the filter criteria. If there is no observation present in the database which matches with the filter criteria then a message will be displayed to the user as shown below: Figure 4.1.14.2 No matching Observation Message 5.1.15 Modify Observations via screen Load the existing observations which you want to modify by following the steps mentioned in section 4.1.12. Navigate to each of the observation which you wish to modify and make the necessary changes e.g. modify outlet code or Observed price etc. Click on “Save” button. Follow the steps mentioned in section 4.1.11. 5.1.16 Filter Observations There are four filter criteria available on the main screen of the Data Entry application which can be used for filtering the existing observations. From Date: Observation Date of the observation should not be before this date. This is a mandatory filter criterion. To Date: Observation Date of the observation should not be after this date. This is a mandatory filter criterion. Products: This field shows a list of all available products in the form of a tree. You can select one or multiple or none (All) products for which you want to load/View the observations on the screen. If you don’t select any product then these filter criteria will be ignored and observations for all products will be loaded. File Name: This field shows list of all file name to which you have exported observations previously. Export is described in Section 4.1.18. If you never exported observations before then it will display “None” in the list which means Empty file Name or observations which are not yet exported. Select Products from the Products dropdown tree (Optional) Select Exported File Name from the File Name drop down ( Optional) Select From Date and To date Page 33 of 73 Figure 4.1.16.1 Select Date - Filter Figure 4.1.16.2 Select Products – Filter Page 34 of 73 Figure 4.1.16.3 Select File Name – Filter Example: Suppose you want to see all the observations available between two specific dates, then select those two dates as From and to date and click on “Get Data”. Now if you want to download Observations for specific products then select those products from the Products dropdown tree and Click on the “Get Data” button. 5.1.17 Delete existing Observations You can delete single or multiple observations at a time through the “Observations “grid. Follow the steps mentioned below to delete Observations. Load Observations by following the steps mentioned in Section 4.1.14 or 4.1.16. Select the Observation that you want to delete by clicking on the row header of the Grid. If you want to delete multiple observations, hold the “Shift” key and one by one click on the row header of all the observations that you want to delete. Page 35 of 73 Figure 4.1.17.1 Select multiple observations- Delete Click on the “Delete” button that is available on the Data entry screen. Figure 4.1.17.2 Delete Observations System will display a confirmation message as shown below Page 36 of 73 Figure 4.1.17.3 Delete Observations Confirmation Message Clicking on “Yes” will delete all selected observations and “Observations” Grid will be refreshed. Clicking on “no” will not do anything and focus will return to the “Observations” grid. 5.1.18 Export Existing Observations in an Excel file As described in section 4.1.12 and 4.1.13 the Data entry screen can show data in two formats “Data Entry mode” and “Detailed View Mode”, similarly it also supports downloading a Blank Template( Section 4.1.7) and downloading existing observations data in Detailed View mode. To Download Existing Observations follow the steps as mentioned below: On the data entry screen select appropriate filter criteria such as From Date and To date both are mandatory, then Products and file Names both are optional. Click on the “Export” button Page 37 of 73 Figure 4.1.18.1 Exporting Observation It will display a small screen (dialog box), asking for the file Name. Enter the desired file name which you want to give to the Exported Excel File and click “Ok” to continue or “Cancel” to go back to the data entry main screen. Figure 4.1.18.2 Export File Name - Exporting Observation After Clicking “Ok” will, it will display File Save dialog box which will display the formatted file name (name provided you prefix with Country Code, HHC, “RawPrices”, from date and To date). Here you can also select the folder in which you want to export this Excel file. Now Click “Save” to export the file. Figure 4.1.18.3 Select Export file Directory – Exporting Observations Clicking on “Save” will start the export process and will display wait message as shown below Page 38 of 73 Figure 4.1.18.4 Wait Message – Exporting Observations On successful export it will display the message as shown below and Observations will be downloaded in the Excel file which will be downloaded at the selected location. Figure 4.1.18.5 Export Completed Message – Exporting Observations 5.1.19 Modify existing observations using the exported Excel file In Section 4.1.18 we have seen how to download existing observations in an excel file. This excel file can now be used for review and modification of existing observation data as well as addition of new observations. New Observations can be added in the first empty row at the end of the Observations list. It’s not required to provide data in “Name” columns i.e. Product Name, Location Name, Outlet Name etc. You just need to provide data in all mandatory columns and then save the Excel file. Now you can import it to the system by following the steps as mentioned in section 4.1.9 and 4.1.11. 5.1.20 Change the Rejected status of an Observation While validating existing observations using the Data Validation and Averaging application, any observation can be marked as “Rejected” by the user. The rejection could be based on certain rules/guidelines which will be followed by the user who validates the Observations. If an observation is rejected, the “Data Entry” screen will display “Rejected” in the “Rejected” column of the “Observations” grid and will be highlighted with the color set/selected in the “Rejected Observations” color selection box. The Rejected Column can be seen only in the Detailed View Mode of the “Observations” grid. To change the Rejected status observation follow the steps as mentioned below: Navigate to the Rejected observation Click on the “Rejected” field A drop down will be shown with two options “Rejected” and empty. Select empty Repeat these steps for all Rejected observations that you want to change Click on “Save” Page 39 of 73 Figure 4.1.20.1 Change Rejected Status 5.1.21 Change the row highlighting color of the rejected observations The back color of a rejected observation in the “Observations” grid is customizable. You can select any color that is available in the “Rejected Observations” color box as shown in the screenshot below. As soon as you select a new color; all rejected observations will be highlighted with the selected color. The application persist this change. Page 40 of 73 Figure 4.1.21.1 Change Rejected Observations color 5.1.22 Change the row highlighting color of the invalid observations Similar to Rejected Observations the back color of Invalid observations in the “Observations” grid is customizable. You can select any color that is available in the “Invalid Observations” color box as shown in the screenshot below. As soon as you select a new color; all invalid observations will be highlighted with the selected color. The application persist this change. Page 41 of 73 Figure 4.1.22.1 Change Invalid Observations color 5.1.23 Change the Default Database If you have more than one database files (Household Price Collection software database file) available, you can use any of those file in the Data entry application by changing its default database. To Change the database follow the steps as mentioned below: Launch the Data entry Application Navigate to the Survey Setup screen by clicking on the “Setup” button. Click on the button which is available next to the “Change Database” field Page 42 of 73 Figure 4.1.23.1 Change Default Database It will display a file Selection dialog box (screen) as shown below. Locate the database file which you want to use in the Data Entry application and click on “Open button” Figure 4.1.23.2 Select Database file- Change Default Database The full path of the new database will be populated in the Change database text field. Now click on “Save” to connect to this database. Page 43 of 73 Figure 4.1.23.3 Save change - Change Default Database It will display a message as shown below and Data entry application will be refreshed with the data available in the newly selected database. Figure 4.1.23.4 Database changed Message - Change Default Database 5.1.24 Create an empty Database Using this feature you can create an empty SQLite database, which will be similar to the database which comes with the installation of the Household Price Collection software. So after using the Household Collection software for one Country, if you want to use it for another country you don’t need to re-install it. You just need to create a new database and connect to it (Section 4.1.23). Now you can setup the Survey Data for the new country by following the steps mentioned in Section 4.1.2. To create an empty database follow steps as mentioned below: Launch the Data entry Application Page 44 of 73 Navigate to the Survey Setup screen by clicking on the “Setup” button. Click on the button which is available next to the “Create New Database” field Figure 4.1.24.1 Create Empty database It will display a file save dialog box (screen) as shown below. Select the Folder where you want to create the new database, provide the Database File Name and Click on “Save” button. Figure 4.1.24.2 New Database file Name and Location- Create Empty database Page 45 of 73 Clicking on “Save” will populate the New Database name along with the folder path selected by you, in the “Create New Database” text field. Figure 4.1.24.3 Create Empty database Clicking on “Create” button will create an Empty database at the selected location and display the message as shown below. Figure 4.1.24.4 New Database Created Message- Create Empty database 5.2 5.2.1 Data Validation and Averaging Application Launch the Data Validation and Averaging application After the installation The HHC Module on installation creates a Shortcut along with an icon for the Data Validation and Averaging application on the desktop. It also adds it under the Program Menu. User can click on the shortcut or click on the Start Menu>Programs/All Programs (in Vista)->ICP 2011 HHC Modules->HHC Data Validate And Average. Page 46 of 73 Figure 4.2.1.1 Data Validation and Averaging Shortcut on the Desktop Figure 4.2.1.2 Data Validation and Averaging Option in the Start Menu 5.2.2 View Observation Summary for Products You can view the existing observations Summary for all products by loading them in the “Products” grid. To load the Observation summary follow the steps as mentioned below: On the Main screen of application, select appropriate filter criteria such as From Date, To date and Averaging Method. All three are mandatory filters and all other are mandatory. Click on the “Get Data” button Page 47 of 73 Figure 4.2.2.1 Load Observation Summary for Products It will display a wait message box as shown below Figure 4.2.2.2 Loading data Message Grid will be loaded with all observations that match the filter criteria. Refer the screenshot below. Page 48 of 73 Figure 4.2.2.3 Observation Summary for Products In the screenshot above you can see that the Observations Summary all products (as per filter) is loaded in the Tree format. Initially this tree will be loaded only with Product Codes, Names and number of Observations available for each product. Clicking on Validate/Average button will calculate and load other detail which is described in the section 4.2.4. 5.2.3 Filter Observations Summary There are ten filter criteria available in the Data Validation and Averaging application which can be used for filtering the existing observations and summary. From Date: Observation Date of the observation should not be before this date. This is a mandatory filter criterion. To Date: Observation Date of the observation should not be after this date. This is a mandatory filter criterion. Averaging Method: Method to be used for calculating Average price for products. Products: This field shows a list of all available products in the form of a tree. You can select one or multiple or none (All) products for which you want to load/View the observations summary Page 49 of 73 on the screen. If you don’t select any product then this filter criterion will be ignored and observations summary for all products will be loaded. Locations: This field shows a list of all available Locations in the form of a drop down list. You can select one or multiple or none (All) Locations for which you want to load/View the observations summary on the screen. If you don’t select any location then this filter criterion will be ignored and observations summary for all locations will be loaded. Outlets: This field shows a list of all available Outlets in the form of a drop down list. You can select one or multiple or none (All) Outlets for which you want to load/View the observations summary on the screen. If you don’t select any Outlet then this filter criterion will be ignored and observations summary for all Outlets will be loaded. File Name: This field shows list of all file name to which you have exported observations previously. Export is described in Section 4.18. If you never exported observations before then it will display “None” in the list which means Empty file Name or observations which are not yet exported. Location Type: This field shows a list of all available Location Type in the form of a drop down list. You can select one or multiple or none (All) Location Type for which you want to load/View the observations summary on the screen. If you don’t select any location type then this filter criterion will be ignored and observations summary for all location types will be loaded. Outlet Type: This field shows a list of all available Outlet Type in the form of a drop down list. You can select one or multiple or none (All) Outlet Type for which you want to load/View the observations summary on the screen. If you don’t select any Outlet Type then this filter criterion will be ignored and observations summary for all Outlet Types will be loaded. Select Products from the Products dropdown tree (Optional) Select Exported File Name from the File Name drop down ( Optional) Select From Date and To date Include Validated Observations: There is an “Include Validate Observations” checkbox available on the screen. Checking this box and clicking “Get Data” will include already validated observations while calculating the average prices for each product that is loaded in the grid. Please refer the screenshot below for all filter criteria on this screen: Page 50 of 73 Figure 4.2.3.1 Filter Observation Summary 5.2.4 Validate and calculate Average Prices for Products Once you have loaded the Observation Summary for products by following steps as mentioned in section 4.2.2 or 4.2.3 you can click on the “Validate/ Average” button. Page 51 of 73 Figure 4.2.4.1 Validate and Average Observations The system will calculate MinMax Price ratio, Average Price and Var. Coefficient for all products for which there exists at least one Observation. While calculating these values, system will display wait message as shown below Figure 4.2.4.2 Wait Message- Validate and Average Observations After calculating all the above mentioned values, it will populate them for all listed products as shown below. Page 52 of 73 Figure 4.2.4.3 Validate and Average Observations 5.2.5 Set MinMax Price Ratio Limit To set MinMax price ratio Limit, change the value provided in the “MinMax Price Ratio Limit” field. If the MinMax price ratio for a product is less than this value then its MinMax price ratio cell will be highlighted with the color shown in the “Color selection box” that is available next to the “MinMax Price Ratio Limit” text field. Each time you modify this value, you need to click on the “Validate/Average” button to refresh the highlighting. Formula for Calculating MinMax Price Ratio: MinMax Price Ratio= (Min Price (Converted Price) / Max Price (Converted Price)) Page 53 of 73 Figure 4.2.5.1 Set MinMax Price Ratio Limit 5.2.6 Set Coefficient of Variation Limit To set Variation Coefficient Limit, change the value provided in the “Var. Coefficient Limit” field. If the Var. Coefficient for a product is more than this value, then its Var. Coefficient cell will be highlighted with the color shown in the “Color selection box” that is available next to the “Var. Coefficient” text field. Each time you modify this value, you need to click on the “Validate/Average” button to refresh the highlighting. Formula for Calculating Coefficient of Variation: CoV= ((STDEV(Converted Price) / AVG(Converted Price)) * 100) Page 54 of 73 Figure 4.2.6.1 Set Variation Coefficient Limit 5.2.7 View Observation Details The observation details are shown in the “Observations/Quotation” tab of the data grid which shows the Observation summary for products. User can select more than one product at a time and view its details. To view Observation Details for products, follow the steps mentioned below: Load the Observation Summary for products by following steps as mentioned in section 4.2.2 or 4.2.3 or 4.2.4. Select the product for which you want to see the observations details from the Observation Summary as shown in the figure below Page 55 of 73 Figure 4.2.7.1 Select Products for Observation Details Click on the “Observations/Quotations” Tab as shown in the figure below Figure 4.2.7.2 Navigate to Observation Details The Observation Details will be displayed in a grid as shown below. Page 56 of 73 Figure 4.2.7.3 View Observation Details Deviation and T Ratio for an observation will be highlighted with different color if they are not valid as per the values set in the “Deviation Limit” and “T Ratio” fields as shown in the figure below. The color for highlighting these invalid values will be used as per the color shown next to the “Deviation Limit” and “T Ratio Limit” text fields. Page 57 of 73 Figure 4.2.7.4 Invalid Deviation Limit and T Ratio Limit 5.2.8 Set Deviation Limit To set Deviation Limit, change the value provided in the “Deviation Limit” field. If the Deviation for an observation is invalid then its Deviation cell will be highlighted with the color shown in the “Color selection box” that is available next to the “Deviation Limit” text field. Refer figure 4.2.7.4 for details. Each time you modify this value, you need to click on the “Validate/Average” button to refresh the highlighting. The rule for deciding invalid Deviation is If Deviation for an Observation is less than (1- “Deviation Limit” set in the “”Deviation Limit”) If Deviation for an Observation is greater than (1 + Deviation Limit) Formula for calculating Deviation Deviation= ((Converted Price - Average Price) / Average price *100) Page 58 of 73 5.2.9 Set T Ratio Limit To set T Ratio Limit, change the value provided in the “T Ratio Limit” field. If the T Ratio for an observation is invalid then its T Ratiocell will be highlighted with the color shown in the “Color selection box” that is available next to the “T Ratio Limit” text field. Refer figure 4.2.7.4 for details. Each time you modify this value, you need to click on the “Validate/Average” button to refresh the highlighting. The rule for deciding invalid T Ratio is If T Ratiofor an Observation is greater than “T Ratio Limit” (Set in the T Ratio Limit field) Formula for calculating T Ratio T Ratio = ((Converted Price - Average Price) / Std. Deviation) 5.2.10 Modify Observation Details The Data Validation and Averaging Module allow modifying only following values for an observation: Observed Quantity Observed Price Observed UoM Rejected status Comments To modify Observations, follow the steps as mentioned below: Load the Observations by following the steps mentioned in section 4.2.7. Navigate to any observation and modify values in any of the 5 fields mentioned above. Page 59 of 73 Figure 4.2.10.1 Modifying an Observation Click on “Save” button Figure 4.2.10.1 Save Observation 5.2.11 Save Validated Observations You can Validate and modify observations by following the steps mentioned in section 4.2.10. After that clicking on the “Save” button will mark all selected observation (shown in the Observation/Quotation grid) as validated. If the “Include Validated Observations” was not checked the observation list will be cleared out (shows blank observation grid). Next time when you load the Observation summary for products, these validated observation will not be shown unless you check the “Include Validated Observations” checkbox. 5.2.12 Reject Observation While validating existing observations using the Data Validation and Averaging application, any observation can be marked as “Rejected” by the user. The rejection could be based on certain rules/guidelines which will be followed by the user who validates the Observations. If an observation is already rejected, the “Observation/Quotation” grid will display “Rejected” in the “Rejected” column and will be highlighted with the color set/selected in the “Rejected Observations” color selection box. To reject observation follow the steps as mentioned below: Load the Observations by following the steps mentioned in section 4.2.7. Navigate to the observation you want to reject Click on the “Rejected” field Page 60 of 73 A drop down will be shown with two options “Rejected” and empty. Select “Rejected” Repeat these steps for all observations that you want to Reject Click on “Save” You can also change the status of rejected Observation by selecting empty option available in the drop down shown in the “Rejected” drop down. After making this change click on “Save”. Figure 4.2.10.1 Reject Observation 5.2.13 Change the row highlighting color of the rejected observations The back color of a rejected observation in the “Observations” grid is customizable. You can select any color that is available in the “Rejected Observations” color box as shown in the screenshot below. As soon as you select a new color; all rejected observations will be highlighted with the selected color. The application persist this change. Page 61 of 73 Figure 4.2.13.1 Change Rejected Observations color 5.2.14 Change the row highlighting color of the invalid observations Similar to Rejected Observations the back color of Invalid observations in the “Observations” grid is customizable. You can select any color that is available in the “Invalid Observations” color box as shown in the screenshot below. As soon as you select a new color; all invalid observations will be highlighted with the selected color. The application persist this change. Page 62 of 73 Figure 4.1.14.1 Change Invalid Observations color 5.2.15 Change the Default Database If you have more than one database files (Household Price Collection software database file) available, you can use any of those file in the Data entry application by changing its default database. To Change the database follow the steps as mentioned below: Launch the Data Validation and Averaging Application On the Main screen check the “Change Database” Checkbox as shown below. It will Display a text filed and a button next to it. The text field will show the full path of the database that is being used by the application. Page 63 of 73 Figure 4.2.15.1 Change Default Database- Data Validation and Averaging application Click on the button which is available next to the “Change Database” field as shown in the screenshot 4.2.15.1. It will display a file Selection dialog box (screen) as shown below. Locate the database file which you want to use in the Data Entry application and click on “Open button” Figure 4.2.15.2 Select Database file- Change Default Database Page 64 of 73 The full path of the new database will be populated in the Change database text field. Now click on “Save” to connect to this database. Figure 4.2.15.3 Save change - Change Default Database It will display a message as shown below and Data application will be refreshed with the data available in the newly selected database. Figure 4.2.15.4 Database changed Message - Change Default Database 5.2.16 Export Average Prices and Observation Details The Data Validation and Averaging application facilitate to download either Average prices only or Observation Details or both in an Excel file. Follow the steps mentioned below to export Page 65 of 73 On the Data Validation and Averaging screen select appropriate filter criteria such as From Date, To date and Averaging method; all three are mandatory, then optional filters like Products, Locations and Outlets etc. Click on the “Export” button. Figure 4.2.16.1 Export Average Prices and Observations System will display a small screen as shown below with various Export options. If you want to export only average prices for products then select “Averages Only”, for exporting Observation details only select “Detailed Observations Only” or in case you want to export both in a single Excel file then select “Both”. Page 66 of 73 Figure 4.2.16.1 Export Average Prices and Observations - Options Select frequency such as Yearly, Half Yearly, Quarterly or Monthly from the drop down shown in the figure 4.2.16.1 Select Time Period. If you select Yearly frequency you can enter the year in the Time Period e.g. 2009, 2008 etc. If you select Half Yearly then the “Time Period” drop down will display H1 and H2. If you select Quarterly frequency then the “Time Period” drop will display Q1, Q2,Q3 and Q4 representing each quarter of the year. If you select Monthly frequency the Time period drop down will display all twelve month of the year out of which you can select any one month. In the “File Name” text field provide name which you want to give to the Exported Excel file. Click “OK” to proceed with the Export or “Cancel” to return to the main screen without exporting data. Clicking “OK” will display the file save dialog box as shown the figure below. The file name provided by you in the previous screen will be pre-fixed with Country Code, HHC, AveragePrices or RawPrices (based on the selection in previous screen), Yearly or half Yearly or Quarterly or Monthly (based on the selection in previous screen), Selected Time period i.e. H1, H2 or Q1 Q2 etc, then year entered by you. Page 67 of 73 Figure 4.2.16.2 Export Average Prices and Observations –Save Clicking on “Save” will start the export process and display the wait message as shown below Figure 4.2.16.3 Export Average Prices and Observations –Wait message On successful completion of Export it will display message as shown below and Observations will be downloaded in the Excel file which will be downloaded at the selected location. Figure 4.2.16.4 Export Average Prices and Observations –completed Page 68 of 73 6. Common control features This section describes important features of some of the UI controls that has been used in the ICP Country software. 6.1 Grid Control This control has been used in both Data entry and Data Validation and Averaging modules for displaying the observations. 6.1.1 Grouping Rows Enables you to group data against one or more columns. If you group data by a column, records with identical column values are arranged into corresponding data groups. The group row can be expanded to access the underlying data rows. An end-user can group data by a particular column by dragging its header from the column header panel or the customization form onto the group panel. To ungroup the data, remove the column header from the group panel by dragging it. You can also change the order of the grouping columns using drag and drop. It's also possible to group data by a column by selecting the "Group By This Field" option from the column header context menu. To ungroup data, use the "Un-Group" option from the same menu or "Clear Grouping" from the group panel context menu. Records are always sorted against the grouping columns. If you group data against a column which isn't sorted, the grid control will automatically apply sorting in ascending order to the column. Subsequently, if you remove the column from the group panel its sort settings will be cleared. 6.1.2 Sorting Records This feature provides the ability to sort data against one or multiple columns. When sorting is applied to a view, rows are re-arranged to meet the current sort settings. Page 69 of 73 To sort data against a Grid View's column or to change the column's sort order, an end-user can click its column header. The column's current sort order is indicated by the sort glyph (a small arrow displayed at the column header's right edge). If the data is sorted in ascending order, the sort glyph represents an up-arrow. When sorting in descending order, the sort glyph is displayed as a down-arrow. If the column isn't sorted, the sort glyph is hidden. In the following image, data is sorted against the Country column in ascending order and against the City column in descending order. 6.1.3 Filtering Records Filtering allows you to display a subset of records from a data source. When filtering is applied to a Grid View, only those records that meet the current filter criteria are displayed. You can filter data against a single or multiple columns. In a Grid View, an end-user can apply, change or remove filtering via a column's Filter Button. Clicking it invokes a filter dropdown list which by default contains the predefined ((All), (Custom), (Blanks) and (Non Blanks)) values along with the values of items. At the top of the list the most recently used filter conditions are displayed. The following image shows the filter dropdown list invoked for a column in a Grid View: It's also possible to add custom filter items to the filter dropdown list which can be used to apply any filter criteria to the data when they are selected. After a filter has been applied to the current View the filter panel appears by default at the bottom of the View. Page 70 of 73 The filter panel displays a string which represents the current filter criteria and contains buttons to disable/enable and clear the filter and invoke the Filter Editor. It also provides access to the most recently used filter criteria applied to the View. 6.1.4 Hiding Unused Columns The customization form provides facilities for adding and removing columns from a View at runtime by using drag & drop. Dragging the column by its header and dropping it within the customization form client area hides the column from the current View. The column reappears when the header is dragged from the customization form to the View's client area. Banded Views support the same operations with bands. See the topic for details. The Customization Form can be opened by: Selecting Column Chooser from the header panel context menu. To hide a specific column/band, an end-user can do one of the following: Drag a column/band header onto the Customization Form. Drag a column/band header away from the Column Header Panel, even if the Customization Form is not visible Right-click a column header, and select Remove This Column from the Column Header Context Menu. After columns/bands have been hidden, they can be restored by opening the Customization Form and dragging them from the Customization form onto the Column Header Panel. 6.1.5 Selecting Multiple Rows For selecting multiple rows at a time, do one of following: 1. Click on the row header and hold CTRL button and click on the next row you want to select 2. Click on the row header and hold Shift button and click on the next row you want to select 6.2 Tree Control This control has been used in some of the popup in both applications and Quotation/Observation summary list in the Data Validation and Averaging module. Page 71 of 73 6.2.1 Resizing Nodes and Columns The following mouse operations can be performed by end-users to resize columns and nodes. Action Effect Dragging a column header's right edge Changes the column's width. Dragging an indicator cell's bottom edge Changes the node's height. Double-clicking a column header's right edge Changes the column's width to 'best fit' its content. Double clicking an indicator cell's bottom edge Applies auto height to all nodes. Selecting the "Best Fit"/"Best Fit (all columns)" item from the column header's context menu Applies "best fit" to the corresponding column or all columns. 6.2.2 Controlling the Visibility of Columns The following mouse operations allow end-users to change the visibility of columns. The Customization Form can be opened by: Selecting Column Chooser from the header panel context menu. Action Effect Selecting the "Runtime Column Customization" item from the context menu. Invokes the customization form. Dragging a column header onto the customization form Hides the column. Dragging a column header from the customization form onto the column header panel Makes the corresponding column visible. 6.2.3 corresponding Reordering Columns and Nodes The following operations can be performed by end-users to rearrange columns and nodes. Dragging a column header and dropping it to a new position within the column header panel. Dragging a node indicator and dropping it to a new position. Page 72 of 73 6.2.4 Sorting The following operations can be performed by end-users to apply or cancel sorting by column values. Action Effect Clicking a column header Toggles the column's sort order. The previous sorting is removed. Clicking a column header while holding the SHIFT key pressed Toggles the column's sort order. The previous sorting is preserved. Clicking a column header while holding the CTRL key pressed Removes sorting by this column. The previous sorting is preserved. Selecting the "Sort Ascending" or "Sort Descending" items in the column header's context menu Applies the corresponding sort order to the column. The previous sorting is preserved. Page 73 of 73