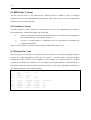
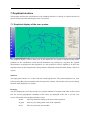
1
User Manual AQUASPLATCHE A program to simulate genetic diversity in populations living in linear habitats version 1.0 Author: Samuel Neuenschwander Computational and Molecular Population Genetics Lab (CMPG) Institute of Zoology University of Bern Baltzerstrasse 6 3012 Bern Switzerland URL: http://cmpg.unibe.ch/software/AQUASPLATCHE March 2006 3 Table of contents 1 Introduction...................................................................................................................................... 5 2 Versions, Installation & System requirements................................................................................. 6 2.1 Graphical version (Windows)................................................................................................... 6 2.2 Console versions (Windows & Linux) ..................................................................................... 6 2.3 System requirements................................................................................................................. 6 3 Demographic and spatial expansion module.................................................................................... 7 3.1 Principles .................................................................................................................................. 7 3.2 Demographic model.................................................................................................................. 7 3.2.1 Regulation phase ............................................................................................................... 7 3.2.2 Migration phase................................................................................................................. 7 3.2.3 Demographic models......................................................................................................... 9 3.3 Dynamic environment ............................................................................................................ 10 4 Genetic module .............................................................................................................................. 11 4.1 Principles ................................................................................................................................ 11 4.2 Genetic data ............................................................................................................................ 12 4.2.1 Microsatellite data ........................................................................................................... 12 4.2.2 RFLP data........................................................................................................................ 12 4.2.3 DNA sequence data......................................................................................................... 13 4.2.4 Standard data ................................................................................................................... 13 4.2.5 SNP data.......................................................................................................................... 13 5 Input files ....................................................................................................................................... 14 5.1 Settings file ............................................................................................................................. 14 5.2 Population source file (dens_init.txt) ...................................................................................... 15 5.3 Genetic samples (GeneSamples.sam) ..................................................................................... 15 5.4 River system input .................................................................................................................. 16 5.4.1 Nodes (Nodes.txt)............................................................................................................ 16 5.4.2 Segments (Segments.txt) ................................................................................................. 17 5.5 Range changes specifications (dynamic_maps.txt)................................................................. 17 6 Output files..................................................................................................................................... 19 6.1 Images during the demographic simulation............................................................................ 19 6.2 Images during the genetic simulation ..................................................................................... 19 6.3 ARLEQUIN files (*.arp, *.arb) ............................................................................................. 19 6.4 Coalescence distribution files (*.coal).................................................................................... 19 6.5 MRCA files (*.tmrca)............................................................................................................. 20 4 6.6 Tree files (*.trees)................................................................................................................... 20 6.7 Distance file (*.txt) ................................................................................................................. 20 7 Graphical interface......................................................................................................................... 21 7.1 Graphical display of the river system ..................................................................................... 21 7.2 File & Image........................................................................................................................... 22 7.2.1 Setting file ....................................................................................................................... 23 7.2.2 Image............................................................................................................................... 23 7.3 Network transformation.......................................................................................................... 25 7.3.1 Visualization.................................................................................................................... 25 7.3.2 Resizing........................................................................................................................... 26 7.3.3 Segment transformation .................................................................................................. 26 7.4 Demographic simulation......................................................................................................... 27 7.4.1 Model .............................................................................................................................. 28 7.4.2 Environment .................................................................................................................... 30 7.4.3 Output.............................................................................................................................. 30 7.5 Genetic simulation.................................................................................................................. 32 7.5.1 Mutation model ............................................................................................................... 32 7.5.2 Output.............................................................................................................................. 34 7.6 Times Series ........................................................................................................................... 35 7.6.1 Migration......................................................................................................................... 36 7.6.2 Demography .................................................................................................................... 36 7.6.3 Cumulative density.......................................................................................................... 37 8 Acknowledgments.......................................................................................................................... 38 9 References...................................................................................................................................... 38 5 1 Introduction The goal of this user manual is to describe the technical aspects of the software AQUASPLATCHE (version 1.0). This manual complements the article of S. Neuenschwander, published in Molecular Ecology Notes: Neuenschwander, S. AQUASPLATCHE: A program to simulate genetic diversity in populations living in linear habitats. Molecular Ecology Notes Abstract: Classical models of structured populations do not apply well to populations of freshwater fishes, since they evolve in complex networks of river systems that are intermediate between one-dimensional and two-dimensional stepping-stone models. In order to allow the simulation of the genetic diversity of populations drawn from such river systems, we have developed a new simulation program called AQUASPLATCHE. It starts by dividing a realistic vectorized network of river streams into segments of arbitrary length. The program then proceeds by simulating the colonization of the streams from an arbitrary source, recording the evolution of the segment densities and the migration events between adjacent segments over time. This demographic history is then used to generate genetic data of population samples located in various segments of the river system, using a backward coalescent framework. 6 2 Versions, Installation & System requirements Three versions of AQUASPLATCHE are available. All the versions require the same input files. The downloadable compressed files include the executable program, an example set of input files, and the user manual. The user manual is focused on the graphical version for Windows. 2.1 Graphical version (Windows) To run AQUASPLATCHE, the compressed file needs to be extracted and copied to an arbitrary directory. “AQUASPLATCHE.exe” is the main executable file and can be started by a double-click. The graphical settings are stored in a settings file, to store them between different sessions. 2.2 Console versions (Windows & Linux) Compared to the graphical version the console version cannot generate graphical outputs. The easiest way to use the graphical version is to specify all the necessary parameters using the graphical version, and then to launch the console version by using the settings file as input parameter. The advantage of the console version is its shorter computation time. The console version is most useful when it runs on a cluster. 2.3 System requirements The system requirements depend mainly on the simulation settings. The computation time and the amount of memory required depend on the total number of demes and on the number of generations to simulate. For instance, a simulation of 10,000 segments over 4,000 generations require about 400 MB of free RAM, and takes about 2.8 minutes to complete on a 2.4 GHz CPU running Linux. 7 3 Demographic and spatial expansion module 3.1 Principles The demographic and spatial expansion module allows one to simulate a demographic and spatial expansion from one or more initial populations. The simulation uses discrete time and space. The unit of time is a generation, while the unit of the space is a segment, also called a deme. Each segment has a certain length and can be considered as a homogeneous subpopulation. Each segment undergoes an independent population growth, and it can exchange migrants with its direct neighbouring segments. Each segment is also considered as a sub-unit of the environment. Variations through time of the range extension are also possible, which is defined as a dynamic environment. 3.2 Demographic model The demographic models consist of two steps during which densities and migrations are calculated and stored in a database for each segment and each generation: 3.2.1 Regulation step At each generation and for each segment there is first a logistic regulation of the population size following the equation K − Nt N t +1 = N t 1 + r , K where K is the carrying capacity for a segment, N is the current density of the segment, and r is the intrinsic rate of growth. The fractional part of the current density (N is an integer) is truncated and added at the next generation. 3.2.2 Migration step The regulation step is directly followed by a migration step where individuals are exchanged between neighbouring segments. We introduced a density based migration rate mD changing smoothly between low and high local densities. This to take into account the fact that species may show a different migration behaviour during the colonization phase compared to in the equilibrium phase when habitats are already colonized. 8 Migration rate mD depending on the local density. mCol is the migration rate at low density, and mOcc is the migration rate at high densities. In this figure mCol is bigger than mOcc implying that this species migrates faster during the colonization process than when the carrying capacity has been reached. The corresponding equation is mD = mCol − mCol − mOcc , 1 + A * e − L* D where mCol is the migration rate during the colonization phase (un-colonization habitats), mOcc is the migration rate when the carrying capacity has been reached (occupied habitats), D is the current local density defined as N / K (current density divided by the carrying capacity), A is an absolute term set to 1000, and L is L = 2 * ln( A) . Larger A lead to smoother migration curves. L is calculated in order that the mean value between the two migration rates corresponds to a density of 50%. Note that the carrying capacity is identical for all demes. If mCol is larger than mOcc, the migration rate is higher during colonization and vice versa if mCol is smaller than mOcc. If the two migration rates are equal the migration rate is constant for all densities. The number of emigrants M is then distributed among the neighbouring segments taking into account their densities Di, expressed by the percentage of K. The probability of sending emigrants is calculated as Pi = f Di * ∑n =1 Neighbours fn Dn , where f represents the directional migration and depends on the physical position the neighbouring segment (nbr) has in relation to the local segment (loc): 9 loc < nbr → 1 / F f = loc = nbr → 1 , loc > nbr → F where “loc < nbr” means that the altitude of the local segment is lower than the altitude of the neighbouring segment (downstream) and consequently the water flows from the neighbouring to the current segment. F is the probability of upstream migration compared to downstream migration (upstream migration/downstream migration), which has to be specified. If F > 1 then upstream migration is more probable than downstream migration and the opposite is true for F < 1 . If F = 1 then the species has no preferences for directional migration. Migrants have a higher probability to be sent to neighbouring segments with low population densities compared to neighbouring segments with high population densities. The effective numbers of emigrants send to neighbouring segment i is M i = Pi * N * m D . 3.2.3 Demographic models There is a choice between different levels of stochasticity of the demographic model described above: 3.2.3.1 Model 1: Non stochastic model There is no stochasticity in the demographic model. The advantage of this model is a fast execution time compared to the stochastic models. 3.2.3.2 Model 2: Model with stochastic growth The regulation phase includes stochasticity. The new population size varies randomly according to a Poisson distribution centred on their initial values. 3.2.3.3 Model 3: Model with stochastic migration The migration phase includes some stochasticity. A multinomial distribution is used to split the number of emigrants among the neighbouring segments. 3.2.3.4 Model 4: Full stochastic model This model is a combination of the two previous models including stochastic growth and stochastic migration. 10 3.3 Dynamic environment It is possible to simulate a change in the range of the river system over time by selecting the option dynamic network over time. It is thus possible to simulate changes caused by glaciations and interglacials. These changes have to be defined in separate. See for further details the chapter Dynamic map file specifications. 11 4 Genetic module 4.1 Principles The genetic simulation procedure is implemented according to the program SPLATCHE (Currat et al., 2004), with some modifications when generating microsatellite data. Genetic simulations are always done after a demographic simulation, since they use demographic information generated during the demographic phase. The genetic phase is based on the “coalescent theory”, initially described by Kingman (1982a; 1982b) and developed in later papers (Ewens, 1990; Hudson, 1990; Donnelly & Tavaré, 1995). This theory allows the reconstruction of the genealogy of sampled genes until their most recent common ancestor (MRCA). For neutral genes, the genealogy essentially depends on the demographic factors that have influenced the history of the populations where the genes have evolved. The implementation of the coalescent theory is a modified version of SIMCOAL (Excoffier et al., 2000). The principal difference with SIMCOAL is that the demographic information used by genetic simulations does not come from the “migration matrix” and "historical events" anymore, but from the data base generated during the demographic simulation. The genetic simulation itself follows the procedure described in Excoffier et al. (2000) and consists in two phases 1°) Reconstruction of the genealogy: The reconstruction of the genealogy is independent of the mutational process. Basically, a number n of genes is specified. All the n genes are associated with a geographic position in the virtual river system where the demography is simulated. These genes could be located in different segments in the river system. Then, going backward in time, the genealogy of these genes is reconstructed until their most recent common ancestor (MRCA) in the following way: Going backward in time, at each generation, two events can occur: Coalescent event: If at least two genes are in the same segment, they can potentially have a common ancestor at the preceding generation (a so-called coalescent event). This probability depends on the densities Ni of the segment where the genes are located. Each pair of genes has a probability 1/Ni of coalescence. If there are ni genes in the segment then the probability of one coalescent event becomes ni (ni -1)/2Ni. Only one coalescent event is allowed per segment and per generation (see Ray et al. (2003) for a discussion about this assumption). Migration: Forward in time, each gene could have arrived by immigration from a different segment. When going backward in time, it means that these genes could leave the current segment 12 according to the immigration rates. So, the probability of migration from a segment i to a segment j for a gene depends on the number of individuals that have arrived from segment j to segment i at this generation. For each gene belonging to the segment i, the probability of migration from segment j is equal to mji/Ni where mji is the number of immigrants from segment j to segment i during the demographic phase. All the segment densities and the numbers of immigrant between segments are taken from a database generated during the demographic simulation. 2°) Generation of the genetic diversity: The second phase of a genetic simulation consists in generating the genetic diversity of the samples. This is done by adding independent mutations over the branches of the genealogy assuming a uniform Poisson process. At the end of this process all sampled genes have a specific genetic identity. The genetic process is entirely stochastic. The coalescent backward approach does not generate the genealogy of the whole population, but only that of the sampled genes and their ancestors. Thus, this approach is much less demanding in terms of memory and computation time than a forward approach. It allows the simulation of complex demographic scenarios. 4.2 Genetic data Different types of molecular data can be generated (Microsatellites, RFLP, DNA, Standard, and SNP), each with their own specificities: 4.2.1 Microsatellite data A generalized stepwise mutation model (GSM, Zhivotovsky et al., 1997; GSM, Estoup et al., 2002) was implemented, with or without constraint on the total size of the microsatellite. Several unlinked microsatellite loci can be simulated under the same mutation model constraints. The output for each locus is listed as a number of repeat, having started arbitrarily at 5,000 repeats. The number of repeats for each gene should thus be centred on that value of 5,000. 4.2.2 RFLP data Only a pure 2-allele model is implemented. Several RFLP loci can be simulated, assuming a homogeneous mutational process over all loci. A finite-sites model is used, and mutations can hit the same site several times, switching the RFLP site on and off. We thus assume that there is the same probability for a site loss or for a site gain. 13 4.2.3 DNA sequence data Several simple finite-sites mutational models are implemented. The user can specify the percentage of substitutions that are transitions (the transition bias), the amount of heterogeneity in mutation rates along a DNA sequence according to either a discrete or continuous Gamma distribution. We can therefore simulate DNA sequences under a Jukes and Cantor model (Jukes & Cantor, 1969) or under a Kimura-2-parameter model (Kimura, 1980), with or without Gamma correction for heterogeneity of mutation rates (Jin & Nei, 1990). Other mutation models that depend on the nucleotide composition of the sequence were not considered here, because of their complexity and because they require specifying many additional parameters, like the mutation transition matrix and the equilibrium nucleotide composition. 4.2.4 Standard data Following the definition given in ARLEQUIN User Manual (Excoffier et al., 2005) this type defines data for which the molecular basis is not particularly defined. The comparison between alleles is done at each locus. For each locus, the alleles could be either similar or different. 4.2.5 SNP data SNP data consist of loci with two different states: ancestral (0) and mutant (1). There is no information about the molecular difference between the 2 states. In AQUASPLATCHE it is possible to specify a minimum frequency for the minor allele (the less frequent of the 2 states) over all samples or at least within one sample. 14 5 Input files AQUASPLATCHE requires several input files to work. This chapter describes the files and illustrates them by using the example input files delivered with the program. 5.1 Settings file The settings file is the main file containing links to other input files and as well simulation parameters. All these parameters can be defined using the graphical interface. An example of such a setting file is shown below: dens_init.txt GeneSamples.sam Nodes.txt Segments.txt dynamic_maps.txt 1000 2 250 4 1000 0.5 1 1 0 10 1 10000 0 2 1 1 0.0005 0.33 0 1 0 0 0.1 0 1 0 0 0 0 500 0.6 0.6 1 0 END // // // // // // // // // // // // // // // // // // // // // // // // // // // // // // // // // // // // // // // pop source file original genetic sample file river segment node file input river segment file input dynamic environment file carrying capacity per segment demographic model (1-4) number of generations generation time real time BP of simulation start growth rate allow initial density overflow? (0/1) rate for initial Density overflow (0-1) static or dynamic environment? (0/1) number of demographic simulations (entire simulations / only console version) number of genetic simulations per demographic simulation maximum number of simulated generations data type (0: MICROSAT, 1: RFLP, 2: DNA, 3: STANDARD, 4: SNP) number of independent loci number of linked loci should the output contain genotypic (1) or haplotypic data (0)? mutation rate per unlinked locus (per microsat / per sequence) fraction of substitutions being transitions for DNA gamma A for DNA mutation variation number of categories for DNA mutation variation range constrain for microsatellite geometric distribution of the GSM for microsats (0: SSM) minimum frequency of SNP (0: not considered) minimum frequency of SNP within at least one sample (0: not considered) generate Arlequin output (0/1) generate coalescence image output? (0/1) generate coalescence times output? (0/1) generate genetic trees output? (0/1) generate MRCA times output? (0/1) divergence time in generations migration rate for un-colonized segments (migrCol: 0-1) migration rate for colonized segments (migrOcc: 0-1) upstream migration ratio (1: upstream = downstream) transform segments to this length in meter (0: use original drainage) 15 5.2 Population source file (dens_init.txt) This file contains the location of one or several initial populations, from where the demographic expansion takes place. There are two ways to define the location of the initial populations; either by the segment id or by coordinates. Below you find an example file for each definition: By segment id: 1 // number of initial populations 0 // populations defined by coordinates? (0/1) #Name #Ind #Seg #Resize pop1 100 2681898 10 By coordinates: 1 // number of initial populations 1 // populations defined by coordinates? (0/1) #Name #Ind #Lon #Lat #Resize pop1 100 7.61458 47.9925 10 The first line specifies the number of populations which are defined below, followed by the selection of the location definition, where 1 stands for yes and 0 for no. The third line is a heading line. The following lines are devoted to the population definitions. Each initial population is characterized by the name (without spaces), the number of genes (haploid density) at the onset of the expansion, the location definition, either in one column in case of segment identification or in two columns in case of coordinates (longitude, latitude) and the resize parameter. This last parameter is only used for the genetic simulation and specifies the population size before the beginning of the expansion. If this parameter is set to 0, then the density of the population source before the onset of the expansion is regarded as being equal to the initial size (parameter 2.). Note that if the initial density overflow is switched on, and therefore the initial population may be distributed among several demes (see section Allow density overflow and Initial filling rate of K), the resize parameter must be set to the total size of the initial population (e.g. 100) if the user wants to keep this initial size before the beginning of the expansion. If the location is defined by coordinates, an algorithm searches for the closest segment which serves then as the source. In section Network transformation it is possible to visualize the discrepancy, respectively precision of the assignment of the geographical coordinates to the segments. The location declaration by segment identification works only if the river system is not altered in terms of segment length (segment length has to be set to 0 to use this definition). 5.3 Genetic samples (GeneSamples.sam) The genetic samples are defined in a file similar to that containing the definition of the initial populations: 16 By segment: 9 // number of sample populations 0 // populations defined by coordinates? (0/1) #name #ind #seg sample1 20 2683099 sample2 20 2697155 . . . By coordinates: 2 // number of sampled populations 1 // populations defined by coordinates? (0/1) #name #ind #lon #lat sample1 20 7.63286 46.67791 sample2 20 7.21413 47.18797 Again the first line specifies the number of populations which are defined below, followed by the location definition, where 1 stands for yes and 0 for no. The third line is a heading line. The following lines correspond to the population definitions. Each sampled population is characterized by its name (without spaces), its sample size, and its location definition, either in one column in case of segment identification or in two columns in case of coordinates (longitude, latitude). If the location is defined by coordinates an algorithm searches for the closest segment which acts then as the source. The location declaration by segment identification works only if the river system is not altered in terms of segment length (segment length has to be set to 0 to use this definition). 5.4 River system input The input for the vectorized river system consists of two files: one specifies the nodes and the other the segments, i.e. the connections between the nodes. These outputs can be obtained by exporting a vectorized river system from a Geographical Information System (GIS) such as ArcGIS. 5.4.1 Nodes (Nodes.txt) This file contains the information on the connections (nodes) between the segments: Title: Nodes Date: 13.02.2005 Nodes: 1007 NodeID Lon 86 7.61458 630 7.57995 . . . Lat 47.9925 47.9249 17 The file begins with of 4 lines which are purely informative for users and not used by AQUASPLATCHE. Each node is characterized by its identification (NodeID), and the coordinates (longitude, latitude). The NodeID will be used in the segment file to define connections between the nodes. 5.4.2 Segments (Segments.txt) This file contains the information on the river segments, i.e the connections between the nodes: Title: All segments Date: 23.02.2005 Segments: 1006 SegID FNode 2674739 2867 2674740 2182 TNode 3065 2194 Length 3714.74 112.448 Lon 9.53083 9.56107 Lat 47.6584 47.7373 The file consists of 4 foregoing lines which are purely informative for users and not used by AQUASPLATCHE. Each segment is characterized by its identification (SegID), the physically upper (FNode) and lower (TNode) node, the length of the segment in meters, and the coordinates (longitude, latitude). The SegID can be used to specify the initial and the sampled populations. The distinction between FNode and TNode is important when using directional migration. 5.5 Range changes specifications (dynamic_maps.txt) This file is only used if simulations are using range changes of the environment over time (i.e. dynamic environment), for example during glaciations and interglacials. Each range change at a certain period has to be defined separately in a file. The files of the individual range changes are declared in a main file (dynamic_maps.txt). The structure of the main dynamic environment file is: // list of the maps of a certain time // time 0 150 200 file map_1.txt map_2.txt map_3.txt Text after a double slash (“//”) represent comment lines. Therefore the first two lines of the example are ignored. Each line consists of a dynamic map characterized by the number of generations after the onset of the expansion and the path to the file describing this map (path names cannot contain spaces). The structure of a dynamic map file is: Start 0 27821 27822 27823 27824 // title // are the listed segments active? (0/1) 18 The first line contains the name of the map displayed in the graphical interface. The second line characterizes the segments in the list if they have to be disabled (0) or enabled (1). The following lines contain a list of the involved segments, characterized by the segment identification (SegID). Again any text after a double slash (“//”) are comments. These maps are relative, which means that only the listed segments are modified according to the choice (enabled or disabled segments). The range changes have only an influence on the demographic simulation and not on the genetic simulation. 19 6 Output files AQUASPLATCHE can generate various output files. The output files generated during simulations are stored in the folders GeneticOutput, and DemographyOutput located in the folder containing the river system specification. Some of the outputs are always generated, while others are optional and have to be specified. Additionally, it is possible to save manually at any time the displayed river system as a bitmap file. 6.1 Bitmap files generated during the demographic simulation During the demographic simulation, the following bitmap files can be generated and stored in the folder DemographyOutput: • Population size stored in the folder Density • Number of emigrants stored in the folder Migration • Colonized segments stored in the folder Occupation 6.2 Bitmap files generated during the genetic simulation During the genetic simulation, the following bitmap files can be generated and stored in the folder GeneticOutput: • For every independent locus the number of coalescent events can be stored in the folder NumCoal • The visualization of the river system during the genetic simulation can be stored in the folder GeneticSimulations 6.3 ARLEQUIN files (*.arp, *.arb) Each genetic simulation can output an ARLEQUIN project file with the extension “*.arp”. This file can be analyzed by the population statistical software ARLEQUIN (Excoffier et al., 2005). If more than one simulation is performed per demographic simulation then an ARLEQUIN batch file (with extension “*.arb”) is additionally generated, listing all simulated files. This allows the computation of summary statistics on the whole set of simulated files. Note also that the ARLEQUIN software has a file conversion utility for exporting input data files into several other format like BIOSYS, PHYLIP, or GENEPOP, so that files produced by AQUASPLATCHE could also be analyzed by these softwares after file conversion. 6.4 Coalescence distribution files (*.coal) This file lists the times of the coalescent events across all simulations. These times are given in units of generations starting at the onset of the expansion. 20 6.5 MRCA files (*.tmrca) This file lists the Time to the Most Recent Common Ancestor (TMRCA) across all sampled populations and for each sampled population separately. These times are given in units of generations starting at the onset of the expansion. 6.6 Tree files (*.trees) Two files with the “*.trees” extension can be generated (in case of one independent locus) listing all the simulated trees, with branch lengths expressed either i) in units of generations scaled by the population size (N), and therefore representing the true coalescent history of the sample of genes, or ii) in units of average number of substitutions per site, and therefore representing the realized mutational tree. These two files could be visualized with the software TREEVIEW (Page, 1996) 6.7 Distance file (*.txt) In the panel genetic simulation, it is possible to specify to generate a file with the geographic distances between the sampled populations along the river system. A second section of the file includes information on the precision of the assignment of the samples to a segment when the sampled populations are defined by coordinates. For each sample, the assigned segment is characterized by its ID and the coordinates followed by the precision (in meters) of the exact geographical coordinates of the sample population to the assigned segment. Distances in meters between sample populations: Pop_1 98031 334243 173099 Pop _2 Pop _3 Pop _2 Pop_3 Pop_4 240346 92926 331407 Name Pop _1 Pop _2 Pop _3 Pop _4 Segment 2692130 2683439 2683985 2695965 Longitude 7.63306 7.26636 7.37282 6.81172 Latitude 46.6814 47.1456 47.2783 46.5669 Precision [m] 388 400 346 116 21 7 Graphical interface This chapter describes the specifications of the graphical interface. It consists of 5 panels devoted to specific tasks, and of the main display of the river system: 7.1 Graphical display of the river system The graphical display consist of three parts: In the middle the river system is displayed using colour gradients for the visualization of the desired information. By clicking on a segment, the segment characteristics are displayed in the right panel. It is also possible to select a segment by its ID in the dropdown menu. In the left panel the colour gradient is displayed used for the main display of the river system. Slide bar The right panel consists of a vertical slide bar visualizing the time. The period displayed is in years before present (BP) and corresponds to the time period to simulate. The slid bar can be used to change the time of the displayed river system. Drainage This box displays the size of the current river system in numbers of segments and nodes. In the second line, the current geographical coordinates of the cursor are displayed if this one is over the river system. The actual time is displayed in three scales: in blue Time in generations starting at the onset of the expansion in green Time in years starting at the onset of the expansion in red Time in years before present (BP) 22 Active segment The coordinates correspond to the middle coordinates of the segment, specified in the segment file. Both nodes are characterized by the ID and as well by the coordinates. The upper node is the FNode and the lower node is the TNode in the node file. The length is displayed in meters. nb neighbour is the number of adjacent neighbouring segments. The carrying capacity is defined per segment. The 1st arrival informs on the time in generations of the first colonization of the segment. Display Several information can be graphically displayed Density: current population density. Migration: current number of immigrants. Occupation: current colonized range. Arrival Time: the time of the first colonization in generations starting at the onset of the expansion. Carrying capacity: The carrying capacity per segment. Coalescences: The number of coalescent events is graphically displayed (only available after a genetic simulation). (current means that the information is available through time, respectively that the information changes over time). 23 7.2 File & Image The first panel of AQUASPLATCHE contains general tasks. The left section contains functionalities dealing with the settings file, while the right section allows one to modify the graphical representation of the river system. 7.2.1 Setting file Most of the parameters which can be specified in the graphical interface are stored in a settings file (see chapter input files). It is thus possible to save the settings for a later use. All the settings can be set by the graphical interface. Experienced users may edit the settings file by hand with a text editor. The following buttons are available to deal with the settings file: Edit: This opens the current setting file in the default text editor. Be sure that you have saved the changes in the text editor before you reload the file. Load: This loads again the current setting file. Open…: Using this button you can replace the current setting file by another and load its content. Save: This saves the current settings to the settings file. Save as…: This allows to save the current settings to a settings file to be specified. Exit: This buttons exits the program AQUASPLATCHE. 7.2.2 Image These parameters allow one to change the appearance of the image displayed in the main panel. The graphical settings are stored between sessions in a file. These settings do not affect the simulation model. The following options are available: Save image…: This allows one to save the current river system as a bitmap (*.bmp) to a specific folder. Save legend…: This allows one to save the legend of the river system as a bitmap (*.bmp) to a specific folder. 24 Settings Zoom: This allows one to zoom on the image of the main panel. The scale is relative to the image size in percentage. Segment width: This is the displayed width of the segments. Refresh every … gen.: This is the refresh interval in generations for the images (river system and legend) during the simulation phase. Keep image ratio: If this option is selected the river system is scaled to fit fully the image frame. Colours Background: This is the background colour. Disabled: Colour for disabled segments if dynamic maps are used. Active: Colour of the selected segment. Sample: This is the colour of the segments containing the genetic samples. Empty: Colour for segments which are not colonized (value is zero). Min: This is the colour for segments with minimal values, but not zero. Max: This is the colour for segments with maximal values. Reset: This button resets the colour to the default colours. 25 7.3 Network transformation This panel allows the modification of the river system. The new river system has to be saved before it can be used in the simulations. The following options are available: Load drainage By pressing this button, one loads the river system specified in the setting file. Save drainage Saves the changes to the settings file. Save drainage as… Saves the modified river system to a specific location. 7.3.1 Visualization This part deals with possibilities to visualize certain aspects of the river system: “watersheds” (only upper node) That is a utility to find inconsistencies in the river system, such as loops. It graphically marks segments which are connected to each other by their upper node (FNode) and do not have an upper neighbouring segment, i.e a segment connected to them by its lower node (TNode). Usually it means that these two segments are connected across a watershed. There are two ways to display the sample and initial population locations. The two possibilities return the same result if the geographical coordinates of the population locations are well defined, i. e. the specified geographical coordinates are hitting a segment. If the coordinates do not hit a segment the two ways of visualization give an idea of the precision of the geographical coordinate definition: 1. Exact genetic sample locations (x) This function displays the sample and initial population locations by crosses at their exact geographical locations, but only if the input of the populations is defined by coordinates. 26 2. Corresponding genetic sample segments This function, in contrast to the previous one, marks the segments assigned to sample locations. Distances between sample populations This generates a file with the geographical distances between the sampled populations along the river system. A second section of the file includes information on the assignment of the samples to a segment when the sampled populations are defined by coordinates. For each sample the assigned segment is characterized by its ID and the coordinates followed by the precision (in meters) of the exact geographical coordinates of the sample population to the assigned segment. For further details see section 6.7. 7.3.2 Resizing AQUASPLATCHE involves functionalities to make changes to the river system: Removing network loops This allows one to remove inconsistencies in the river system such as loops. If a loop is found a segment at the watershed (see “watersheds” above) is deleted. Deleting networks without genetic samples This allows one to delete all the river systems that do not have genetic samples and therefore are not of interest for the simulation. Deleting upper most … segments This procedure allows one to simplify the river system by removing segments starting at the headwaters (upper most segments), until the entered number is reached or a segment contains a population. To the smallest drainage with … side segments This procedure simplifies the river system to the smallest river system still connecting initial and sample populations. Deleting active segment It is possible to activate a segment in the graphical input by clicking on it and to delete it using this function. 7.3.3 Segment transformation The following options are for the modification of the segments: 27 Create network of segment of … meters The input river system may consist of varying segment lengths. As segment size has a great influence on several demographic parameters such as the migration rate (Barton & Wilson, 1995). It is thus wise to use a fixed segment size for the simulation. Moreover as several segment characteristics are calculated per segment (e. g. carrying capacity). The function behind this button involves an algorithm to recreate the river system with a fixed segment size. Distance between two locations in the river systems are kept fixed. Therefore transforming the river system to small segment sizes increases the number of the segments and inversely for large segment sizes. This functionality is also implemented in the demographic simulation itself. It is important to note that by using this transformation, the segment identifications are changed and therefore the specification of populations by the segment identification is not possible anymore. Calculate segment lengths based on their geography It is possible to calculate the segment lengths based on geographical information of the nodes and the middle point of the segments. This information can usually also be extracted using a Geographical Information System (GIS). Calculate segment coordinates based on the nodes The visualization of a segment is characterized by the geographical information of its nodes and its middle point. Using three points to visualize a segment gives a better resolution compared to only the nodes, but the middle node is also the geographical location of its population. Similar to the previous function, this function allows one to calculate the middle point of a segment using the geographical information of its nodes. 28 7.4 Demographic simulation This panel manages the demographic simulation and its parameter. Be careful that the timescale of the simulation is in generation. It contains three sub panels: 7.4.1 Model Here the main parameters for the demographic simulations are found: Time Number of generations This is the number of generations to simulate during the demographic simulation. Generation time (years) This is the generation time (in years) of the investigated species. This parameter is not used in the simulation process itself. It is used to calculate the real time in years before present (BP). Start time (years BP) This is the real time of the onset of the expansion in years before present (BP). This parameter is not used in the simulation process itself. It is used to calculate the real time in years. Initial population This box deals with the initial population size if it exceeds the carrying capacity of the segment: File This is the relative path to the settings file for the file containing the initial populations. Allow density overflow If this checkbox is switched on and the size of the initial population exceeds the carrying capacity of the segment, the initial population is spread over neighbouring segments until all the individuals are placed in a segment. The overflow function fills a segment at carrying capacity before using neighbouring segments. If this checkbox is switched off, the size of the initial population is always the 29 size set in the initial density file, even if this size exceeds the carrying capacity (in this case the segment size is regulated downward by the logistic equation). Initial filling rate of K This number specifies the filling size of the initial populations. The initial filling size is the product of the initial filling rate and the carrying capacity. If the initial filling rate is 1 the initial filling size is equal to the carrying capacity. This parameter has only a meaning if the density overflow is allowed. For example if the carrying capacity is set to 1000 genes and the initial filling rate is 0.5, the initial population size of the deme is 500 genes. If the initial population is larger than these 500 genes, the remaining genes will be distributed among the neighbouring demes. Demography model In the drop down list box you can select a demographic model. Growth rate This is the net growth rate used in the logistic regulation. Carrying capacity This is the carrying capacity in numbers of genes (haploid individuals) per segment used in the regulation and migration phase. Migration rates mColonization This is the migration rate during colonization phase (when density is low) mOccupation This is the migration rate in occupied areas (when density is at carrying capacity) directional migration This is the probability of upstream migration compared to downstream migration. 30 7.4.2 Environment Dynamic environment over time If this option is selected the river system changes over time according to the specification, otherwise the river system is fixed and static. For each range change, a specific file has to be defined, but see section Dynamic map file specifications for more details. The dropdown menu allows one to visualize the available range changes. Network This panel contains the specification for the river system. Paths to the segment and the node file have to be specified. Segment length Definition of the segment length. If the value is zero then the original river system is used for the simulations. Otherwise the river system will be transformed prior to the demographic simulation to segments with the specified length. Important: if the segment length is different from zero the geographical specification of the populations has to be done by geographical coordinates. 7.4.3 Output It is possible to generate several graphical outputs (*.bmp) during the demographic simulation. First the time interval between outputs has to be defined. The following outputs are available, but see the section Output as well: 31 Population density The density is displayed graphically using a colour gradient for which it is important to specify the maximal density during the simulation. The maximal density has to be specified since at the start of a simulation the maximal densities are not known. Please be aware that the maximal density can exceed the carrying capacity due to stochasticity. To find the maximal density it is prudent to run the same simulation twice: once without generating outputs and in looking at the maximal density displayed behind the input box; then a second time in creating the outputs after having typed this maximal density into the input box. Number of migrants Graphically the number of emigrants is displayed using a colour gradation. To set the maximal number of emigrants, do the same as above. Occupation The current colonized area is displayed. 32 7.5 Genetic simulation This panel manages the genetic simulation and its parameter. It contains three sub panels: 7.5.1 Mutation model 7.5.1.1 Mutation model specification AQUASPLATCHE allows one to select between several types of molecular data. For more details see “Genetic data” section. The following parameters are used for all molecular data types: Mutation rate The mutation rate is specified as the mutation rate per independent locus, whereby a specified mutation rate for DNA includes the whole sequence. Number of unlinked versus number of linked loci The unlinked loci represent the number of fully independent loci, whereas it is assumed that there is no recombination between linked loci. For example a single DNA sequence has 1 unlinked locus and x linked loci, where x corresponds to the number of base pairs. On the other hand, x autosomal microsatellites correspond to x unlinked loci and 1 linked locus. Depending on the choice of the molecular data, several other parameters have to be set for the genetic simulation: Specific to microsatellite Range constrain This is the range limitation of the mutation and corresponds to the difference between the minimum and maximum number of repeats. Geometric distribution for GSM model The geometric distribution parameter specifies the length by which a new mutation differs from its ancestor: The higher the parameter, the bigger the mutation step. If the value is set to zero AQUASPLATCHE uses a pure stepwise mutation model (SSM). 33 Specific to DNA Transition rate Ratio of substitutions that are transitions. Gamma a Amount of heterogeneity in mutation rates along the sequence according to either a discrete or continuous gamma distribution. No. of rate categories Number of categories for DNA mutation variation. Specific to SNP NB: Mutation rate is not used as SNPs are observed mutations! Min freq within a sample This is the minimal frequency of the SNP minor allele to be reached within a sample. If this condition is not reached, then a new SNP is drawn until the minimum frequency is reached at least for one sample. Absolute min. freq This is the minimal frequency of SNPs within all samples. 7.5.1.2 Simulation Max. no of simulated generations This is the maximum number of generations after which the process stops if the genealogy has not reached the MRCA. No. of simulations Number of genetic simulations to be performed per demographic simulation. Divergence time in generations This setting is only valid for multiple initial populations. This is the divergence time of the initial populations. After the specified number of generations, the initial populations are merged in a single segment. 34 7.5.2 Output For the genetic simulation several outputs are available, but see section Output as well: Genetic files ARLEQUIN If selected, an ARLEQUIN project file can be generated (see section ARLEQUIN files). For this output, one can choose between haplotypic and genotypic outputs. The genotypic output merges two haplotypic individuals to a single genotypic individual. Coalescence times If selected, a file containing the coalescence times (in generations after the onset of the expansion) is generated. Tree files If selected, tree files are generated which can be visualized by the software TREEVIEW (Page, 1996). MRCA times If selected, a file with the times to the Most Recent Common Ancestors (MRCA) is generated. Images Coalescences bitmap If selected, for each independent genetic simulation a coalescences output is generated. Generate bitmap every … generation During the simulation, the river system can be saved as a bitmap for every specified number of generations. 35 7.6 Times Series This panel allows one to explore the demographic database that has been generated during the simulation. The information is available for each segment, which can be either selected by clicking on the graphical representation of the segments or by selecting the segment id, using the drop down menu at the left. Several options are available to handle the graph: Save… The graph can be saved as a bitmap (*.bmp) to any location on the hard disk. Copy The graph is copied to the clipboard for further use. 3Dimensional By selecting this option the current graph will be displayed in three dimensions. Using the 3-D properties Zoom, Rotation, and Elevation the graph can be rotated for best visualization. Static y-axis By default the axes of the graph are scaled automatically for best display of the current information. If the option is selected, the same scaling is used for all the segments allowing a better comparison between segments. In several panels the following information is displayed: 36 7.6.1 Migration This panel shows the number of immigrants obtained from the neighbouring segment. The legend shows the segment id of the neighbour and as well as the kind of connection between the two segments in relation to its altitude: FT: The current segment is geographically located below (downstream) the neighbouring segment. Water is flowing from the current to the neighbouring segment. TF: The current segment is geographically located above (upstream) the neighbouring segment. Water is flowing from the neighbouring to the current segment. FF Both segments are geographically at the same altitude. Theoretically this means that the water arriving at the common node flows into both segments. If there is no upper node the two segments are building a connection across a watershed. TT: Both segments are geographically at the same altitude. Theoretically this means that the water of both segments is flowing out at the common node, normally into a lower segment. This is commonly the case for river branching. 7.6.2 Demography This panel shows the population density over time of the selected segment. 37 7.6.3 Cumulative density This is the total population size across all segments. As the computation of the cumulative density is time consuming, one has to start the computation by clicking the button Compute. 38 8 Acknowledgments I am grateful to Laurent Excoffier, Mathias Currat, and Nicolas Ray for sharing ideas and piece of code with me. This work was supported by a Swiss NSF grant no. 3100A0-100800 to Laurent Excoffier. 9 References Barton NH, Wilson I (1995) Genealogies and Geography. Philosophical Transactions of the Royal Society of London Series B-Biological Sciences 349, 49-59. Currat M, Ray N, Excoffier L (2004) SPLATCHE: a program to simulate genetic diversity taking into account environmental heterogeneity. Mol Ecol Notes 4, 139-142. Donnelly P, Tavaré S (1995) Coalescent and genealogical structure under neutrality. Annual Review of Genetics 29, 401-421. Estoup A, Jarne P, Cornuet JM (2002) Homoplasy and mutation model at microsatellite loci and their consequences for population genetics analysis. Molecular Ecology 11, 1591-1604. Ewens WJ (1990) Population genetics thoery - the past and the future. In: Mathematical ans Statistical Developments of Evolutionary Theory (ed. Lessard S), pp. 177-227. Kluver Academic Puplishers. Excoffier L, Laval G, Schneider S (2005) ARLEQUIN (version 3.0): An integrated software package for population genetics data analysis. Evolutionary Bioinformatics Online 1, 47-50. Excoffier L, Novembre J, Schneider S (2000) SIMCOAL: A general coalescent program for the simulation of molecular data in interconnected populations with arbitrary demography. The Journal of Heredity 91, 506-510. Hudson RR (1990) Gene genealogies and the coalescent process. In: Oxford Surv. Evol. Biol., pp. 144. Oxford University Press, Oxford. Jin L, Nei M (1990) Limitations of the evolutionary parsimony method of phylogenetic analysis. Molecular Biology and Evolution 7, 82-102. Jukes T, Cantor C (1969) Evolution of protein molecules. In: Mamalian Protein Metabolism (ed. Munro HN), pp. 21-132. Academic press, New York. Kimura M (1980) A simple method for estimating evolutionary rate of base substitution through comparative studies of nucleotide sequences. Journal of Molecular Evolution 16, 111-120. Kingman JFC (1982a) The coalescent. Stochastic Processes and their Applications 13, 235-248. Kingman JFC (1982b) On the Genealogy of Large Populations. Advances in Applied Probability, 2743. 39 Page RDM (1996) TREEVIEW: An application to display phylogenetic trees on personal computers. Comput. Appl. Biosci. 12, 357-358. Ray N, Currat M, Excoffier L (2003) Intra-deme molecular diversity in spatially expanding populations. Mol Biol Evol 20, 76-86. Zhivotovsky LA, Feldman MW, Grishechkin SA (1997) Biased mutations and microsatellite variation. Molecular Biology and Evolution 14, 926-933.