1
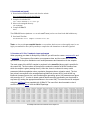
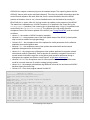
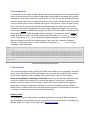
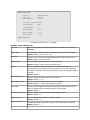
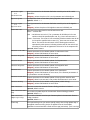
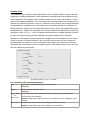
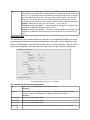
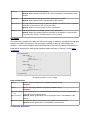
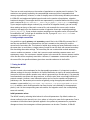
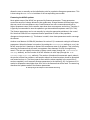
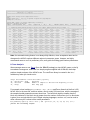
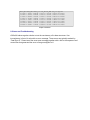
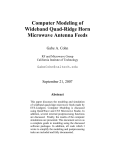
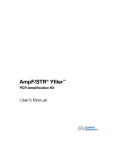
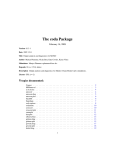
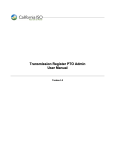
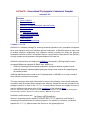
G-PhoCS – Generalized Phylogenetic Coalescent Sampler version 1.2.3 Contents 1. About G-PhoCS 2. Download and Install 3. Overview of G-PhoCS analysis: input and output 4. The sequence file 5. The control file 5.1 Data size restrictions 6. Using multiple control files 7. Tuning the MCMC 8. Trace Analysis 9. Errors and troubleshooting 1. About G-PhoCS G-PhoCS is a software package for inferring ancestral population sizes, population divergence times, and migration rates from individual genome sequences. G-PhoCS accepts as input a set of multiple sequence alignments from separate neutrally evolving loci along the genome. Parameter inference is done in a Bayesian manner, using a Markov Chain Monte Carlo (MCMC) to jointly sample model parameters and genealogies at the input loci. G-PhoCS is derived from and inspired by MCMCcoal developed by Ziheng Yang.Two main conceptual differences separate G-PhoCS from MCMCcoal : • G-PhoCS models gene flow between populations along user-defined migration bands. • G-PhoCS analyzes unphased diploid genotypes using a novel method for integrating over all possible phases. Additional adjustments were made to the C implementation of MCMCcoal in order to make it more efficient and reduce running time. This user manual provides basic information for users of the software. Users should make sure to carefully read the manual before trying out the software. Sample files are also provided in the package. However, in order to use G-PhoCS, in a truly effective manner, we suggest for users to read the additional information given in the supplement of the following paper: Gronau I, Hubisz MJ, Gulko B, Danko CG, Siepel A. Bayesian inference of ancient human demography from individual genome sequences. Nature Genetics 43 1031–1034. 2011. Particularly useful sections are Section 1 (preparing data for analysis), section 4 (the G-PhoCS algorithm), and Section 5 (containing some practical tips for running analyses). For questions, comments, and feature requests for G-PhoCS, please contact Ilan Gronau at: [email protected] Good luck, Ilan. 2. Download and Install 1. Download the G-PhoCS source code from the website http://compgen.bscb.cornell.edu/GPhoCS 2. Unzip the downloaded file tar xvzf GPhoCS1.2.3.tar.gz 3. Move to the unzipped directory cd G-PhoCS/ 4. Compile G-PhoCS make The G-PhoCS binaries (GPhoCS-1-2-3 and readTrace) can be now found in the bin/ subdirectory. 5. Post-Install Test Run bin/GPhoCS123 samplecontrolfile.ctl Note: we also provide pre-compiled binaries on our website, but those are not thoroughly tested, so we highly recommend for users (when possible) to compile the code themselves via the above pipeline. 3. Overview of G-PhoCS analysis: input and output When preparing your data for analysis by G-PhoCS, you will need to create a sequence file and a control file. The sequence file contains your sequence data, and the control file contains the specification for the prior distribution over model parameters and instructions for the sampler. The main output of the MCMC sampler is produced in the trace file (whose path is specified in the control file). The first column in the trace file contains the number of MCMC iteration from which the sample is given (starting from 0). After that, there is a column for every model parameter (effective population sizes, population divergence times, migration rates). The last two columns correspond to the average data log likelihood (across all loci), and the full log likelihood (summed across loci, and considering the genealogy priors). All parameters are given with accuracy of 10-5. In order to obtain optimal relative accuracy, parameters can be printed in any factor (by setting the appropriate attributes in the control file). The trace file can be analyzed using the readTrace binary supplied with G-PhoCS. The trace file is also formatted so that it could be viewed by Tracer from the BEAST package. Sample 0 1 2 3 4 5 6 7 8 9 10 theta_A 1.06147 1.09477 1.03987 0.99947 1.04238 1.08084 1.12640 1.08826 1.08826 1.03226 1.07730 theta_B 1.02213 0.96538 0.96538 1.00241 1.02384 1.07690 1.11818 1.06609 1.03309 1.08487 1.14046 theta_C 0.85924 0.85924 0.90605 0.90897 0.95178 0.95178 0.95178 0.95666 0.92669 0.99071 0.95068 theta_D 1.09034 1.12269 1.12269 1.16359 1.16597 1.20241 1.24548 1.31251 1.31251 1.37284 1.45034 theta_AB 0.99918 0.99918 0.99918 1.00241 0.97595 0.94602 0.91416 0.95618 0.95618 0.92455 0.95010 theta_ABC 0.91122 0.93931 0.93931 1.00738 1.03361 1.03361 1.03361 1.03891 1.06409 1.06409 1.06409 theta_root tau_AB 1.11978 0.04961 1.11978 0.04961 1.11978 0.04961 1.12339 0.04977 1.12569 0.04987 1.12569 0.05291 1.12569 0.05291 1.18004 0.05318 1.22692 0.05318 1.26614 0.05318 1.26614 0.05318 tau_ABC 0.09858 0.09858 0.09797 0.09829 0.09849 0.09849 0.09849 0.09899 0.09899 0.09899 0.09899 tau_root 0.54487 0.54487 0.54487 0.57991 0.58110 0.58110 0.58110 0.60630 0.60630 0.60630 0.60630 An example trace file for ten iterations of the sample run m_D>B 0.00000 20.24997 19.83021 19.18764 19.44754 19.27217 19.67596 19.88259 19.50578 19.16283 18.88338 Dataldln Fullldln 1345.658845 1407136.676 1343.305172 1405052.121 1342.676200 1404146.180 1342.502793 1403567.133 1342.036533 1403214.705 1342.093022 1403128.813 1341.907213 1403025.000 1342.166514 1402881.053 1342.120212 1402792.119 1342.138429 1402730.678 1342.148108 1402704.529 G-PhoCS also outputs a summary log onto the standard output. The output log starts with the G-PhoCS banner (with version and date indicated). Then there is possible information about the control file and sequence file used. After that, there is some information about the MCMC (number of iterations, burn-in, etc.) A more detailed version can be obtained by running GPhoCS with the -v option. After this, the log contains an update on the progress of the MCMC. The status line is updated every X MCMC iterations (X is specified in the control file by the iterationsperlog attribute), and a new log line is generated every Y logs (Y is specified in the control file by the logsperline attribute). The columns of the log mostly describe acceptance rates of the various updates of the MCMC (see Tuning the MCMC) and are ordered as follows: • column 1 – the number of MCMC iterations (samples) • columns 2–4 – the acceptance rate of the local update steps of the MCMC (a local update step is one that modifies a single genealogy). • Columns 5–6 – the acceptance rate of the updates for model parameters for the effective population sizes and migration rates • columns 7–X – the acceptance rates of the updates associated with each ancestral population divergence time in the model. • column X+1 – the rejection rate of divergence time updates attributed to migration-related rubber-band conflicts (RbberBnd). Such a rejection is caused by a migration event that is moved outside its feasible range due to the rubber-band operation performed during a divergence time update (see Section 4 and Figure E of the paper supplement). • columns X+2–X+3 the acceptance rates for locus-specific mutation rate (if variable rates model is not used, these are 0), and the scaling (mixing) update. • column X+4 – the average recorded data log likelihood across all loci and across all MCMC iterations during the time of log. • Column X+5 – time since program started HH:MM:SS ******************************************************************** * GPhocs ver 1.2.3 Sept 2015 * ******************************************************************** Reading control settings from file samplecontrolfile.ctl... Done. Reading sequence data... 1000 loci, as specified in sequence file seqssample.txt. Reading loci (.=100 loci): .......... Starting MCMC: 0 burnin, 5000 running, sampled every 0 iteration(s). There are 11 parameters in the model. Samples CoalTimes MigTimes SPRs Thetas MigRates TAU_ 4 TAU_ 5 TAU_ 6 RbberBnd MutRates Mixing | DATAlnld | TIME 500 64.5% 96.2% 69.1% 63.9% 98.0% 23.5% 23.5% 2.0% 0.0% 0.0% 96.1% |1348.092958| 0:31 1000 64.1% 97.1% 69.9% 67.2% 94.1% 3.9% 3.9% 11.8% 0.7% 0.0% 96.1% |1348.113581| 1:01 1500 64.2% 98.2% 69.8% 68.1% 98.0% 7.8% 0.0% 11.8% 0.0% 0.0% 94.1% |1348.206668| 1:33 2000 65.2% 97.4% 69.5% 67.5% 98.0% 0.0% 0.0% 7.8% 0.0% 0.0% 96.1% |1347.278286| 2:06 2500 64.0% 97.6% 69.7% 67.2% 90.2% 7.8% 3.9% 17.6% 0.0% 0.0% 92.2% |1347.845674| 2:35 3000 64.5% 94.5% 69.4% 63.9% 90.2% 19.6% 11.8% 11.8% 0.0% 0.0% 94.1% |1347.915382| 3:04 3500 64.2% 97.4% 69.6% 70.6% 96.1% 21.6% 25.5% 7.8% 0.0% 0.0% 92.2% |1348.376035| 3:33 4000 64.5% 98.7% 69.8% 68.1% 94.1% 49.0% 47.1% 3.9% 0.0% 0.0% 96.1% |1347.770289| 4:03 4500 64.0% 98.0% 69.7% 65.3% 94.1% 3.9% 3.9% 15.7% 0.0% 0.0% 94.1% |1348.385142| 4:33 5000 64.6% 98.3% 69.4% 68.1% 98.0% 2.0% 5.9% 9.8% 0.0% 0.0% 96.1% |1347.663113| 5:02 MCMC finished. Time used: 5:02 An example log for the sample run 4. The sequence file The sequence file is a simple text file indicating the sequence alignments to be analyzed. Blank lines are ignored in this file, and different fields within a line should be separated by any type of whitespace. The first line contains the number of loci in the file. If L loci are indicated at the file header, but more than L loci are specified in the file, only the first L loci will be read. If less than L loci are present, then an error message will be given. After this line, there is a block for each locus. The first line in the block has three fields indicating the locus name (no more than 50 characters), the number of sequences N to read, and the sequence length K. The locus block then contains exactly N additional non-empty lines. Each line has two fields: a sample name for which this sequence is to be associated, and the sequence. The sequence must be exactly of length K, and must contain only IUPAC characters for DNA bases: A,C,G,T,R,Y,S,W,K,M, and N. Characters R,Y,S,W,K,M indicate heterozygous genotypes, and can only be used when the sample is specified as a diploid sample in the control file. Character N indicates missing (or masked) genotype. No other character is allowed (e.g., U, , ?, etc.), and the sequence is case-insensitive. 1000 locus1 6 1000 one CCAGAGAGCaCGTAGTTCCGGTAATGGTTGTCCACATGGTAACGGACTCCGACGGAAGAGACCATCATAAATTAGATGCATAGGGCATGAGCCCATCGAGAAGAGGATTGAACTCCCACCTCTCGGGGGCTTCCT... two CCAGAGAGCTCGTAGTTCCGGTAATGGTTGTCCACATGGTAACGGACTCCGACGGAAGAGACCATCATAAATTAGATGCATAGGGCATGAGCCCATCGAGAAGAGGATTGAACTCCCACCTCTCGGGGGCTTCCT... three CCAGAGAGCTCGTAGTTCCGGTAATGGTTGTCCACATGGTAACGGACTCCGACGGAAGAGACCATCATAAATTAGATGCATAGGGCATGAGCCCATCGAGAAGAGGATTGAACTCCCACCTCTCGGGGGCTTCCT... four CCAGAGAGCTCGTAGTTCCGGTAATGGTTGTCCACATGGTAACGGACTCCGACGGAAGAGACCATCATAAATTAGATGCATAGGGCATGAGCCCATCGAGAAGAGGATTGAACTCCCACCTCTCGGGGGCTTCCT... five CCAGAGAGCTCGTAGTTCCGGTAATGGTTGTCCACATGGTAACGGACTCCGACGGAAGAGACCATCATAAATTAGATGCATAGGGCATGAGCCCATCGAGAAGAGGATTGAACTCCCACCTCTCGGGGGCTTCCT... six CCAGAGAGCTCGTAGTTCCGGTAATGGTTGTCCACATGGTAACGGACTCCGACGGAAGAGACCATCATAAATTAGATGCATAGGGCATGAGCCCATCGAGAAGAGGATTGAACTCCCACCTCTCGGGGGCTTCCT... locus2 6 1000 ... An example header of the sample sequence file 5. The control file The control file allows the user to specify to G-PhoCS the model to use in its analysis, as well as other controls that affect the MCMC and output format. A control file typically has four modules (in this order): GENERALINFO, CURRENTPOPS, ANCESTRALPOPS, and MIGBANDS. Some useful guidelines in building a control file: Each line in the file either defines the start or end of a module (or sub-module), or sets a certain attribute. In that case, it contains the attribute name and a value (or list of values, in some cases). Some attributes are obligatory, while others are optional (with default settings). The order of the different attributes within a module does not matter. Empty lines and white spaces are ignored, and any part of a line after a '#' character is also ignored (can be used for documentation). GENERALINFO The GENERALINFO module contains essentials arguments for running G-PhoCS. Below, we give a detailed list of all attributes one can set in this module. More information on setting up an effective MCMC run is given in the section titled Tuning the MCMC. GENERALINFOSTART seqfile seqssample.txt tracefile mcmc.out mcmciterations 1000000 # automatic finetune finder findfinetunes TRUE tauthetaalpha 1.0 tauthetabeta 10000.0 migratealpha 0.002 migratebeta 0.00001 GENERALINFOEND An example of a basic GENERALINFO module GENERALINFO attribute list: seqfile Name of file containing sequence alignments for analysis (see next section) Obligatory tracefile Name of file onto which trace will be written (see section on trace analysis) Optional, default: “mcmctrace.out” numloci Number of Loci to read from sequence alignment file. Will read first N loci. Optional, default: read all loci in file randomseed Seed for random number generator used in G-PhoCS Optional, default: use time stamp to generate seed burnin Number of MCMC iterations performed before tracing to output. It is recommended to run the MCMC with a pre-set burn-in of 0, and to apply the actual burn-in only when post-processing the trace file (by ignoring the top part of the file). Optional, default: 0 mcmciterations Number of MCMC iterations performed after burn-in Optional, default: 10,000 mcmcsampleskip Number of iterations between each two traced samples Optional, default: 0 (means each sample is traced) startmig Iteration at which migration starts being sampled (it is often useful to let the MCMC converge before introducing migration into the model Optional, default: 0 iterationsperlog Number of MCMC iterations between each logging to stdout Optional, default: 100 logsperline Number of log updates to write in one line to stdout Optional, default: 100 tauthetaprint A multiplicative factor to use when printing and parameters to trace file Optional, default: 1.0 tauthetaalpha and tauthetabeta and parameter for the Gamma distribution used for priors of all and parameters Obligatory, unless the priors of all and parameter are individually set migrateprint A multiplicative factor to use when printing migration rates to trace file Optional, default: 1.0 migratealpha and migratebeta and parameter for the Gamma distribution used for priors of all migration rates Obligatory, unless the priors of all migration rates are individually set locusmutrate Determines the model used for rate variation across loci. CONST – constant rate VAR – variable rate across loci. The parameter for Dirichlet prior for rate variation should be specified after VAR. E.g., locus-mut-rate VAR 1.0 FIXED – fixed rates. The name of a file containing relative mutation rates for all loci should be specified after FIXED. E.g., locus-mut-rate FIXED ratefile.txt. The rate file should contain a list of floating point numbers, separated by white spaces, indicating relative rates for the various loci, according to the order of appearance of these loci in the sequence file. Optional, default: CONST finetunecoaltime Finetune parameter for the MCMC update of coalescence times Obligatory, unless find-finetunes is set to TRUE. finetunemigtime Finetune parameter for the MCMC update of migration event times Obligatory, unless find-finetunes is set to TRUE. finetunetheta Finetune parameter for the MCMC update of all parameters Obligatory, unless find-finetunes is set to TRUE. finetunemigrate Finetune parameter for the MCMC update of all migration rates Obligatory, unless find-finetunes is set to TRUE. finetunetau Finetune parameter for the MCMC update of all parameters Obligatory, unless find-finetunes is set to TRUE, or the finetune parameters of all parameters are set individually finetunelocusrate Finetune parameter for the MCMC update of locus-specific mutation rates Obligatory when locus-mut-rate is VAR, unless find-finetunes is set to TRUE. finetunemixing Finetune parameter for the MCMC scaling update (called 'mixing') Obligatory, unless find-finetunes is set to TRUE. findfinetunes When set to TRUE the automatic finetune finding procedure is invoked Optional, default: FALSE findfinetunesnum The number of update steps for the automatic finetune finding procedure step Optional, default: 100 findfinetunes samplesperstep The number of MCMC iterations per finetune update in the automatic finetune finding procedure Optional, default: 100 nomixing If this optional flag is set (no need to specify value), then mixing update step is not applied. Note that mixing is also not applied if one of the sampled populations is associated with a fixed non-zero age (see below). (v1.2.3 and up) CURRENTPOPS The CURRENTPOPS module contains specification of the samples used for analysis, and their assignment to different populations. Other parameters associated with these populations may also be specified. The CURRENTPOPS module consists of a list of POP sub-modules – one for each of the sampled populations. The central part of the POP sub-module is the samples line. A samples line starts with the token 'samples', and then has two fields for each sample analyzed in that population: a sample name, and a character h/d indicating whether it is a haploid or a diploid sequence. Sample name should be identical to the one used in the sequence file (same capitalization too). Sequences associated with a sample indicated as haploid (h) can have only genotypes of type A,C,G,T, and N. Sequences associated with a sample indicated as diploid (d) will be analyzed using the phasing integration technique implemented in G-PhoCS. Sequences in the sequence file associated with samples that are not mentioned in the control file will be ignored. A sample indicated in the control file does not have to have a sequence associated with it at every locus, but is expected to have at least one sequence in one locus associated with it (otherwise, an error message is given). Other attributes that can be set in the POP sub-module are listed below. CURRENTPOPSSTART POPSTART name samples POPEND A one d POPSTART name samples POPEND B two d POPSTART name samples POPEND C three d CURRENTPOPSEND An example of a basic CURRENTPOPS module POP attribute list (for sampled population): name Name of the sampled population (50 characters max) Obligatory samples Sample list (see description above) Obligatory thetaalpha and thetabeta and parameter for the Gamma distribution used for prior of the parameter associated with the population Optional, default: global values set for all and parameters in the GENERALINFO module thetaprint A multiplicative factor to use when printing parameter to trace file Optional, default: global value in the GENERALINFO module Sampleage Specify age for all samples in the populations. To be used for ancient DNA samples. This attribute must be given with a number specifying a starting age for the sampler and a flag ('e' or 'f') specifying whether the sampler should keep the age fixed (f) or estimate it (e). The sample age will appear in the trace in both cases, unless it is set to a fixed value of 0.0. If one of the current pops is given a positive fixed sample age, then the mixing update step is disabled in the sampler (because this step scales all parameters). Optional, default: sample age is set to 0 and fixed. (v1.2.3 and up) Example1: sample age 0.00045 f - the sampler will set the ages of all samples in the population to 0.00045 and will not change this value. Example 2: sample age 0.00032 e - the sampler will set the ages of all samples in the population to 0.00032 and will treat the age as a free parameter to be estimated from data. ANCESTRALPOPS The ANCESTRALPOPS module specifies the structure of the population phylogeny, as well as parameters associated with the ancestral populations in the model. Like the CURRENTPOPS module, the ANCESTRALPOPS module consists of a list of POP sub-modules – one for each of the ancestral populations. Attributes that can be set in the POP sub-module are listed below. ANCESTRALPOPSSTART POPSTART name children tauinitial taubeta finetunetau POPEND AB A B 0.000005 20000.0 0.0000008 POPSTART name children tauinitial taubeta finetunetau POPEND ABC AB C 0.00001 20000.0 0.0000008 ANCESTRALPOPSEND An example of a basic ANCESTRALPOPS module POP attribute list (for ancestral population): name Name of the ancestral population (50 characters max) Obligatory children Names of exactly two daughter populations. The populations should be specified 'bottom-up', such that both children are always given before the parent. Obligatory thetaalpha See current pop specification thetabeta See current pop specification thetaprint See current pop specification taualpha and and parameter for the Gamma distribution used for prior of the parameter taubeta associated with the ancestral population Optional, default: global values set for all and parameters in the GENERALINFO module tauprint A multiplicative factor to use when printing parameter to trace file Optional, default: global value in the GENERALINFO module tauinitial An initial value around which to start the MCMC; the initial value is sampled uniformly in the interval [0.8,1.2] X tau-initial Optional, default: the prior mean for this parameter finetunetau Finetune parameter for the MCMC update of the parameter Optional, default: the global finetune specified in the GENERALINFO module, or dynamically chosen, if find-finetunes is set to TRUE. MIGBANDS The MIGBANDS module is the only one that can be empty, or missing. It specifies the migration bands to be used in the analysis. The MIGBANDS module consists of a list of BAND submodules – one for each migration band. Attributes that can be set in the BAND sub-module are listed below. Some tips for working with migration bands are given in Section 5 of the paper supplement. MIGBANDSSTART BANDSTART source C target B migrateprint 0.1 BANDEND BANDSTART source AB target C migrateprint 0.1 BANDEND MIGBANDSEND An example of a basic MIGBANDS module BAND attribute list: source Name of the source population of migration (forward in time) Obligatory target Name of the target population of migration (forward in time) Obligatory migratealpha and parameter for the Gamma distribution used for prior of the rate parameter and associated with the migration band migratebeta Optional, default: global values set for all migration rates in the GENERALINFO module migrateprint A multiplicative factor to use when printing migration rates to trace file Optional, default: global value in the GENERALINFO module 5.1 Data size restrictions There are no strict restrictions on the number of populations or samples used in analysis. The restrictions are typically implied by the computational resources (time of computation and memory requirements). However, in order to simplify some of the memory allocation procedures in G-PhoCS, we implemented global upper bounds on the number of populations, migration bands and samples. These upper bounds are represented by constants defined at the top of the patch.c source file (#define NSPECIES 20, #define MAX_MIG_BANDS 10, #define NS 200 respectively). If your analysis requires larger numbers (say, more than 10 migration bands), you can modify these settings at the top of the patch.c source file, and recompile the source code. Another restriction we apply is for the maximum number of migration events per sampled genealogy (#define MAX_MIGS 10). If your analysis requires sampling more migration events, this bound can be modified as well. You will get an indication for this, if you get a “Fatal Error 0012” error message in the middle of your run. 6. Using multiple control files It is possible to specify primary and secondary control files in the G-PhoCS command line. If two files are specified in the command line, the first is treated as the primary file, and the second as the secondary file. This feature is helpful when setting up several alternative runs on the same data. In such cases, a single primary control file can be used, with several secondary files describing alternative settings. The secondary file can contain either module GENERAL INFO or module MIGBANDS, or both, but it cannot contain modules CURRENTPOPS and ANCESTRALPOPS. If a MIGBANDS module is given in the second file, the MIGBANDS module of the first file will be completely overridden. However, if a GENERALINFO module is given in the second file, the specific attributes given there override values set in the first file. 7. Tuning the MCMC Model priors In order to obtain robust estimates for the demographic parameters, it is important to explore different settings for the prior distribution. A Gamma distribution is used for all model parameters (except for the locus-specific mutation rate, which is governed by a Dirichlet prior). It is generally recommended to use priors with large variance, so that the prior does not strongly influence the posterior sample. However, more informative priors can be used to expedite convergence of preliminary runs. Parameters priors can be set globally, using the appropriate attributes in the GENERALINFO module (migratealpha, migratebeta, tauthetaalpha and tautheta beta). In addition, each model parameter can have its prior set individually in the appropriate place ( and in the corresponding POP sub-module, and migration rate in the corresponding BAND sub-module). Initial parameter values The MCMC starts by selecting initial values for all model parameters. By default, values are chosen uniformly in the interval [0.8,1.2]xm, where m is the prior mean for the parameter. Due to constraints of the rubber-band operation applied in the updates of parameters for population divergence times, the convergence of these parameters can be slow. Therefore, G-PhoCS allows the user to manually set the initialization point for population divergence parameters. This is done using the tauinitial attribute of the corresponding POP module. Finetuning the MCMC updates Most update steps of the MCMC are governed by finetune parameters. These parameters control the amount of change allowed in that update step. A large finetune will allow large steps, that may result in low acceptance rates. Small finetunes are more conservative and lead to higher acceptance rates, but the smaller steps slow down convergence and mixing. Therefore, it is typically recommended to tune the updates to get intermediate acceptance rates (20–70%). The finetune parameters can be set manually by using the appropriate attributes in the control file. Note that G-PhoCS has a separate finetune parameter for each of the population divergence time parameters (). This feature is useful, since these parameters tend to converge the slowest. Another novel feature of G-PhoCS (introduced in version 1.2) is automatic setting for all finetune parameters. When this feature is turned on (by setting the findfinetunes attribute to TRUE), the MCMC uses the first X iterations to finetune the acceptance rates of all updates. This is done by searching for finetunes that will result in acceptance rates between 30–40%, through binary search. The user can specify the number of binary search steps (through the findfinetunes numstep attribute), and the number of MCMC iterations in each step (through the find finetunessamplesperstep attribute). The number of iterations this automatic search takes is the product of these two numbers, and samples taken from these iterations should be discarded and treated as burn-in. The binary search starts with the values supplied in the control file (if such are supplied), and it assumes finetune parameters in the interval (0,10]. If a finetune of 10 results in acceptance rates higher than 40%, this is the finetune that will be used. The status log describes the updates made to the finetune parameters. An example log for the sample run with automatic finetuning ******************************************************************** * GPhocs ver 1.2.3 Sept 2015 * ******************************************************************** Reading control settings from file samplecontrolfile.ctl... Done. Reading sequence data... 1000 loci, as specified in sequence file seqssample.txt. Reading loci (.=100 loci): .......... Starting MCMC: 0 burnin, 5000 running, sampled every 0 iteration(s). There are 11 parameters in the model. Samples CoalTimes MigTimes SPRs Thetas MigRates TAU_ 4 TAU_ 5 TAU_ 6 RbberBnd MutRates Mixing | DATAlnld | TIME Dynamically finding finetune settings for the first 10000 samples, updating finetunes every 100 samples 100 64.8% 98.5% 72.6% 63.9% 96.0% 19.8% 15.8% 28.7% 0.3% 0.0% 66.3% |1348.755834| 0:09 5.0050000 5.1500000 5.0200000 5.0100000 0.5000000 0.0000004 0.0000004 0.0000014 0.5000000 5.0015000 200 64.9% 98.8% 70.6% 0.3% 40.6% 24.8% 19.8% 52.5% 0.0% 0.0% 0.0% |1348.927122| 0:17 7.5025000 7.5750000 2.5300000 7.5050000 0.2500000 0.0000002 0.0000002 0.0000021 0.2500000 2.5022500 300 64.7% 100.0% 70.5% 0.4% 35.6% 39.6% 34.7% 29.7% 0.0% 0.0% 0.0% |1348.894125| 0:24 8.7512500 8.7875000 1.2850000 7.5050000 0.1250000 0.0000002 0.0000002 0.0000018 0.1250000 1.2526250 400 64.8% 100.0% 70.6% 1.0% 45.5% 52.5% 38.6% 38.6% 0.0% 0.0% 0.0% |1349.106040| 0:32 9.3756250 9.3937500 0.6625000 8.7525000 0.0625000 0.0000003 0.0000002 0.0000018 0.0625000 0.6278125 500 64.2% 100.0% 70.7% 6.2% 42.6% 16.8% 19.8% 35.6% 0.0% 0.0% 0.0% |1348.886927| 0:39 9.6878125 9.6968750 0.3512500 9.3762500 0.0312500 0.0000002 0.0000001 0.0000018 0.0312500 0.3154062 600 64.3% 0.0% 70.7% 15.1% 45.5% 18.8% 30.7% 42.6% 0.0% 0.0% 1.0% |1348.892750| 0:46 9.8439062 9.5453125 0.1956250 9.6881250 0.0156250 0.0000002 0.0000001 0.0000020 0.0156250 0.1592031 700 64.2% 100.0% 70.5% 29.6% 32.7% 21.8% 39.6% 34.7% 0.0% 0.0% 3.0% |1348.918140| 0:54 9.9219531 9.6210938 0.1178125 9.6881250 0.0078125 0.0000001 0.0000001 0.0000020 0.0078125 0.0811016 800 64.7% 100.0% 70.5% 39.2% 42.6% 58.4% 58.4% 18.8% 0.0% 0.0% 19.8% |1348.625812| 1:01 9.9609766 9.6589844 0.1178125 9.8440625 0.0039062 0.0000002 0.0000001 0.0000019 0.0039062 0.0420508 900 64.7% 100.0% 70.5% 38.6% 39.6% 51.5% 70.3% 26.7% 0.0% 0.0% 55.4% |1348.714501| 1:09 9.9804883 9.6779297 0.1178125 9.8440625 0.0019531 0.0000003 0.0000003 0.0000014 0.0019531 0.0615762 1000 64.6% 100.0% 70.3% 40.9% 30.7% 57.4% 61.4% 43.6% 0.0% 0.0% 29.7% |1349.013078| 1:16 9.9902441 9.6874023 0.1567187 9.8440625 0.0009766 0.0000005 0.0000003 0.0000016 0.0009766 0.0518135 Note: the automatic tuning feature is not always fully effective, since acceptance rates tend to change as the MCMC explores different regions in parameter space. However, we highly recommend users to use it in preliminary runs, as a guide for finding good finetune parameters. 8. Trace Analysis We encourage users to use Tracer (from the BEAST package) to view MCMC traces on the fly to evaluate convergence. readTrace is a simple program supplied with G-PhoCS, that helps perform simple analyses of the MCMC trace. The readTrace binary is created in the bin/ subdirectory when you invoke make. Usage: bin/readTrace <tracefilename> [options] b, blocksize SIZE Blocksize d, discard NUMBER Number of samples to discard from beginning of file h, help This help page For example, when invoking bin/readTrace b500 d1000, readTrace discards of the first 1,000 MCMC lines in the trace file, and then writes a line for every 500 trace lines, with the average of the sampled model parameters across these lines. The last block might be smaller than the block size indicated. If the block size is greater than the number of trace lines (or if no block size is given), then a single block is used. Simple scripting languages, such as awk, can be used to show a summary for a subset of the model parameters. bin/readTrace mcmc.log d1000 b500 | awk '{print $5, $6, $7, $8, $9, $10, $11 }' yields the following output: theta_AB theta_ABC theta_root tau_AB tau_ABC tau_root m_D>B 2.100942 3.158390 4.998728 0.043702 0.056219 0.835663 22.687913 1.632652 3.062018 4.914996 0.055938 0.058402 0.847974 11.878063 0.383683 2.689918 5.255840 0.054393 0.054838 0.699094 15.498366 0.329153 2.727465 5.228274 0.057620 0.058265 0.700874 16.517091 0.402760 2.738567 5.226142 0.057706 0.058898 0.748822 19.034865 0.991482 3.021537 5.045256 0.057257 0.058611 0.783434 21.304190 0.601048 2.789202 5.136031 0.059522 0.059800 0.766115 24.415976 0.855895 2.976421 5.014838 0.056684 0.057656 0.824366 18.043875 Output of readTrace 9. Errors and Troubleshooting G-PhoCS makes regulars checks to test the consistency of its data structures. If an inconsistency is found, it exits with an error message. These errors are typically marked by “Fatal Error X”. Please send the exact error message together with a link to the sequence and control files that generated the error to [email protected].