1
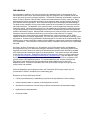
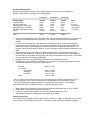
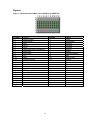
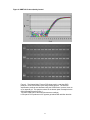
Table of Contents
Table of Contents ..................................................................................................................................... 1
Package Contents and Storage Conditions ............................................................................................. 2
Introduction............................................................................................................................................... 3
Production and Quality Assurance........................................................................................................... 4
Experimental Procedures......................................................................................................................... 4
Real-time PCR .....................................................................................................................................................4
Real-time PCR procedure ....................................................................................................................................5
Standard PCR ......................................................................................................................................................6
Troubleshooting Guide ............................................................................................................................. 8
References ............................................................................................................................................... 8
Figures ................................................................................................................................................... 10
Figure 1: TissueScan Human Major Tissue qPCR Array (HMRT102) ................................................................10
Figure 2: HMRT102 Product Quality Control ......................................................................................................11
Figure 3: HMRT102 Product Validation ..............................................................................................................12
Figure 4: TissueScan Human Brain Tissue qPCR Array (HBRT101) .................................................................13
Figure 5: HBRT101 Product Quality Control (real-time PCR).............................................................................14
Figure 6: HBRT101 Product Validation (real-time PCR)....................................................................................15
Figure 7: HBRT101 Product Quality Control and Validation (standard PCR) .....................................................16
Figure 8: TissueScan Mouse Developmental Tissue qPCR Array (MDRT101)..................................................17
Figure 9: MDRT101 Quality Control (real-time PCR)..........................................................................................18
Figure 10: MDRT101 Product Quality Control and Validation (standard PCR)...................................................19
Figure 11: TissueScan Mouse Normal Tissue qPCR Array (MNRT101) ...........................................................20
Figure 12: MNRT101 Quality Control .................................................................................................................21
Figure 13: TissueScan Drosophila Tissue qPCR Array (DSRT101) ...................................................................22
Figure 14: DSRT101 Product Quality Control....................................................................................................23
Figure 15: DSRT101 Product Validation............................................................................................................24
Figure 16: TissueScan Rat Normal Tissue qPCR Array (RNRT101)..................................................................25
Figure 17: RNRT101 Product Quality Control ....................................................................................................26
Figure 18: RNRT101 Product Validation ............................................................................................................27
1
Package Contents and Storage Conditions
The following components are included:
•
Identical, sealed TissueScan™ Tissue qPCR Array plates containing dried, PCR*-ready, firststrand cDNAs
•
Adhesive cover sheets for sealing the plates
•
Control primers
TissueScanTM
Tissue qPCR
Arrays
Human Major Tissue
Human Major Tissue
Human Brain
Human Brain
Mouse
Developmental
Mouse
Developmental
Mouse Normal
Mouse Normal
Rat Normal
Rat Normal
Drosophila
Drosophila
Cat. #
# of plates
provided
Control primers
HMRT102
HMRT502
HBRT101
HBRT501
Unique
samples
(format)
48 (4x12)
48 (4x12)
24 (2x12)
24 (2x12)
2
10
2
10
GAPDH
GAPDH
GAPDH
GAPDH
MDRT101
48 (4x12)
2
GAPDH
MDRT501
48 (4x12)
10
GAPDH
MNRT101
MNRT501
RNRT101
RNRT501
DSRT101
DSRT501
36 (3X12)
36 (3X12)
46 (4X12)
46 (4X12)
12
12
2
10
2
10
2
10
GAPDH
GAPDH
GAPDH
GAPDH
RpL32
RpL32
The above components are shipped at room temperature, but should be kept at -20°C for long-term
storage. If properly stored, they have a 12-month shelf life.
The following components are required but are not provided:
•
•
•
•
Reagents for real-time PCR amplification (e.g., 2x master mix)
Gene-specific primers
Gene-specific probe (if using a TaqMan Assay)
A 96-well real-time thermocycler
*
The polymerase chain reaction (PCR) is protected by patents held by Hoffmann-La Roche. Purchase of
any of OriGene’s PCR-related products does not convey a license to use the PCR process, covered by
these patents. Purchasers of these products must obtain a license before performing PCR.
NOTE: FOR RESEARCH PURPOSES ONLY. NOT FOR DIAGNOSTIC OR THERAPEUTIC USAGE.
2
Introduction
Gene expression profiling is one of the most frequently used approaches for characterizing novel
transcripts either derived from expressed sequence tag (EST) projects or the completed human and
mouse genomes by means of program prediction. The amount of transcript accumulated in a particular
tissue, normal or diseased, often provides valuable information about the function of the gene. Many
technologies have been developed for obtaining gene expression data, including Northern blotting, RTPCR and DNA microarray analysis. Each of the technologies has its advantages and disadvantages.
The Northern blot method is the only method that reveals the size information of a transcript as well as
transcript abundance. The drawback of the method is that it is low-throughput and frequently involves
radioactive agents. DNA microarray analysis is a well-established gene expression profiling technology.
The primary advantage of DNA microarrays is that it is able to simultaneously generate the expression
profiles of thousands of genes. Although DNA microarrays have produced a large amount of useful gene
expression data, their sensitivity and accuracy are sometimes compromised by non-specific
hybridizations due to shared homology among different genes. Many researchers use RT-PCR to
validate the data from microarray experiments. RT-PCR, long used for gene expression profiling, is fast
and sensitive. Instead of using hybridization, RNA transcripts are converted to the complementary DNA
(cDNA) using a reverse transcription reaction and the cDNAs are subsequently used as the templates for
PCR amplification. Thus the amount of PCR product will be correlated to the amount of the original RNA
transcript.
Previously, OriGene Technologies, Inc. developed a unique PCR-based system, the RapidScan
Gene Expression Panel, for fast and accurate gene expression profiling. With serially diluted cDNA
templates, the relative amounts of transcript in different tissues could be easily obtained by standard
PCR experiments and subsequent agarose gel electrophoresis. This system has been well adopted
by the research community. Examples of successful panel usage are cited in numerous publications
(1, 2 & http://www.origene.com/support/citations/gene_expression.mspx). With the adoption of realtime PCR technology, many researchers expressed a need for a real-time PCR or quantitative PCR
(qPCR) version of the RapidScan product. To accommodate this need, we have developed the
TissueScan Tissue qPCR Arrays using the same high quality cDNAs as those used in the
RapidScan panels. OriGene’s TissueScan Real-Time qPCR Arrays have gone through vigorous
quality control and validation.
Unlike the RapidScan gene expression panels, the TissueScan qPCR arrays contain only one
concentration of cDNAs, normalized to a housekeeping gene.
Benefits of the Tissue qPCR Array include:
•
Fast and non-radioactive (no radiolabeling of probe/no blot hybridization/ no filter washing)
•
Instant expression data; no agarose gel electrophoresis required
•
Simultaneous examination of a wide range of different tissues and/or developmental stages
•
Highly sensitive and quantitative
•
Extremely reliable
3
Production and Quality Assurance
TissueScan Tissue qPCR Arrays were assembled by selecting frequently studied tissues and/or
developmental stages. To avoid detection of individual differences in gene expression, tissues were
pooled, whenever possible, from multiple individuals. For the human panels, tissues were selected
from individuals of different ethnicity. For the mouse panels, the tissues were derived from NIH Swiss
mice. The Drosophila panels were derived from samples from the Canton S strain.
Total RNA was isolated and subjected to oligo(dT) selection. The recovered poly A+ RNA was then
examined by Northern blot hybridization to confirm RNA integrity. The poly A+ RNA was used to
synthesize first-strand cDNA, using oligo(dT) primers and M-MLV reverse transcriptase. Individual cDNA
pools were confirmed to be free of genomic DNA contamination and to contain complete reverse
transcripts of selected rare and long mRNAs, such as those for the transferrin receptor (5 kb) and the
ataxia telangiectasia gene (9.4 kb). The first-strand cDNAs from each tissue were then subjected to
normalization, such that they all contain an equivalent concentration of GAPDH cDNA for human and
mouse samples, or RpL32 cDNA for Drosophila samples.
Experimental Procedures
Real-time PCR
Real-time PCR continuously quantifies the PCR product throughout the entire thermocycling process.
Therefore, it eliminates the need for agarose gel quantification and avoids the issue of saturated images
of PCR products normally encountered in standard PCR quantitation. This is achieved via comparison of
the data during the linear amplification phase. TaqMan probe (3) and SYBR Green I (4, 5) based
protocols are the most commonly used real-time PCR protocols. These methods generate fluorescent
signals that are proportional to the amount of the PCR products generated at the end of each cycle.
Differences among them involve the types of signals and the method by which the fluorescent signals are
generated. In a TaqMan protocol, a pair of gene-specific primers and a sequence-specific, fluorogenic
probe (with reporter and quencher) is included in the PCR mix. The specific probe anneals proportionally
to the single stranded DNA and as DNA synthesis occurs, is subsequently removed base-by-base by the
5’ exonuclease activity of Taq polymerase. Consequentially, the released fluorescent reporter is freed
from the quencher, and generates a fluorescent signal that is proportional to the amount of PCR product
being accumulated. This method is very sensitive and reliable. A SYBR Green I protocol, on the other
hand, does not require a fluorescent probe. SYBR Green I binds to double stranded DNA to generate
detectable fluorescence, and the amount of signal is proportional to the amount of double stranded DNA
in solution. Since SYBR Green I binds indiscriminately to double stranded DNAs, it will generate false
signals if non-specific elements (e.g., primer dimers) exist. This is frequently used in many laboratories
due to its simplicity and low cost. Both TaqMan and SYBR Green I protocols can be used with the
TissueScan Tissue qPCR Array.
Gene specific primers and probes
A successful real-time PCR detection requires a set of sequence-specific primers (and may require a
fluorescent probe, as described above). Many primer and probe designing programs are commercially
available, or are found as freeware on the internet. It is suggested that qPCR amplicons should range
from 80-150 base pairs in length. When using the SYBR Green I protocol, since the fluorescence signal
reflects the total amount of double stranded DNA (including specific and non-specific products), it is
critical to design primers that maximize specific products and minimize non-specific products. We
recommend optimizing PCR primers and conditions using known templates before the PCR system is
used with the TissueScan Tissue qPCR Array.
4
PCR master mix
Both TaqMan and SYBR Green I master mixes are commercially available and are recommended for use
in the TissueScan Tissue qPCR Array. A real-time PCR master mix usually contains PCR buffer,
magnesium, dNTPs and Taq polymerase. Most commercially available real-time master mixes are
provided as a 2X concentration with a reference dye (ROX) included.
Real-time PCR thermocycler
A 96-well real-time thermocycler and detection system is required for using the TissueScan Tissue qPCR
Array. The machines listed in the following table are compatible with these panels. For devices not listed
in the table, please contact OriGene for suggestions.
Manufacturer
ABI
Bio-Rad
Stratagene
Model
Prism 7000, 7700, 7300, 7500,
9500
iCycler, MyiQ
Mx4000, Mx3000p, Mx3005p
Real-time PCR procedure
Remove the TissueScan plate from –20ºC storage and allow it to warm to room temperature.
Prepare a pre-mix in a 1.5 ml tube according to the recipe below.
For SYBR Green I protocols:
24 samples
36 samples
48 samples
Stock solution
2X master mix
Forward primer (10 pmol/µL)
Reverse primer (10 pmol/µL)
ddH2O
Volume
390 µL
26 µL
26 µL
338 µL
Volume
570 µL
38 µL
38 µL
494 µL
Volume
750 µL
50 µL
50 µL
650 µL
Total
780 µL
1140 µL
1500 µL
For TaqMan protocols:
24 samples
36 samples
48 samples
Stock solution
2X master mix
Forward primer (10 pmol/µL)
Reverse primer (10 pmol/µL)
20X TaqMan probe
ddH2O
Volume
390 µL
26 µL
26 µL
39 µL
299 µL
Volume
570 µL
38 µL
38 µL
57 µL
437 µL
Volume
750 µL
50 µL
50 µL
75 µL
575 µL
Total
780 µL
1140 µL
1500 µL
•
•
•
Final
1X
10 pmol/well
10 pmol/well
Final
1X
10 pmol/well
10 pmol/well
1X
Remove the sealing film from the plate. Aliquot 30 µL of the PCR pre-mix into each well, avoiding
cross-contamination during pipetting. This can best be achieved using a multi-channel pipettor after
equally dividing the 1.5 ml premix into PCR tubes.
Cover the top of the plate with a new adhesive cover sheet (provided). Seal each well tightly by
pressing the cover around each well. Remove any air bubbles that may have been trapped at the
bottom of the tubes by gently tapping the plate on a flat surface. Incubate the plate on ice for 15
minutes to allow the dried cDNA to dissolve. Gently vortexing the plate will facilitate resuspension of
the DNA.
Mount the plate snugly into the 96-well real-time thermal cycler, so that each well makes tight contact
with the heating unit. Tighten the lid of the thermal cycler to ensure direct contact between the lid and
5
•
•
•
the top of the plate; this will reduce the chance of evaporation from the wells. These steps are very
critical for even template amplification.
Program the thermal cycling conditions optimized for your gene-specific primers.
Set the reporter type (TaqMan probe or SYBR Green I and reference dye) according to the
equipment user’s guide. If a SYBR Green I protocol is used, program a post-amplification melting
curve test if possible.
The following cycling conditions are listed here as a reference; we strongly suggest that the cycling
conditions be optimized for your gene-specific primers.
Activation
Pre-soak
42 cycles of:
Denaturation
Annealing
50°C for 2 min
95°C for 5 min
95°C for 15 sec
60°C for 1 min
Note: for an amplicon > 120 bp, a 72°C extension step must be incorporated.
•
Analyze the expression data using the software provided by the thermal cycler manufacturer. In most
cases, relative expression levels can be calculated (6). Use your own preferred method to perform
this analysis.
•
Examine the PCR products via 2% agarose gel if desired (recommended when a SYBR Green I
protocol is used for detection).
Standard PCR
Although the TissueScan Tissue qPCR Array is designed for real-time PCR procedures, it can also be
used in a standard PCR protocol using agarose gel electrophoresis. Semi-quantitative analysis is
desirable when researchers prefer to use gel documentation data for publication. An experimental
procedure for standard PCR is described below.
Primer design for standard PCR
Primer design is a critical factor in obtaining success in PCR. There are no simple rules; however, the
general guidelines for primer design indicate that primers should be between 17 and 25 nucleotides in
length, have a G/C content of approximately 50% and should not form strong secondary structures.
Avoid sequences that are susceptible to primer-dimer formation.
In addition, the primers should ideally correspond to the coding region of the gene of interest. The
positions of the forward and the reverse primers should be between 300 and 1000 bp apart, so as to
facilitate efficient template amplification and easy detection of the PCR product in an agarose gel. If
possible, a pilot PCR amplification should be performed using the gene-specific primers and a test
template, such as a plasmid cDNA clone or a first-strand cDNA preparation that is known to contain the
target sequence of interest.
6
Standard PCR procedure
Remove the TissueScan plate from -20°C storage and allow it to warm to room temperature.
Prepare a PCR pre-mix* according to the following recipe
24 samples
36 samples
48 samples
Stock solution
10X PCR buffer
dNTPs (2 mM each)
Forward primer (10 pmol/µL)
Reverse primer (10 pmol/µL)
Taq DNA polymerase (5 U/µL)
ddH2O
Volume
78 µL
78 µL
26 µL
26 µL
2.6 µL
569.4 µL
Volume
114 µL
114 µL
38 µL
38 µL
3.8 µL
832.2 µL
Volume
150 µL
150 µL
50 µL
50 µL
5 µL
1095 µL
Total
780 µL
1140 µL
1500 µL
•
•
•
•
•
Final
1X
0.2 mM
10 pmol/well
10 pmol/well
0.5 U/well
Remove the sealing film from the TissueScan plate. Aliquot 30 µL of the PCR pre-mix into each well,
avoiding cross-contamination during pipetting. This can best be achieved using a multichannel
pipettor.
Cover the top of the plate with a new adhesive cover sheet (provided). Seal each well tightly by
pressing the cover around each well. Remove any air bubbles that may have been trapped at the
bottom of the tubes by gently tapping the plate on a flat surface. Incubate the plate on ice for 15
minutes to allow the dried cDNA to dissolve. Gently vortexing the plate facilitates resuspension of the
DNA.
Mount the plate snugly into the block of a 96-well thermal cycler, so that each well makes tight
contact with the heating unit. Tighten the lid of the thermal cycler to ensure direct contact between
the lid and the top of the plate; this will reduce the chance of evaporation from the wells. These steps
are very critical for even template amplification.
Program the thermal cycling conditions optimized for your gene-specific primers.
The following cycling conditions are listed here as a reference; we strongly suggest that the cycling
conditions be optimized for your gene-specific primers:
Pre-soak
33* cycles of:
Denaturation
Annealing
Extension
Soak
94°C for 3 min
94°C for 30 sec
55°C for 30 sec**
72°C for 2 min
72°C for 5 min
*
Use 31 cycles for the control primers and run a 2% agarose gel to obtain the results shown in Fig. 3.
For your target gene, set the cycle number based on the abundance of the transcript (if known).
**
This is the suggested annealing temperature for the GAPDH control primers. The annealing
temperature should be 5°C below that of the Tm of the gene-specific primers.
•
•
•
When the reaction is completed, remove the cover sheet and add to each well 15 µL of 3X DNA
loading buffer. Mix gently by pipetting up and down.
Load 15 µL of each sample onto the gel. Store the remaining samples at –20°C.
Separate the samples by electrophoresis and document the results.
Positive control PCR
Two identical TissueScan plates are provided for your convenience. Ideally, the two plates may be used
for the analysis of two different genes or ESTs. Alternatively, after obtaining an adequate expression
7
profile for a test gene, the second plate may be used for determining the expression profile using the
control primers provided.
To perform the control PCR, substitute the gene-specific primers with 100 µL of the control primers
(GAPDH for human and mouse panels, RpL32 for Drosophila panels). The single primer tube contains
both the forward and reverse primers. These primer pair has been optimized for a SYBR Green I
protocol. The expected sizes of the PCR products from the control primers are listed below.
human GAPDH product: 151 bp
mouse GAPDH product: 151 bp
Drosophila RpL32 product: 434 bp
Sample profiling
The cDNAs in every TissueScan qPCR panel have been vigorously quality controlled. The cDNAs were
normalized to GAPDH or RpL32 content, and tested to confirm normalization using those same primers
with a SYBR Green I protocol (Figs 2, 5, 9, 12, 14). The panels are also tested both in real-time PCR and
in standard PCR (Figs 3, 6, 7, 10, 15).
Troubleshooting Guide
No PCR product detected
May have omitted a PCR component. Be sure to use a written checklist when assembling the
reaction mix.
May have used an inappropriate annealing temperature. If at all possible, test primers against a
known template (e.g., diluted cloned DNA) to determine the optimal amplification conditions.
May be due to poor primer design. Follow the general guidelines when designing PCR primers.
More than one PCR product detected on an agarose gel
It is possible that all of the products are specific, resulting from the amplification of either alternatively
spliced mRNAs or transcripts derived from distinct members of a gene family. This may be resolved
by either DNA sequencing of the PCR products or by using nested PCR primers for reamplification.
Detection of both specific band(s) and a background smear
This may be the result of the annealing temperature used in the experiment, giving rise to both
specific component(s) and non-specific background noise. The non-specific components may be
reduced by increasing the stringency of the PCR amplification.
References
1. Khong HT, Rosenberg SA. The Waardenburg syndrome type 4 gene, SOX10, is a novel
tumor-associated antigen identified in a patient with a dramatic response to immunotherapy.
Cancer Res. 2002 Jun 1; 62(11):3020-3.
2. Egland KA, Kumar V, Duray P, Pastan I. Characterization of overlapping XAGE-1 transcripts
encoding a cancer testis antigen expressed in lung, breast and other types of cancers. Mol
Cancer Ther. 2002 May; 1(7):441-50.
8
3. Lee LG, Connell CR, Bloch W. (1993). Allelic discrimination by nick-translation PCR with
fluorogenic probes. Nucleic Acids Res.11; 21(16):3761-6.
4. T.B. Morrison, J.J. Weis, C.T. (1998). Quantification of Low-Copy Transcripts by Continuous
SYBR Green I Monitoring during Amplification. BioTechniques 24, 954 (1998).
5. K.M. Ririe, R.P. Rasmussen, C.T. Wittwer. (1997). Product Differentiation by Analysis of
DNA Melting Curves during the Polymerase Chain Reaction. Anal Biochem. 245, 154.
6. M.W. Pfaffl, A new mathematical model for relative quantification in real-time RT-PCR.
(2001). Nucleic Acids Research 2001 29:2002-2007.
9
Figures
Figure 1: TissueScan Human Major Tissue qPCR Array (HMRT102)
Location
C-1
C-2
C-3
C-4
C-5
C-6
C-7
C-8
C-9
C-10
C-11
C-12
D-1
D-2
D-3
D-4
D-5
D-6
D-7
D-8
D-9
D-10
D-11
D-12
Tissue
Adrenal Gland
Bone Marrow
Brain
Cervix
Colon
Descending part of duodenum
Epididymis
Esophagus
Fat
Heart
Intestine (Small)
Intracranial Artery
Kidney
Liver
Lung
Lymph Node
PBL (plasma blood leucocytes)
Mammary gland
Muscle
Nasal Mucosa
Optic Nerve
Ovary
Oviduct
Pancreas
10
Location
E-1
E-2
E-3
E-4
E-5
E-6
E-7
E-8
E-9
E-10
E-11
E-12
F-1
F-2
F-3
F-4
F-5
F-6
F-7
F-8
F-9
F-10
F-11
F-12
Tissue
Penis
Pericardium
Pituitary
Placenta
Prostate
Rectum
Retina
Seminal Vesicles
Skin
Spinal Cord
Spleen
Stomach
Testis
Thymus
Thyroid
Tongue
Tonsil
Trachea
Urethra
Urinary Bladder
Uterus
Uvula
Vagina
Vena Cava
Figure 2: HMRT102 Product Quality Control
Figure 2. The Human Major Tissue qPCR Array used in a real-time PCR
protocol in a PE7700 thermal cycler using GAPDH primers. The GAPDH
amplification products were detected using the SYBR Green I protocol, then run
on an agarose gel. The sample numbers in the bottom panel correspond to the
cDNA templates listed in Figure 1.
Top panel: Real-time PCR results (fluorescence readings)
Lower panel: PCR products on 2% agarose gel stained with ethidium bromide
11
Figure 3: HMRT102 Product Validation
800.0
700.0
600.0
500.0
Relative
Expression
Level
400.0
300.0
200.0
100.0
1
2
3
4
5
6
7
8
9
10
11
12
13
14
15
16
17
18
19
20
21
22
23
24
25
26
27
28
29
30
31
32
33
34
35
36
37
38
39
40
41
42
43
44
45
46
47
48
0.0
Sample number
Figure 3. The Human Major Tissue qPCR Array used in a real-time PCR protocol
in a PE7700 thermal cycler using primers designed against the human thyroglobulin
gene. The sample numbers in the bottom panel correspond to the cDNA templates
listed in Figure 1.
Top panel: Real-time PCR results (fluorescence readings)
Lower panel: Normalized relative expression levels among 48 tissue samples.
12
Figure 4: TissueScan Human Brain Tissue qPCR Array (HBRT101)
Location
C-1
C-2
C-3
C-4
C-5
C-6
C-7
C-8
C-9
C-10
C-11
C-12
Tissue
Frontal Lobe
Temporal Lobe
Occipital Lobe
Parietal Lobe
Paracentral Gyrus
Postcentral Gyrus
Olfactory Bulb
Thalamus
Corpus Callosum
Hypothalamus
Amygdala
Hippocampus
Location
D-1
D-2
D-3
D-4
D-5
D-6
D-7
D-8
D-9
D-10
D-11
D-12
13
Tissue
Caudate
Putamen
Substantia Nigra
Pituitary Gland
Cerebellum grey
Cerebellum white
Cerebellum vermis
Nucleus Accumbens
Pons
Medulla
Spinal Cord
Choroid Plexus
Figure 5: HBRT101 Product Quality Control (real-time PCR)
Figure 5. The Human Brain Tissue qPCR Array used in a real-time PCR
protocol in a PE7700 thermal cycler using GAPDH primers. The GAPDH
amplification products were detected using the SYBR Green I protocol.
14
Figure 6: HBRT101 Product Validation (real-time PCR)
700.00
600.00
500.00
400.00
300.00
200.00
100.00
0.00
1
2
3
4
5
6
7
8
9
10
11
12
13
14
15
16
17
18
19
20
21
22
23
24
Relative
Expression
Level
Sample number
Figure 6. The Human Brain Tissue qPCR Array used in a real-time PCR protocol
in a PE7700 thermal cycler using primers designed against the human growth
hormone releasing hormone receptor (GHRHR) (NM_001009824). The sample
numbers in the bottom panel correspond to the cDNA templates listed in Figure 4.
Top panel: Real-time PCR results (fluorescence readings)
Lower panel: Normalized relative expression levels among 48 tissue samples.
15
Figure 7: HBRT101 Product Quality Control and Validation (standard PCR)
1
2
3
4
5
6
7
8
9
10 11 12 13 14 15 16 17 18 19 20 21 22 23 24
1
2
3
4
5
6
Figure 7. The Human Brain Tissue qPCR Array used in a standard PCR protocol using the primers
indicated below. The amplification products were run on an agarose gel stained with ethidium bromide.
The sample numbers in each panel correspond to the cDNA templates listed in Figure 4.
Row 1. NM_001101 Homo sapiens GAPDH
Row 2. NM_001009824 Homo sapiens growth hormone releasing hormone receptor (GHRHR)
Row 3. NM_033207 Homo sapiens transmembrane protein 10
Row 4. NM_000816 Homo sapiens gamma-aminobutyric acid (GABA) A receptor
Row 5. NM_005458 Homo sapiens GABA-B receptor
Row 6. NM_000832 Homo sapiens NMDA receptor subunit (NR1)
16
Figure 8: TissueScan Mouse Developmental Tissue qPCR Array (MDRT101)
Location
C-1
C-2
C-3
C-4
C-5
C-6
C-7
C-8
C-9
C-10
C-11
C-12
D-1
D-2
D-3
D-4
D-5
D-6
D-7
D-8
D-9
D-10
Tissue
Embryo Day 13
Telencepahlon/ Diencephalon
Mesencephelon (Midbrain)
Rhombencephalon (Hindbrain)
Spinal Cord
Embryo Day 15
Telencephalon
Diencephalon
Midbrain
Pons
Medulla
Spinal Cord
Embryo Day 18
Frontal Cortex
Posterior Cortex
Entorhinal Cortex
Olfactory Bulb
Hippocampus
Striatum
Thalamus
Hypothalamus
Midbrain
Pons
Medulla
Spinal Cord
17
Location
D-11
D-12
E-1
E-2
E-3
E-4
E-5
E-6
E-7
E-8
E-9
E-10
E-11
E-12
F-1
F-2
F-3
F-4
F-5
F-6
F-7
F-8
F-9
F-10
F-11
F-12
Tissue
Postnatal Day 7
Frontal Cortex
Posterior Cortex
Entorhinal Cortex
Olfactory Bulb
Hippocampus
Striatum
Thalamus
Hypothalamus
Cerebellum
Midbrain
Pons
Medulla
Spinal Cord
Adult 5 Week
Frontal Cortex
Posterior Cortex
Entorhinal Cortex
Olfactory Bulb
Hippocampus
Striatum
Thalamus
Hypothalamus
Cerebellum
Midbrain
Pons
Medulla
Spinal Cord
Figure 9: MDRT101 Quality Control (real-time PCR)
Figure 9. The TissueScan Mouse Developmental Tissue qPCR Array
used in a real-time PCR protocol in a PE7700 thermal cycler using
GAPDH primers. The GAPDH amplification products were detected
using the SYBR Green I protocol, then run on an agarose gel.
Top panel: Real-time PCR results (fluorescence readings)
Lower panel: PCR products on 2% agarose gel stained with ethidium
bromide
18
Figure 10: MDRT101 Product Quality Control and Validation (standard PCR)
1 2
3 4
5
6 7
8
9 10 11 12 13 14 15 16 17 18 19 20 21 22 23 24 25 26 27 28 29 30 31 32 33 34 35 36 37 38 39 40 41 42 43
1
2
3
Figure 10. The TissueScan Mouse Developmental Tissue qPCR Array used in a standard PCR protocol
using the primers indicated below. The amplification products were run on an agarose gel stained with
ethidium bromide.
Row 1. NM_001101 Mouse GAPDH
Row 2. NM_003235 Mouse Hox 3.1
Row 3. NM_014357 Mouse Dopamine receptor D3
19
Figure 11: TissueScan Mouse Normal Tissue qPCR Array (MNRT101)
20
Figure 12: MNRT101 Quality Control
Figure 12. TissueScan Mouse Normal Tissue used in a real-time PCR
protocol in a PE7700 thermal cycler using GAPDH primers. The GAPDH
amplification products in were detected using the SYBR Green I protocol.
21
Figure 13: TissueScan Drosophila Tissue qPCR Array (DSRT101)
Well
C-1
C-2
C-3
C-4
C-5
C-6
C-7
C-8
C-9
C-10
C-11
C-12
Tissue
Embryo 0-4 hours
Embryo 4-8 hours
Embryo 8-12 hours
Embryo 12-24 hours
1st instar
2nd instar
3rd instar
Pupae
Male eye/ head
Female eye/ head
Male body
Female body
Well
D-1
D-2
D-3
D-4
D-5
D-6
D-7
D-8
D-9
D-10
D-11
D-12
22
Tissue
Embryo 0-4 hours
Embryo 4-8 hours
Embryo 8-12 hours
Embryo 12-24 hours
1st instar
2nd instar
3rd instar
Pupae
Male eye/ head
Female eye/ head
Male body
Female body
Figure 14: DSRT101 Product Quality Control
Figure 14. The Drosophila Tissue qPCR Array used in a real-time PCR
protocol in a PE7700 thermal cycler using primers designed against
ribosomal protein RpL32. The amplification products were detected
using the SYBR Green I protocol, then run on an agarose gel.
Top panel: Real-time PCR results (fluorescence readings)
Lower panel: PCR products on 2% agarose gel stained with ethidium
bromide
23
Figure 15: DSRT101 Product Validation
1200
1000
800
Relative
Expression
Level
600
400
200
0
1
2
3
4
5
6
7
8
9
10
11
12
Sample number
Figure 15. The Drosophila Tissue qPCR Array used in a real-time PCR
protocol in a PE7700 thermal cycler using primers designed against the
doublesex gene. The sample numbers in the bottom panel correspond
to the cDNA templates listed in Figure 13.
Top panel: Real-time PCR results (fluorescence readings)
Lower panel: Normalized relative expression levels among 12 tissue
samples.
24
Figure 16: TissueScan Rat Normal Tissue qPCR Array (RNRT101)
Location
C-1
C-2
C-3
C-4
C-5
C-6
C-7
C-8
C-9
C-10
C-11
C-12
D-1
D-2
D-3
D-4
D-5
D-6
D-7
D-8
D-9
D-10
D-11
D-12
Tissue
Adipose Tissue
Adrenal Gland
Aorta
Bladder
Brain, Brainstem
Brain, Cerebellum
Brain, Cerebral Cortex
Brain, Front Cortex
Brain, Medulla
Brain, Midbrain
Brain, Pons
Brain, Posterior Cortex
Brain, Thalamus
Brain, Whole
Embryo-E12
Embryo-E15
Embryo-E17
Embryo-E19
Epididymis
Esophagus
Heart
Intestine
Kidney
Liver
Location
E-1
E-2
E-3
E-4
E-5
E-6
E-7
E-8
E-9
E-10
E-11
E-12
F-1
F-2
F-3
F-4
F-5
F-6
F-7
F-8
F-9
F-10
25
Tissue
Lymph Nodes
Mammary Gland, day1 of involution
Mammary Gland, day1 of lactation
Mammary Gland, non-pregnant
Mammary Gland, pregnant-E12
Mammary Gland, pregnant-E16
Ovary
Pancreas
Pituitary
Placenta
Prostate
Skeletal Muscle
Skin
Spinal Cord
Spleen
Stomach
Striatum
Testis
Thymus
Thyroid
Trachea
Uterus, non-pregnant
Figure 17: RNRT101 Product Quality Control
Figure 17. The Rat Normal Tissue qPCR Array used in a real-time PCR
protocol in a PE7700 thermal cycler using GAPDH primers. The GAPDH
amplification products were detected using the SYBR Green I protocol, then run
on an agarose gel. The sample numbers in the bottom panel correspond to the
cDNA templates listed in Figure 16.
Top panel: Real-time PCR results (fluorescence readings)
Lower panel: PCR products on 2% agarose gel stained with ethidium bromide
26
Figure 18: RNRT101 Product Validation
700
600
500
Relative
Expression
Level
400
300
200
100
1
2
3
4
5
6
7
8
9
10
11
12
13
14
15
16
17
18
19
20
21
22
23
24
25
26
27
28
29
30
31
32
33
34
35
36
37
38
39
40
41
42
43
44
45
46
0
Sample number
Figure 18. The Rat Normal Tissue qPCR Array used in a real-time PCR protocol in
a PE7700 thermal cycler using primers designed against the rat
LOC299907(XM_216920) gene. The sample numbers in the bottom panel
correspond to the cDNA templates listed in Figure 16.
Top panel: Real-time PCR results (fluorescence readings)
Lower panel: Normalized relative expression levels among 46 tissue samples.
27