1
Quick Guide for DAQ Manager software
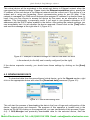
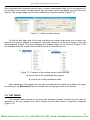
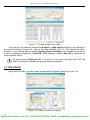
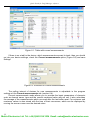
Figure 7.3. Create a report as a table
If the value in the channel exceeds Low Value or High Value specified in the settings of
the selected channel (Figure 5.4), then in the table displays “[LO]” or “[HI]” beside the value.
However, if the channel has the setting Display Format as Binary, then instead of real value,
a label is displayed (defined by Label ON / OFF settings), where Label ON is accepted for
values greater than 0.
i
By pressing the [Export to file …] button You can save the table as a CSV file
which can then be opened with any spreadsheet program.
7.3. THE GRAPH
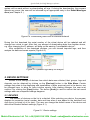
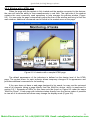
Along with the table, you can create a graph with all logged channels (Figure 7.4).
Figure 7.4. Create a report as a graph
14
Metrix Electronics Ltd Tel: +44 (0)845 034 3234 Email: [email protected]