1
Lab Scope Plug-in User Manual September 2010 EAZ0007E07G Rev. A Trademark Acknowledgments Snap-on, Fast-Track, Scanner, and MODIS are trademarks of Snap-on Incorporated. All other marks are trademarks or registered trademarks of their respective holders. Copyright Information ©2010 Snap-on Incorporated. All rights reserved. Disclaimer The information, specifications and illustrations in this manual are based on the latest information available at the time of printing. Snap-on reserves the right to make changes at any time without notice. Visit our website at: www.snapon.com/solus (North America) snapondiag.com (Europe) sun-diagnostics.com (Europe) For Technical Assistance CALL 1-800-424-7226 (North America) CALL +44 (0) 845 601 4736 (United Kingdom) E-mail [email protected] (United Kingdom) For technical assistance in all other markets, contact your selling agent. Safety Information For your own safety and the safety of others, and to prevent damage to the equipment and vehicles upon which it is used, it is important that the accompanying Safety Information be read and understood by all persons operating, or coming into contact with, the equipment. We suggest you store a copy the book near the unit in sight of the operator This product is intended for use by properly trained and skilled professional automotive technicians. The safety messages presented throughout this manual are reminders to the operator to exercise extreme care when using this test instrument. There are many variations in procedures, techniques, tools, and parts for servicing vehicles, as well as in the skill of the individual doing the work. Because of the vast number of test applications and variations in the products that can be tested with this instrument, we cannot possibly anticipate or provide advice or safety messages to cover every situation. It is the automotive technician’s responsibility to be knowledgeable of the system being tested. It is essential to use proper service methods and test procedures. It is important to perform tests in an appropriate and acceptable manner that does not endanger your safety, the safety of others in the work area, the equipment being used, or the vehicle being tested. It is assumed that the operator has a thorough understanding of vehicle systems before using this product. Understanding of these system principles and operating theories is necessary for competent, safe and accurate use of this instrument. Before using the equipment, always refer to and follow the safety messages and applicable test procedures provided by the manufacturer of the vehicle or equipment being tested. Use the equipment only as described in this manual. Read, understand and follow all safety messages and instructions in this manual, the accompanying safety manual, and on the test equipment. Safety Message Conventions Safety messages are provided to help prevent personal injury and equipment damage. All safety messages are introduced by a signal word indicating the hazard level. ! DANGER Indicates an imminently hazardous situation which, if not avoided, will result in death or serious injury to the operator or to bystanders. ! WARNING Indicates a potentially hazardous situation which, if not avoided, could result in death or serious injury to the operator or to bystanders. iii Safety Information Important Safety Instructions ! CAUTION Indicates a potentially hazardous situation which, if not avoided, may result in moderate or minor injury to the operator or to bystanders. Safety messages contain three different type styles. • Normal type states the hazard. • Bold type states how to avoid the hazard. • Italic type states the possible consequences of not avoiding the hazard. An icon, when present, gives a graphical description of the potential hazard. Example: ! WARNING Risk of unexpected vehicle movement. • Block drive wheels before performing a test with engine running. A moving vehicle can cause injury. Important Safety Instructions For a complete list of safety messages, refer to the accompanying safety manual. SAVE THESE INSTRUCTIONS iv Table of Contents Safety Information ..................................................................................................................... iii Safety Message Conventions....................................................................................................... iii Important Safety Instructions........................................................................................................iv Table of Contents ....................................................................................................................... v Chapter 1: Using This Manual ................................................................................................... 1 Conventions.................................................................................................................................. 1 Bold Text ................................................................................................................................ 1 Symbols ................................................................................................................................. 1 Terminology ........................................................................................................................... 2 Note and Important Messages ............................................................................................... 2 Procedures............................................................................................................................. 2 Additional Manuals ....................................................................................................................... 3 Tool Help ...................................................................................................................................... 3 Chapter 2: Getting Started......................................................................................................... 4 Powering the MODIS™ Unit......................................................................................................... 4 Connecting Leads and Adapters .................................................................................................. 4 Channel One Lead ................................................................................................................. 4 Channel Two Lead ................................................................................................................. 5 Channel Three Lead .............................................................................................................. 6 Channel Four Lead ................................................................................................................ 6 Secondary Coil Adapter Lead ................................................................................................ 7 Inductive RPM Pickup Adapter .............................................................................................. 8 Chapter 3: Introduction.............................................................................................................. 9 Functional Description ................................................................................................................ 10 Technical Specifications ............................................................................................................. 10 Capabilities ................................................................................................................................. 11 Leads, Probes and Adapters ...................................................................................................... 12 Channel 1 Lead.................................................................................................................... 12 Channel 2 Lead.................................................................................................................... 13 Channel 3 Lead ................................................................................................................... 13 Channel 4 Lead.................................................................................................................... 13 Alligator Clips ....................................................................................................................... 13 Test Probes.......................................................................................................................... 14 Secondary Coil Adapter Lead .............................................................................................. 14 Secondary Ignition Clip-on Wire Adapter ............................................................................. 14 Inductive RPM Pickup Adapter ............................................................................................ 14 Chapter 4: Navigation .............................................................................................................. 15 Screen Layout ............................................................................................................................ 15 Upper Toolbar ...................................................................................................................... 15 Main Body ............................................................................................................................ 16 v Table of Contents Lower Toolbar ...................................................................................................................... 16 Making Selections ...................................................................................................................... 17 Chapter 5: Multimeter Operations........................................................................................... 18 Selecting Multimeter Software.................................................................................................... 18 Graphing Meter .................................................................................................................... 19 Digital Meter ......................................................................................................................... 20 Performing Multimeter Tests ...................................................................................................... 20 Changing Views ................................................................................................................... 20 Pausing Data ....................................................................................................................... 21 Using Zoom.......................................................................................................................... 22 Using Cursors ...................................................................................................................... 22 Taking Snapshots ................................................................................................................ 23 Resetting Gauges ................................................................................................................ 24 Saving Data ......................................................................................................................... 24 Printing ................................................................................................................................. 25 Using Setup ......................................................................................................................... 25 Calibration Indicator ............................................................................................................. 27 Adjusting Channel Settings .................................................................................................. 27 Setting the Sweep Time ....................................................................................................... 30 Chapter 6: Scope Operations .................................................................................................. 31 Selecting Scope Software .......................................................................................................... 31 Lab Scope ............................................................................................................................ 32 Ignition Scope ...................................................................................................................... 32 Performing Scope Tests ............................................................................................................. 35 Changing View ..................................................................................................................... 35 Saving Data ......................................................................................................................... 36 Using Setup ......................................................................................................................... 36 Adjusting Channel Settings .................................................................................................. 38 Displaying Triggers .............................................................................................................. 39 Using Presets ............................................................................................................................. 41 Identifying Saved Presets .................................................................................................... 42 Loading Saved Presets ........................................................................................................ 42 Editing Presets ..................................................................................................................... 42 Deleting Presets................................................................................................................... 43 Copying and Moving Presets ............................................................................................... 44 Selecting Multiple Presets.................................................................................................... 44 Appendix A: Testing Tips ........................................................................................................ 45 General Tips ............................................................................................................................... 45 Using the Split Lead Adapter...................................................................................................... 45 Connecting the Pressure Transducer .................................................................................. 46 Connecting the Inductive RPM Pickup Adapter ................................................................... 47 Appendix B: Using Peak Detect .............................................................................................. 48 When To Use Peak Detect ......................................................................................................... 48 Example—Testing Secondary Ignition ................................................................................. 48 Example—Testing a TPS for Glitches.................................................................................. 50 When Not to Use Peak Detect.................................................................................................... 52 Example—Testing an Oxygen Sensor ................................................................................. 52 vi Table of Contents Peak Detect and the Graphing Meter ......................................................................................... 53 Appendix C: Using Noise Filter............................................................................................... 54 When to Use Filter...................................................................................................................... 54 Using the Filter with the Graphing Meter.............................................................................. 54 Using the Filter with the Scope ............................................................................................ 57 Appendix D: Using Sensitivity Adjustment............................................................................ 59 When To Use Sensitivity Adjustment ......................................................................................... 59 Improper Sensitivity Adjustments......................................................................................... 59 Some Common Ignition Problems.............................................................................................. 62 Example–Vehicle With A Shorted Spark-Plug ..................................................................... 62 Example–Vehicle With A Coil Not Firing .............................................................................. 63 Index .......................................................................................................................................... 65 vii Chapter 1 Using This Manual This manual contains tool usage instructions. Some of the illustrations shown in this manual may contain modules and optional equipment that are not included on your system. Contact a sales representative for availability of other modules and optional equipment. 1.1 Conventions 1.1.1 Bold Text Bold emphasis is used in procedures to highlight selectable items such as buttons and menu options. Example: • Press the Y/a button. 1.1.2 Symbols The following types of arrows are used. The “greater than” arrow (>) indicates an abbreviated set of selection instructions. Example: • Select Utilities > Tool Setup > Date. The above statement abbreviates the following procedure: 1. Navigate to the Utilities button. 2. Use the Thumb Pad to navigate to and highlight the Tool Setup submenu. 3. Use the Thumb Pad to navigate to and highlight the Date option from the submenu. 4. Press Y/a to confirm the selection. The solid arrows (e, c, d, b) are navigational instructions referring to the four directions of the Thumb Pad. Example: • Press the down d arrow. 1 Using This Manual Conventions 1.1.3 Terminology The term “select” means highlighting a button or menu item using the Thumb Pad and pressing the Y/a button to confirm the selection. Example: • Select Reset. The above statement abbreviates the following procedure: 1. Navigate to and highlight the Reset button. 2. Press the Y/a button. 1.1.4 Note and Important Messages The following messages are used. Note A NOTE provides helpful information such as additional explanations, tips, and comments. Example: i NOTE: For additional information refer to... Important IMPORTANT indicates a situation which, if not avoided, may result in damage to the test equipment or vehicle. Example: IMPORTANT: Do not force the CompactFlash® card into the slot. 1.1.5 Procedures An arrow icon indicates a procedure. Example: z To change screen views: 1. Select View. The drop-down menu displays. 2. Select an option from the menu. The screen layout changes to the format you selected. 2 Using This Manual Additional Manuals 1.2 Additional Manuals Tools that work in conjunction with various hardware and software modules have separate manuals available for each of the modules. 1.3 Tool Help Your unit has Tool Help containing reference and procedural information found in this and other tool related user’s manuals. From the main menu, access Tool Help on the Utilities menu. 3 Chapter 2 Getting Started This section explains how to get started using your MODIS™ Lab Scope Plug-in. Before you can use your MODIS™ Lab Scope Plug-in, you must do the following: 1. Power the MODIS™ unit. 2. Connect leads and adapters, as needed. 2.1 Powering the MODIS™ Unit Refer to your MODIS™ Display User Manual for more unit powering information. z To power on the unit: • Press the Power button. 2.2 Connecting Leads and Adapters The following section explains how to connect the provided Lab Scope Plug-in leads and adapters, as needed. 2.2.1 Channel One Lead Figure 2-1 Sample yellow lead connection 4 Getting Started z Connecting Leads and Adapters To connect the Channel 1 lead: 1. Plug the right-angled black ground plug to the common ground socket on the Lab Scope Plug-in. The black stackable plug is not connected to the lab scope. It is used when connecting another lead that requires a connection to the common ground socket. 2. Plug the right-angled yellow connector into the socket labeled CH1. 3. Attach the yellow alligator clip to the yellow straight end of the lead and the black alligator clip to the black straight end of the lead. 4. Connect both of the alligator clip ends to the test vehicle, as needed. IMPORTANT: When another lead requires a connection to the lab scope common ground socket, connect its black common ground plug to the loose CH1 black stackable lead. This method allows multiple common ground leads to be connected to the lab scope common ground socket. It also avoids a stack of common ground plugs sticking up from the lab scope module. Refer to Figure 2-2, Figure 2-3 and Figure 2-4 for details. 2.2.2 Channel Two Lead Figure 2-2 Sample green lead connection z To connect the Channel 2 lead: 1. Plug the black ground plug of the Channel 2 lead into the stackable common ground plug of the Channel 1 lead. This ground connection shields the Channel 2 lead. 2. Plug the right-angled green connector into the socket labeled CH2. 3. Attach the green alligator clip to the straight end of the Channel 2 lead. 4. Connect the alligator clip end to the test vehicle, as needed. 5 Getting Started Connecting Leads and Adapters 2.2.3 Channel Three Lead Figure 2-3 Sample blue lead connection z To connect the Channel 3 lead: 1. Plug the blue connector into the socket labeled CH3. 2. Attach the right-angled blue alligator clip to the straight end of the lead. 3. Connect the alligator clip end to the test vehicle, as needed. 2.2.4 Channel Four Lead Figure 2-4 Sample red lead connection 6 Getting Started z Connecting Leads and Adapters To connect the Channel 4 lead: 1. Plug the red connector into the socket labeled CH4. 2. Attach the right-angled red alligator clip to the straight-end of the lead. 3. Connect the alligator clip end to the test vehicle, as needed. 2.2.5 Secondary Coil Adapter Lead Figure 2-5 Sample Secondary Coil Adapter lead connection z To connect the Secondary Coil Adapter lead: 1. Plug the right-angled black ground plug into the ground socket on the Lab Scope Plug-in. 2. Plug the right-angled yellow connector into the socket labeled CH1. 3. Connect the ground clip to a good vehicle ground. 4. Connect the phono (RCA) plug into the clip-on coil wire adapter or coil adapters as needed for the vehicle being tested. i NOTE: If you need to extend the length of the ground clip using a jumper wire, keep it as short as possible. 7 Getting Started Connecting Leads and Adapters 2.2.6 Inductive RPM Pickup Adapter Figure 2-6 Sample Inductive RPM Pickup adapter connection z To connect the Inductive RPM Pickup adapter: 1. Connect the DB9F connector to the AUX port on the Lab Scope Plug-in. 2. Connect the RPM Pickup to the spark plug wire on cylinder number one. 8 Chapter 3 Introduction The Lab Scope Plug-in enables the following MODIS™ functions: • • • • • Component Tests (Refer to your Component Tests User Manual for details.) Graphing Meter Digital Meter Lab Scope Ignition Scope Figure 3-1 MODIS™ Lab Scope Plug-in 9 Introduction Functional Description 3.1 Functional Description Figure 3-2 Top of MODIS™ unit and Lab Scope Plug-in 1— Common Ground socket 2— Channel 1 socket Analog scope channel 3— Channel 2 socket Analog scope channel 4— Channel 3 socket Analog scope channel or DVOM minus lead 5— Channel 4 socket Analog scope channel or DVOM plus lead 6— Aux Port (DB-9 PIN Female Connector) Connection for an inductive RPM pickup or pressure/vacuum probe(s) 7— Lab Scope Plug-in slot 3.2 Technical Specifications Dimensions: Height: 7 1/2 inches 190.5 mm Width: 5 3/4 inches 146.1 mm Depth: 1 inch 25.4 mm 10 Introduction Capabilities Weight: 8.1 oz 229 g Fuse: 5A (Buss® ATC, Littlefuse® ATO, or equivalent) Operating Temperature Range (ambient): At 0 to 90% Relative Humidity (non-condensing) 32 to 104°F 0 to 40°C Storage Temperature (ambient): At 0 to 70% Relative Humidity (non-condensing) –4 to 122°F –20 to 50°C 3.3 Capabilities The following tables detail the MODIS™ Lab Scope Plug-in capabilities. Table 3-1 Multimeter Function Range Accuracy/Comments Channels 1–2 Common Grounds Sample Rate 6 MSPS 1.5 MSPS Simultaneous Continuous per channel MSPS = mega samples per second Bandwidth DC–3 MHz 3 db point @ 3 MHz Input Impedance 10 M @ DC 5.8 k @ 3 MHz All channels V dc (Full Scale) 75 V maximum V ac (Full Scale) Peak to Peak Voltage 50 V maximum Table 3-2 Digital Meter Ohms and Diode Continuity tests Function Channels Range Accuracy/Comments Inputs between channels 3 (–) and 4 (+) 3–4 Input Impedance 10 M Glitch capture Approximately 50 uS Ohms 400 –40 M Diode Test 2 V Scale 11 Fixed scales or Auto Ranging Introduction Leads, Probes and Adapters Table 3-3 Scope Function Range Accuracy/Comments Channels 1–4 Common grounds Sample Rate CH1 = 6 MSPS CH2 = 3 MSPS CH3–4 = 1.5 MSPS Continuous MSPS = mega samples per second Bandwidth DC–3 MHz 3 db point @ 3 MHz Input Impedance 10 M@ DC 5.8 k@ 3 MHz All channels V dc (Full Scale) 100 mV–400 V V ac (Full Scale) Peak to Peak Voltage 100 mV–400 V 3.4 Leads, Probes and Adapters The Lab Scope Plug-in uses standard safety banana plugs that are compatible with many accessories. Your kit comes with the various leads, probes, clips, and adapters explained in this section. See “Connecting Leads and Adapters” on page 4 for more information. IMPORTANT: When removing leads from their sockets, do not pull on the wire because it can damage the leads. Pull on the plug. 3.4.1 Channel 1 Lead Figure 3-3 Yellow Channel 1 Lead The shielded yellow lead is used for Channel 1 (Figure 3-3) and other channel connections that need additional grounding. The lead color matches the color of the CH1 socket on the Lab Scope Plug-in unit and the trace color of Ch 1 on the test screens. This yellow lead includes a black, rightangle, common ground plug and a black, stackable, right-angle, common ground plug. 12 Introduction Leads, Probes and Adapters 3.4.2 Channel 2 Lead Figure 3-4 Green Channel 2 lead The shielded green lead (Figure 3-4) is used for Channel 2. The lead color matches the color of the CH2 socket on the Lab Scope Plug-in and the trace color of Ch 2 on the test screens. This green lead includes a stackable, black, right-angle, ground plug. 3.4.3 Channel 3 Lead Figure 3-5 Blue Channel 3 lead The non-shielded blue lead (Figure 3-5) is used for Channel 3 or Digital Meter minus (-). The lead color matches the color of the CH3 socket on the Lab Scope Plug-in and the trace color of Ch 3 on the Lab Scope test screen. 3.4.4 Channel 4 Lead Figure 3-6 Red Channel 4 lead The non-shielded red lead (Figure 3-6) used for Channel 4 or Digital Meter plus (+). The lead color matches the color of the CH4 socket on the Lab Scope Plug-in and the trace color of Ch 4 on the Lab Scope test screen. 3.4.5 Alligator Clips Figure 3-7 Alligator clip Four insulated alligator clips are included and colored to match each test lead, plus a black clip for the common ground lead (Figure 3-7). Each clip plugs into the straight end of the channel leads. 13 Introduction Leads, Probes and Adapters 3.4.6 Test Probes Figure 3-8 Test probe Two test probes are included, one black and one red (Figure 3-8) and plug into the straight end of the test leads. 3.4.7 Secondary Coil Adapter Lead Figure 3-9 Secondary Coil Adapter lead The Secondary Coil Adapter lead (Figure 3-9) connects to the clip-on secondary wire adapter, coil-in-cap adapter or coil-on-plug adapter to display secondary waveforms. 3.4.8 Secondary Ignition Clip-on Wire Adapter Figure 3-10 Secondary Ignition Clip-on Wire Adapter The Secondary Ignition Clip-on Wire Adapter (Figure 3-10) connects the Secondary Coil Adapter lead to the vehicle Secondary wire to display ignition patterns. 3.4.9 Inductive RPM Pickup Adapter Figure 3-11 Inductive RPM Pickup adapter The Inductive RPM Pickup adapter (Figure 3-11) connects to the AUX port with a DB9F plug to trigger a waveform or display RPM. When used with the Ignition Scope, it connects to cylinder number one to establish proper cylinder order. 14 Navigation Chapter 4 This section provides Lab Scope Plug-in navigation information. For detailed information on general MODIS™ navigation, refer to the MODIS™ Display User Manual. 4.1 Screen Layout The Scope screens (Figure 4-1) include an upper toolbar, a main body, and a lower toolbar. Available buttons and controls vary depending on the active mode and stage of operation. Figure 4-1 Sample Lab Scope Plug-in screen 1— Upper toolbar 2— Main body 3— Lower toolbar 4.1.1 Upper Toolbar The upper toolbar controls vary depending on the module and stage of operations (Table 4-1). Table 4-1 Upper toolbar controls (part 1 of 2) Name Button Description View Lets you change the way data displays Pause Stops data collection and lets you review the buffered data 15 Navigation Screen Layout Table 4-1 Upper toolbar controls (part 2 of 2) Name Button Description Play Continuously captures data and stores it in the Data Buffer Cursors Lets you make digital amplitude, frequency, and time measurements Review Lets you adjust how the paused data scrolls on-screen for reviewing Snapshot Lets you capture data when a problem occurs while driving, and when you want to capture data before and after a problem occurs Zoom Lets you change the magnification of the paused data Reset Lets you clear the Min/Max data for all digital gauges Save Lets you store data and settings in memory Print Lets you print the displayed screen Setup Lets you change the way information appears on-screen and enter vehicle system information Data Buffer The Data Buffer is located just below the upper toolbar buttons and indicates how much test data is stored. When the screen is paused, the position indicator displays the current frame number and the amount of data on the screen relative to the total data captured. The Data Buffer cannot be highlighted or selected. 4.1.2 Main Body The main body of Lab Scope Plug-in test screens displays the following: • • • • Channel status information Digital or graphical test results Saved data Cursors 4.1.3 Lower Toolbar The lower toolbar controls vary depending on the active mode and stage of operation (Table 4-2). 16 Navigation Making Selections Table 4-2 Lower toolbar controls Name z Button Description Channel number Lets you select the channel to adjust Probe Displays the current test connection for the channel Scale Displays the current units of measurement for the channel cal Indicates when a channel is calibrated or not Signal Zero Offset Moves the selected channel’s zero (0) position up or down within the test display area Raster Spacing Adjusts the vertical spacing between the cylinders in the Ignition Scope Raster pattern Sweep Sets the amount of time displayed across the screen Trigger Type Sets the criteria used to start the display of data–there are three types of Trigger settings: None, Channel, and Cyl Slope Lets you change the Trigger edge for the specified channel from rising to falling Trigger Position Moves the trigger point for the specified channel–it can be moved up, down, left, or right Sensitivity Adjustment Lets you adjust the ignition scope sensitivity To move between the upper and lower toolbars: • Press the up b and down d arrows. When Easy Scroll is active, press the N/X button to move to the upper toolbar. Refer to the MODIS™ Display User Manual for more Easy Scroll information. 4.2 Making Selections Making selections consists of moving the cursor highlight using the Thumb Pad and pressing the Y/a to complete the selection. When a right c arrow displays to the right of a menu option, you can select from a submenu. For more information, refer to the Navigation chapter in your MODIS™ Display User Manual. 17 Chapter 5 Multimeter Operations This section explains the Multimeter menu and operations. Figure 5-1 Multimeter selection from main menu The following is an outline of basic Multimeter software operation. 1. Select Multimeter software—Select the type of Multimeter software and a test configuration for the selected tool. See “Selecting Multimeter Software” on page 18. 2. Connect test leads—Connect appropriate leads and clips to the Lab Scope Plug-in unit. See “Connecting Leads and Adapters” on page 4. 3. Connect the Lab Scope Plug-in to the vehicle—Procedures will vary. 4. Perform the test—Set up, test, and evaluate test results. See “Performing Multimeter Tests” on page 20. 5.1 Selecting Multimeter Software There are two types of Multimeter tools available: • Graphing Meter (See “Graphing Meter” on page 19) • Digital Meter (See “Digital Meter” on page 20) z To select a Multimeter option: 1. From the main menu, select Multimeter > Graphing Meter or Digital Meter. 2. Select a test option. 18 Multimeter Operations Selecting Multimeter Software 5.1.1 Graphing Meter Selections from the Graphing Meter menu configure your MODIS™ unit to function as a color graphing meter. Table 5-1 describes the test options available. Table 5-1 Graphing Meter test options Option Function Dual Graphing Meter Displays two channels automatically Volts DC Measures direct current voltage Volts DC-Average Measures direct current and uses a filter to remove excess noise/ hash on the signal Volts AC rms Measures the effective voltage rather than the Peak or Average voltage Frequency Measures the number of times a signal repeats itself per second Pulse Width Measures the on-time of various components Injector Pulse Width Measures the on-time of the signal that activates the fuel injector Duty Cycle Measures the ratio of the pulse width to the complete cycle width, the on-time of components that cycle on and off like EGR, or canister purge from 0–100% Low Amps (20) Measures current from components like ignition coils, injectors, fuel pumps and parasitic draw using the Low Amp Probe Low Amps (40) Measures current from components like fans and electric motors using the Low Amp Probe MC Dwell (60) Measures carburetor Mixture Control Solenoids (0–60°). The duty cycle of the solenoid is expressed in the dwell angle of a 6 cylinder engine: 100% = 60 deg = 360/6. MC Dwell (90) Measures fuel system Mixture Control Solenoids (0–90°). The duty cycle of the solenoid is expressed in the dwell angle of a 4 cylinder engine: 100% = 90 deg = 360/4. 100 psi Vacuum Measures engine vacuum 0–20 inHg using the 0–100 PSI Transducer 100 psi Pressure Measures fuel systems, engine oil, and transmissions using the 0–100 PSI Transducer 500 psi Pressure Measures transmissions, compression, and AC high side pressure using the 0–500 PSI Transducer 5000 psi Pressure Measures ABS, power steering, and heavy-duty hydraulic systems using the 0–5000 PSI Transducer 19 Multimeter Operations Performing Multimeter Tests 5.1.2 Digital Meter Selections from the Digital Meter menu configure your Lab Scope Plug-in to function as a Digital Volt Ohm Meter (DVOM). Table 5-2 describes the test options available. Table 5-2 Description of Digital Meter test options Option Use Volts DC Measures direct current voltage (GND and CH1) Volts DC-Average Measures direct current and uses a filter to remove excess noise/ hash on the signal (GND and CH1) Volts AC rms Measures the effective voltage rather than the Peak or Average voltage (GND and CH1) Ohms Measures electrical resistance (CH3 and CH4) Diode/Continuity Measures voltage drop across a diode or continuity (CH3 and CH4) Low Amps (20) Measures current from components like ignition coils, injectors, fuel pumps and parasitic draw using the Low Amp Probe (GND and CH1) Low Amps (40) Measures current from components like fans and electric motors using the Low Amp Probe (GND and CH1) 5.2 Performing Multimeter Tests After connecting the Lab Scope Plug-in to the test vehicle, you can proceed with testing. Button and menu option availability vary depending on your test selection. When performing tests with the Multimeter, the toolbars and controls work the same as those in the Scope. 5.2.1 Changing Views The VIEW button lets you change the way data displays. z To change screen views: 1. Select View. The dropdown menu displays (Figure 5-2). Figure 5-2 Sample Graphing Meter VIEW menu 2. Select Full Digital, Full Graph or Split Screen, which combines the display of graph and digital data. The screen changes to reflect your selection. 20 Multimeter Operations Performing Multimeter Tests 5.2.2 Pausing Data The Pause button stops data collection and lets you review data. The screen can be paused at any time. z To Pause test screen data: • Press the Pause button. The displayed data is no longer being updated, and the following three upper toolbar controls also change: – – – – z The Pause button replaces the Play button. The Position Indicator displays in the Data Buffer. The Review button is active. The Zoom button replaces the Snapshot button. To unpause test screen data: • Press the Play button. Live data displays and the toolbar controls revert to their original state. Reviewing Data The Review button is used with the Thumb Pad to review paused data. There are two ways to review data: • Manually • Automatically z To manually review data: 1. Select the Pause button. 2. Select the Review button. 3. Use the right c and left e arrows to review data one frame at a time. 4. Use the up b and down d arrows to review data a fraction of a frame at a time when possible. i NOTE: You can not review fractions of frames in the Ignition Scope. z To automatically scroll paused data: 1. With the Review button selected, press Y/a again to display the menu of scroll options. 2. From the Review menu, select an option. – Auto Scroll Fast automatically scrolls the data on-screen at full-speed. – Auto Scroll Slow automatically scrolls the data on-screen at half-speed. 3. Press N/X to close the menu. The Position Indicator displays the position of the current frame. Zero denotes the frame when the button was pressed. Frames captured before pausing are negative (–); frames captured after are positive (+). 21 Multimeter Operations Performing Multimeter Tests 5.2.3 Using Zoom The Zoom button lets you choose a macro view of the data and appears in place of the Snapshot button when the display is paused. z To zoom the view of paused test screens: 1. Select Zoom. A dropdown menu displays. 2. Select an option from the menu. The screen changes to reflect your selection and the on-screen Zoom Cursor Line displays. 3. To see a point of interest in detail: a. Select Review. b. Use the left e and right c arrows to move the Zoom Cursor Line. c. Select Zoom > 1x. 5.2.4 Using Cursors The Cursors button lets you make digital amplitude, frequency, and time measurements of paused and live data. z To use the cursors: 1. Select the Cursors button. Two vertical cursor lines display on-screen. Figure 5-3 Cursors sample screen 2. Press the right c and left e arrows to move the selected cursor line. 3. Press Y/a to change the active cursor. 4. Press N/X when you are finished setting cursors. A confirmation message displays asking how you want to proceed using cursors. 5. Press Y/a or N/X as desired. 22 Multimeter Operations z Performing Multimeter Tests To turn cursors off: 1. Select Cursors. 2. Press N/X twice. The cursor lines disappear. 5.2.5 Taking Snapshots The Snapshot button lets you capture data before and after a problem occurs while driving. z To take a snapshot: 1. Select the Snapshot button. A dropdown menu displays. 2. Select Manual. The Snapshot button blinks, indicating that Manual Snapshot mode is armed. 3. Press Y/a to take a snapshot. The Collecting Snapshot message displays, indicating that Snapshot data is being collected. When the Snapshot finishes saving, a final confirmation message displays. When the confirmation message disappears, you are returned to the test screen with the blinking Snapshot button still armed. 4. Press N/X to disarm Snapshot. i NOTE: The saved snapshot can be retrieved from Save Data. Refer to the MODIS™ Display User Manual for details. Changing Snapshot Settings You can set up a snapshot in the following ways: • Select the file type—snapshot images can be saved as a bitmap or jpeg file. • Adjust the percentage after trigger—snapshots can be between 10% and 90% data captured after triggering. • Save to different locations—snapshots can be saved to the MODIS™ internal memory or to the CF card in the top slot. z To change Snapshot settings: 1. From the MODIS™ main menu, select Utilities > Tool Setup > Save Data. The Save Data dialog box displays (Figure 5-4). Figure 5-4 Sample Save Data dialog box 23 Multimeter Operations Performing Multimeter Tests 2. Select the File Type dropdown menu. 3. Select a file type setting. 4. Select the % After Trigger dropdown menu. 5. Select a % After Trigger setting. 6. Press N/X to close the dialog box. 5.2.6 Resetting Gauges The Reset button lets you clear the min/max values recorded for all digital gauges. Use the Reset button to: • Track the variation in a component or circuit under a certain condition. If the condition changes, Reset lets you start tracking again to see the change. • Verify that a connection problem you found by looking for a dropout or spike in min/max values has been fixed. z To reset the min/max digital values: • Select Reset. A confirmation message displays. When the reset is complete, the confirmation message disappears. 5.2.7 Saving Data The Save button lets you store data in memory. z To save data: 1. Select the Save button. A dropdown menu displays. 2. Select an option: – Save Movie—This feature allows you to save up to 2000 frames of data (buffered data plus data transmitted after triggering). – Save Frame—This feature allows you to save up to 512 frames of buffered data (data held in scan tool memory). – Save Image—This feature allows you to capture a single screen as an image. Image files can be opened with common computer programs, such as Microsoft Paint. The Setup Saved Data Notation dialog box displays. 3. Select from the menus to set preferences as necessary. The Setup Saved Data Notation dialog box works the same as the Edit Saved Data Notation dialog box found in the Saved Data mode. Refer to the MODIS™ Display User Manual for operating details. i NOTE: If you plan to save many screens from the same vehicle, select Yes for Keep Entries. This preference retains your settings the next time you select Save. 24 Multimeter Operations Performing Multimeter Tests 4. When you are finished setting preferences, select Save. A confirmation message displays with saved data retrieval instructions. 5. Press Y/a to close the confirmation message. 5.2.8 Printing The Print button lets you print the displayed screen. i NOTE: Selecting Inverse Colors from the Setup button menu reduces the amount of ink used by your printer when printing files. z To print: 1. Select the Print button. A dropdown menu displays. 2. Press Y/a. The screen prints according to your printer settings. Refer to the MODIS™ Display User Manual for printer setup details. i NOTE: Make sure the infrared transceiver on top of the MODIS™ unit is pointed at the infrared transceiver of the printer and there is nothing in between them. 5.2.9 Using Setup The Setup button lets you change the way information displays. z To use Setup: 1. Select the Setup button. A dropdown menu displays. 2. Select one of the following options: – – – – – Units Grid Scales Display Inverse Colors Save Data Units Selecting Units opens the Units dialog box (Figure 5-5), which lets you change the displayed units of measurement for vacuum, pressure, and gas concentration. 25 Multimeter Operations Performing Multimeter Tests Figure 5-5 Sample Units dialog box The Display As dropdown menu sets how the scale units are displayed on the Scale button and in the Channel Status area. The Scale button, on the lower toolbar, displays the scale setting for the currently selected channel. The Channel Status area, at the top of the test portion of the screen, displays the scale settings for all channels. There are three Display As scale unit options: • Units/Division—the scale value for a major grid division is displayed in the Channel Status Area and the Scale button. • Full Scale—the scale value for the whole grid is displayed in the Channel Status Area and the Scale button. • Factory Default—the Channel Status area displays the Units/Division for all active channels and the Scale button displays the full scale value. i NOTE: The Units dialog box can also be accessed from the Utilities menu located on the Tool Setup submenu as described in the MODIS™ Display User Manual. z To change units: 1. Select Setup > Units. The Units dialog box displays. 2. Change the unit values as needed. 3. Press N/X to close the dialog box. Grid Selecting Grid displays the background grid pattern on all graphing test screens. z To turn the grid on: • Select Setup > Grid. A grid appears in the test area. Scales Display Selecting Scales Display displays the scale values on the graph. z To turn Scales Display on: • Select Setup > Scales Display. The scale values appear along the X (horizontal) and Y (vertical) axis of the graph. 26 Multimeter Operations Performing Multimeter Tests Inverse Colors Selecting Inverse Colors changes the color scheme. z To change the color scheme: • Select Setup > Inverse Colors. The color scheme changes to a lighter background with darker traces. This selection reduces the amount of ink used when printing screens. Save Data Selecting Save Data opens the Save Data dialog box, which is used to configure how data is saved. This allows you to quickly reset save options without returning to the main menu. 5.2.10 Calibration Indicator The cal LED, in the lower toolbar, indicates whether a channel is calibrated or not during Ohms, Diodes, Continuity, or Pressure transducers testing. The LED is: • Green—when calibrated • Red—when not calibrated (using previous calibration values) When you select Ohms, Diodes, Continuity, or Pressure transducers tests, a message similar to the one below displays with instructions to assist you with the calibration process. 5.2.11 Adjusting Channel Settings The Channel control bar (Figure 5-6) lets you adjust channel settings and viewing characteristics. Figure 5-6 Sample Channel control bar 1— Channel Number 2— Probe 3— Scale 4— Signal Zero Offset 5— Threshold Channel Number The Channel Number button lets you select channel options. • Channel One (Ch 1) is automatically displayed and cannot be turned off. • Channel Two (Ch 2) can be manually selected for display. 27 Multimeter Operations i Performing Multimeter Tests NOTE: Both channels automatically display in the Dual Graphing Meter. The following channel options are available: • Displayed makes a channel’s waveform visible. • Peak Detect captures fast events, spikes and glitches for signals going in both positive and negative directions. • Filter minimizes unwanted noise in the Graphing Meter. z To display Channel Two: 1. Select the Channel Number button from the Channel control bar. The channel setup menu displays. 2. Select Ch 2 > Displayed. The Channel Two trace displays. 3. Press N/X to close the menu. z To change the channel setup: 1. Select the Channel Number button from the Channel control bar. The channel setup menu displays. 2. Select the channel you want to change (Ch 1 or Ch 2). 3. Select the Peak Detect or Filter channel setup option. See “When To Use Peak Detect” on page 48 and “When to Use Filter” on page 54 for details. Probe The Probe button lets you select a different test. z To select a different test: 1. Select the Probe button. The Probe menu displays. 2. Select an option. The Probe button changes to indicate your selection. Scale The Scale button lets you select a measurement scale for each channel. z To select a measurement scale: 1. Select the Scale button to open the Scale menu. 2. Select an option. The Scale button and the waveforms on-screen change to reflect your selection. 28 Multimeter Operations Performing Multimeter Tests Signal Zero Offset The Signal Zero Offset button moves the zero (0) position of the selected channel up or down. z To move a zero position: 1. Select the Signal Zero Offset button. The button appears depressed and highlighted to indicate that the function is on (Figure 5-7). Figure 5-7 Sample Signal Zero Offset selection 2. Press the up b or down d arrows as needed to move the zero point (Figure 5-8). Figure 5-8 Sample zero position 3. Press N/X to exit the function. 29 Multimeter Operations Performing Multimeter Tests Threshold The Threshold button changes the reference point on the waveform and is only used when calculating measurements such as frequency, duty cycle, MC dwell and pulse width. There are two threshold options: • Auto Threshold Select (ATS)—automatically picks a threshold level in the middle of the range in which the waveform travels. ATS defaults to a falling edge. • Manual Threshold Select (MTS)—lets you manually pick a signal level and direction to use as a reference point. This is used if ATS picks a level that does not give the desired result. z To change the threshold level: 1. Select the Threshold button. The Threshold menu displays. 2. Select an option. z To use the Manual Threshold option: 1. Select Manual Threshold Select as described in the previous procedure. The Manual Threshold Select dialog box displays (Figure 5-9). Figure 5-9 Sample Manual Threshold Select dialog box The Signal Min and Max display to the left and right of the Threshold value for reference. Measuring the Min and Max may take a few seconds. 2. Change the Threshold value and the Slope, as needed. i NOTE: Threshold can only be changed to a value that is between the Min and Max of the signal. 3. Press N/X to exit the dialog box. 5.2.12 Setting the Sweep Time The Sweep button sets the amount of time data crossed the screen from left to right. z To change the sweep time: 1. Press the Sweep button. The dropdown menu displays. 2. Select an option. i NOTE: Sweeps shorter than 1 second will collect some frames after the Pause button is selected. The faster the sweep, the more frames will be collected. 30 Chapter 6 Scope Operations This section explains the Scope menu and operations. i NOTE: Most of the Scope toolbars and controls work the same as the Multimeter. Only the differences are covered in this section. Figure 6-1 Scope selection from main menu The Scope menu offers the following options (Figure 6-1): • Lab Scope • Ignition Scope • Presets The following is an outline of basic Scope software operation. 1. Select Scope Software—Select the type of Scope software and a test configuration for the selected tool. See “Selecting Scope Software” on page 31. 2. Connect test leads—Connect appropriate leads and clips to the Lab Scope Plug-in unit. See “Connecting Leads and Adapters” on page 4. 3. Connect the Lab Scope Plug-in to the vehicle—Procedures will vary. 4. Perform the test—Set up, test, and evaluate test results. See “Performing Scope Tests” on page 35. 6.1 Selecting Scope Software There are two types of scope tools available: • Lab Scope (See “Lab Scope” on page 32) 31 Scope Operations Selecting Scope Software • Ignition Scope (See “Ignition Scope” on page 32) The following procedures explain how to select a scope tool. z To select scope software: 1. From the main menu, select Scope > Lab Scope or Ignition Scope. 2. Select a test configuration. 6.1.1 Lab Scope Selections from the Lab Scope menu configure your Lab Scope Plug-in to function as a four-channel display. Table 6-1 describes the available test options. Table 6-1 Lab Scope test configuration options Option Function 4 Ch Lab Scope Displays four channels automatically Volts DC Measures direct current voltage Low Amps (20) Measures current from components like ignition coils, injectors, fuel pumps and parasitic draw using the Low Amp Probe Low Amps (40) Measures current from components like fans and electric motors using the Low Amp Probe Ignition Probe Measures secondary ignition system voltage using a secondary coil adapter lead and pickups 100 psi Vacuum Measures engine vacuum 0–20 inHg using the 0–100 PSI Transducer 100 psi Pressure Measures fuel systems, engine oil, and transmissions using the 0–100 PSI Transducer 500 psi Pressure Measures transmissions, compression, and AC high side pressure using the 0–500 PSI Transducer 5000 psi Pressure Measures ABS, power steering, and heavy-duty hydraulic systems using the 0–5000 PSI Transducer 6.1.2 Ignition Scope The Ignition Scope module configures the MODIS™ unit to view a secondary waveform using preset ignition pattern display options: • • • • • Parade Cylinder Raster Superimposed Single Cylinder Ignition Each of these options are explained in “Ignition Patterns” on page 33. Connecting to all cylinders of an engine at the same time simplifies cylinder comparison in the following ways: • All cylinders can be viewed at once. 32 Scope Operations Selecting Scope Software • Each cylinder is displayed once per screen in firing order and is displayed in the same location on-screen. • The same pattern is displayed regardless of engine RPM. The Ignition Scope requires the use of two leads. • Secondary Coil adapter–to display the secondary waveform • Inductive RPM Pickup adapter–to identify cylinder number one for proper cylinder order display. Refer to “Connecting Leads and Adapters” on page 4 for more details. • RPM can be calculated from either the gray Inductive RPM pickup adapter or the Secondary Coil adapter. If only the RPM or Secondary Coil adapter is used, RPM will be calculated from whichever lead is connected. If both leads are connected, RPM will be calculated from the gray Inductive RPM pickup. i NOTE: The optional SIA 2000 Adapter Kit is required to connect to multiple cylinders at once on Wasted Spark distributorless ignition systems. Contact your sales representative for details. Note the following regarding Ignition Scope synchronization: • Synchronization to cylinder number one may take several seconds after the engine starts. • Cylinder firings may be observed to change position during the synchronization process. • If the Ignition Scope settings are changed, cylinder synchronization reoccurs. i NOTE: When testing Wasted Spark systems, power firings will display on Channel One and wasted on Channel Two. Ignition Patterns Four ignition pattern options are available to view and compare the secondary waveform for all engine cylinders. • The Parade pattern displays the secondary waveform for each cylinder in the firing order from left to right across the screen. • The Cylinder pattern displays the secondary waveform for the selected cylinder. • The Raster pattern displays the secondary waveform for each cylinder in the firing order, starting with cylinder number one at the bottom. • The Superimposed pattern displays the secondary waveform for each cylinder in the firing order stacked on top of each other. The Single Cylinder Ignition option configures the MODIS™ unit to connect to an individual cylinder using a fixed time sweep when a lead is not available to connect to all cylinders. Ignition Scope Probe The Channel One (Ch 1) Probe button setting is restricted to Ignition Probe. The Channel Two (Ch 2) Probe button setting is not restricted and functions the same as in the Lab Scope. See “Probe” on page 39. 33 Scope Operations Selecting Scope Software Sensitivity Adjustment The Sensitivity Adjustment button at the far right of the lower toolbar lets you set the detection sensitivity to cylinder firings. The lower the setting, the more sensitive the ignition scope will be for detecting cylinder firing. Adjusting the sensitivity and improve cylinder detection increases the range of vehicles that can be tested and the range of secondary pickups that can be used. z To adjust cylinder firing detection sensitivity: 1. Select the Sensitivity Adjustment button. The button appears depressed and remains highlighted to indicate that the function is on. 2. Press the up b or down d arrows as needed to reposition the level indicator on the left of the graph (x-axis). i NOTE: Unless you are having problems detecting cylinders, a sensitivity setting of 2.0 kV is optimal for many ignition systems. 3. When you are finished setting the sensitivity, press N/X to deselect the button. i NOTE: With Wasted Spark ignition systems, the sensitivity level setting only displays on Channel 1, but the setting applies to both channels. See “Using Sensitivity Adjustment” on page 59 for usage details. Missed Cylinder Detection When a cylinder firing is not detected because it is either firing too low to be detected at the current setting or is not firing at all, a blank space displays in the on-screen pattern. z To verify a missed cylinder firing: • Lower the sensitivity setting to verify that the cylinder is firing, but firing too low to be detected at the current sensitivity setting. If a cylinder is not firing at all, the blank space on the graph will remain. See “Sensitivity Adjustment” on page 34 for more details. Digital kV View When using the ignition scope, the Digital kV view selection (available from the View button on the upper toolbar) displays the digital kV readings corresponding to the selected channel of the ignition scope. This provides another way to monitor the secondary ignition system. When testing Wasted Spark ignition systems, Power firings display on channel one and Wasted Spark firings display on channel two. 34 Scope Operations i Performing Scope Tests NOTE: The digital values are only as good as the source waveform. If there is a problem with the lead connection or set up and a stable waveform is not displayed, the digital value may not be calculated correctly. If problems are experienced with the digital values, check lead connections and Ignition Setup. If a measurement cannot be calculated, dashes display in place of values. Firing kV, Spark kV, and Spark Duration (burn) measurements are calculated from the secondary waveform. • Firing kV (FKV)—voltage required to overcome the rotor and spark plug gaps and establish a spark across the spark plug electrodes. • Spark kV (SKV)—voltage required to maintain a spark across the spark plug electrodes. • Spark Duration (Burn)—time the spark is maintained across the spark plug electrodes. Min/Max and current values for Firing kV, Spark kV, and Spark Duration are displayed as digital values for each cylinder in the firing order. Intermittent problems that happen too fast to be seen on the live waveform will be captured in the Min/Max reading, making it possible to spot problems that can be difficult to see in the live waveform. Multiple Spark Ignition Systems On vehicles with multiple spark ignition systems, when more than one spark per cylinder is present, Firing kV (FKV) is calculated at the start of the first spark and Spark kV (SKV) and Burn are calculated from the last spark. z To calculate the Digital kV and Burn measurements: • Select an ignition pattern with a 10 ms sweep, such as Parade 10 ms or Cyl 10 ms when testing a multiple spark system. IMPORTANT: Digital kV cannot be correctly calculated if, in the Ignition Scope view, the end of the last spark for each cylinder is near the end of the screen or off of the screen. 6.2 Performing Scope Tests When performing tests with the Scope, the toolbars and controls work the same as those in the Multimeter. The following explains the differences. 6.2.1 Changing View The View button lets you change the way data displays. z To change screen views: 1. Select View. The dropdown menu displays. 35 Scope Operations Performing Scope Tests 2. Select an option from the menu. The screen changes to reflect your selection. 6.2.2 Saving Data The Save button lets you store data and scope settings. z To save scope settings: 1. Select Save. The dropdown menu displays. 2. Select a save option: – Save Movie—This feature allows you to save up to 2000 frames of data (buffered data plus data transmitted after triggering). – Save Frame—This feature allows you to save up to 512 frames of buffered data (data held in scan tool memory). – Save Preset—This feature allows you to save the current scope settings as a preset. – Save Image—This feature allows you to capture a single screen as an image. Image files can be opened with common computer programs, such as Microsoft Paint. Presets A preset is the configuration of your screen setup preferences. Saved presets can be used for later testing. See “Using Presets” on page 41 for more information. z To save a preset: 1. Select Save. A dropdown menu displays. 2. Select Save Preset. A confirmation message displays with saved preset retrieval instructions. 3. Press Y/a to close the confirmation message. 6.2.3 Using Setup The Setup button on the upper toolbar lets you change the way information appears on-screen. See “Using Setup” on page 25 for information about the previously-covered options: Units, Grid, Scales Display, Inverse Colors, and Save Data. The following sections cover the Lab Scope-specific Setup menu options Ignition System and Trigger Display. 36 Scope Operations Performing Scope Tests Ignition System Before ignition testing can begin, the ignition system type and relevant parameters should be selected. Selecting Ignition System displays the Ignition System dialog box (Figure 6-2) that lets you select the following for the test vehicle: • • • • • • Ignition Type Cylinders Firing Order #1 Trigger (Inductive RPM Pickup connection) Polarity RPM Factor Figure 6-2 Sample Ignition System dialog box The following ignition types and settings are available: • Standard (Coil)—The Inductive RPM Pickup connects to the coil wire on a distributor system. Set the number of cylinders and cylinder firing order. • Standard (Plug)—The Inductive RPM Pickup connects to a plug wire on a distributor system. Set the number of cylinders and cylinder firing order. • Wasted Spark—The Inductive RPM Pickup connects to a plug wire on a wasted spark distributorless system. Set the number of cylinders, cylinder firing order, and polarity. Be sure the firing order and cylinder firing polarity values are correctly set up before using the Ignition Scope to test Wasted Spark systems. • Direct—The Inductive RPM Pickup connects to plug wire (if applicable) on a direct ignition system. Set the number of cylinders and cylinder firing order. If connecting the inductive RPM lead to display RPM, the lead can be connected to any plug wire that is accessible. If using the Ignition scope, the lead must be connected to the #1 spark plug wire so that the cylinders firings are displayed in the correct order. • Other—The Inductive RPM Pickup connects to a plug or a coil wire. Set the RPM factor appropriate for the test vehicle. The Ignition System dialog box can also be accessed from the Utilities > Tool Setup menu. Refer to your MODIS™ Display User Manual for more information. Inductive RPM Pickup Testing Tips: • When only the Inductive RPM Pickup lead is connected to display RPM, the lead can be connected to any plug wire that is accessible. • When using the Ignition Scope, the Inductive RPM Pickup lead must be connected to the #1 spark plug wire so that the cylinder firings are displayed in the correct order. 37 Scope Operations z Performing Scope Tests To change Ignition System settings: 1. Select Setup > Ignition System. The Ignition System dialog box displays. 2. Select the Ignition System values as needed. 3. Press N/X to close the dialog box. Trigger Display Selecting Trigger Display turns on the Trigger position values located in the bottom right corner of the test area. When Trigger Display is not selected, trigger position values only display when the trigger position button is selected on the lower toolbar. z To display trigger values: • Select Setup > Trigger Display. The Trigger values display in the bottom right corner of the test area. 6.2.4 Adjusting Channel Settings The Channel control bar (Figure 6-3) lets you adjust Lab Scope channel settings and viewing characteristics for the selected trace. Figure 6-3 Sample Lab Scope Channel control bar 1— Channel Number 2— Probe 3— Scale 4— Signal Zero Offset 5— Raster Spacing Channel Number The Channel Number button lets you select channel options. There are four channels available for use in the Lab Scope. In addition to —Displayed and Peak Detect, explained in “Adjusting Channel Settings” on page 27,—Lab Scope also includes: • Inverted—flips the selected waveform upside-down. This is typically used when testing secondary ignition or displaying waveforms from the Low Amps Probe. 38 Scope Operations Performing Scope Tests • Coupling AC—subtracts the average value of a waveform to see small variations, which is ideal for viewing alternator ripple or fuel pump amps. This blocks the DC portions of an input signal in order to amplify the AC portions without driving them off the center of the screen. • Auto Find—picks the best scale to fit the selected signal pattern on the screen. If run on the same channel as the trigger, the trigger level is set halfway between the minimum and maximum values of the waveform. i NOTE: When testing with the Single Cylinder Ignition scope, the Channel 1 Peak Detect option cannot be turned off. Probe The Probe button lets you select a different test. i NOTE: Calculated measurement tests are only available in the Graphing Meter. Refer to “Probe” on page 28 and “Ignition Scope Probe” on page 33 for more details. 6.2.5 Displaying Triggers Use the Display Trigger control bar (Figure 6-4) to set the criteria to start the display of data. Figure 6-4 Sample Display Trigger control bar 1— Trigger Type 2— Slope 3— Trigger Position Trigger Type Selecting Trigger Type lets you set the criteria used to start the display of data. Available Trigger Type menu options include: • None—displays data as fast as it is received. • Ch 1/2/3/4—triggers the display based on the signal from the selected channel. Available submenu options include: – Auto—updates the screen when the signal crosses the trigger threshold in the selected direction (rising or falling). Even if the signal does not cross the trigger threshold, the screen automatically updates after a short period so you can see the waveform, which lets you set a threshold to optimize viewing. 39 Scope Operations Performing Scope Tests – Normal—updates the screen when the signal crosses the trigger threshold in the selected direction (rising or falling). If the signal does not cross the trigger threshold, the screen will not update which lets you capture intermittent events because the screen only updates when the signal meets your trigger selection. • Cyl—triggers the scope from the RPM lead signal. The lead detects the firing on the plug wire that the lead is connected to and the scope uses this signal to trigger the display. You can only adjust the time offset for this type of trigger. – Auto—updates the screen when the scope receives a signal from the RPM lead. Even if the signal does not receive a signal from the lead, the screen automatically updates after a short period so you can still see the waveform. – Normal—updates the screen when scope receives a signal from the RPM lead. If the scope does not receive a signal from the lead, the screen will not update. z To select a trigger type: 1. Select the Trigger Type button. The dropdown menu displays. 2. Select a cylinder triggering option. With the exception of None, a submenu displays. 3. Select Auto or Normal from the submenu. – When a Channel trigger (Ch1–4) is selected, a plus sign (+) colored according to the channel it represents displays in the graph area. – When the Cyl trigger is selected, a white plus sign (+) displays along the bottom of the graph area which represents the point in time a cylinder is detected on the RPM lead. When you are finished setting the trigger modes, press N/X to close the menu. Trigger Slope The Trigger Slope button selects the direction the waveform must be going (rising or falling) when crossing the trigger point. i NOTE: This button is only available when a Channel is the active trigger type. Trigger Position The Trigger Position button is used for moving the trigger point for a specified channel either along the X (horizontal) or Y (vertical) axis of the display. i NOTE: This button is not available when None is the active Trigger type. z To move the trigger point: 1. Select the Trigger Position button. The trigger point marker becomes active. 40 Scope Operations Using Presets 2. Use the Thumb Pad to move the on-screen marker and select a new Trigger point. 3. When you are finished, press N/X. 6.3 Using Presets A preset is the configuration of your screen setup. The Presets option gives you access to all of your custom presets and factory-installed presets for commonly-tested components. Custom presets can be saved from any of the Scope tool Save menus. See “Saving Data” on page 36 for more details. The Presets Management screen (Figure 6-5) displays a list of all the available presets. Figure 6-5 Preset Management screen sample 1— Top slot CompactFlash® card indicator Displays which CF slot is selected in Setup. The left icon is the Top CF slot and the right icon is Master CF slot (Internal). The Top CF slot icon will be crossed out if there is no card in the slot when it is the selected destination. 2— Internal memory indicator Refers to the Master CF card in the side slot. The check mark indicates the active status 3— Memory usage indicator Indicates the remaining storage capacity for the active storage memory. i NOTE: Factory-installed presets, which are identified by a lock icon in the Type field, cannot be edited, deleted, copied or moved. See “Presets” on page 36 for information on saving a preset. The Preset Management screen has the following upper toolbar buttons: • Load opens an active test screen with the selected preset settings. 41 Scope Operations Using Presets • • • • • • z Edit lets you change the file name of a preset and add text to the note field. Delete removes the selected preset from the active storage location. Copy lets you copy the selected preset to the inactive storage memory. Move lets you move the selected preset to the inactive storage memory. Select All lets you select all of the files. Setup provides a shortcut to the Save Data utility dialog box that lets you set the location where presets are saved. To open the Preset Management screen: • From the main menu, select Scope > Presets. The Preset Management screen displays. z To exit the Preset Management screen: • Press N/X to return to the main menu. 6.3.1 Identifying Saved Presets Saved presets have the following characteristics: • Type is represented as a three-letter identifier, such as LS(C), where “LS” represents the module source (Lab Scope) and “(C)” represents the kind of captured data (Configuration). Preset source identifiers include: – LS = Lab Scope – IS = Ignition Scope • Size is the percentage of available storage space used. • Date/Time is the date and time that the preset was saved. • File Name is the name given when the preset was saved. 6.3.2 Loading Saved Presets The load button opens an active test screen with the selected preset. z To load a preset: 1. From the main menu, select Scope > Presets. The Preset Management screen displays. 2. Highlight a preset from the list. 3. Select the Load button. A scope screen displays with your selected preset configuration. 6.3.3 Editing Presets The Edit button lets you edit presets in the following ways: 42 Scope Operations Using Presets • Add notes • Change filename i NOTE: A USB keyboard (not supplied) is required to edit presets. z To edit a preset: 1. From the main menu, select Scope > Presets. The Preset Management screen displays. 2. Connect a USB keyboard to the USB port on top of the MODIS™ unit. 3. Highlight a preset from the list. 4. Select the Edit button. The Edit Preset Name And Note dialog box displays. i NOTE: The Notes and Name icons are not active if a keyboard is not plugged in. 5. Select Notes. The Additional Information section activates (Figure 6-6). Figure 6-6 Sample Note selection 6. Using your keyboard, type a text note (7 lines maximum), then press Esc to exit the Additional Information section. 7. Select Name. The File Name field is now active. 8. Using your keyboard, type a file name, then press Esc to exit the File Name field. i NOTE: If you do not provide a file name, a name is automatically created for you. 9. Select Save. After processing your edits, you return to the Preset Management screen. 6.3.4 Deleting Presets The Delete button deletes preset files from system memory. 43 Scope Operations z Using Presets To delete presets: 1. From the main menu, select Scope > Preset. The Preset Management screen displays. 2. Highlight a preset from the list. 3. Select the Delete button. A confirmation message displays. 4. Permanently remove the preset from memory by pressing Y/a. After processing your delete request, you are returned to the Preset Management screen. 6.3.5 Copying and Moving Presets The Copy and Move buttons let you change the storage location of your custom presets. These functions require the use of a CF card in the top slot. Copy and move presets go to the inactive CF card, which is the CF card that files are not being saved to. For example: If you designate the Top CF as your Save To storage memory preference, when you use the Copy and Move buttons, your selected preset goes to the Internal Memory. z To copy or move data: 1. Insert a CF card in the top slot (not supplied). 2. From the main menu, select Scope > Preset. The Preset Management screen displays. 3. From the upper toolbar, select Setup. The Save Data dialog box displays. 4. Select from the Save To options, and then press N/X to close the dialog box. This will be the storage memory you will be viewing and copying or moving presets from. 5. When selecting a file from the list on-screen, use the up b and down d arrows. 6. When selecting Copy or Move from the upper toolbar, use the right c and left e arrows. A confirmation message displays. 7. Press Y/a to close the dialog box and return to the Preset Management screen. z To verify the preset copied or moved: 1. Leave the top CF card installed. 2. From the upper toolbar, select Setup. The Save Data dialog box displays. 3. Select from the Save To options, and then press N/X to close the dialog box. When the Preset Management screen displays, you should see the preset(s) that you copied or moved from your source storage memory. 6.3.6 Selecting Multiple Presets The Select All button highlights all the presets so you can delete, copy, or move all of them at once. 44 Appendix A Testing Tips Keep the following information in mind when testing with the Lab Scope Plug-in. A.1 General Tips • Refer to the vehicle manufacturer test procedures and specifications before beginning a test. • When connecting an inductive pickup onto a spark plug wire, make sure the jaws of the pickup are firmly seated. • • • • • • Always make sure the test leads have clean, tight connections. When testing, periodically check the external lead connections to make sure they are secure. Never move the unit by pulling on the test leads. Do not drive or roll a vehicle, roll cab, floor jack, engine hoist, etc. over the test leads. Never set anything on the display device that could spill on it and allow liquid to run into it. Immediately clean any spills from the exterior of the display device, especially substances as gasoline, brake fluid, battery acid, cleaning solvents, penetrating oil, or other chemicals. • Connect the ground lead (black booted clip) to a good ground source. The negative battery terminal is the recommended ground connection. • When testing sensors, actuators, or other circuit components, refer to the manufacturer’s shop manual or the automotive repair manual for the proper test point(s). • Because of the high speed data acquisition capability, the Lab Scope or Graphing Meter should be used for glitch capture. • DO NOT position any cables where they can be trapped, snagged, stretched across sharp edges, or pose any type of potential hazard. • DO NOT place tools or test equipment on vehicle fenders or other places inside the engine compartment. • Keep test leads away from sources of electrical noise, such as the ignition system, injectors, and the alternator. • The shielded Channel 1 and 2 leads can be used to minimize unwanted noise and for testing high impedance circuits like oxygen sensor signals. A.2 Using the Split Lead Adapter The Split Lead adapter is used to connect the Pressure Transducer and the Inductive RPM Pickup adapter to the Lab Scope Plug-in.Use the following procedure to connect the Split Lead adapter (Figure A-1) to the Lab Scope Plug-in. z To connect the Split Lead Adapter: 1. Connect the Split Lead adapter plug to the AUX port on the Lab Scope Plug-in. 2. Connect the banana plugs to the Scope channels being used to display the signal. 45 Testing Tips Using the Split Lead Adapter 1 2 Figure A-1 Sample Split Lead adapter connection 1— Banana plugs 2— Split Lead adapter plug i NOTE: The banana plugs typically connect to the Scope channel of the same color, but can be plugged into any available Scope channel if necessary. A.2.1 Connecting the Pressure Transducer The Pressure Transducer connects to the Lab Scope Plug-in through the Split Lead adapter (Figure A-2). 1 2 Figure A-2 Sample pressure transducer connection 1— Split Lead adapter 2— Pressure Transducer 46 Testing Tips z Using the Split Lead Adapter To connect the Pressure Transducer: 1. Connect the Split Lead adapter to the Lab Scope Plug-in.See “Using the Split Lead Adapter” on page 45 for more details. 2. Connect the DIN-plug end of the Pressure Transducer to socket 1 or 2 of the Split Lead adapter. The numbers and colors match the channel on the unit. A.2.2 Connecting the Inductive RPM Pickup Adapter The Inductive RPM Pickup adapter can connect to the Lab Scope Plug-in through the Split Lead adapter (Figure A-3). 1 2 Figure A-3 Sample Inductive RPM Pickup connection 1— Split Lead adapter 2— Inductive RPM Pickup When the Split Lead adapter is not in use, the Inductive RPM Pickup adapter connects directly to the AUX port (DB9F) on the Lab Scope Plug-in. z To connect the Inductive RPM Pickup adapter: 1. Connect the Inductive RPM Pickup adapter to the Lab Scope Plug-in. See “Using the Split Lead Adapter” on page 45 for more details. 2. Connect the Inductive RPM Pickup adapter to the DB9F plug of the Split Lead adapter. 47 Appendix B Using Peak Detect Peak Detect is used to capture fast events, spikes and glitches for signals going in positive and negative directions. See “Adjusting Channel Settings” on page 27 and “Adjusting Channel Settings” on page 38 for more. B.1 When To Use Peak Detect The following section explains when you might want to use Peak Detect and how it works. When Peak Detect is off—the scope collects just enough data to plot a waveform across the screen. This is the standard mode of operation for many scopes. Example: If the Sweep setting is 10 seconds and the screen was 100 points wide, the sample rate would be 10 times a second. If the Sweep setting is decreased to 1 second, the sample rate would increase to 100 times a second. When Peak Detect is on—the scope samples at the maximum rate possible and captures more sample points than needed to plot the screen. This lets you catch a fast event or glitch. B.1.1 Example—Testing Secondary Ignition At a Sweep setting of 1 ms (Figure B-1), firing voltage will be captured even if Peak Detect is off (the sample rate is relatively fast at this time setting). Figure B-1 Sample 1 ms Sweep Peak Detect off 48 Using Peak Detect When To Use Peak Detect As the Sweep setting is increased, the firing voltage may be observed to decrease in height and vary more than usual, and the peak firing voltage will not be captured consistently (Figure B-2). Figure B-2 Sample 10 ms Sweep—Peak Detect off At longer sweeps, the sample rate is slower and the peak firing voltage or the entire firing can be missed if it happens between samples (Figure B-3). Figure B-3 Sample 10 ms Sweep—Peak Detect off When Peak Detect is on, the firings will be displayed regardless of the Sweep because the scope is sampling at the maximum rate. The longer the Sweep, the more useful Peak Detect can be. 49 Using Peak Detect When To Use Peak Detect Figure B-4 illustrates a Firing Peak captured at a 10 ms Sweep rate. Compare this illustration with Figure B-3 on page 49. Figure B-4 Sample 10 ms Sweep—Peak Detect on B.1.2 Example—Testing a TPS for Glitches With a sweep of 5 or 10 seconds, typically used for testing a throttle position sensor (TPS), the sample rate is relatively slow. When a sweep is longer, the sample rate is slower, which increases the chance that a glitch can be missed because it occurred in between samples. Figure B-5 illustrates a TPS glitch not captured. Figure B-5 Sample Slow Sweep—TPS Glitch not captured To increase the chance of capturing a glitch without Peak Detect, a shorter sweep is needed. 50 Using Peak Detect When To Use Peak Detect Figure B-6 illustrates a TPS Glitch captured using a faster Sweep. Figure B-6 Sample Faster Sweep—TPS Glitch captured Even if the glitch was captured, with a sweep this short the glitch could easily be missed if you looked away for a moment or even blinked. When Peak Detect is on, the scope is sampling at the maximum rate a signal glitch can be captured using a longer sweep where it will be easy to see. Figure B-7 illustrates a TPS Glitch captured using a 10 second sweep. Compare this illustration with Figure B-5 on page 50. Figure B-7 Sample 10 Second Sweep—TPS Glitch captured 51 Using Peak Detect When Not to Use Peak Detect B.2 When Not to Use Peak Detect Peak Detect puts the scope in a high speed sampling mode which can pick up and display unwanted noise from components such as injectors and solenoids. B.2.1 Example—Testing an Oxygen Sensor An Oxygen sensor (O2S) produces is relatively slow signal that requires, a clean, noise-free pattern for diagnosis. Peak Detect should be off when testing an O2 sensor, because the waveform is much cleaner and easier to evaluate since less noise displays (Figure B-8). Figure B-8 Sample O2 waveform with Peak Detect off When Peak Detect is on, more noise is picked up, which makes diagnosis difficult (Figure B-9). Figure B-9 Sample O2 waveform with Peak Detect on 52 Using Peak Detect Peak Detect and the Graphing Meter B.3 Peak Detect and the Graphing Meter The Graphing Meter uses a combination of Filter and Peak Detect modes. Filter removes the unwanted ignition and other high frequency signals from the display, which gives a better view of the signal of interest. The combination of Filter and Peak Detect gives a good balance between detecting fast glitches and preventing unwanted noise from displaying. The Noise Filter can be selected from the Channel Control bar as applicable. For related information, see the following sections: • “Adjusting Channel Settings” on page 27 • “Using the Filter with the Scope” on page 57 53 Appendix C Using Noise Filter If glitches are being detected and no vehicle problems are observed, noise may be the cause. As a precaution, do the following: • • • • i Use shielded leads Route the leads away from secondary ignition components. Verify the test connections. If noise is still suspected to be a problem, turn on the Filter. See “Channel Number” on page 27 for procedures. NOTE: The Filter may also eliminate extremely fast glitches. C.1 When to Use Filter The following sections explain when to use the filter with the Graphing Meter and the Scope. C.1.1 Using the Filter with the Graphing Meter In the Graphing Meter, the filter minimizes noise by ignoring or smoothing out fast spikes. Calculated Measurements When you conduct a calculated measurement test (frequency, pulse width, MC Dwell Or Duty Cycle) the filter is used so that very fast spikes (20 uS and faster) from sources like the ignition system can be ignored. Figure C-1 illustrates noise from the ignition system when conducting the Graphing Meter Frequency test with Peak Detect on and Filter off. 54 Using Noise Filter When to Use Filter Figure C-1 Sample of Frequency with Filter off Figure C-2 illustrates the noise filtered out when conducting the same test with the filter on. Figure C-2 Sample of Frequency with Filter on Direct Measurements When you conduct a direct measurement test in the Graphing Meter (Volts, Amps, or Pressure), the filter minimizes the display of very fast spikes by averaging the data. When used together, Filter and Peak Detect balance capturing glitches and minimizing noise. 55 Using Noise Filter When to Use Filter Figure C-3 illustrates Peak Detect on and Filter off during a TPS Sweep with the key on and engine off (KOEO). Figure C-3 Sample Noise Filter off—TPS Sweep (KOEO) Figure C-4 illustrates Peak Detect on and Filter on during a TPS Sweep with the key on and engine off (KOEO). Figure C-4 Sample of Noise Filter on—TPS Sweep (KOEO) Figure C-5 illustrates Peak Detect on and Filter off during a TPS test. The throttle was snapped with the engine running (KOER). Compare this with Figure C-6, taken under the same conditions but with the Filter on. 56 Using Noise Filter When to Use Filter Figure C-5 Sample Noise Filter off—TPS Sweep (KOER) Figure C-6 Sample Noise Filter on—TPS Sweep (KOER) C.1.2 Using the Filter with the Scope In the Scope, Filter smooths out spikes and fast variations in the waveform, which provides a good balance between noise suppression and signal integrity and is most useful on scales of 5 volts and below. The lower the volts scale, the more likely noise could be a problem. Testing an O2 sensor using a 1 or 2 volt scale or testing with an amps probe would be examples of when Filter might be used. Due to the conversion factors used by the probes, a very small volts scale is used to measure the output of the probe. For a probe with a conversion factor of 100 mV/A connected to a 2 amp load, the scope uses a 200 mV scale to measure the probe output and then convert it to 2 amps for display on the screen. 57 Using Noise Filter When to Use Filter In Figure C-7, 2 low amps probes were connected to the same injector to compare the waveform with Filter on and off. Figure C-7 Sample Noise Filter—two low amp scope probes Channel 1 uses the Filter and Channel 2 does not use the Filter. Notice the difference in readings. 58 Appendix D Using Sensitivity Adjustment Sensitivity Adjustment is used in the Ignition Scope to set the detection sensitivity of cylinder firings. See “Sensitivity Adjustment” on page 34 and “Missed Cylinder Detection” on page 34 for more information. D.1 When To Use Sensitivity Adjustment The sensitivity adjustment affects the ability of the ignition scope to detect ignition firings. Generally it is best to set the sensitivity level just above the spark (Figure D-1). Figure D-1 Sample of correct sensitivity adjustment D.1.1 Improper Sensitivity Adjustments Setting the cylinder firing sensitivity is essential for the proper display of the secondary pattern. • If the sensitivity is set too high, cylinder firings may not be detected and firing peaks may not get detected on multiple spark ignition systems. • If the sensitivity is set too low, events other than the cylinder firings may be falsely detected as cylinder firings. The following examples illustrate what happens when the Sensitivity Adjustments are set too high and too low. 59 Using Sensitivity Adjustment When To Use Sensitivity Adjustment Sensitivity Set Too High Cylinder firings may not be detected consistently if the sensitivity setting is too high. A blank space will display in place of a cylinder that is not detected. Lowering the setting allows the scope to detect the firings consistently (Figure D-2). Figure D-2 Sample missed cylinder detection i NOTE: If a cylinder is not firing at all, it cannot be displayed and remains a blank space on-screen Multiple Spark Systems When testing a multiple spark ignition system, if the sensitivity is set too high, firing peaks can be intermittently missed and the Digital kV measurement does not calculate correctly (Figure D-3). Figure D-3 Sample of missing peaks 60 Using Sensitivity Adjustment When To Use Sensitivity Adjustment Lowering the scope sensitivity captures all of the firing peaks consistently and calculates the Digital kV measurement correctly (Figure D-4). Figure D-4 Sample of properly set sensitivity for Multiple Spark systems Sensitivity Set Too Low When other events are detected as cylinder firings, the detection sensitivity may be set too low. The setting should be increased until the ignition scope consistently detects each cylinder firing. Figure D-5 illustrates the detection sensitivity level set at 500V which is too low because the start of Dwell is being displayed as the firing of cylinders 3 and 2. Figure D-5 Sample of sensitivity adjustment set too low 61 Using Sensitivity Adjustment Some Common Ignition Problems Figure D-6 illustrates another view of the secondary waveform and highlights the start of the dwell that was being falsely detected as a cylinder firing in Figure D-5, where the setting was too low. Figure D-6 Sample of sensitivity adjustment set too low D.2 Some Common Ignition Problems This section explains how to set the sensitivity level properly when you encounter some common ignition system problems. D.2.1 Example–Vehicle With A Shorted Spark-Plug Figure D-7 illustrates inaccurate cylinder firing detection on a vehicle with a carbon fouled spark-plug. The spark-plug on cylinder 3 was severely carbon fouled. In the illustration, the detection sensitivity level is set too high and the cylinder is not being detected consistently. Figure D-7 Sample sensitivity set too high 62 Using Sensitivity Adjustment Some Common Ignition Problems Decreasing the detection sensitivity to 1.5 kV, as illustrated in Figure D-8, results in the consistent detection of the shorted cylinder. Figure D-8 Sample shorted spark-plug detected D.2.2 Example–Vehicle With A Coil Not Firing Figure D-9 illustrates cylinder firing detection on a vehicle with the 6/3 coil not firing. Lowering the detection sensitivity will not help because there are no firings from the 6/3 coil to detect. Figure D-9 Sample 6/3 coil not firing and not detected 63 Using Sensitivity Adjustment Some Common Ignition Problems The actual cylinder spacing can be seen by changing to the 200 ms fixed time sweep and viewing the raw waveform on channels 1 and 2. The cylinder spacing (long/short/long/short) verifies a coil is not firing (Figure D-10). Figure D-10 Sample raw waveform of coil not firing 64 Index Numerics display as 26 display trigger 39–40 dual graphing meter 19 Duty Cycle 19 DVOM 10 and digital meter 20 connection location 10 100 psi Pressure 19, 32 100 psi Vacuum 19, 32 4 Ch Lab Scope 32 500 psi Pressure 19, 32 5000 psi Pressure 19, 32 A F alligator clips 13 auto scroll 21 aux port 10 filter 53, 54–58 Frequency 19 fuse 11 B G bold text 1 grid 26 ground socket 10 C cables 12–14 channel 1 12 channel 2 13 channel 3 13 channel 4 13 connecting 4–7 inductive RPM pickup 14 secondary coil adapter 14 secondary ignition clip-on wire adapter 14 capabilities, hardware 11 channel 1 socket 10 channel 2 socket 10 channel 3 socket 10 channel 4 socket 10 channel control bar 27 channel number 27 common ground socket 10 connecting cables 4–7 channel 1 4 channel 2 5 channel 3 6 channel 4 6 pressure transducer 45, 47 secondary coil adapter 7 cursors 22 H hardware overview 10–12 I ignition patterns 33 Ignition Probe 32 ignition scope 32–34 ignition system 37 inductive RPM pickup adapter 14 Injector Pulse Width 19 inverse colors 27 L lab scope 32 leads. See test leads loading data 42 Low Amps (20) 19, 20, 32 Low Amps (40) 19, 20, 32 M manual conventions 1–3 manuals, additional 3 MC Dwell (60) 19 MC Dwell (90) 19 messages 2 important 2 note 2 D deleting data 43 digital meter 13, 20 dimensions,plug-in 10 Diode/Continuity 20 65 Index N setup options 25 grid 26 ignition system 37 inverse colors 27 scales display 26 trigger display 38 units 25 signal zero offset 29 snapshot 16, 21, 22, 23–24 changing settings 23 split lead adapter 45 sweep setting 30 symbols 1 multimeter 18–30 graphing meter 19 performing tests 20 selecting software 18 N noise filter 28, 53, 54–58 O Ohms 20 P pausing data 21 peak detect 28, 48–53 plug-in capabilities 11 plug-in slot 10 powering 4 presets 36 copying and moving 44 deleting 43 editing 42 identifying 42 loading 42 management screen 41 selecting all 44 using 41–44 pressure transducer 46 print 25 printing screens 25 probe 28, 33, 34, 39 test 14 procedures 2 Pulse Width 19 T technical specifications 10 temperature range operating 11 storage 11 terminology 2 test leads 12–14 connecting 4–7 test probes 14 testing tips 45 threshold 30 Auto Threshold Select (ATS) 30 Manual Threshold Select (MTS) 30 tool help 3 toolbars 15–16 trigger display 38 trigger. See display trigger U units 25 USB keyboard 43 R reset 24 review 21 V view options 20 full digital 20 full graph 20 split screen 20 Volts AC rms 20 Volts AC-RMS 19 Volts DC 19, 20, 32 Volts DC-Average 19, 20 S Safety iii–iv safety information iii save 24 saving data 24–25 scale 28 scales display 26 scope 31–44 ignition scope 32 performing tests 35 selecting software 31 secondary coil adapter 14 setup button 25 W weight,plug-in 11 Z zoom 22 66


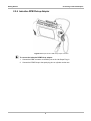
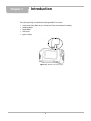
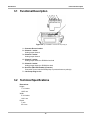
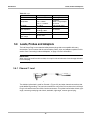
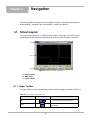
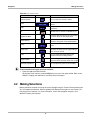
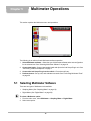
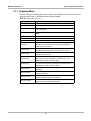
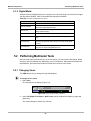
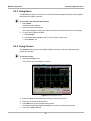
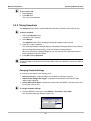
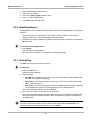
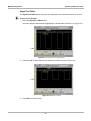
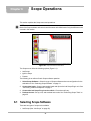
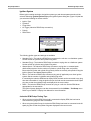
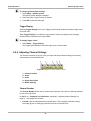
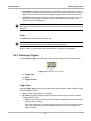
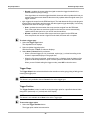
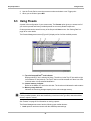
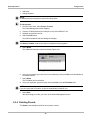
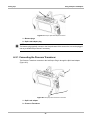
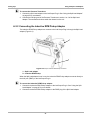
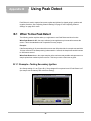
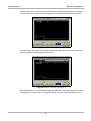
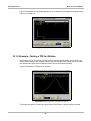
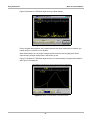
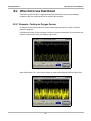
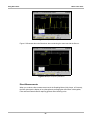
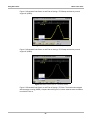
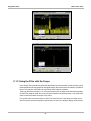
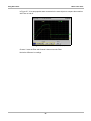
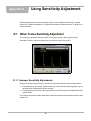
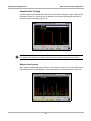
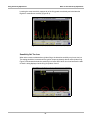
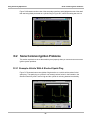
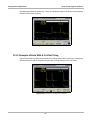
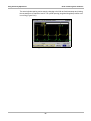


![VERUS PRO User Manual [3980kb PDF File] - Snap](http://vs1.manualzilla.com/store/data/005690474_1-9ff68923f14d7698ce72469cabae3990-150x150.png)