1
AN EVIDENCE BASED MONITORING AND DECISION SUPPORT SYSTEM
FOR EFFECTIVE INTERVENTIONS IN
WATER, SANITATION AND HYGIENE
USING THE GEOGRAPHIC INFORMATION SYSTEM
USER MANUAL
August 2013
1
INDEX
Contents
Page No.
Introduction
4
View of Latest News on Water Supply & Sanitation Department
7
Important Links
7
Home Tab to view the main features and Navigation links of the System
9
About-Description about the System and a hierarchical model of the
10
Overview of Water and Sanitation in Maharashtra
11
Gallery to view various image
12
Contact information of the Water Supply and Sanitation Department and WSSO
13
Feedback
13
Modules of WASH
14
WASH Data Entry
14
1. Change Password
15
WASH DASH Board
19
WASH GIS
24
1. Layers
26
2. Search
27
3. Query
29
4. Range Query
31
5. Advance Query
32
6. Multi Map
36
7. Label
38
8. Print
42
WASH Meta data
46
Census‟11 Data Analysis
47
(1) State Profile
47
(2) District Profile
48
(3) Block Profile
49
NBA Baseline Survey Report 2012
50
Contact Details
52
2
ListofAbbreviationsUsed
GIS
GP
ICT
MIS
PRI
RWSS
UNICEF
WASH
WSSO
Geographic Information System
Gram Panchayat
Information &Communication Technology
Management Information System
Panchayat Raj Institute
Rural Water Supply & Sanitation
United Nations Children's Fund
Water, Sanitation and Hygiene
Water Supply and Sanitation Support Organization
Understanding certain statistical terms used in the WASH GIS
Frequency distribution:
Frequency in this case indicates the number of samples and frequency
distribution refers to how the values related to any indicator of each sample are arranged. For example, if
there are 100 GPs (sample size is 100) in a block and percentage of households having toilets (indicator)
in each GP is considered then there will be 100 possible values (each for one GP) and how those values
are arranged is the frequency distribution. In this case the value may be as low as zero and may go up to
100. So, there will be 100 values and more than one GP may have the same value (for example there may
be five GPs with 100% coverage). If one considers achievement against target the value may exceed 100
since achievement may be more than target (if the GP was to construct 1000 toilets and construct 1500
toilets, the value of achievement will be 150). If all these values are arranged in ascending or descending
order there will be a minimum value (can be zero if achievement is nil) and a maximum (in the first case
100 and in the second case 150). The mean value is the simple average of all the values added together
divided by total number of samples (here 100). The median is the value which divides all the samples in
to exact two portions, i.e, half of the samples will be above median value and the remaining half will be
below median value. Those GPs with value above median will have performance better than GPs with
value below median value (it is presumed that the indicator is a positive one such as number of household
having toilets, but the same will be reversed for negative indicator such households not having toilets in
which higher value indicates lower performance). This helps to divide the GPs in to simply good and bad
performing GPs. Since the difference between the best and the worst may be very high it is better to
divide the samples in to more segments. In WASH GIS the samples have been divided in to four parts.
The best performing 20% (the value in respect of which is better than the remaining 80% samples) are the
highest performers. The next 30% samples in terms of values are those which have performed just worse
than the first 20%. These two set of samples taken together will be the better half if one considers in terms
of the median. All samples below the median is divided in two segments, the worst 20%, which are
bottom-most one fifth of the samples and another 30% which is above the worst but with performance
below the median value. This is the general pattern but other type of segregation can also be used.
3
User Manual for the WASH GIS
Introduction: Monitoring of programme is done these days using Information & Communication
Technology (ICT) based Management Information System (MIS). However, conventional MIS cannot
be used to make spatial analysis and display various performance parameters on a spatial mode to
view progress in respect of any particular geographical area like a village or a gram panchayat.
Analysis of data disaggregated up to lower level of administrative units, which are associated with
implementation of the programme and sharing the same with the local authorities in charge of the
administrative unit is essential in making appropriate interventions based on observed failures. Use
of Geographic Information System (GIS) enriches the monitoring efficiency substantially by
presenting disaggregated analysis on area maps. For example, it can show the performance in
respect of any indicator for every block or every gram panchayat within a district map. Such
disaggregated analysis shown on map presents theme wise analysis, which may be seen in different
layers for easy comparison across different areas, across time as well as to find correlation of
performance in terms of one parameter with any other factor having possible impact on the
programme performances. If the system is web enabled the local authorities can easily view their
performances, which make sharing of programme performances automatic. Thus, GIS based
monitoring system is very effective in monitoring programme performances as well as guiding
timely interventions.
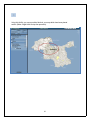
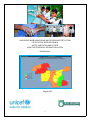
A GIS has been developed for monitoring and analyzing programme performances in the field of
water, sanitation and hygiene (WASH) in Maharashtra and making the same available in the web,
which may be accessed at www.wash.maharashtra.gov.in. The system known as WASH GIS
captures, analyses and makes display on the web map all important data/performance parameters
related to water sources, water supply, water quality, rain fall, ground water availability as well as
progress in implementation of the Nirmal Bharat Abhiyan. All data can be analyzed up to block level
for all the rural areas of the district and in respect of five districts, namely Amaravati, Chandrapur,
Latur, Nandurbar and Yavatmal such analysis may be made up to gram panchayat level. There is
provision for entering data based on which such analysis and display is made and the data has to be
entered by the field offices. Once the data is entered various analyses may be made using the WASH
GIS. Some of the analyses which are common have been provided as pre-defined queries, which
make the analysis and display the same in coloured thematic maps readily through the WASH
DASHBOARD. The user may make any other query, which may be made using the data entered from
the menu of options in the WASH GIS. The user needs some training to enter data and to efficiently
use the WASH GIS, which is menu driven and simple to use. This Manual explains how the WASH
GIS can be utilized for capturing data, making analysis and preparing maps and charts as well as
viewing the same.
The WASH GIS has been developed by the Riddhi Foundation (previously Riddhi Uddalak) being
commissioned by the UNICEF.
4
Water Supply and Sanitation Department
Government of Maharashtra
5
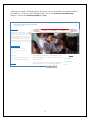
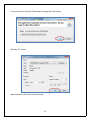
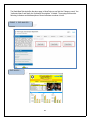
You can choose your default language as either “Marathi” or “English”. Click on the encircled
language as above to set Marathi or English as your default language.
6
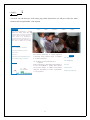
LATEST NEWS ::
Latest News on Water Supply and Sanitation Department can be viewed under this section as
shown below.
IMPORTANT LINKS ::
Click on the following links to visit the respective web sites.
•
•
•
•
•
•
MinistryofDrinkingWater&Sanitation
WaterSupplyandSanitationDepartment
CensusOfIndia
UnicefIndia
GroundWatersurveysandDevelopmentAgency
WaterandSanitationSupportOrganization
7
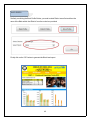
As this System contains GIS Module hence this System runs on Java Runtime Environment (JRE). If
your machine is of 32 bit version of Windows then click on the "Download Sun ]RE {32-bit]".
Otherwise click on the "Download Sun]RE {64- bit]".
Water Supply and Sanitation Department
I
Government of Maharashtra
LATEST NEWS
aa
The WASH GIS in Maharashtra is a unique -
initiative
for
viewing
various
water
sanit.ltion related interventions and outcome
on the web. ReaChing safe water and hygienic
sanit.lry facilities to a households are
important goals of the country that are to be
adlieved as soon as possible. Sust.linability of
water sources is another area of growing -
IMPORTANT LINKS
Ministry of Orinkin& Watr & Sanitation
Watr Supply and Sanita on Department
Census of India
UNIUF India
Tnis pubUshes performance of various programme-; for
Ground Water surveandlopment Aiency
Water and Sanitation Support Oreanis.ation
improving services related to Water & Sanitation in the
state of Maharashtra.
PARTNERS
The GIS backbone provides spatial analysis of programme
outputs aggregated up to state level and d isaggregated up
8
WASH MJS
WASH DATA ENTRY
WASH DASHBOARD
WASH GIS
fDmtl
L
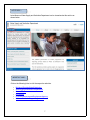
(... H_o_M_E_:_:
The Home Tab will direct you to the home page of this System. Here you will get to know the main
features and Navigation links of the System.
LATEST NEWS
Home
The WASH GIS in Maharashtra is a unique
initiative for viewing various water
sanitation related interventions and outcome
on the web. Reaching safe water and hygienic
sanitary facilities to all households are
important goals of the country that are to be
achieved as soon as possible. Sustainability of
About
Overve
i w
Gallery
Contact
8:8
A
water sources is another area of g rowing ,..
IMPORTANT LINKS
Ministry of Drinking Water & Sanitation
Water Suppty and Sanitation Department
Census of India
UNICEF India
This pub ishes performance
of various programmes
Ground Water surveys. and Development Agency
for improving services related to Water & Sanitation
Water and Sanitation Support Organisation
in the state of Maharashtra.
WASH DATA ENTRY
WASH DASHBOARD
The GS
I backbone provides spa tial ana ysis of
programme
PARTNERS
outputs aggregated up to state leveland disaggregated up
to Gram
"
.,..._.
.... .f'lil'qRfJQIQI'1i'NJ
GSDA
Govt. of M.aharashtra
Panchayatlevel for
and programme managers
WASH MIS
guiding field
for evidence based decision
making and interventions for better
WASH GIS
officials
WASH METADATA
implementation
CENSUS'11,DATA ANALYSIS
of such programmes.
9
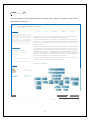
ABOUT::
..
[
...rlmmmm
This Link contains a brief description about the System. It also contains a hierarchical model of the
Institutional Architecture.
'
..... Water Supply and Sanitation Department
Governmen t of Maharashtra
LATEST NEWS
Home
About
Overview
Contact
Gallery
The WASH GIS in Maharashtra is a unique •
initiative for viewing various water &. ;;
samtation related interventions and outcome
on the web. Reaching safe water and hygienic
sanitary facilities to al households are
important goals of the coootry that are to be
achieved as soon as possible. Sustainability of
water sources is another area of growing -
ImproVing access to safe water and hygienic sanitation practices are important aspect of
devebpment to which the government of Maharashtra is we[committed.
There are several programmes, a few of which are of nationalimportance, which are being
implemented in this regard in the state. Better implementation of those programmes is
essential for which there should be proper monitoring of the programme outputs and other
related parameters.
The GIS is an exce[ent toolfor improved monitoring and has an edge over conventionalsystem
of monitoring, since it also provides spatial analysis of performances. The system has been
specially designed to visuaUze performances of water and sanitat on related programmes
aggregated up to state levelas weU disaggregated for lower leveladministrative units up to
Gram Panchayats (presently In f ve selected districts namely, Latur, Yavatmal Nandurbar,
Chandrapur and Amaravati) . Per formances across administrative units are displayed in
thematic coloured maps which may be generated through easy queries.
IMPORTANT liNKS
Minis tty of Drinking Water Q. S&nibtion
Water Supply and Sani tation Department
Census of India
UNIC£F lnd1a
The system is very transparent and easily accessible, which helps better supervision and
guidance for improving implementation of an those programmes.
Ground Water surveys and Oe\•elopment Aeency
Water and Sanltadon Support Or&•nlsad on
I nstitutional A rchitecture:
PARTNERS
GSDA
Govt. of Mat"..arashtrl!
...-..............
RIDDHI UDDA LAK
unicef
kMcw---'b'
I Powered by Whi.<M.p0
Visitor No.
rfl'
..
,.
•'•!'•
...: • ••
-'¥..-1•
•-
1
•
'1
\!\( l ..
•
••
>-' 11 \
1
,.,,
'• '
l''•'l
'- t •
I Oev.:loped by !llit!!!!i I
fhts temrunsonJ aRunt:inllle[rwironment(JR£)
'II'
Dowok>..J.c M (ltnt]
1 '•
10
I
Downlo.lC
IRE
(M btt]
I
()ownl,o..,}d
M [M.i<J
OVERVIEW ::
Under this you will get to know the Overview of Water and Sanitation in Maharashtra. The module
is structured in the following way:
•
•
•
Water Supply
Sanitation
Institutional Framework and Administrative Arrangement for Water & Sanitation
• Legal and Policy framework for RWSS and Sanitation.
• Organizations for RWSS and Sanitation
11
GALLERY ::
In Gallery you get to view various images. If you want to open the selected Image in a new window
then click on
this link. Otherwise if you want to view the image in full screen then click on
the
following link
12
( CONTACT::
Detail contact information of the Water Supply and Sanitation Department and WSSO is present in
this link.
Water Supply and Sanitation Department
Governmen t of Maharashtra
lA l lS T NlWS
Home
The WASH GIS in Maharashtra is a unique •
=
Overview
About
Gallery
Contact
Water Supply and Sanitation Department
initiative for viewing various water a
sani tation related interventions and outcome
on the web. Reaching safe water and hygienic
san1tary facilities to al households are
important goals of the country that are to be
ach ieved as soon as possible. Sustainability of
water sources is another area of growing -
GT Hospital Campus,
New Bldg. 7 th Floor, L T Marg, Near Crowford Market,
Mumbai · 400001
Telephone: +91-22·22626407
F.u:
22·22622084
•91
WSSO (Water Supply and Sanitation Support Organisation )
IMPORIANT LINKS
Water Supply and Sanitation Department,
Ministry of Orinl0n1 Water & Sanitation
1st Floo r South Wing, CIDCO Bhavan,
Water Supply and Sanitation Department
CBD Belapur, Navi Mumbai
Census of India
Telephone: +91·22·27562546
Ground Water urveys and Oe\-elopment Aeency
Feedback:
Water and Sanitation Support Ort&nisat:ion
Name
PARTNFR'i
':
Email
:
Message •:
GSDA
or Ma.haraslma
Govl.
unicef t-
'
RIDDH UDDALAK
.5tMctJ..........,_,.........,
SUBMIT
Visitor No.
rr ••'•
'
,..
.!.J.
j IL__R_E_S_ET_...J
I Powered by Whi2Mop0
t '•'
J0
,,,l, t
•
•
1
!d
l... tr!.,.
"
I
'
!o
·'
1
't
''•' 1
'1
I Dovetoped by !lli!l!!!j I
Th1s system runs on J.,_.a Runtln1Emironment (JR£)
r'
JR[[J2t)lt]
lo;
I
-'Rf::[b-4blt]
I
.JR[[IN<:J
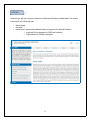
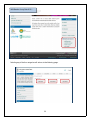
Feedback::
If you want to send any feedback write your name, Email Address and the feedback message you
want to send in the space provided and click on the Submit button.
13
MODULES OF WASH ::
WASH contains the following modules: Wash Data Entry, Wash Dash board, Wash GIS, Wash
Metadata, and Census‟11 Data Analysis.
WASH DATA ENTRY:
To Login into the Data Entry System enter your Username and Password and then click on the
Login Button as shown. User from Block as well as District level can enter into the system.
There are 1 more link: “Change Password”.
14
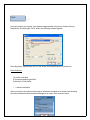
CHANGE PASSWORD ::
New Password: Type your new password. But make sure that the password contains minimum 6
and maximum 32 characters. Do not use apostrophe („) in the password.
Retype Password: Again type your password in the text box below. This password should be same
with the above password.
Password Strength: Depending upon the password you have entered its strength (very weak,
weak, better, medium) is decided.
15
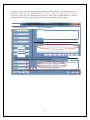
Select District: Select a District names like Amravati, Chandrapur, Latur, Nandurbar, Yavatmal
from the combo box.
Select Block : Select a Block name from the combo box.
Select Level: Select a level (Village or Gram Panchayat) from the combo box.
Select Group: Select a Group (Water Sources and Supply, Demographic, GW Status & Rainfall) from
the combo box.
Select Category: Select a Category from the combo box.
Select Month–Year: Choose month year from the calendar provided.
After selecting all the fields click on the “Proceed” button to start the data entry process.
17
After filling up the form, Click on the Save button to save the data in the System.
Group :Water Sources ,Category :Village wise PWS
for 2013-07
For Block:Achalpur
I
Code
00700400
Name
Name of the PVVSHame of the GP bH&DctionaVnon-fur8easonaLIPerenniWater source (und_
A""!pllr
L
.JII
uInctlonal
R
(Perennial
R
(undergro_ R
00689700
wari
'--------'1 1
I JFunctional 1 • 1 J Perennial J •l Jundergro- J •I
00689900
81!it!<e. <!a
L------' I
I §'nctionaiEJ {§rennialji) § de
00691400
Chamakllk
'--------' I
I JFunctlonal 1 • 1 J Perennial 1 • 1 Jundergro_ J ... I
00687000
KandaU
'--------'
_j Jfunctlonal 1 • 1 J Perennlal 1 • 1 Jundergro_ J ... I
00690400
Shekapur
,_
00690500
Jawar<li
'-------' I
00685700
14imdari
'--------' I
00685800
Jalalpur
,_
00691100
Bhopapur
00690900
Sangvl Nqampur
H J Perennial H Jundergro- H
=:J [§ctlonal l•l [!ifenniai:EJ Jundergro_ J ...I
'--------' '-----_j JFunctional H J Perennlal H Jundergro-1 •1
I
I JFunctional H J Perennial H Jundergro-1 •1
00691000
Wjampur
'--------' I
00691200
Naigaon
,
1 00699800
Khanapur
,_
M
_j JFunctlonal 1 • 1 !Perennial 1 • 1 juMergro_ J ... I
_...J L ---
i!Funcl!onl!l 1 • 1 J Perennll!l 1 • 1 JundergrO- J •I
] JFunctlonlll
j L---
_j
...J I
I
I
llrunctional J ... I J Perennial J ... I Jundergro_ J .,. I
I JFunctional J .,. J Perennial J .,. lundergro_ J .,. I
•
( CS)ave
18
WASH DASHBOARD ::
Select a Level (either Block or District), Category (Sanitation / Drinking Water Supply / Cross
Cutting Issues / Drinking Water Source / Water Tax) and Indicator from the combo box. Then select
the month and year for which you want to see the data.
As soon as you will select an Indicator from the list provided, Indicator Description will be
generated in the box as shown below.
19
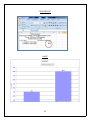
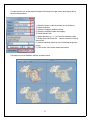
On clicking the “Show Map” button, the following Pre-Defined map will be generated.
The indicators here are pre-Defined. The following map shows us the data against the Group,
Category and Indicator we have selected previously. Each GP is showing some data on it. If you
want to see the Bar Graph, then move the cursor point on required the Village / GP name and you
will be able to see a bar generated which shows the Rank, highest and lowest value and the
percentage of data of that GP.
20
•
The GP with highest 20% data is marked as GOOD -> GREEN
•
The next 30% is considered as MEDIUM -> YELLOW
•
The next 30% of Medium is considered as AVERAGE -> ORANGE
•
The last (lowest) 20% is considered as POOR -> RED
•
If any GP is colored white then either NO Data is present or the GP is present outside PRI ->
WHITE
21
The highlighted Graph in the picture above shows the Rank of the GP : 5. Lowest data is 0.43
whereas highest data is 195.74. The GP with Rank 5 contains 61% of data for the given Indicator
falling under the given Category.
22
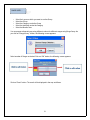
You can take a print of the Pre-Defined Map on clicking the “Print” button,
Select the “Ok” button.
Again click on the “OK” button to print the map.
23
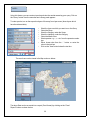
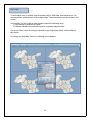
WASH GIS ::
Geographic Information Systems (GIS) is a set of tools that captures, stores, analyzes, manages and
presents data that are linked to various location(s), like GP and Villages etc.
In the simplest terms, GIS is the merging of cartography, statistical analysis, and database
technology.
On clicking the GIS module of the system, the respective
map and data will be loaded in the system and the map
screen will appear as follows:
24
The system provides certain unique facilities like:
1. Easy Tool Tip Text
2. Fast location search facility
3. Simple Query builder
4. Range Query builder
5. Advance Query builder
6. Multi Map facility
7. Labeling
8. Printing
9. Easy Zooming and Panning facilities.
10. Report Generation and etc.
On the top left hand corner of the window you will find a menu bar containing a list of buttons
as shown above:
The use of each button is described next page onwards:
25
LAYERS::
This section gives you a list of spatial objects you can see in your map. By clicking on
the “Layer” button you can find various layers namely Gram Panchayat, Village and Roads etc.
On checking the box at the side of the screen by clicking on the same, the selected Layer(s) can
be viewed on the map as shown below:
If you want to view all the layers at one time, check the „Select All‟ box.
26
SEARCH::
To search for any location on the map, click on “Search” button in the Menu bar. By using this menu
you can easily identify the location of Gram Panchayats, Villages etc.
To search for any location on the map, select the name of the Layer and the location Name from
the Combo boxes (move your mouse cursor to the scroll icon beside the box to find the names)
and then click on „SEARCH‟ button. Before searching the different layers, you have to turn on
the respective layers in the map from the Layers section.
Also, on typing the first few characters of your desired location in the text box, the full name of the
location will appear on the Combo box. By clicking on „SEARCH‟ button you can easily see the
location on the map.
OR you can find the location name as you move the mouse Pointer over the map. After search option is
clicked, the searched location will be highlighted in the map with different color as shown below:
27
28
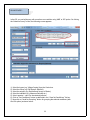
QUERY::
Using this feature, you can construct queries and view the results answering your query. Click on
the „Query‟ button from the menu bar and a Query panel appears.
To make queries, turn on the respective layers of the map, from layer menu (those layers which
have the relevant data).
•
•
•
•
•
•
•
•
Select the Layer on which you want to run the Query.
Select the Group
Select the Category under the Group
Select the Indicator under the Category.
Select the Month/Year
Select operator e.g. =, >, < etc. from the operator combo
box.
Either chose value from the „…‟ button or enter the
value in the text box
Click on the „View‟ button below the text box.
The result can now be viewed in the Map as shown below:
The above Data can be converted into a report (Excel format) by clicking on the “Excel
Report” button as shown below:
29
EXCEL REPORT
CHART
30
RANGE QUERY ::
•
•
•
•
•
Select the Layer on which you want to run the Query
Select the Group
Select the Category under the Group
Select the Indicator under the Category
Select the Month/Year
You can prepare a thematic map using different colours for different ranges using Range Query. As
you click on “Range Query” button, the following screen appears:
Select number of Ranges as desired. Click on “OK” button, the following screen appears:
Click on “Done” button. The result will be displayed in the map as follows:
31
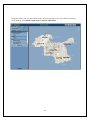
ADVANCE QUERY ::
In the GIS, you can build query with more than one condition using „AND‟ or „OR‟ option. On clicking
the “Advance Query” button, the following screen appears:
1). Select the Layers (e.g. Village Centre) from the Combo box.
2). Select the Group (e.g. GW Status & Rainfall)
3). Select the category (e.g. Rainfall and Source of Water)
4). Select the indicators (e.g. Monsoon Rainfall etc.)
5). Select „operator‟, „value‟ for the selected indicator.
6). Click on “Set Conditions” button to add fields in the “View Set Conditions” list box.
7). Now click on “Send for Grouping” button for grouping the selected conditions (with
And /Or option) as shown below:
32
1) Select both the conditions and click on “AND” button to join the conditions with each other, the
conditions will be grouped together as shown below:
After the successful execution of a query, you can view the dataset of the indicators on which the
query has been executed.
33
Now, you can also view the status of other indicators with the dataset of the executed query. To
view this, click on the check box [(Add other supported indicators for Report
(Optional)] and select the indicators from the list, then click on "ADD" button to add the
selected indicators in query report. Then click on "Execute" button as shown below:
Advan<:e Query
L Select Condltlona :
I.VIew Set Condltlona :
L
Edit
JL
Delete
JL
Send for Grouping
_ an<l source or Water Levet.Pre Monsoon water Level>=
Set Conditions
34
·o·or _
I
The following window appears:
You can now generate the query report (excel) with the added other indicator (i.e. “Pre Monsoon
Water Level”, “Monsoon Rainfall”, “Water level January”, “Pre monsoon Water level” in this case) by
clicking on the “Excel Report” button” as shown below:
35
MULTI MAP::
To see the Multi map i.e. multiple views of the Map, click on „Multi Map‟ from the Menu bar. You
can now perform queries on each of the multiple maps. Time series analysis can also be done in this
section.
In this section, you will be able to make thematic maps on the following ways:
1). One indicator for different time span
2). Different indicators for same time frame for co-relation analysis and etc.
You can use „Query‟ menu for making the thematic maps. Range query facility is also available in
this module.
On clicking the “Multi Map” button, the following screen appears:
36
To make queries, turn on the respective layers of the map, from layer menu (those layers which
have the relevant data).
1). Select the Layer on which you want to run the Query
2). Select the Group
3). Select the Category under the Group
4). Select the Indicator under the Category
5). Select Month/Year
6). Select operator e.g. =, >, < etc. from the operator combo
7). Either chose value from the „…‟ button or enter the value in
the text box
8). Select the desired map (from the Choose Map drop down
menu)
9). Click on the „View‟ button below the text box
The result can now be viewed in the Map as shown below:
37
LABEL:
This module allows you to place Labels with various layers like Village, Gram Panchayat etc. in your
map.
Click on Label, the following screen appears.
Using this facility, you can place labels on the areas of the map which have been highlighted
through a query.
38
Using this facility, you can place labels on all the areas of your map for a selected layer.
39
Using this facility, you can place labels on the areas in your map as per your choice by clicking
on the desired areas.(Make a right click to stop the operation)
40
Using this facility, you can re-position labels in your map which have been placed
earlier. (Make a right click to stop the operation)
41
PRINT::
Using this module, you can print your thematic map generated using Query, Advance Query or
Range Query. On clicking the “Print” button, the following window appears:
Select the printer type and then click on “OK” button, the desired map will be printed out.
Other Features:
1) Location wise data
2) Zooming and panning facilities
3) Selection of Color Pallet
•
Location wise data:
When you click on any location on the map, an information box appears in the left panel showing
the value of indicators under the selected category from query menu as shown below:
42
There is an option to capture the data which is presently being viewed. Click on
the "Report" button, the data would be ported in to an htmljexcel sheet as shown below:
Wadner Gangai Village
RainfaU and Source of Water Lenl (N/A)
43
1) Zooming and panning facilities:
This facility allows you to resize and move the map so that every part of the map can be
viewed, as desired. The Zooming and Panning buttons are present on the top right panel.
Zoom In:
• Click on the „Zoom In‟ button
• Click and drag the portion of the map which you want to magnify
Zoom Out:
• Click on the „Zoom Out‟ button
• With each Click the map is reduced in size
You can “Zoom In/Zoom Out” the map by scrolling your mouse wheel Up/Down
Pan:
• Click and drag the mouse cursor to the direction where you want to shift the map.
Zoom Extent:
• Click the button to bring the map to the default size and position
Zoom Previous:
• Click the button to view the map in the previous size and position
Normal:
• Click on the button to bring the mouse cursor to the Normal Mode
44
1) Selection of Color Pallet:
In the GIS section, you are able to prepare the thematic maps using various colors, highlight the
maps in the search mode in different colors etc. With this tool you will be able to highlight the
map with color of your choice. For activation of the tool, click on
windows appear:
button. The following
You can select your preferred color from the color pallets as shown above. Your selected color
will be used by the system to highlight the map on execution of any query.
45
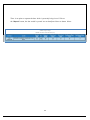
[WASH METADATA::
];.
"'
------------------
® Water Supply and Sanitation Department
I
i!m Government of Maharashtra
-·
Home
Category
Sanita t on
Sanitation
Sanita t on
Sanita t on
I
Indi cator Name
Percentage of HH toilet construction of GPs
Percentage of APL+BPL HH toilet construction of
GPs
Household toilets yet to be constructed of GPs
NGP
Percentage of NGP GPs
Sanita t on
Month y rate of constructi on of HH toilets of GPs
Likely no of years for reach ng 1OOPercentage HH
toilet coverage for Taluka
Percentage of Schooltoilet construction of GPs
Percentage of AWC tolet construction of GPs
Sanita t on
Sanita t on
Sanitation
Availabiltiy of Girls toilet in schools(DISE)
Sanita t on
No of girl student per toile t n schools (DISE)
Drink ng Water Supply
Drink ng Water Supp y
Cross-cutting issues
Dr nking Water Source
Orinkino \UtPrI tnnl\1
No of schools wi thout water sources w thin GP
Percentage of AWCs without water sources wi thin
GP
Percentage of GP with Green Card as per Sanitary
Survey
GP wise status of contamination
:: mkPrc;: (?MR -?01 \
Villopc; fpfi with t;:
DnnKmg Water Supply
lllages rea Wltn tanKers {2008-2013)
VI
Water Tax
Water Tax
Dr nking Water Source
Rani fall
Rainfall
Rainfall
Ra nfall
Ra nfall
Ra nfall
Sanita t on
Sanitation
Current Water tax recovery status for GP
Arrear Water tax recovery status for GP
HH Toilet coverage status of GPs fully covered
under PWS
PWS coveragein NGP/ODF GPs.
Percentage of villages withn
i GP covered with
PWS
Number of water sourcein the GP
Averae Monsoon Ra nfallin Taluka
Average Post Monsoon Ran
i fallinTa uka
Average Pre-Monsoon Rainfall in Taluka
Average Rainfall Water Level(January) in Taluka
Average Rainfall Water Level(March)in Taluka
Average RainfallDepth OBW in Taluka
Percentage of HH toilet construction
Percentage of APL•BPL HH toilet construction
Sanita t on
Household toilets yet to be constructed
Cross-cutting issues
Cross-cuttinissues
Drink ng Water Supply
Sanitation
NGP
a ODF GPs
Sanitation
Percentage of NGP GPs
Sanitation
Monthlv rate of construction of HH toilets
Likely no of years for reach ng 1OOPercentage HH
toilet coverage for Taluka
Percentage of Schooltoilet construction
Percentage of AWC toilet construction
Sanita t on
Sanitation
Sanitation
Sanita t on
Avaia
l biltiy of Girls toilet in schools(DISE)
Sanita t on
No of girl student per toilet n schools (DISEl
Percentage of schools without water sources
w thin GP
Percentage of AWCs without water sources wi thin
Drink ng Water Suppyl
Drinking Water Supply
Cross-cutting issues
GP
Percentage of GP with Green Card as per Sanitary
Survev
I
Overview
I
Gallery
I
Contact
Indicator Descr p t
on
Construction of HH (all) toilet as
Percentage of target for Taluka
Construction of HH (APL and BPL) toilet as Percentage of target for Taluka
No of Household toilets yet to be constructed for Taluka · Gap between target
and achievement
Percentage of NGP plus ODF GPs within each Taluka compared to totaltoilet
a ODF GPs
Sanita t on
Sanita t on
About
Eng ish
achievement
Percentage of NGP GPs within each Taluka compared to totalnumber of GPs
with n Taluka
Monthly rate of construction of HH toilets in Taluka
Likely no of years for reaching 1OOPercentage HH toilet coverage for Taluka
Construction of school toilet as Percentage of target for Taluka
Construct on of AWC toilet as Percentage of target for Taluka
Percentage of schools having exclusive toilet for girls within Taluka compared to
all the schoolsin the Taluka
Number of girlstudents per toilet (for girls) in schools withn
i Taluka
Percentage of schools w thin Taluka without water sources compared to total
number of schoolsin the Taluka
Percentage of AWCs wi thin Talukaw
ithout water sources compared to total
number of AWCsin the Taluka
Percentage of GPs within Taluka wtih santiary survey status compared to total
number of GPs wtihin Ta uka
Percentage of Contamination for Taluka compared to totalnumber of GPs wi thin
the Taluka
Percentage of villages within Taulkfed wi th tankers (2008-2013) compared to
totalnumber of villages w thin Taluka
Current Water tax recovery status for allGPs withni Taluka
Arrear Water tax recovery status for allGPs within Taluka
Percentage of GPs with HH Toilet coverage better than district average out of aU
1OOPercentage PWS coverage GPs within Taluka
PWS status n NGP/ODF GPs
Percentage of villages with n GP covered with PWS
Availabilti y of water sourcein the GP
Averae Monsoon Rainfallin Taluka
Average Post Monsoon Ran
i fall in Taluka
Average Pre-Monsoon Rainfall n Taluka
Average RainfallWater Level(January)in Ta uka
Average Rainfall Water Level(March) in Taluka
Average RainfallDepth OBW in Taluka
Construction of HH (all) toilet as Percentage of target for Taluka
Construct on of HH (APL and BPL) toilet as Percentage of target for Taluka
No of Household toilets yet to be constructed for Taluka · Gap between
target and achievement
Percentage of NGP plus ODF GPs within each Taluka compared to totaltoilet
achievement
Percentage of NGP GPs within each Taluka compared to totalnumber of GPs
with n Taluka
Monthlv rate of construction of HH toilets in Taluka
Likely no of years for reaching 1OOPercentage HH toilet coverage for Taluka
Construction of school toilet as Percentage of target for Taluka
Construct on of AWC toilet as Percentage of target for Taluka
Percentage of schools having exclusive toilet for girls wi thin Taluka compared to
all the schoolsin the Taluka
Number of girlstudents per toilet (for girls) in schools within Taluka
Percentage of schools w thin Taluka without water sources compared to total
number of schoolsin the Taluka
Percentage of AWCs wi thin Taluka wi thout water sources compared to total
number of AWCsin the Taluka
Percentage of GPs wi thin Taluka with sanitary survey status compared to total
number of GPs withn
i Ta uka
46
The Wash Meta Data looks like the above page. In Meta Data you can find the “Category name”, the
“Indicator Name” and finally the “Indicator Description” in details. These categories have the
following Indicators and the description of those Indicators are shown in brief.
CENSUS‟ 11, DATA ANALYSIS ::
STATE PROFILE ::
47
DISTRICT PROFILE::
On clicking on the District Profile you need to select the name of the District from the combo box.
Click on the “GO” button to generate the District Level Report.
48
BLOCK PROFILE::
Similarly on clicking the Block Profile Button, you need to select District name first and then the
name of the Block within that District from the combo box provided.
Finally click on the “GO” button to generate the Block level report.
49
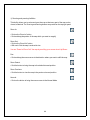
NBA Baseline Survey Data 2012 ::
Selecting any of the four categories will take us to the following page:
50
If “District Report” is clicked, below screen appears:
After selecting the preferable district from the drop-down menu, opens the report for the chosen
district.
Similar exercise can be done for analyzing report of all Districts, Blocks and Gram
Panchayats also.
51
CONTACT US::
Please feel free to contact us for further assistance.
Helpline support:
Suman Ghosh (+91-9748339151)
[email protected]
Help Desk: [email protected]
Office:
Riddhi Foundation
IB 190, Sector-III, Salt Lake City
Kolkata – 700 106
India, West Bengal
Landline No.: 033- 2335-7531
Fax Number: 033-23348097
Web site: www.riddhifoundation.org
52