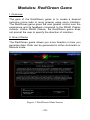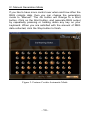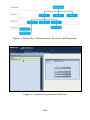
1
Table of Contents: REG-1 User Guide
WELCOME! ..............................................................................................................5
PART I: BACKGROUND........................................................................................6
THE PEAR STORY..................................................................................................6
THE PEAR METHOD .............................................................................................8
Figure 1: PEAR Cumulative Results Graph ..................................9
THE PEAR LEGACY ............................................................................................11
PART II: GETTING STARTED WITH THE PSYLERON REG-1.................12
HOW THE REG-1 WORKS..................................................................................12
HARDWARE AND SOFTWARE INSTALLATION .........................................14
Figure 1: Driver Destination Location.........................................15
Figure 2: Summary Window of Drivers Installation ...................16
Figure 3: REG-1 Correctly Connected.........................................17
Figure 4: Found New Hardware Wizard......................................18
Figure 5: Driver at Specific Location (Advanced) .......................18
Figure 6: Search for Driver Location...........................................19
Figure 7: Driver File Not Found..................................................19
Figure 1: Reflector Licensing Agreement ....................................21
Figure 2: Psyleron Games Directory ............................................22
Figure 3: Install Summary ...........................................................22
GETTING STARTED WITH REFLECTOR......................................................24
Figure 1: Reflector User Login.....................................................25
Figure 2: Reflector Main Screen..................................................26
Figure 3: Reflector Module Selection Screen ..............................27
MODULES: PEAR CLASSIC.....................................................................28
Figure 1: PEAR Classic Main Screen..........................................28
Figure 2: PEAR Classic Intention Selection................................29
Figure 3: PEAR Classic Session Running ...................................29
Figure 4: PEAR Classic Settings..................................................30
Figure 5: PEAR Classic Require Balanced Series.......................31
Figure 6: PEAR Classic Results Graph .......................................32
Figure 7: PEAR Classic Analysis .................................................33
MODULES: RED/GREEN GAME ...............................................................34
Figure 1: Red/Green Main Screen ...............................................34
Figure 2: Red/Green Session Running ........................................35
Figure 3: Red/Green Analysis ......................................................39
MODULES: SLIDER APPLICATION ............................................................40
Figure 1: Psyleron Slider..............................................................40
-2-
MODULES: ARTREG..............................................................................41
Figure 1: ArtREG Main Menu Screen.........................................41
Figure 2: ArtREG Settings Screen ...............................................42
Figure 3: ArtREG Image Importer > Existing.............................43
Figure 4: ArtREG Image Importer > Add New............................44
Figure 5: ArtREG Image Importer > Playlist ..............................45
Figure 6: ArtREG Running Screen..............................................46
Figure 7: ArtREG End-of-Run Screen ........................................47
Figure 8: ArtREG Analysis...........................................................47
MODULES: FORTUNE COOKIE ................................................................48
Figure 1: Fortune Cookie Main Screen .......................................48
Figure 2: Fortune Cookie Automatic Mode.................................50
Figure 3: Fortune Cookie Selected Fortune ................................51
MODULES: WORDGAME.........................................................................52
Figure 1: WordGame Main Menu................................................52
Figure 2: WordGame Running Screen ........................................53
Figure 3: WordGame Settings ......................................................55
Figure 4: WordGame Target Word ..............................................56
Figure 5: WordGame Select from Dictionary List .......................56
Figure 6: WordGame Goal Character No Longer Available.......57
Figure 7: WordGame Analysis .....................................................58
GETTING STARTED WITH FIELDREG..........................................................59
Figure 1: Error Opening REG .....................................................60
Figure 2: FieldREG Home Screen ...............................................61
Figure 3: FieldREG Start Session Window..................................62
Figure 4: FieldREG Session Demo ..............................................64
Figure 5: Hierarchy of Experiments, Sessions, and Segments....66
Figure 6: Analysis Experiment Selection .....................................66
Figure 7: Analysis Session Details ...............................................67
ANALYSIS ...............................................................................................................68
Figure 1: FieldREG Analysis, Select Experiment........................68
Figure 2: Sample FieldREG Analysis ..........................................70
Table 1: Analysis Graph View Options.........................................74
Figure 3: Sample FieldREG Analysis with Comments................75
PSYLERON COMMUNITY..................................................................................76
TECHNICAL SUPPORT .......................................................................................78
PART III: HORIZONS ..........................................................................................79
AREAS OF EXPLORATION ................................................................................79
Table 1: Gender Disparities Table ................................................80
Figure 1: Co-Operator Results .....................................................81
-3-
CUTTING-EDGE APPLICATIONS ....................................................................84
SUMMARY..............................................................................................................85
APPENDIX 1: PEAR THEORIES ........................................................................86
PEAR #1: Quantum Mechanics of Consciousness (Abstract).....86
PEAR #2: Modular Models (Abstract) .........................................87
PEAR #3: Consciousness Filters (Abstract).................................87
APPENDIX 2: FREQUENTLY ASKED QUESTIONS......................................88
Hardware and Software FAQ .......................................................88
Table 1: Sample REG-1 Calibration Results and Test Statistics .89
Research FAQ ...............................................................................90
-4-
Welcome!
Thank you for purchasing an REG-1 from Psyleron, the
company that allows you to directly observe and measure
the impact of consciousness on physical reality. Psyleron's
products, research, and technology are based on large
bodies of empirical data that suggest a connection between
the mind and the physical world. Our goal is to bring this
knowledge to the public by empowering REG-1 users to
discover personal insights into consciousness that enable an
enhanced understanding of nature, science, and our place in
the world.
The Psyleron REG-1 is your gateway to this realm of
personal and scientific exploration. With it, you can explore
the ways in which your mind affects the physical world,
gaining a deeper understanding of the nature of your
thoughts and emotions. At the same time, you will become
part of an emerging scientific revolution, contributing to the
study of a real phenomenon that science has barely begun
to explore.
With patience and practice you may find that you are able to
achieve increasingly larger mind-influence effect sizes. But
this won’t be easy. It will require you to confront self-imposed
limitations you never knew you had. If your experience is like
ours, you will learn to examine the nature of your feelings
and to discover how your subconscious thought processes
affect you on a day-to-day basis. Doing so will allow you to
feel more connected to the world, and more capable of
influencing it. These changes won’t just appear on your
computer screen—they will manifest in your life.
In this manual, we will explain the nature of the REG-1,
some relevant background information, and how you can put
the REG-1 to work. We hope you will find this device
remarkable and fascinating, and that it will ultimately open
your mind to new and promising possibilities.
-5-
Part I: Background
The PEAR Story
Psyleron’s products and explorations are based on the work
of the Princeton Engineering Anomalies Research laboratory
(the PEAR lab). For nearly 30 years, the laboratory
investigated the effects of consciousness on the physical
world. The PEAR story is fascinating and important, and
because PEAR was the precursor to Psyleron, we have
summarized the story here.
In 1978, Dr. Robert G. Jahn, dean of the school of
engineering and applied science at Princeton University, was
approached by a student with an unusual request. For her
senior thesis project, “Alice” was hoping to study the notion
that the human mind could directly influence the output of
physical devices. However, no one on the faculty of the
engineering school was willing to entertain this topic and
serve as an advisor for the project. Alice approached Dr.
Jahn to voice complaint and to elicit his support.
Although Dr. Jahn was not particularly compelled by Alice’s
idea, he believed the student had a right to explore her topic,
provided she did so while adhering to the appropriate
academic and scientific techniques. Alice had noted the
discoveries of Helmut Schmidt, a scientist working at Boeing
laboratories, who had reportedly found a correlation between
human intention and the output of random devices. After
meeting Schmidt to discuss his findings, Dr. Jahn ultimately
agreed to supervise Alice’s thesis project himself.
In the time that followed, Dr. Jahn found himself perplexed
by the results of the student’s study: the project confirmed
the claims of the Boeing scientist. There did seem to be an
anomalous correlation between the intentions of a human
mind and the behavior of random physical systems.
-6-
Although he had no initial interest in the topic, Dr. Jahn
quickly realized the great importance of these experimental
results. He knew that one scientific breakthrough after
another had been sparked by anomalous results—empirical
information unaccounted for by contemporary theories.
Dr. Jahn described the project’s findings and their
implications to his colleagues, who quickly came to see the
importance of the study: if the results really did uncover
evidence of direct human-machine interaction, they would
compel a change in our fundamental assumptions about
nature, and the role of consciousness within it.
In 1979, Jahn founded the Princeton Engineering Anomalies
Research lab (PEAR), and began recruiting staff to conduct
a more rigorous and formal exploration of his student’s
preliminary findings. “This title,” according to Dr. Jahn, “was
selected to emphasize that the program was a).
academically based; b). impelled by, and primarily
addressed to, technological implications; c). focused on
initially inexplicable physical phenomena; and d). pursued
via rigorous scientific methods.” He soon hired
developmental psychologist Dr. Brenda Dunne as lab
manager, and with the help of other staff members and
interns from a variety of fields, the two continued their
research at Princeton together for over 28 years.
-7-
The PEAR Method
The PEAR lab had to establish an experimental protocol for
the study of human-machine interactions—specifically
interactions upon random physical systems. To this end,
they famously utilized the Random Event Generator
(REG)—an electronic device based on fundamentally
random processes such as quantum tunneling or Johnson
noise, which, in turn, produced fundamentally random “bits”
of two possible outcomes.
The REG proved to be the ideal tool for PEAR’s
experiments. When unattended, the device outputted a
sequence of random binary events (termed “high” and “low”)
that obeyed all expected laws of probability, with an
essentially equal number of “highs” to “lows” over
significantly sized samples. This allowed the scientists to
establish an experimental baseline, and make sure the
device was correctly calibrated.
It also allowed PEAR to easily introduce the experimental
variable—namely, the presence of a human “operator,” who
was instructed to “will” the REG to produce more “highs” or
“lows” using only their intent. This approach enabled the use
of established statistical methods for analyzing the data and
related experimental results. If the operator’s intent had
caused an unusual number of “highs,” for example, this
would be revealed in the analysis as “unlikely to be due to
chance.” The stronger an operator’s effect, the less likely the
resulting data would exhibit effects attributable to chance.
PEAR ran millions of trials with hundreds of operators, using
a fixed experimental design so the data could be aggregated
together. Each trial consisted of a sequence of 200 “bits,”
with the expectation that on average, an operator should
produce 100 highs and 100 lows. The operator decided
ahead of time if he or she wanted to get more highs or more
lows. Getting more than 100 highs was called “going high;”
more than 100 lows was called “going low.”
-8-
PEAR found that over many trials, operators on average
were able to get greater than 100 “highs” when they tried to
go high and greater than 100 “lows” when they tried to go
low. When the REG was run by itself with no operator, the
results hung closer to 100 compared to when operators were
trying to go high or go low. Figure 1 shows the famous chart
showing the data for all operators for high, low, and baseline
intentions.
Figure 1: PEAR Cumulative Results Graph
The three plotted lines show the data for operators trying to
"go low" (bottom line), trying to "go high" (top line), and trying
to keep the data balanced (middle line). The graph indicates
the relative balance of highs and lows over time, and their
likelihood of occurring by chance. The straight horizontal line
across the middle is the theoretical expectation line. REG
data with no operator effect has equal odds of terminating
above or below this line. The upper and lower curved lines
are the thresholds of statistical significance. The theoretical
odds are 1 in 20 that an effect exceeding these boundaries
is due to chance. These lines are the points at which
imbalances in the high-low ratio, or deviations from the
theoretical expectation line, reach statistical significance. As
a data plot extends beyond the upper or lower threshold, the
odds that the effect is due to chance diminish rapidly.
The plot permits us to conclude with a high degree of
confidence that the PEAR operators as a group were able to
impose their intention on the REG output. When they wanted
to “go high”, overall, they produced “high” results. When they
-9-
wanted to “go low,” overall, they produced “low” results.
When the device was unattended, without any influence, the
device wandered closer to the middle.
Researchers at the lab published their results in a number of
scientific journals, though they often faced resistance and
skepticism associated with the paradigm-shifting implications
of these results. The likelihood of their cumulative dataset
occurring by chance is on the order of one in one trillion.
Experiments were not limited to REG devices—they grew to
include macroscopic mechanical devices with sensors to
detect anomalous biases in their behavior, or deviations from
their behaviors under chance conditions. In the Random
Mechanical Cascade, for example, thousands of balls
descended through a peg matrix, randomly distributing
themselves at the bottom in the shape of a bell curve. When
an operator was present and attempting to influence the bell
curve (to shift it left or right), the PEAR lab found statistically
significant deviations in its outcome in the direction of
operator intent. This suggests that consciousness affects
physical reality not just at the microscopic level of the REG,
but also within the macroscopic world as well.
Other experiments involved a linear pendulum, an upwardjetting water fountain, a Native American drum, and a
mechanical robot. Each was driven by some random system,
amenable to the influence of the human mind.
PEAR has proposed three theoretical models to account for
this direct mind-machine phenomenon: (1) Quantum
Mechanics of Consciousness, (2) Modular Models, and (3)
Consciousness Filters. A summary of each of these models
may be found in Appendix 1 of this user guide.
To learn more about the PEAR lab, you can order “The
PEAR Proposition” from the Psyleron website. This 3 DVD
set details the legendary laboratory and its 28-year history,
with a tour of the lab, lectures, and personal interviews with
director Robert Jahn and lab manager Brenda Dunne.
- 10 -
The PEAR Legacy
When the PEAR lab closed its doors in February 2007, Drs.
Jahn and Dunne said that they had accomplished all that
they could by exploring this topic in academia. “If people do
not believe the results already,” they said, “it is unlikely they
ever will. It is time for this work to be continued by a new
generation.”
Psyleron was born out of this legacy. Founded by former
PEAR lab researchers and interns, with the oversight of
Jahn and Dunne, Psyleron’s goal is to take mind-machine
interaction research to the next level. Unencumbered by
academia’s reluctance to accept new paradigms, we are
providing the tools to allow any intelligent person to become
part of that next generation of scientific investigators—
exploring one of today’s most exciting and promising new
fields right in their own home.
- 11 -
Part II: Getting Started with the
Psyleron REG-1
How the REG-1 Works
It is useful to think of the REG-1 as an electronic coin flipper;
at a conceptual level, they are not so different. Just as a
flipped coin will land in a random heads or tails position, so
will the REG produce a random binary outcome—although
instead of heads or tails, it produces a 1 or a 0. Each 1 or 0
is referred to as an event; hence Random Event Generator.
Unlike a coin flipper, however, the REG measures
fluctuations that are based on quantum processes which are
known to be fundamentally random.
According to modern physics, it is fundamentally impossible
to predict the outcome of quantum events, even with
knowledge of past outcomes. While the REG-1 does output
non-quantum 1s and 0s, these are representations of
quantum events, extrapolated by quantum tunneling into
binary outcomes. So when the output of a REG-1 is
examined statistically, these binary events are seen to
behave in perfectly random ways. So unlike a coin, which
can be influenced by physical effects and environmental
circumstances, such as wind, humidity, an imbalance in the
coin, and the technique of the toss, the REG-1 is not subject
to any known physical forces. It is truly random.
What is more interesting about the REG-1 is that it draws its
randomness from the level of electrons and atoms—a level
of reality not completely understood by scientists. Unlike the
macroscopic world to which we are accustomed—where
solid objects exist and interact with each other through
forces that can be directly observed, measured, and
predicted—the phenomena that drive the REG-1 are
governed by the rules of quantum mechanics. At this
microscopic level, outcomes are fundamentally uncertain
and are affected by observation.
- 12 -
Quantum objects are known to interact with one another at
great distances through space, and science has not yet been
able to pinpoint what it is that allows for such interaction.
This interaction over large distances is known as
entanglement, or quantum coherence. For example, it is
possible to prepare two particles in a single quantum state,
and separate them by any given distance. The two particles
have either a positive or negative spin. If an observer
changes the spin of one particle, the other particle somehow
“knows” and alters its spin. This communication seems to
happen instantaneously. Einstein referred to this anomaly as
“spooky action at a distance.” He refused to believe it
because it violated his theory of special relativity by implying
faster-than-light communication between two particles. In a
classical, macroscopic view of the world, Einstein would be
correct: we cannot change the direction of a soaring golf ball
by hitting another one in a different direction. But at the
quantum mechanical level, the laws are fundamentally
different.
The PEAR research suggests that operators can affect
random event generators from which they are far removed in
space and time. Operators in different parts of the country,
for example, have been instructed to influence the REG from
their location, thousands of miles from the laboratory. They
have also been instructed to influence an REG which will be
running sometime in the future, or one that was running
sometime in the past. In these circumstances, the operator’s
performance was comparable to the performance observed
when not spatially or temporally removed.
The mechanism by which consciousness interacts with the
physical world is still unknown, though it has been the
subject of speculation (see appendix for some of PEAR’s
theories). Some contend that quantum mechanics can
explain the phenomenon; others that a more complicated
and less understood process is occurring. In any case,
what's at issue is nothing less than the nature of reality, and
the role of consciousness within it. Psyleron’s goal in making
the REG-1 available is to facilitate these discoveries.
- 13 -
Hardware and Software Installation
Installation of the REG-1 hardware and software is
straightforward and takes only a few minutes. This manual
will provide you with step-by-step instructions and
screenshots to guide you through it. An installation video is
also available on the Psyleron CD. If you encounter any
problems, please contact us through our Technical Support
listings.
I. Items Included in your Psyleron Product Package
1) Psyleron REG-1 hardware device
2) Psyleron Software CD
3) Psyleron Basics User Manual
4) USB cable
II. Obtaining the Most Recent Psyleron Drivers and Software
There are two ways to install the Psyleron drivers and
software.
We
recommend
using
our
website,
www.psyleron.com, to ensure that you have the most up-todate versions of our software. Alternatively, you may load
the drivers and software from the Software CD-ROM
included in your product package.
III. Installing the Psyleron REG-1 Drivers
Before connecting the REG-1 to your computer, you must
first install the Psyleron REG-1 device drivers, which allow
your computer to communicate with the REG-1. The REG-1
drivers are compatible with Windows 2000, XP, Vista, Server
2003, and Server 2008 (32-bit and 64-bit versions).
Method #1: Online Download
1) Open Internet Explorer or other Internet browser
2) Go to www.psyleron.com/Beta
3) Click REG1WindowsDrivers.exe.
4) Run the Installer
5) Proceed to Step 8 below (Software Wizard)
- 14 -
Method #2: Install from Psyleron CD
1) Insert CD into your CD-ROM drive
2) Go to Start > My Computer
3) Select CD-Drive
4) Open the Program Installers folder
5) Double-click REG1WindowsDrivers.exe
6) Run the Installer
7) Proceed to Step 8 below (Software Wizard)
Software Wizard
8) Software wizard opens. Click next
9) Enter your password (located on back of CD case)
10) Click “Next” until complete.
Figure 1: Driver Destination Location
11) 3.0 MB of disk space must be available
12) Summary window of drivers installation (see Figure 2)
- 15 -
Figure 2: Summary Window of Drivers Installation
13) Select Install. This should take only a few seconds.
14) You have successfully installed the REG-1 drivers.
IV. Connecting and Configuring Psyleron Hardware
At this point, you should have successfully installed the
Psyleron REG-1 drivers. If you encountered any difficulty
during this process, please contact us through our technical
support listings located on page 78 of this manual, or email
us at [email protected].
1) Remove REG-1 device and USB cable from packaging
2) Plug USB cable into the USB port of your computer
3) Plug the other end of USB cable into the REG-1 socket
4) The REG-1 lights should now turn on (Figure 3)
5) Windows automatically detects and configures the REG-1
Note: If 4 or 5 do not occur, please try another USB port.
- 16 -
Figure 3: REG-1 Correctly Connected
(anodized aluminum case pictured)
Windows should display a small message at the bottom right
corner of the screen reading “Your new hardware is installed
and ready to use.” This message indicates that you have
successfully completed this step. Proceed to the next
section, Installing Reflector and FieldREG Software.
If the REG-1 lights turn on but Windows does not
automatically detect and configure the REG-1, Windows may
launch the Found New Hardware Wizard (Figure 4). If so,
continue at Step 6 below.
If the REG-1 lights turn on but Windows does not
automatically detect and configure the REG-1 and does not
launch the Found New Hardware Wizard, then you can
launch it by clicking Start > Control Panel > Add Hardware.
You should select the Psyleron REG-1 Device from the list of
attached hardware devices, and continue at Step 6 below.
Manual Driver Installation (only if automatic installation fails)
6) Windows should prompt you asking whether it can
connect to Windows Update to search for software. Click No
then click Next (Figure 4).
- 17 -
Figure 4: Found New Hardware Wizard
7) Select advanced option “Install from a specific location”
Figure 5: Driver at Specific Location (Advanced)
8) Enter “C:\Program Files\Psyleron\Drivers”
- 18 -
Figure 6: Search for Driver Location
9) Figure 7 appears if the wizard cannot locate a driver file.
Enter “C:\Program Files\Psyleron\Drivers\i386” and click OK.
If you are using a 64-bit version of Windows, then you
should enter “C:\Program Files\Psyleron\Drivers\amd64”.
Figure 7: Driver File Not Found
- 19 -
V. Installing Reflector and FieldREG Software
So far, you should have installed the drivers and configured
the Psyleron REG-1 device. Now it’s time to download the
software. The process is very similar to downloading the
drivers, so only screenshots for Reflector have been
provided. FieldREG is located at the same downloads page
and requires the same steps.
Method #1: Online Download
1) Open Internet Explorer or other Internet browser
2) Go to www.psyleron.com/Beta
3) Click Reflector.exe (may have version number)
4) Run the Installer
5) Proceed to Step 7 below (Software Wizard)
Method #2: Install from Psyleron CD
1) Insert CD into your CD-ROM drive
2) Go to Start > My Computer
3) Select CD-Drive
4) Click Reflector.exe (may have version number)
5) Run the Installer
6) Proceed to Step 7 below (Software Wizard)
Software Wizard
7) Software wizard opens. Click next
8) Read the licensing agreement and click accept if agree
- 20 -
Figure 1: Reflector Licensing Agreement
9) Enter your password (same as driver password)
10) Enter “C:\Program Files\Psyleron\Psyleron Games” or a
directory of your choice
11) Note: at least 23 MB of free disk space is required
- 21 -
Figure 2: Psyleron Games Directory
12) Enter “Psyleron\Psyleron Reflector” for Start Menu folder
13) Optional: create a desktop icon
Figure 3: Install Summary
- 22 -
VI. Installation Complete
Congratulations, you now are ready to use your Psyleron
REG-1, with FieldREG and Reflector software applications!
You need only run the hardware wizard once—your
computer will now recognize the REG-1 each time you use
it, so you can immediately open software applications.
If you had any problems completing the installation, please
contact us at [email protected] with the words
“INSTALLATION HELP” in the email subject line and one of
our customer service representatives will respond to you as
quickly as possible. Please be as detailed as possible in
describing your issues or asking questions, so that we can
help you resolve them quickly. An installation video is also
available on the Psyleron CD and a discussion board can be
found on Psyleron Community.
- 23 -
Getting Started with Reflector
Reflector is the starting point for your experiences with the
REG device. Reflector is the foundation on which other
Psyleron programs are built. It allows you to run Psyleron
modules and other unique tools which can be downloaded
from the Psyleron website. It allows you to explore mindinfluece effects using different combinations of audio, visual,
and statistical feedback.
Because there seems to be an array of personal subjective
variables that are involved in one’s ability to influence the
REG (e.g., confidence, comfort, emotional “resonance,”
etc.), an operator’s performance with the REG may be
thought of as a reflection of those subjective variables.
Hence the name “Reflector.”
Reflector will allow you to uncover the unique subjective
factors that help or hinder your ability to get good mindinfluence effects. Perhaps you get the best results when you
are relaxed and confident, or after you have just awoken
from sleep. Perhaps you have doubts about whether your
thoughts can impact physical reality. Reflector will help
reveal these factors to you, and chart your progress as you
embrace positive, powerful states of mind, and do away with
limiting belief systems or habits.
- 24 -
I. Users Screen
If you are using Reflector for the first time, click on New
User, and follow the instructions on the screen. You can
create any name you like, and use it as often as you like.
Please note: your Reflector username does not have to
be the same as your Psyleron Community username. If
more than one person will be using Reflector on your
computer, you may wish to create multiple user accounts, so
your data and settings will be stored separately. To do this,
click the Switch Users button to create a new account. From
this point on, you will be presented with a login screen
whenever Reflector is launched.
Figure 1: Reflector User Login
After creating a new user, you will be redirected to a settings
screen where you may enter your Community username and
password. This enables your data to be uploaded to the
Psyleron website. Please note: account information is
printed on the back side of your Psyleron CD cover.
- 25 -
II. The Main Screen
The main screen (shown below) allows you to go directly to
the Psyleron games; to create, organize, and switch users;
to look at user options, to display help, or to quit Reflector.
Figure 2: Reflector Main Screen
Please notice the “No Updates” button on the horizontal
navigation bar next to help and about. When updates for
Psyleron’s Reflector software are available, this button will
notify you to download the latest version from the Psyleron
Customer Downloads page.
III: The Settings Screen
Click on Settings to enter the Settings screen. From here,
you can set Reflector to run in fullscreen mode. You can also
change or test your Community account information, which
is used for uploading data online. If you have more than one
REG-1 device connected, you can click Datasource Settings
- 26 -
in the Settings screen to select which REG-1(s) may be used
to generate data in Reflector. Only one REG-1 is used at a
time. You can also choose PSEUDO_REG, an internal
software algorithm that generates non-random events for
simulation purposes in lieu of the actual REG-1. In some
versions of Reflector, you can choose REMOTE_REG to use
random data generated on a remote computer.
IV. The Module Selection Screen
Click on Games List to reach the module selection screen.
This allows you to pick from the different applications for the
REG-1, and launch them. Each application has a graphical
icon, and gives some information about it in the right-hand
column. From here, you can click on the buttons to launch
the game, launch the Analysis application to analyze data
from the game, or launch Psyleron Community to view your
uploaded data online.
Figure 3: Reflector Module Selection Screen
- 27 -
Modules: PEAR Classic
I. Overview
The PEAR Classic program mimics the look and feel of the
original experiments conducted at the PEAR lab. Your goal
in this experiment is to “Go High” or “Go Low,” while a
cumulative deviation graph of your performance is displayed
on the screen.
Figure 1: PEAR Classic Main Screen
II. How it Works
At the beginning of each trial, you will be asked to state your
intention. Within a moment of indicating your preference, a
line will begin to appear on the screen. Use your intention to
make it move up or down—up for “high,” down for “low.”
- 28 -
Figure 2: PEAR Classic Intention Selection
Figure 3: PEAR Classic Session Running
- 29 -
III. Settings
All game applications in Psyleron Reflector enable users to
upload their results to Psyleron Community, if they choose.
This option, along with others, is located in Settings.
Figure 4: PEAR Classic Settings
Experiment Name: Make sure to specify an experiment
name so you may analyze the data using Psyleron’s built-in
Analysis application and/or find your results online
immediately after the session is complete.
Trials per Second, Trials per Run, and Total Trials: Trials
are generated continuously in PEAR classic, unlike in the
Red/Green game where the user presses a button on the
keyboard to generate each trial. By default, 2 trials are
generated per second and there are 100 runs, thus each run
takes 50 seconds. An experiment is complete when the total
number of trials is reached. In the default case, the
- 30 -
experiment will last about 8½ minutes for 1,000 total trials
(50 seconds times 10 runs of 100 trials each).
Allow Baseline Intention: You always have two intention
options (aim high or aim low). Allow Baseline Intention gives
you a third; that is, to remain near the horizontal baseline.
Require Balanced Series: This option requires that you run
an equal number of high and low trials to complete an
experiment. For example, after running 10 consecutive high
sessions in a 20-session experiment, the next 10 intentions
must be low as shown below.
Figure 5: PEAR Classic Require Balanced Series
Upload Results to Community: data generated will
automatically be uploaded to the Psyleron site when you exit
PEAR classic, even if you have not completed the
experiment by reaching the total trials specified in settings.
- 31 -
IV. The Graph
The graph indicates the relative balance of highs and lows
over time, and indicates their likelihood of occurring by
chance. The straight horizontal line across the middle is the
theoretical expectation line. REG data with no operator effect
has equal odds of terminating above or below this line. The
upper and lower curved lines are the thresholds of statistical
significance. The theoretical odds are 1 in 20 that an effect
exceeding these boundaries is due to chance. These lines
are the points at which imbalances in the high-low ratio, or
deviations from the theoretical expectation line, reach
statistical significance. As a data plot extends beyond the
upper or lower threshold, the odds that the effect is due to
chance diminish rapidly.
Figure 6: PEAR Classic Results Graph
V. Tips and Tricks
The PEAR Classic module is well-suited to users who
choose to statistically analyze their effects. The requirement
- 32 -
that the operator generate fixed numbers of trials, and the
option to require balanced series, permit an analysis of the
resulting data without consideration of the confounding
effects of unequal sample sizes and the operator’s freedom
to choose when to stop.
Some operators find that the PEAR Classic module inhibits
their ability to get effects because of its limited feedback
and/or because it gives the operator no control over when
individual trials occur. Operators may prefer to hit a button to
generate trials, and may prefer richer visual feedback. For
these purposes, the Red/Green game is better suited.
VI. Analysis
In PEAR Classic, each trial is the average of 200 binary
outcomes from the REG. In the statistics panel of the
Analysis application, Mean, Min, and Max represent the
average, minimum, and maximum number of "up" bits out of
200 total bits occurring in each trial.
Figure 7: PEAR Classic Analysis
- 33 -
Modules: Red/Green Game
I. Overview
The goal of the Red/Green game is to create a desired
outcome (more reds or more greens) using one’s intention.
The Red/Green game gives the user greater control over the
experience and its feedback compared to the PEAR Classic
module. Unlike PEAR Classic, the Red/Green game does
not prompt the user to specify the direction of intention.
II. How it Works
The Red/Green game allows you more freedom in how you
generate data. Data can be generated in either Automatic or
Manual mode.
Figure 1: Red/Green Main Screen
- 34 -
To operate in manual mode, simply press any key to start a
trial and generate an outcome. In this game, the color green
correlates to “high,” and red to “low.” For example, if your
goal is to “go high,” then each green outcome you produce is
successful, and this is depicted in the graph and calculated
as part of your statistical feedback.
Automatic mode generates outcomes using the auto-run
operation. Enter a number of bits to be generated, hit autorun. Outcomes will stop being generated when the entered
number is reached or when the stop button is clicked.
The Red/Green game does not prompt the user to specify an
intention or store any data indicating the user’s intention.
Note that the “Upload Data” option is located on the main
screen and cannot be changed once a session has started.
Figure 2: Red/Green Session Running
- 35 -
III. Options/Controls
Any Key: Press and release any key to collect a single bit
(discrete collection). Press and hold any key to collect bits
continuously until the key is released (continuous collection)
Speed Slider: The rate of continuous collection and the
maximum rate of discrete collection both depend on the
speed slider setting (between 1 and 100; 100 is fastest).
Auto-Run Iterations: Enter a number in this field and click
Go. This automatically collects the indicated number of bits.
Automatic continuous collection ends when the specified
number is reached or when the user presses the stop button.
Reset: Ends the current segment and begins a new
segment. Clears the Graphical Feedback panel.
Sound: Enable sounds for green and red outcomes.
Show Feedback: If this button is checked, the Graphical
Feedback and Session Statistics panels are displayed. If
unchecked, there is no indication of your results until you
recheck Show Feedback. Some users prefer this setting, to
focus on their intention and not their performance.
Graphical Feedback Selection: A drop-down menu allows
selection of PEAR Deviation graphical feedback or Runs
Bins graphical feedback. Refer to the section below on
Graphical Feedback Panel for more details.
Session Statistics Selection: A drop-down menu allows
selection among three displays of session statistics. Refer to
the section below on the Session Statistics Panel for more
details.
Mode: The Options button on the introduction screen of the
game allows the user to choose among several experimental
game modes that are not documented in this manual.
- 36 -
IV. Graphical Feedback Panel
The Graphical Feedback Panel displays data for the current
segment. There are two types of graphical feedback
available: PEAR Deviation and Runs Bins. Beginning users
are encouraged to use the PEAR Deviation feedback, which
is more intuitive than the Run Bins feedback.
The PEAR Deviation graph indicates the relative balance of
highs and lows over time, and indicates their likelihood of
occurring by chance. The gray straight horizontal line across
the middle is the theoretical expectation line. REG data with
no operator effect has equal odds of terminating above or
below this line. The upper (green) and lower (red) curved
lines are the thresholds of statistical significance. The
theoretical odds are 1 in 20 that an effect exceeding these
boundaries is due to chance. These lines are the points at
which imbalances in the high-low ratio, or deviations from
the theoretical expectation line, reach statistical significance.
As a data plot extends beyond the upper or lower threshold,
the odds that the effect is due to chance diminish rapidly.
The Runs Bins display shows a table of the counts of runs of
successive “up” bits and “down” bits in order of increasing
run length. Below the table is a graph indicating the
likelihood of experiencing these counts of runs under the
theoretical model. Tall bars appearing above or below a run
length number indicate that the current session has had a
greater number of “green” or “red” runs of this length than is
expected under the theoretical model.
V. Segment Statistics and Session Statistics Panels
The Segment Statistics Panel displays numerical statistics
for the current session, including total number of trials and
hit rate (percentage of “green” outcomes). Also shown are
the overall, minimum, and maximum z-scores. Z-score (also
called “standard score” or “normal score”) measures how
unlikely an experimental outcome is under the theoretical
model. It indicates how far and in what direction an outcome
deviates from the theoretical expected value, in units of
- 37 -
standard deviations. Intuitively, a larger z-score means that
your results are less likely to be due to chance. In practice,
the z-score can be used as an index of your performance: a
greater z-score in the direction of your intention indicates a
larger influence on the REG. Z-score only serves as an
accurate measure of your performance across large
numbers of trials. At a minimum, z-scores should only be
considered for segments with greater than ten trials.
The Session Statistics Panel displays data for the current
segment and up to nine previous segments in the current
session. There are three graphical display options: Session
Runs Bins, Session Overall Z-Scores, and Session Max and
Min Z-Scores. The Session Runs Bins display shows the
longest “green” run and longest “red” run in each segment.
The Session Overall Z-Scores display shows the overall or
terminal z-scores of each segment. The Session Max and
Min Z-Scores display shows the highest and lowest z-scores
reached in each segment. Z-scores larger than 1.69 or
smaller than -1.69 are shown in color, while other z-scores
are shown in gray. Segments with overall z-scores
exceeding these boundaries have theoretical odds of 1 in 20
of occurring under standard experimental protocols including
a pre-established number of trials per segment.
VI. Step-By-Step Instructions
1) Read the game instructions on the opening screen
2) Enter an experiment name and click Start
3) You may note your intention (green for “go high;” red for
“go low”) or make other notes using the Comment button.
Comments are visible later in Analysis.
4) Adjust the Speed Slider to your preference.
5) For discrete collection, press and release any key to
generate one bit
6) For continuous collection, press and hold any key to
generate bits continuously until the key is released.
7) For automatic continuous collection, set Auto-Run
Iterations to a given number and hit Go
8) You can select Reset to start a new session or Quit to
return to the Reflector main screen at any time.
- 38 -
VII. Analysis
Remember that time when you had an outstanding session?
Wish you could look at the graph one more time? You can
with Psyleron’s Analysis application. If you look back at the
main screen of Reflector, “Figure 3: Reflector Module
Selection Screen” you will see the buttons Analysis,
Website, Web-Stats, and Launch Game when a game is
highlighted. Click the Analysis button when the Red/Green
game is selected to be able to view past sessions as
illustrated below.
Figure 3: Red/Green Analysis
Always remember to analyze segments rather than an entire
session. This is important because some segments you may
have intended to generate green (aim high) and others to
generate red (aim low). When the Reset button is hit during
a Red/Green session, a new segment is created.
- 39 -
Modules: Slider Application
I. Overview
The Slider game is similar to the Red/Green game and the
PEAR Classic experiment. The Slider game involves prestated intentions. First, press a key to choose your intention.
Your intention may be to generally move to the left
(counterclockwise) or to the right (clockwise). A ball then
begins moving on the circular slider track. The goal is to
make the ball get to the end of the track in the direction of
your intention.
II. How it Works
Simply press the ‘R’ or ‘L’ key on your keyboard (for “right” or
“left”) to choose your intention. Or, if you are using automatic
mode, press a key to begin and your intention will be chosen
for you based on the predefined parameters. Like PEAR
Classic and the Red/Green game, Slider responds to the
behavior of the REG-1, and thereby to the influence of your
intention. Instead of a statistical graph, however, the ball is
made to move around the track.
Figure 1: Psyleron Slider
- 40 -
Modules: ArtREG
I. Overview
Like the PEAR Classic module, ArtREG is another
application inspired by the work of the Princeton Engineering
Anomalies Research (PEAR) lab. The objective is to make a
picture appear on the screen. When you are doing well, the
image will be clear and very few pixels will be distorted.
Otherwise, the image will be distorted and hard to see.
Users may add their own custom pictures by using
Psyleron’s built-in image importer for the module. Meaningful
pictures may help the user to generate stronger REG effects.
The results of each image are represented as a new
segment in the Analysis application.
Figure 1: ArtREG Main Menu Screen
- 41 -
II. Settings
Experiment Name: This name is stored in Analysis so you
can review your data once the session is complete.
Auto-Mode: Automatic or Manual. In Automatic, the trials
are automatically generated. In Manual, each keypress on
your keyboard generates a trial.
Trials per Picture: Length of each segment (i.e. image).
Pictures Selected: Random, User, or Playlist Mode.
Randomly: Program randomly selects picture to use.
User: Scroll between images in run game screen.
Playlist: Specify order of images to be run.
Upload Data Online: If checked, data is uploaded to the
Psyleron server. Data is always saved locally.
Display End of Run Graph: If checked, a graph of your
results is displayed at the end of each run.
Figure 2: ArtREG Settings Screen
- 42 -
III. Image Importer
Image Importer enables the user to manage which images
the ArtREG program is using. There are three menu tabs in
image importer: Existing, Add New, and Playlist.
Existing
The Existing menu displays which pictures the program can
use. It provides image information (width and height) and
gives you a preview of each picture. It also allows you to
delete images from the “pool” of pictures that the ArtREG
program can choose from.
Figure 3: ArtREG Image Importer > Existing
- 43 -
Add New
The Add New menu lets you insert a new picture into the
pool of images that the ArtREG program draws from. First,
you enter the directory where your pictures are stored (for
example, “C:\pictures”). Click on the Search button. If the
directory can be found, a list of .bmp, .jpg, and .jpeg files will
be populated in the drop-down box called Input Files.
Select the image that you wish to add from the drop-down
box. The image will appear in the window. Select the portion
of the image that you want to import by clicking and dragging
your mouse over the area on the picture. Click Preview and
you will see the cropped image, with width and height
information. Type an output filename and click Import. The
file will be saved and made available in the Existing menu for
viewing and for use in ArtREG.
Figure 4: ArtREG Image Importer > Add New
- 44 -
Playlist
Remember, there are three types of picture selection modes
in ArtREG (Random, User, and Playlist). When the Playlist
picture selection mode has been chosen in the Settings
screen, the playlist in image importer defines the order of
pictures to be used in an ArtREG session, starting from the
top. Once all the images in the playlist have been used, the
playlist will repeat until you quit the session.
Figure 5: ArtREG Image Importer > Playlist
IV. ArtREG Game Play
Now that you understand the ArtREG settings and know how
to add custom images using the image importer, you are
ready to run the game. There are two feedback bars on the
run game screen. The one at the top represents the
cumulative z-score of your session. The one at the bottom
indicates the completion percentage of your segment.
- 45 -
Figure 6: ArtREG Running Screen
If you have chosen User picture selection mode, you will be
prompted to click the left and right arrow buttons (<< and >>)
in the bottom right corner to select an image, and to click the
play button (>) to begin. In Random or Playlist modes, you
will be prompted to press any key to begin.
Once your segment is complete (i.e. trials per picture is
reached), you will see the end-of-run screen (Figure 7). The
thumbnail image in the upper left corner shows the picture at
the completion of your segment. The graph displays the
cumulative deviation for your segment, the run number, and
the overall z-score. From here, you can either go back to the
main menu by clicking the Back button, run another segment
by clicking the Play Again button, or exit out of the ArtREG
program completely by clicking the Quit button.
After exiting from ArtREG, you can view graphs and
statistics from your ArtREG sessions by selecting ArtREG in
the module selection screen and clicking Analysis.
- 46 -
Figure 7: ArtREG End-of-Run Screen
Figure 8: ArtREG Analysis
- 47 -
Modules: Fortune Cookie
I. Overview
The Fortune Cookie module randomly selects fortunes that
can be used to answer any question. It is like a Magic 8-Ball
combined with over 100 possible fortunes. Ask a question
and you will be given an answer. However, you will not just
be given any answer. Fortunes are given z-scores based on
the output of your Psyleron REG-1. Each fortune is
represented by a fortune cookie on the screen. The brighter
the fortune cookie, the greater the z-score of its fortune. At
the end of a round, the fortune inside the brightest cookie is
revealed. You may be surprised how often the REG delivers
the appropriate fortune for your question.
Figure 1: Fortune Cookie Main Screen
- 48 -
II. How it Works
Once you have launched the program, it is time to enter your
question. Type your question into the text area located at the
top left of the screen. You may want to enter additional
information into the question as well, such as how you are
feeling and what your desired fortune would be.
64 fortunes will be randomly selected from a fortune file that
is located in the directory in which Reflector was installed
(typically C:\Program Files\Psyleron\Psyleron Games\) under
plugins\fortuneCookie\fortunes. Every .txt file in this directory
will be included in a drop-down box in the main screen. You
can have multiple fortune files and select the appropriate
one for your question.
Psyleron recommends that you create personal fortune files
for different categories such as “business” or “daily”, specific
to certain areas in your life. Before you hit the Go button and
start generating data, choose which fortunes text file you
would like to use based on the particular question that you
would like to ask.
The Generation Mode determines how much REG data is
generated to answer each question. There are two primary
modes of generation. They are “automatic” and “manual”
generation modes.
III. Automatic Generation Mode
By default, the generation mode is set to “5 seconds.” This
means that after you have entered your question, the REG
will generate data for 5 seconds after you press the Go
button. Over these 5 seconds, each fortune cookie will be
given a z-score based on the REG output; the brighter the
fortune cookie, the higher the z-score. You may stop
automatic generation anytime by clicking on the Stop button.
- 49 -
IV. Manual Generation Mode
If you like to have more control over when and how often the
REG collects data, then you can change the generation
mode to “Manual”. The Go button will change to a Start
button. Click on the Start button, and generate REG output
by repeatedly pressing or holding down any key on your
keyboard. When you are satisfied with the amount of REG
data collected, click the Stop button to finish.
Figure 2: Fortune Cookie Automatic Mode
- 50 -
V. Selecting a Fortune
When automatic generation mode has finished, or when you
have clicked the Stop button in manual generation mode, it
is time to read your fortune. The brightest fortune cookie (the
cookie with the highest z-score) is circled. Click that cookie
and see your fortune. If you feel that the selected cookie is
not sufficiently brighter than all the others, you can continue
collecting REG data by selecting a longer time interval and
hitting the Go button again.
Figure 3: Fortune Cookie Selected Fortune
We hope you enjoy the Psyleron Fortune Cookie module
and that it benefits you in your daily life. Enjoy the module
and ask it difficult questions. It may not work every time, but
it will always force you to think about the questions you are
asking and to reflect on the power of your intention.
- 51 -
Modules: WordGame
I. Overview
In all of the Reflector modules, you set a pre-specified
intention and then run a session to see if you can influence
the REG output to produce the outcome that you desire.
From the simple Slider application where you attempt to
move a ball clockwise or counter-clockwise, to the more
complicated ArtREG game where you attempt to make an
image appear, your goal is always to affect your REG in the
direction of your intention.
The WordGame has the same objective. However, it is
different in that you are trying to generate REG data that
spells a pre-specified word.
Figure 1: WordGame Main Menu
- 52 -
During game play, letters are generated one at a time. At the
start of the game, all 26 letters of the alphabet appear in
random order in a vertical column on the left side of the
screen. Half of the letters appear above the center of the
screen, and half appear below the center. The letter you
intend to select appears in green. As you generate REG
data, a graph of the data is plotted on the screen. Your goal
is to make the graph go in the direction of your intended
letter.
Figure 2: WordGame Running Screen
For example, if your intended letter (“goal character”) is
above the center line, you should try to make the graph go
up. Then when the graph reaches the right edge of the box,
WordGame looks to see whether the graph has finished
significantly above the center line. If it has, then the letters
below the center line are discarded, and the next step
begins. Now, the letters that were above the center line are
split above and below the center line. Your intended letter
still appears in green. Once again, try to go in the direction of
your intended letter, to eliminate the half of the remaining
letters that do not contain your intended letter.
- 53 -
This process repeats until a letter has been selected. Then
the process begins again with your second letter.
II. Settings
Experiment Name: This name is stored in Analysis so you
can review your data once the session is complete.
Trials Per Set: The length of each set (each alphabet split).
Reset Once Lost: Should the game end immediately if your
goal character is not chosen?
Statistical Threshold: The alphabet will split only if a
significant deviation from the center line is reached.
Alphabetical Order: Sort letters randomly or alphabetically?
Prompts On: If selected, then when the goal character is no
longer one of the possible letters remaining, you will receive
a prompt asking whether you want to continue manually,
continue automatically, or just jump to the next letter.
Upload Data Online: If checked, data is uploaded to the
Psyleron server. Data is always saved locally.
Number of Starting Letters: The more letters you start with,
the more iterations you have to go through to get the goal
character you want (i.e. the more difficult it will be).
III. Playing Modes
User Enters Target Word
This is the default mode. It is enabled when Free Style
Writing is set to No and User Enters Expression is set to
Yes. When you click the Start button in the main menu, you
will be prompted with a dialog box asking you to enter a
target word (Figure 4). Type it in and click Go to get started.
- 54 -
Figure 3: WordGame Settings
User Selects from List of Target Words
This mode is enabled when Free Style Writing is set to No
and User Enters Expression is set to No. When you click the
Start button in the main menu, you will be prompted with a
dialog box asking you to select from a list of target words
(Figure 5). These target words are taken from a text file
located in the directory in which Reflector was installed
(typically C:\Program Files\Psyleron\Psyleron Games\) at
plugins\ WordGame2\wordDictionary.txt. After you make
your selection, click Go to get started.
You can edit the text file containing target words. The
maximum number of target words in the text file is 25.
- 55 -
Figure 4: WordGame Target Word
Figure 5: WordGame Select from Dictionary List
- 56 -
Free Style
This mode is enabled when Free Style Writing is set to Yes.
When you click the Start button in the main menu, you will
be directed to the run game screen. In this mode, there are
no target characters. No data is stored in Free Style mode
because there is no stated intention.
IV. Other Notes
When you have Prompts On checked, whenever the goal
character is no longer available, you will receive a prompt
asking whether you want to continue manually, continue
automatically, or just jump to the next letter (Figure 6).
Figure 6: WordGame Goal Character No Longer Available
AutoSet, AutoLetter, AutoWord Buttons
These buttons enable you to generate data without pressing
keyboard keys. Data will be generated automatically until a
set is complete, letter is complete, or entire word is complete
depending on which button was clicked.
- 57 -
V. WordGame Analysis
Each time the graph moves in the direction of the goal
character (the direction of your intention), you are getting a
hit. Each time the graph moves towards the opposite
direction, you are getting a miss. In the Analysis tool, hits are
shown as upward ticks in the graph, and misses are shown
as downward ticks in the graph.
Note that when the target character is no longer available,
data is not stored and will not be available in Analysis. This
is because there is no stated direction of intention.
Figure 7: WordGame Analysis
Each attempt to split the remaining letters in half appears as
a distinct segment in Analysis. Successful selection of a
letter takes at least four segments. An unsuccessful attempt
to select a letter may take only one segment, or more. The
segments are named in the following format:
target letter - U(letters above center) L(letters below center)
- 58 -
Getting Started with FieldREG
I. Overview
FieldREG is based on a different way of using the REG-1.
Instead of influencing the REG directly, a user can run
FieldREG in the background to collect REG data during
interesting events, such as brainstorming sessions, concerts,
guided meditations, visits to sacred sights—even while
dreaming. PEAR research shows that the REG tends to
respond to significant moments during these events, namely
group “resonance,” the discussion of powerful ideas, and
other instances of emotional or intellectual meaningfulness.
This makes FieldREG a unique and useful tool for multiple
purposes. Users have employed FieldREG to study group
consciousness, to provide feedback on group coherence,
and to measure the effectiveness of presentations and
performances.
The FieldREG software is particularly useful for users who
want to conduct more formal experiments on the mindinfluence effects and consciousness fields of individuals and
groups. The application allows a user to enter comments into
the data while FieldREG is running to keep track of important
changes during the course of the experiment. It also allows
you to index “segments” of a session, while data is still being
collected. If you were running FieldREG during a public
debate, for example, you could start a new segment each
time a candidate spoke, and use the comments field to
indicate them as “speaker 1” and “speaker 2.”
Like Reflector, FieldREG provides visual and statistical
feedback in real-time. It also offers an Analysis application to
review previous experiments or exploratory sessions and
their individual segments.
- 59 -
Before getting started, please make sure your REG-1
hardware device is properly installed and configured,
following the instructions in the “Hardware and Software
Installation” section of this manual. If the REG-1 is not
connected, or otherwise improperly installed, the FieldREG
program will default to the “pseudorandom device”—an
internal software algorithm that generates non-random
events for simulation purposes in lieu of the actual REG-1.
If the REG-1 is not connected or improperly installed, the
following message (Figure 1) will be displayed:
Figure 1: Error Opening REG
II. The Main Screen
Navigate from the Main Screen to change user settings,
analyze past sessions, or start a new session.
- 60 -
Figure 2: FieldREG Home Screen
III. Settings
Clicking the Settings button allows you to enter your account
username and password. These correspond with your
Psyleron Community account. This account information is
necessary in order to upload your FieldREG results to
Psyleron Community. Otherwise, data generated from your
sessions will be stored locally for later submission.
If you need to reset your account name and/or password,
please contact us at [email protected].
IV. Starting a New Session
Click on the Start Session button in the Main Screen to start
a new session. At the next screen, you are prompted for two
required fields: experiment name and session name. You
must enter these to begin the session.
- 61 -
The experiment name is the highest-level identifier for any
given run (sessions compose parts of an experiment). The
most recent experiment is used by default. If you would like
to create a new experiment, change this field to a new name.
Figure 3: FieldREG Start Session Window
V. Session Information
Summary: Description of session (e.g. date and time)
Sample Size: Number of bits comprising one sample.
Per Second: Number of samples collected per second.
Start:
Start Immediately: Start upon clicking GO
Start Time: Start at specified time
End:
Run Indefinitely: Run until user selects to stop
Stop Time: Stop at specified time
- 62 -
When you are satisfied with the experiment and session
name as well as all the FieldREG options, you are ready to
start collecting data. Click the GO button and you will be
redirected to the session screen (Figure 4).
VI. The Statistics
To enable real-time graphical and statistical feedback, check
Allow Feedback before beginning a session.
Graphical and statistical feedback in FieldREG follows the
same format as Reflector. The graph plots the relative
balance of highs and lows over time, and indicates their
likelihood of occurring by chance. The straight horizontal line
across the middle is the theoretical expectation line. REG
data with no consciousness effects has equal odds of
terminating above or below this line. The upper and lower
curved lines are the thresholds of statistical significance. The
theoretical odds are 1 in 20 that an effect exceeding these
boundaries is due to chance. These lines are the points at
which imbalances in the high-low ratio, or deviations from
the theoretical expectation line, reach statistical significance.
As a data plot extends beyond the upper or lower threshold,
the odds that the effect is due to chance diminish rapidly.
The lower left-hand corner of the data plot displays the
number of trials run, as well as the accompanying z-score..
Z-score (also called “standard score” or “normal score”)
measures how unlikely an experimental outcome is under
the theoretical model. It indicates how far and in what
direction an outcome deviates from the theoretical expected
value, in units of standard deviations. Intuitively, a larger zscore means that your results are less likely to be due to
chance. In practice, the z-score can be used as an index of
your performance: a greater z-score in the direction of your
intention indicates a larger influence on the REG. Z-score
only serves as an accurate measure of your performance
across large numbers of trials. At a minimum, z-scores
should only be considered for segments with greater than
ten trials.
- 63 -
Figure 4: FieldREG Session Demo
VII. Options/Controls
Submit Comment: During your session, you may record
notes on subjective factors, environmental factors, or any
observations you make in the course of the experiment. You
may comment on your present mood, any thoughts or
feelings you may have, or techniques you are using to
influence the REG-1. You might comment that the group you
are monitoring seems particularly cohesive at the moment,
or particularly tenuous. Comments are saved with your data
so you can look for correlations between the REG data
stream and these factors.
Display Results: This option allows you to hide session
feedback. Some operators use this option to avoid focusing
on performance while concentrating on the session or
experiment.
- 64 -
Uploading Data to Psyleron Community: This option
allows you to share your raw data, stories, and experiences
with others online and also contribute to ongoing research.
Please note that data is always saved locally on your
computer. See the section on Psyleron Community in this
manual for more information.
Splitting up the session into segments: Is there a sudden
change in your environment during a session? A car alarm
started going off right outside your window? You don’t have
to restart. Click the New Segment button, and enter a new
name for it to identify the change. Data collection continues
without interruption during this process.
Pause, Restart, and Stop & Quit: Clicking the Pause button
will pause the session. FieldREG will not resume collecting
data until the Restart button is clicked. The Finish & Quit
button ends the session completely and closes FieldREG
program.
VIII. Analysis
FieldREG includes its own version of the Psyleron Analysis
application for reviewing and analyzing saved data.
FieldREG Analysis is accessible from the FieldREG Main
Screen. The application analyzes each experiment
separately. For example, suppose you run FieldREG
sessions during soccer games. You may have an
experiment called “soccer league” with a new session for
each game. Your segments are “1st half,” “halftime,” and “2nd
half.” You want to review your results from a particular game.
To do so, select the Analysis button, then the experiment
name, then the session name. Keep in mind that while you
have a single experiment name, multiple sessions can exist
within each experiment and multiple segments within each
session.
- 65 -
Figure 5: Hierarchy of Experiments, Sessions, and Segments
Figure 6: Analysis Experiment Selection
- 66 -
Figure 7: Analysis Session Details
Notice the drop-down menu for viewing segments. This
gives you the option to review the results for your entire
session or go to a specific segment. Figure 7 shows a graph
of an entire session. Session information and statistics are
displayed, including average z-score, overall or terminal zscore, duration, user-entered summaries, and the number of
trials.
Based on customer suggestions, we have added Save
Image and Data Export features to Analysis. The data export
feature is only included in some versions of the REG-1
package. Just click the arrow-to-graph and arrow-to-paper
buttons, located to the right of the results graph. Upon
saving a graph or exporting data, the folder containing the
image file will open automatically if you select the option for
this. The location of the saved file depends on the directory
in which FieldREG was installed.
- 67 -
Analysis
I. Overview
The Psyleron experience is not over when you finish running
an experiment. With Analysis and Psyleron Community, you
can go back and review your results whenever you want.
Analysis can be launched within Reflector from the module
selection screen, or within FieldREG from the main screen.
Analysis has features that are specific to individual Reflector
modules and to FieldREG. To analyze FieldREG data, you
must launch Analysis from within FieldREG. To analyze data
from a specific Reflector module, you must click on that
module in the module selection screen and click Analysis in
the panel on the right side.
II. Selecting an Experiment and Session for Analysis
Figure 1: FieldREG Analysis, Select Experiment
- 68 -
After launching Analysis, you must first select an experiment
(Figure 1). Experiments are listed in the panel on the left
side. Click on an experiment and then click Select This
Experiment.
You may also rename or delete an experiment or merge two
experiments together. To merge two experiments, select one
of the two experiments you want to merge together, and click
Merge Experiment. Then, in the right panel of the dialog box
that pops up, choose the experiment into which the selected
experiment should be merged.
After selecting an experiment, you must next select a
session. An experiment comprises one or more sessions.
Click on a session and then click Select This Session to
proceed to the Analysis window. You may also rename or
delete a session or move a session into a different
experiment.
III. Understanding the Analysis Window
Analysis allows you to examine an entire session, or
individual segments from a session. In most Reflector game
modules, the direction of intention is specified by the user.
User intentions may change from segment to segment
during a session. Analysis allows you to display your results
for an entire session, or individually by segment. Note that
Red/Green sessions and FieldREG sessions do not have a
recorded direction of intention.
When you first enter the Analysis window, the graph and
statistics for your entire session are displayed. In the upper
right of the Analysis window, you will see the segment
selection box. You may select an individual segment in this
box. Once you make a selection, the graph and statistics
display the data for the segment you have selected.
In the illustration below (Figure 2), the session consists of 3
segments, labeled Initial Segment, AutoSegment1, and
AutoSegment2. The session is using a trial size of 20 bits.
- 69 -
Figure 2: Sample FieldREG Analysis
The Analysis window can be broken down into four parts:
1. Moudle, Experiment, and Session (top row)
2. Session Info, Statistics, and Segments (2nd row)
3. Cumulative Results Graph (3rd row)
4. Graph View Options (far right)
Module, Experiment, and Session
This navigation bar allows you to go back and change the
experiment or session without having to exit Analysis. Notice
that session names for Reflector depend on date and time,
while FieldREG session names are based on user input.
- 70 -
Session Info, Statistics, and Segments
This row appears in three different configurations:
1. Entire Session and Segment Information
2. Selected Range Information
3. Ad Hoc Commenting
1. Entire Session and Segment Information
When you first enter the Analysis window, session and
segment information are displayed in this row. Session
information includes the start time and duration of the
session, along with summary notes entered by the user.
The statistics displayed will change depending upon which
segment you have highlighted. If the “Entire Session” is
highlighted under segments (as it is in the illustration above),
then the statistics are session statistics. If a segment is
selected, then they are segment statistics.
- 71 -
2. Selected Range Information
When you click and drag the mouse cursor over the graph to
select a range of trials, the statistics are specific to only that
range of data.
3. Ad-Hoc Commenting
Users can enter comments after the session is over using
Analysis. Just select the trial (or range of trials) on the graph
and click the comment button, which appears as a “speech
bubble” on the far right. The Ad-Hoc Commenting feature is
only available in some versions of the REG-1 package.
Statistics
1) Bits = Number of REG-1 bits making up each trial
2) Mean
The average number of “up” or “1” bits per trial. If the trial
size (bits) is set to 200, we expect 100 1-bits and 100 0-bits
for each trial (just like we would expect 50% heads and 50%
tails). However, deviations from chance cause more or fewer
bits to go in a certain direction (hopefully in the direction of
your intention). Let’s take a simple example. Suppose only 5
trials make up a segment. The REG-1 outputs the following:
Trial 1: 85 1-bits (and 115 0-bits)
Trial 2: 110 1-bits (and 90 0-bits)
Trial 3: 125 1-bits (and 75 0-bits)
Trial 4: 105 1-bits (and 95 0-bits)
Trial 5: 95 1-bits (and 105 0-bits)
The average would be (85+110+125+105+95)/5 = 104. In
this example, if you “aimed high,” then the average is aligned
with your intention—it is higher than the expected the 100 1bits out of 200 total bits that would be expected by chance.
- 72 -
3) Min and Max
In FieldREG and in some Reflector modules, each trial may
be composed of more than one bit. Min is the smallest
number of 1-bits in a sample Max is the largest number of 1bits in a sample
4) Z-Score
The z-score relates the "distance" an experimental outcome
falls from the mean, in standard deviations, in other words,
how unlikely it is that your results are due to chance. In
practice, it may be thought of as your index of performance:
the higher the z-score, the larger the influence on the REG.
5) Trials
Indicates the number of trials in a session or segment.
Multiply Trials by Bits to get the number of bits in a session
or segment.
Cumulative Results Graph
The cumulative results graph allows you to visually compare
your results (indicated by the line graph) to the thresholds of
statistical significance (indicated by the parabola curves).
The theoretical odds are 1 in 20 that the results curve
terminates beyond these curves by chance. If “Entire
Session” is highlighted, then the graph displays all trials. If
an individual segment is selected, then the graph displays
only the trials in that segment.
- 73 -
Graph View Options
Fit Full Parabola scales x- and y-axes so the
significance curve (parabola) fits all data
Fit Visible Parabola scales y-axis such that the
significance curve fits the visible data
Fit All Data scales x- and y-axes so all data takes up
100% of the graph
Fit Visible Data scales y-axis such that the visible
data takes up 100% of the graph
Image Exporter saves the graph as an image (bitmap)
file
Data Exporter (available in some versions) saves the
session or segment data to a file
Toggle Significance Curve for entire session or
individual segments
Toggle Ad-Hoc Commenting (available in some
versions) to add, modify, or delete ad-hoc comments
Help button explains graph viewing options
Graph Full Screen toggles graph between full screen
and original size
Table 1: Analysis Graph View Options
Analysis also allows for scrolling capabilities (zooming).
Suppose you have a session that has a large number of
trials. You want to zoom in and take a closer look at the
period between trial 1 and trial 100. If there was a segment
defined for this experiment, you could just select that
segment and hit the Fit All Data button. But, you did not
create a new segment there.
Right click on the graph and move the mouse towards the
right. You should see the graph zooming in towards the
earlier trials. Moving the opposite direction shows more
trials. Note that this also works in the vertical direction. Right
click and move up and down to show more or less of the yaxis (cumulative deviation).
- 74 -
Figure 3: Sample FieldREG Analysis with Comments
Since we zoomed towards the earlier trials of the session,
we are no longer viewing 100% of the session. Therefore,
the session % bar at the bottom of the window is only
partially full. To move along this bar at the given zoom, left
click and move the mouse horizontally. To go back to 100%
of the session, just click the Fit All Data button.
Comments
Notice the blue semicircle along the x-axis (enclosed by a
square in the illustration above at about trial #81). This
shows an “inline comment” that was entered at that time
while the session was running. To view it, just hover over it
and a message box will appear on the graph.
Also notice the thin rectangle at trials #31-34. This is an “adhoc comment” that was entered after the session was
completed. To view this comment, just hover over it. To
modify or delete, select that range and then toggle on the
comment view by clicking the Toggle Ad-Hoc Commenting
button Ad-Hoc Commenting is only available in some
versions.
- 75 -
Psyleron Community
I. Overview
Psyleron Community is a place for REG-1 users to share
their research and ideas and to provide one another
assistance on consciousness-related topics. The project
seeks to engender the scientific investigation of mindinfluence effects, and to facilitate communication among
researchers. Users can automatically upload their raw
research data over encrypted channels to share their results,
and can participate in multi-user experiments. Psyleron
Community also seeks to foster a supportive environment for
individuals seeking to understand and develop their minds
and mind-influence abilities. Forums allow participants to
exchange helpful ideas and anecdotes, and work together to
explore the mysteries of consciousness. Psyleron
Community is your place to connect with other users and
explore the many sides of the REG-1.
II. Training and Techniques
We believe that your ability to influence the REG-1 is a skill
that can be developed and improved continually over time.
Part of the fun of using the REG-1 comes from exploring the
various objective and subjective factors that let you achieve
the strongest effects and highest z-scores. Beyond practice
and determination, the most helpful aspect of your mindinfluence development is community support. By sharing in
the experiences of others, you may find helpful hints or
recommendations that improve your scores. You may
develop a theory of how the mind-influence phenomenon
works, and want to share it with others through Community.
The field of consciousness and its role in physical reality is
burgeoning worldwide. Working together will allow us not
only to broaden the world’s understanding of nature, but also
to change our own lives in the process.
- 76 -
III. Sharing Data
Psyleron Community provides you the opportunity to share
raw data from individual experiments, and to participate in
broader, multi-user experiments as well. Both the Reflector
and FieldREG software make sharing raw data over the
Internet very easy. This kind of experimental collaboration
will help us all to better understand consciousness-related
phenomena, as making our protocols, results, and
discoveries public is essential to our progress as a whole.
IV. Events/Social Opportunities
Psyleron Community members can interact and have fun in
unique ways. If you want to find events where you can meet
others interested in consciousness research, you can check
the events board, or let others know about events that are
coming up. If you have uploaded your data, and want to see
where your results stand compared to everyone else, you
can check out the cumulative graphs of groups or top users.
If you have ideas or suggestions, you can suggest them to
Psyleron or discuss them with Community members in
bulletin boards or chat areas.
V. Tournaments
We will soon be conducting online tournaments for you to
test your skills with others. Please see the Psyleron
Community website for updates about tournaments.
- 77 -
Technical Support
Online technical support can be found in the Community
area of the Psyleron website. Technical support options
include the following.
I. Frequently Asked Questions (FAQ’s)
The first place to look for technical support is the FAQ’s.
Questions from customers are often posted on this page so
that others have access to their answers. There will soon be
a search function here, so you can browse with keywords.
II. Email
Email is the easiest way to contact us, and the best way to
quickly get answers to technical or other questions. When
sending an email, please be as detailed as you can so we
can answer your question as quickly as possible. Psyleron’s
technical support email is [email protected].
III. Telephone
We can be reached by telephone at 609-916-0134. If you
have an email address, please include it in your voice
message. If we have materials already developed to answer
your question, we will email you our best answer. Otherwise,
we will call you back as soon as a customer representative is
available.
IV. Questions Forum
Not all questions are technical or related to the physical
product. If you want to get the help or opinions of other
users, perhaps about an interesting philosophical question or
ideas regarding your experience with the REG, you can
always submit a question to members of the Community.
- 78 -
Part III: Horizons
Areas of Exploration
I. Outline
Psyleron’s goal is to facilitate the understanding of
consciousness and its role in physical reality. Our products,
the direction of our research, and our company’s philosophy
are founded on the nearly 30 years of work done at the
Princeton Engineering Anomalies Research lab. The
laboratory has been a pioneer in consciousness studies and
has set a precedent for the scientific yet open-minded
approach needed in this new field. But this is only the start.
In their own words, a new generation is needed to carry this
work forward.
To this end, Psyleron hopes to inspire independent and
collaborative investigators to make discoveries in this
extremely interesting and extremely important field of
consciousness and mind-influence phenomena. The
Psyleron Community has been designed to encourage
interest in and communication about such investigation.
As a jumping off point, PEAR and Psyleron’s theoretical
models of consciousness and the mind-influence
phenomena, as well as what some of our experiments
suggest about their finer textures, will be useful.
II. Objective Factors
Experimenters may be interested in looking for correlations
between objective factors and the z-score. A higher z-score
indicates a lower probability of happening by chance, and
possibly more significance to the objective variable being
tested.
- 79 -
For example, experimenters might be interested in whether
or not a given time of day is best suited for getting strong
effect sizes, or whether local sidereal time—the position of
the Earth in relation to the cosmos—has anything to do with
the phenomenon. They may be interested in exploring how
multiple operators affect the REG, or how age or gender
may result in different types of effects.
The early PEAR experiments paid particular attention to the
objective factors of REG interaction. Their work revealed
some interesting considerations related to objective
variables. For instance, research did uncover general
differences in effect characteristics along gender lines: In
many PEAR experiments, women seemed to produce larger
effect sizes, but were less likely to produce results which
correspond with their intention. Men, on the other hand,
seem to be more consistent in their ability to make the
device produce an output that corresponds with their
intention, but as a group produced smaller effect sizes and
achieved lower levels of statistical significance.
In some cases, multiple operators create larger effects than
individual operators, but not in a way that scales linearly.
When multiple operators attempt to influence the device, it
would appear that effects are increased when the operators
are of the opposite sex or otherwise are meaningfully
connected to one another—what PEAR referred to as
“bonded pairs.”
Table 1: Gender Disparities Table
- 80 -
Figure 1: Co-Operator Results
In the context of FieldREG, objective factors can be
important considerations for an experiment. The nature of
the venue and its physical landscape, and the nature of the
people involved—their numbers, proximity, and makeup—
may all impinge on what you discover with the FieldREG.
It is important to recognize that objective parameters such as
time of day, gender, number of operators, and others, may
not be fundamentally implicit in the REG effect. These may
simply have bearing on the subjective nuances of the
situation which, as other experiments show, may be the
most important factor in specific REG behavior, and in the
establishment of physical reality in general.
III. Subjective Factors
The subjective experience of the operator seems to be the
most important factor concerning their ability to influence the
REG. These are broad ranging, and include everything from
their basic feelings—happiness, fatigue, enthusiasm,
boredom, hunger, concentration, etc.—to their belief
systems and subconscious presumptions about reality and
how it works.
- 81 -
Studying these subjective variables in a tightly controlled
way is almost impossible, but both PEAR and Psyleron have
made some in-roads into the subjective realm and found
similar consistent subjective correlates.
Anecdotally, when operators report a feeling of “resonance”
between themselves and the REG, they tend to get better
results. Similarly, when operators are instructed to create
such an emotional or intellectual bond or dialogue with the
REG devices, their z-scores tend to improve.
Similarly, there are some indications that operators for whom
the experimental outcomes matter in a deeper way produce
results that are much stronger than those who don’t.
Compared with anonymous operators who generate data on
a whim, students, journalists, and people attempting to
explore their own internal state seem to produce the largest
results.
In this context, the rule of thumb seems to be that the REG
responds to some level of “meaningfulness.” Thus, it is not
mere thought or emotion that is responsible for the mindinfluence effect. The REG—or the physical reality of an
operator that includes the REG—is shaped by the operator’s
various states of being and deeper goals. In other words, the
phenomenon in question can not be simplified down into
thoughts mechanistically influencing a device. We may be
dealing with a much deeper property of reality.
IV. A Note About Beliefs
Many operators report that their deep-seated belief systems
seem to be critically important in their ability to get good
effects on the REG devices. These beliefs tend to involve a
preconception of an “immutable” physical reality, and the
nature of their agency within it.
These beliefs may have been explicitly instilled at some
point in their lifetime, but more often they seem to be
subconscious presumptions about how the world works, and
- 82 -
which reflect a larger social attitude. Operators do report,
however, that as they practice with the REG-1, they are able
to confront limiting belief systems they never knew they had;
and although not easy, they can be slowly replaced with
systems of thought that are more conducive to producing
effects.
The power of beliefs may be evidenced in what we call the
“rubber-band effect.” This refers to the effect some operators
may experience when performing very well on the REG:
once they see that they are doing well, they suddenly and
immediately propel the REG results in the opposite direction.
The “rubber-band effect” seems to betray the deep-seated
belief that good results are “very hard” to get, or that the
mind has “only limited capacity” at mind-influence
performance. The fact that the operator can suddenly and
strongly sway the REG-1 output in the other direction, even
from a position of several standard deviations above the
mean, suggests that the mind can in fact get sudden, strong
results fairly easily. It’s just a matter of bringing your deepseated beliefs in line with your intentions.
What some may call the “law of attraction,” or the idea that
we attract what we are thinking and feeling, is important to
consider here. If your aim is to get a z-score of 2.5 in the
Psyleron Reflector program, you should focus on your ability
to do so. Focusing on an inability to do so may result in that
very outcome.
What is most important to remember is that the REG-1
seems to be a reflection of your own thoughts and feelings—
your intentions and beliefs (and in FieldREG mode, those of
others). The REG-1 truly is a research tool and a tool for
personal exploration and development. We cannot claim that
use of the REG-1 will let you bend spoons with your mind!
But operators report that as they practice with the REG-1,
they feel an unusual sense of connection to the world around
them, and that this connection carries over into their daily
lives. Some even feel that they are better able to bring their
thoughts into manifestation.
- 83 -
Cutting-Edge Applications
The Reflector and FieldREG software included with the
REG-1 package enable a vast array of uses for the REG-1.
Additionally, Psyleron offers the Psyleron Applications SDK,
a software development kit that allows advanced users to
program their own specialized applications for the REG-1.
How you use the REG-1 is mostly limited by your
imagination. A musician or installation artist, for example,
may use the REG-1 in FieldREG mode to drive a visual
display based on the audience’s collective, dynamic
consciousness field. Investors may take the REG-1 with
them to conferences and trade shows to help locate the
ideas and products with the most potential.
The REG-1 is the first generation of technology that couples
consciousness directly to machines—take advantage of it!
- 84 -
Summary
Although we know that consciousness can influence physical
reality, the mechanism by which this works, and most of its
parameters, still remains a mystery. There is, however, a
dignity and importance to this mystery, and to the endeavors
that explore them. They seek nothing less than the truth
about nature, and the role that each person plays within it.
We hope that you take an active role in making discoveries
with the REG-1 and the Psyleron Community, and most
importantly, we hope you have fun! Thank you for
purchasing the REG-1 package, and we wish you the best of
luck exploring the frontiers of science and self!
- 85 -
Appendix 1: PEAR Theories
Note: The following are abstracts from complete papers. For
the developed theories, please visit the publications section
of the PEAR lab website:
www.princeton.edu/~pear/publications.html
or from the Psyleron website.
PEAR #1: Quantum Mechanics of Consciousness (Abstract)
“PEAR takes the position that reality is constituted only in the
interaction of consciousness with its environment, and
therefore that any scheme of conceptual organization
developed to represent that reality must reflect the
processes of consciousness as well as those of its
environment. More specifically, we propose that if a
consciousness is represented by a quantum mechanical
wave function, and its environment, including its own
physical corpus, is represented by an appropriate potential
profile, Schrodinger wave mechanics yields eigenfunctions
and eigenvalues that can be associated with the cognitive
and emotional experiences of that consciousness in that
environment. Many ‘anomalous’ consciousness capabilities
would follow normally from its wave/particle duality, empirical
resonance factor can be related to molecular bonding,
gender and co-operator effects to electronic spin and its
pairing, FieldREG effects to collective particle behavior in
various potential wells, and conditional replicability to the
intrinsic statistical uncertainties of all quantum phenomena.”
- 86 -
PEAR #2: Modular Models (Abstract)
“Anomalous effects such as those observed in our
experiments do not emerge from direct intercourse between
the conscious mind and the tangible physical world, but have
their origins in the depths of the unconscious mind and an
intangible substrate of physical reality. When the conscious
mind expresses a strong desire, enhanced by deep feelings
of resonance, that resonant intention stimulates some
process in the unconscious mind that is reflected in the prephysical events. This process may also work in reverse
order, as in the remote perception experience, where
physical information about the target scene diffuses into its
underlying intangible composition, whence it may interact
with, and exert some formative influence upon, the
unconscious mind of the percipient, to emerge a conscious
experience and subsequent description of the scene.”
PEAR #3: Consciousness Filters (Abstract)
“Interactions are both facilitated and inhibited by the
intervention of an array of physiological, psychological,
linguistic, and cultural influences, or ‘filters,’ which condition
our perceptions and thereby our conscious experiences, and
thus limit our direct access to the Source. It is proposed that
such attitudinal tactics as openness to alternative
perspectives,
utilization
of
associative
metaphors,
transpersonal resonance, tolerance of uncertainty, and
balance of analytical rigor with emotional investment, can
enable experiential realities that are responsive to intention,
desire, or need, to an extent consistent with prevailing
empirical evidence.”
- 87 -
Appendix 2: Frequently Asked
Questions
Note: For a complete FAQ, please visit the FAQ pages of the
Psyleron website. If your questions remain unanswered, you
can contact Psyleron through our website, or through the
listings on the Technical Support page.
Hardware and Software FAQ
Is the REG-1 the same device used by the PEAR
Laboratory?
The Psyleron REG-1 is an improved version of the PEAR
device. While both are Random Event Generators, the REG1 is built with modern technology, such as the USB interface
and SMT components. It is also smaller, and much less
expensive. Each REG-1 is calibrated according to the same
stringent tests used at the PEAR lab. It is the only PEARcertified Random Event Generator available.
Is the REG-1 suitable for scientific research?
Yes. The devices are calibrated rigorously and subject to
various tests before being sold to customers. The statistical
tools included with the software applications simplify the
mathematics of scientific research.
How is my REG Calibrated?
Before shipping, your individual REG-1 was run continuously
for approximately 16 hours. At the end of this period, we
summed the data into 200 bit trials and put the collected
data through the “Big 5” tests of the standard PEAR
Calibration suite. If your device passed tests for μ and σ at
the bit and trial level, as well as basic tests for the chisquared of trial bin populations, skew, and kurtosis, it was
deemed to be an acceptable REG device for the purpose of
running informal and exploratory experiments to test for
mind-influence effects. The results of an example calibration
are summarized below:
- 88 -
Table 1: Sample REG-1 Calibration Results and Test Statistics
In spite of these results, we recommend that you take the
necessary precautions to ensure the validity of your data.
This includes collecting data without an operator (user)
present before and after active experiments; using bi-polar
or tri-polar protocols where possible; and utilizing further
processing where necessary.
What are the minimum system requirements?
Your computer must have a USB (1.1 or greater) port to
communicate with the REG-1. In general we recommend at
least a Pentium 4 or equivalent processor to all Reflector
modules, but the FieldREG and Classic PEAR Experiment
applications have been tested to run comfortably on
computers with clock speeds as low as 500MHz.
Is there a warranty?
The REG-1 has a 1-year limited replacement warranty that
guarantees it against failure or spurious calibration data
output. If you ever find that your device is producing biased
data during a calibration situation, please contact us
immediately for a replacement.
If you are an REG-1 early adopter, you are also entitled to
free software upgrades for a period of at least 1 year from
your date of purchase. Contact [email protected] for
more details or if you would like to inquire about software
upgrades.
- 89 -
Research FAQ
Can I see the PEAR raw data myself?
We are working with the PEAR lab to put all of their historical
data in an easy to access format. When the project is
finished, you will be able to download and view all of the
PEAR experimental data on our web site.
Is there an experimenter effect?
The nature of REG experiments precludes conventional
experimenter effects. There is no "right" or "wrong" answer
when dealing with REGs, and their quantum nature
precludes experimental foreknowledge of any bias in setup.
However, there seems to be a correlation between an
operator's confidence in his or her ability to produce an effect
in the REG, and his or her actual performance. It is
conceivable that an experimenter may encourage or
degrade operator confidence, and thereby impact the data.
But this, of course, has nothing to do with an operator's
ability to produce anomalous REG effects in the first place.
There may be an additional concern related to the
experimenter's consciousness interfering with the REG. This
may be a real phenomenon, but it seems that intention is the
deciding factor. In the same way that an REG will behave
like a truly random device when no person is intending to
affect it, so the experimenter's consciousness should not
affect an experimental REG if the experimenter does not
intend to.
What are Mean, P-Values, and Z-Scores?
These standard statistical metrics relate experimental results
to those expected by chance, and the magnitude of this
deviation (if any). Specifically, mean is the sum of all the
values in a set of data, divided by the number of values in
the data set. Z-score relates the "distance" an experimental
outcome falls from the mean, in standard deviations.
- 90 -
In the context of REG research, Mean indicates the
consciousness-induced deviation from the expected Mean
scenario (i.e., without an operator present), and the related
z-score measures this in standard deviations. A p-value
represents the probability that the result would occur by
chance, given that there is no effect by an operator.
How can I be sure that consciousness is the agent, and
not some other factor, such as electromagnetic
interference, or temperature fluctuations?
This was one of the primary initial concerns of the PEAR
researchers, as it remains a concern of anyone using
sensitive measurement equipment. No conventional physical
force was found to have any association with the devices.
The physical shielding, quantum nature of the circuit, and the
logical XOR masks employed in the digital stages of the
device makes its randomness very unlikely to be affected by
any physical forces in the field setting. We encourage our
operators to perform calibrations along-side experiments,
and to subject the device to physical forces and see if any
deviations are present until the operator feels comfortable.
The fact that a calibrated device, with no operator present,
produces data without anomalous mean shifts, suggests the
operator is responsible for the anomalies. And the fact that
the operator can make mental decisions to affect the REG
one way or the other at will, and that the REG can respond
respectively, suggests that it is the agency of consciousness
responsible for the anomalies. No other physics forces—
including the physical presence of the operator—would
affect the REG in sudden ways that correlate to the
operator's intent.
Does Psyleron conduct its own research?
We do. As part of our research and technology development
process, Psyleron is also engaged in the continuation of
PEAR-type experiments. Volunteer operators can make an
appointment to generate data on-site at our Princeton
Location, and our customers are given the opportunity to
remotely submit data and comments using the REG-1
package.
- 91 -