1
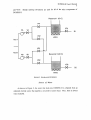
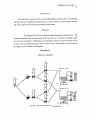
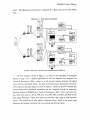
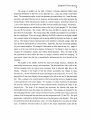
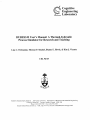
Cognitive
DURESS I1 User's Manual: A Thermal-hydraulic
Process Simulator for Research and Teaching
Lisa C. Orchanian, Thomas P. Smahel, Dianne E. Howie, & Kim J. Vicente
CEL 96-05
Cognitive Engineering Laboratory University of Toronto Department of Mechanical & Industrial Engineering
5 King's College Rd. Toronto, Ontario, Canada M5S 3C8
Phone: (416) 978-7399 Fax: (416) 978-3453
Email: [email protected] URL: http://www.ie.utoronto.ca/IE/HF/CEL/homepage.html
Director: Kim J. Vicente, B.A.Sc., M.S., Ph.D.
The Cognitive Engineering Laboratory (CEL) at the University of Toronto (U of T) is
located in the Department of Mechanical & Industrial Engineering, and is one of three
laboratories that comprise the U of T Human Factors Research Group. CEL began in 1992
and is primarily concerned with conducting basic and applied research on how to introduce
infomation technology into complex work environments, with a particular emphasis on
power plant control rooms. Professor Vicente's areas of expertise include advanced
interface design principles, the study of expertise, and cognitive work analysis. Thus, the
general mission of CEL is to conduct principled investigations of the impact of infomation
technology on human work so as to develop research findings that are both relevant and
useful to industries in which such issues arise.
Current CEL Research Topics
CEL has been funded by Atomic Energy Control Board of Canada, AECL Research,
Aliaslwavefront, Asea Brown Boveri Corporate Research - Heidelberg, Defense and Civil
Institute for Environmental Medicine, Japan Atomic Energy Research Institute, Natural
Sciences and Engineering Research Council of Canada, Rotoflex International, and
Westinghouse Science & Technology Center. CEL also has collaborations and close
contacts with the Mitsubishi Heavy Industries and Toshiba Nuclear Energy Laboratory.
Current CEL projects include:
Studying the interaction between interface design and adaptation in process control
systems.
Understanding control strategy differences between people of various levels of
expertise within the context of process control systems.
Developing a better understanding of the design process so that human factors
guidance can be presented in a way that will be effectively used by designers.
Designing novel computer interfaces to display the status of aircraft engineering
systems.
Developing and evaluating advanced user interfaces (in particular, transparent UI
tools) for 3-D modelling, animation and painting systems.
CEL Technical Reports
For more information about CEL, CEL technical reports, or graduate school at the
University of Toronto, please contact Dr. Kim J. Vicente at the address printed on the front
of this technical report.
DURESS II User's Manual
Abstract
This manual is a stand-alone document that guides the user through the DURESS II
software package. DURESS I1 is a thermal-hydraulic simulator which can be used for
research and teaching. This document describes in detail the architecture of DURESS 11,
which is a bird's eye view of the entire system, and then looks at each of the various
sections individually. The system is split into four separate sections: Process Model,
Interfaces, Configuration Files, and Analysis Tools. The Process Model section names
and describes each component of the simulator. The Interfaces section explains the three
interfaces included in the software package. The Configuration Files section describes
how the simulator's parameters can be customized to suit the needs of the user. The
Analysis Tools section describes some of the applications that can be used to analyze the
data collected from the trials. The final section is the How to section which gives step by
step instructions with examples on everything from installing the software, to running a
trial, to using the various analysis tools.
DURESS 11 User's Manual
i
Table of Contents
............................................................................................. 1
ARCHITECTURE .................................................................................... 1
PROCESS MODEL.................................................................................. 2
PREFACE
SOURCE OF WATER................................................................................................................... 3
FEEDWATER STREAMS .............................................................................................................. 4
m I N G ....................................................................................................................................
4
VALVES ..................................................................................................................................
4
PUMPS ...................................................................................................................................
-4
HEATERS.................................................................................................................................4
RESERVOIRS............................................................................................................................
5
DEMAND ................................................................................................................................. 5
INTERFACES
........................................................................................5
PHYSICAL INTERFACE ...............................................................................................................
5
PHYSICAL + f%JNCTIONAL INTERFACE .........................................................................................7
MULTI-LEVEL INIERFACE..........................................................................................................
9
........................................................................1 2
TOOLS ................................................................................1 3
CONFIGURATION FILES
ANALYSIS
LocFILES .............................................................................................................................
DPLAYER ...............................................................................................................................
DXTRA(3T ..............................................................................................................................
DGRAPH & DGRAPHGEN ..........................................................................................................
.
.
DLOGGEN ..............................................................................................................................
HOW TO
14
14
14
14
15
............................................................................................1 5
SET UP DURESS I1 ...............................................................................................................
CREATE A CONFIGURATION
FILE ..............................................................................................
RUN A TRIAL.........................................................................................................................
RUN DPLAYER ........................................................................................................................
15
16
16
17
Discrete Steps..................................................................................................................... 17
Continuous Repluy..................... ;........................................................................................ 18
RUN DXTRACT ....................................................................................................................... 19
RUN DGRAPH & DGRAPHGEN .................................................................................................. 2 1
Run dloggen....................................................................................................................... 21
.....................................................................................2 2
APPENDICES .......................................................................................2 3
REFERENCES
APPENDIX A:
APPENDIX B:
APPENDIX C:
APPENDLX D:
APPENDIX E:
23
SAMPLE CONFIGURATION m~.............................................................................
DXTRACTVARIABLES .........................................................................................
SAMPLE ACTION-TRANSITIONGRAPH ....................................................................
DXTRACT UX; FILE EXTRACTION PROGRAM ...........................................................
LIST OF COMMANDS ...........................................................................................
28
29
29
30
DURESS II User's Manual
ll
Table of Figures
FIGURE 1. THE ARCHITECTURE OF THE DURESS SOITWARE PACKAGE........................................ 1
3
FIGURE 2. DIAGRAM OF D W S I1...........................................................................................
FIGURE 3 . PHYSICAL INTERFACE FOR DURESS ........................................................................5
FIGURE 4. PHYSICAL
+ FUNCTIONAL INTERFACE FOR DURESS ..................................................7
FIGURE 5A. ~EZTENGSLEVEL..........................................
;...........................................................9
FIGURE 5B. FLOWS LEVEL ........................................................................................................
$9
10
FIGURE 5C. PRLNCIPLES S V E L.................................................................................................
FIGURE 5D. GOALSLEVEL........................................................................................................ 10
FIGURE 6. A SCORE BOX DISPLAYED BY DPLAYER'S 'INFO' BUTION..............................................19
n
DURESS 11User's Manual
1
Preface
This technical report is a user's manual for DURESS 11 (Dual REservoir System
Simulation), a thermal hydraulic process simulator for research and teaching. Because of
it's simplicity, the system can be customized to fit a broad spectrum of needs and uses.
For example, DURESS IT can be used to investigate cognitive abilities, or teach students
about thermal-hydraulic processes.
This report will serve as a stand-alone guide for installing and operating the
DURESS I1 software. However, a basic understanding of UNIX commands for file
management is recommended.
Architecture
Figure 1 illustrates the components of the DURESS I1 software package and the
flow of information within this system. There are four main components; Input,
Simulator, Output, and Analysis.
- .
Simulator
Input
Configuration
Files
-
Process
Model
Output
Log
Files
Analysis
Tools
*
Interfaces
FIGURE 1. THE ARCHITECTURE OF THE DURESS I1 SOFTWARE PACKAGE.
I
In the Input segment, where the configuration files are located, one can alter the
parameters of the system such as the size of the reservoirs, the amount of flow allowed
through the valves, the output demands, as well as numerous other variables. In addition,
pre-defined faults can be introduced into the system. These options are particularly useful
because one can customize the system to suit a wide variety of needs.
The next section is the Simulator, which encompasses both the Process Model and
the Interfaces. The Process Model is the heart of the system and contains the central
DURESS II User's Manual
2
workings of the system -- the equations. The equations represent the characteristics of, and
the relationships between, the components. As a result, they generate the behaviour of the
system over time. The interfaces give the user a visual interpretation of the behaviour of
the system, and the means to manipulate the components of the system in order to bring the
system into a steady state. Several interface designs are included in the software package,
but additional interfaces compatible with the Process Model can be created depending upon
the interests of the user of the package.
After a trial has k e n completed, all the quantitative data describing the state of the
system and the operator's control actions are retained and stored in a log file.
Subsequently, these data can be accessed to compile statistics or review results specific to
the trial. However, one of the tools described in the following section must be employed in
order to access the data.
To view the data stored in the log files, one or more Analysis Tools can be used.
The log i3es may be analyzed individually, selectively, or as a group to compare results.
Results may be viewed in the form of graphs, tables, or even replayed back through the
simulator.
Process Model
DURESS 11, pictured in Figure 2, consists of two redundant feedwater streams
(FWS A and FWS B) that can be configured to supply water to two reservoirs (Reservoir 1
and Reservoir 2). The goals of the system are to keep each of the reservoirs at specific
temperatures, and to maintain enough water in each reservoir to satisfy each of the current
output demand flow rates (Dl and D2). Both temperature and demand requirements are
externally determined. Although DURESS I1 has k e n modeled to be consistent with the
laws of physics (e.g., the conservation laws), several simplifying assumptions have been
made, as outlined in the following sections. To satisfy the system goals, there are eight
valves, two pumps, and two heaters; these all have first-order lag dynamics.
Each component code begins with the first letter of the component name: "H" for
heaters, "V" for valves, " P for pumps, and " R for reservoirs. As mentioned in the
preceding paragraph, DURESS 11 has 2 feedwater streams: W S A and FWS B. These
letters are used in the component code to describe components in each of the respective
FWS's. For example, valves in FWS A are labeled with the prefix "VA". The final digit
in some of the component codes refers to the reservoir that the component is directly
connected to. For example, the valves connected to reservoir 1 are named "VA1 and VB1
DURESS n User's Manual
3
and VOl". Similar naming conventions are used for all of the other components of
DURESS 11.
Reservoir 1 (40 C)
1
fws B
PB
VB
Reservoir 2 (20 C)
FIGURE 2. DIAGRAM OF D U R E S S 11.
Source of Water
As shown in Figure 2, the water that feeds into DURESS 11 is obtained from an
unlimited external source that supplies a net positive suction head. Thus, there is always
water available.
DURESS I1 User's Manual
4
Feedwater Streams
Each input feedwater stream (FWS A and W S B) consists of one pump (PA, PB)
and three valves (VA, VAl, and VA2; VB, VBl, and VB2). The two streams are
functionally identical, each having a capacity for attaining a preset maximum flowrate.
Each feedwater stream can be configured to supply water to both, either, or neither of the
two reservoirs.
Piping
The pipes are assumed to be perfectly insulated. Thus, there will be no transfer of
heat between the water in the pipes and the surrounding environment. It is assumed that
the pipes are sufficiently large in diameter that their pressure losses are much smaller than
those caused by the valves. Therefore, the resistance of the pipes is ignored. Note also
that the length of the pipes from each of the end valves (VA1, VA2, VB 1, VB2) to each
reservoir is the same.
Valves
All of the eight valves are identical (VA, VA1, VA2, VB, VB1, VB2, V01, and
V02). The valve settings have a linear range and can he varied from completely closed to
all the way open. It is assumed that the valve settings directly specify the flowrates (or the
flowmte ratios when appropriate) rather than the 11ow resistances.
Pumps
The 2 pumps (PA and PB) are functionally identical. They each have discrete
settings, either ON or OW. Each pump has a fixed maximum flowrate capacity.
Nea ters
The 2 heaters (HTRl and HTR2) are also functionally identical. They have a
continuous control settings ranging from off to a maximum heat flow.
DURESS II User's Manual
5
Reservoirs
The size of the 2 reservoirs can be varied independently of one another. It is assumed
that the reservoirs are perfectly insulated and as a result, there is no heat transfer between
the water in the reservoirs and the surrounding environment.
Dernartd
The demand (D 1, D2) is the desired output flowrate for each reservoir. The
dynamics associated with a pressure head in the reservoir (i.e., the force of gravity on the
water) are not considered. Furthermore, the demands for the two reservoirs need not be
the same, and can change from trial to trial or within a trial. The demand for each reservoir
can range from no demand to full demand.
Interfaces
Physical Interface
DURESS II user's Manual
6
The physical interface, shown in Figure 3, provides a physical representation of
DURESS 11, displaying only the control variables and the g o d variables. (Note that for the
above diagram, a set of values has been chosen for the valve capacities, and temperature
and volume demands. As described later, these values can all be altered by editing the
configuration file.) The first meter on the left of the display is a water thermometer (TO),
which measures the temperature of the water entering the system. This thermometer
displays temperature as a vertical bar (coloured red in the display) that increases in height as
the water temperature increases. The normal inlet water temperature is indicated by the
green area on the scale. After the thermometer, the input water stream splits and flows to
two pumps (PA and PB). The pumps have discrete switches and are either on or off. The
state of the pump can be changed by clicking on the pump. The pumps are displayed in
black (with white lettering) if they are off, and in light gray (with black lettering) if they are
on. If either pump is turned on without any of the downstream valves being opened, the
pump will break down. This error terminates the trial.
The next set of components are the primary valves (VA and VB) which have a
continuous range from shut to all the way open. The valve state is set using a mouse to
either drag the yellow triangular pointer to the desired setting, or to simply click on the
scale at the desired point. From these primary valves, each FWS splits into two secondary
valves connecting each stream to both reservoirs. The secondary valves (VAl, VA2, VB 1,
and VB2) operate in the same manner as the primary valves. The water then flows to each
of the two reservoirs, where it is heated and removed, through the use of the heaters (HI
and H2) and the output valves (VOl and V02), in order to meet the temperature and
demand goals, respectively. Reservoir volume levels are indicated by a scale on the side of
each reservoir and by the blue shaded area. It is possible to overflow either of the
reservoirs, if input flowrate is consistently greater than output flowrate. When reservoir
volume exceeds the maximum capacity, the trial ends automatically.
The heaters (H1 and H2) also have a continuous range from off to maximum heat
flow. The subject can either slide the triangular pointer (coloured red in the display) to the
desired setpoint, or click on the scale at that point. Heating an empty reservoir for an
extended period will also lead to a premature end of the trial.
The water temperature in the reservoirs is displayed with thermometers (TI and T2).
The goal temperature is represented as a green area on the temperature scale. If the water in
the reservoir boils, the system fails and the trial ends.
Finally, the operators also have control over the outlet valves ( V a l and VQ2) that are
used to meet the demand goals. These valves operate in the same manner as the other
DURESS 11User's Manual
7
valves. The demand for each reservoir is indicated by a green area on the valve setting
scale.
Physical
+
Furtctional Interface
FIGURE 4. PHYSICAL + FCJNCTIONAL INTERFACE FOR DIJRESS II.
The P+F interface, shown in Figure 4, is based on the principles of Ecological
Interface Design. (For a detailed explanation of how this interface was designed, see
Vicente & Rasmussen, 1990.) Again, as in the previous interface diagram, all labeled
values have been arbitrarily chosen. The input water thermometer, both pumps, and all the
valves operate in the same manner as in the P interface. However, the P+F interface also
contains higher-order functional information that was identified through an abstraction
hierarchy analysis of DURESS (see Vicente & Rasmussen, 1990). Thus, each valve also
has a flow meter next to it (FV.4, WB, FA1, FA2, FBI, ER2, and M 0 1 and M02 for the
mass output flowrates). These flow meters have the same value range as their respective
valves. The vertical bar in each meter is coloured yellow, which is the colour used
throughout the interface to indicate both valve settings and flowrate values.
DURESS 11User's Manual
8
The group of graphics on the right of Figure 4 provide additional higher-order
functional information in the form of first principles (i-e., mass and energy conservation
laws). The rectangular graphic on the left represents the mass balance (i.e., input flowrate,
inventory, and output flowrate) for the reservoir, and the graphic on the right represents the
energy balance. Both representations operate in a similar manner. Referring to Reservoir
I, the various inputs are shown at the top (MI1 for mass and EI1 for energy). Inventories
for each representation are indicated by scales on the side of each graphic (V1 for volumd
mass and E l for energy). The outputs, MOl for mass and E 0 1 for energy, are shown at
the bottom of each graphic. The energy inputs (EI1 and E12) are partialled out according to
the two contributors. Thus, the energy added by the FWS is shown as the lightly shaded
bar (coloured yellow in the display), and the energy added by the heater is shown as a dark
red bar. The energy inventory representation in the interface is coloured orange, while the
mass inventory representation is coloured blue. Intuitively, the mass and energy graphics
rely on a funnel metaphor. For example, if the bottom is wider than the top (i.e., output >
input), as is the case with the mass balance for Reservoir 2 in Figure 4, then it is easy to
visualize the consequence; namely, that volume should decrease. Thus, the slope of the
line represents the rate at which the mass (or energy) inventory should be changing. If
input equals output, then the line is perpendicular, indicating that the level should not be
changing.
The graphic in the middle, between the mass and energy balances, illustrates the
relationship between mass, energy, and temperature. The horizontal line with a ball on the
end that emanates from the current mass inventory level is coloured light blue in the
display. Changes in the height of this line always accompany any change in mass
inventory (i.e., the bar will always be at the same height as the water level, V1 or V2). The
diagonal line in the center display is always tangent to the ball on the end of that horizontal
line. Thus, a change in the vertical position of the horizontal line serves to change the slope
of the diagonal line in the center display. For example, if volume increases, the horizontal
line goes up, causing the diagonal to rotate counterclockwise, increasing the slope of the
diagonal line. The slope of the diagonal line represents the function that maps the
relationship between mass and energy onto temperature. This mapping is indicated by the
Line emanating from the current energy inventory level (El and E2) that comes across and
reflects off of the diagonal line and down onto the temperature scale (TI and T2). The goal
temperature is indicated by the light shaded area (coloured green in the display). This goal
area reflects back from the temperature scale, off of the diagonal line, and onto the energy
scale. In addition, off-scale markers are added to the output temperature scales and the
DURESS II User's Manual
9
energy input, inventory, and output scales as well. This was added to the system by
creating a gap in the scale at the off-scale point.
Multi-Level Interface
RGtJRE 5A. SETlINGS LEVEL
FIGURE 5B. FLOWS LEVEL
DURESS II User's Manual
10
FIGURE 5C. PRINCIPLES LEVEL
FIGURE 5D.COALS LEVEL
There are four levels to this interface; Settings, Flows, Principles, and Goals. Only
one of the four levels can be viewed at any time. In the lower left hand comer of the screen is a
control panel with four buttons. Any level can be accessed at any time by clicking on the
corresponding button with the mouse.
The Settings level (Figure 5A) shows the controls which are used to operate the
system, as well as some state information. The input water temperature is shown in
DURESS 11User's Manual
11
thermometer TO, on the left. The pump settings (e,g., PB) are discrete (either ON or OFF),
and are therefore directly labeled on the pumps themselves. The valve settings (e-g., VB)
range from 0 to a preset maximum and are indicated by the small yellow, triangular pointers on
the respective scales. The blue graphic shows the reservoir volume (e-g., V I), which ranges
from 0 to 100 percent. The output valve setting (e-g. VO1) is on the right and is indicated by a
yellow triangle. The heater settings (e.g., HTR2) range linearly from completely off to
maximum capacity, with a red triangle as an indicator. The thermometer on the right of each
reservoir shows its temperature (e.g. Tl).
The Flows level (Figure 5B) only shows the actual flow rate for each component,
corresponding to the components from the Settings level. The flow rate for each valve ranges
from 0 to maximum capacity and is indicated by a yellow bar in roughly the same location as
the corresponding valve display from the Settings level. The flow rates for the output valves
are shown as yellow bars on the right. The heat transfer rates for the two heaters are indicated
by the red bars.
The Principles level (Figure 5C) only shows information according to the mass and
energy conservation laws. The blue graphic on the left represents the mass balance for the
reservoir, while the orange graphic on the right represents the energy balance. Both operate in
a similar manner. Referring to Reservoir I, the various inputs are shown at the top (e.g., MI1
for the mass input and EII for the energy input), the outputs at the bottom (e-g., MOI for mass
output, and EO1 for energy output) and the inventories on the side (e-g., M1 for mass, and E l
for energy). The energy inputs (EI1 and E12) are partialled out according to the two
contributors. Thus, the energy added by the feedwater is shown as the yellow bar, while the
energy added by the heater is shown as the red bar. The energy output (e.g., EOI) is
proportional to the product of temperature (TI) and mass output (MO1). Intuitively, the energy
and mass graphics rely on a funnel metaphor. Thus, if the bottom is wider than the top (i.e.,
output greater than input), then it is easy to visualize the consequence, namely that the volume
should be decreasing. Thus, the slope of the line represents the rate of change of mass (or
energy) of inventory.
The Goals level (Figure 5D) only shows the current state of the goal-demand (D 1, D2)
variables with respect to the corresponding goal states. These variables are the outflow rates
(yellow bars) and temperatures (TI, T2) of the reservoirs (red bars). The green areas represent
the goal regions. The upper and lower l i m i ~around the setpoints are shown as green areas on
the two temperature scales. The upper and lower limits around the demands, are shown as
green areas on the output flowrate meters.
DURESS II User's Manual
12
Configuration Files
Although the form of the basic elements of the process model remain constant, the
Configuration Files allow users to alter the simulation to suit their needs. The configuration
files give the users the power to directly manipulate the variables that are fed into the
simulator. Examples of variables include reservoir size, individual valve capacity, heat
transfer rate, and demand settings. In addition, simulated faults can be configured to occur
during the trial (i.e. valve blockage, reservoir leak, heater failure, etc.) and it is possible to
specify initial conditions for the trial (i.e. water initially found in the reservoir).
Even though the parameters of the simulator can take on an infinite number of
values, the relationships between the elements that govern the performance of the simulator
impose constraints on meaningful combinations of values. For instance, if the density of
the liquid in the feedwater streams is changed to one-tenth that of water, the reservoirs
would fill up so fast that the operator would have an extremely difficult time controlling the
system.
Users may find the following alterations of particular interest:
Feedwater Streams:
input temperature
pump capacities (independently variable)
valves (each configured with different flow capacities)
splitters (alIow limited flow from primary to secondary valves)
Reservoirs and Heaters:
reservoir size
maximum reservoir height
water demand temperature
water density
initial water level
maximum heat flow from heater
Faults (occurring after set period of time):
change in demand (flow or temperature)
additional water into/out of reservoir
* additional heat into reservoir
DURESS II User's Manual
13
-
valve blockage
valve stickage
heater failure
change to inflow temperature
pump failure
An example of a configuration file is provided in Appendix A. For this particular
trial, the mass and temperature demands are set at 6 kdsec and 40 "C for Reservoir 1, and
9 kgfsec and 20 "C for Reservoir 2. For the operator to reach 'steady state', these goals
must be maintained for five consecutive minutes. The trial also includes two faults. The
first fault is a reservoir leak which occurs in Reservoir 1 at three minutes. Once the counter
reaches that time, the reservoir will start to lose water at an additional rate of 3 kgls. This
(i.e. the mass balance line will not
loss will not be detectable in the outflow measurement
- - -change). However, the water level will drop for no apparent reason. The second fault
occurs at four minutes. While the first fault was a loss of water, this fault results in
additional water inflow to Reservoir 2. At the time of this fault, the reservoir will start to
gain 3 k d s of water at 30 "C. Also like the leak, the extra water will not be detected in the
inflow measurement, but the water level will rise and possibly temperature too.
A fault can be added to any trial simply by changing the '- 1' where the 'time of
fault' is specified to the desired time in minutes. For instance in the example, the faults are
found in the 'reservoir' sections and the '-1's have been changed to '3' and ' 4 '
accordingly. Then the 'additional water inflow' was changed to '-3' for Reservoir 1, and
'3' for Reservoir 2. As well, the 'addition inflow temperature' for Reservoir 2 was
changed to '30'. This combination of changes to the configuration file will create the faults
described above. The maximum number of faults in a trial is 30.
Analysis Tools
In the following sections, a description of what each tool does is included. For a
description on how to use the following tools. please consult the 'How To' section for the
analysis tool desired. For a list of the UNIX commands associated with these analysis
tools, please consult Appendix E.
DURESS11User's Manual
14
Log Files
Whenever the operator clicks the mouse, the simulation records the control action,
the time, and the current values of all of the system variables. These data are stored in a
Log File. All of the analysis tools described below use the Log Files as input. It is
important to note that the log files cannot he read directly, but rather have to be used in
conjunction with another analysis tool to extract data.
dplayer
Dplayer is a trial replay module. It is a useful device for reviewing the individual
trials. Dplayer can play back a trial showing the interface used by the operator while the
operator's control movements are highlighted with an arrow. The trials can be interpolated
to show continuous movement between control inputs. It is also possible to fast forward
or rewind through the control inputs of the trial.
dxtract
Dxtract is the utility which allows the user to isolate data from the log files to be
analyzed. Using dxtract, the user can extract data in its entirety or selectively. Some of the
variables which can be analyzed include PA setting, VB 1 flow, reservoir 2 level, reservoir
1 energy inflow from water, etc. An extensive list is included in Appendix B. Through the
extraction process, it is possible to transfer the data to a file which can be used in any
spreadsheet program.
dgraph & dgraphgen
Dgraph and dgraphgen are anaIysis tools that can he used in combination to draw
action transition graphs from data extracted from the log files. Dgraphgen prepares the data
to be plotted by dgraph. Action transition graphs reveal sequential relationships in
behavior. Each component is represented by a node, and those nodes that are acted on in
sequence are joined by a line. The thickness of a line joining any two nodes is proportional
to the frequency of that transition. Action transition graphs can illustrate changes in
patterns of skill, providing a summary of an individual's understanding of the system on a
DURESS II User's Manual
15
trial by trial basis. (Moray, Looststeen, & Pajak, 1986) A sample action transition graph is
included in Appendix C .
Dgraphgen gives the user three options for the number of nodes in the graph.
dgraphgen 1: all 12 components
dgraphgen 2: 6 nodes (pumps (2), primary valves (2), and heaters (2))
dgraphgen 3: 3 nodes (all pumps, all valves, and all heaters)
Since DURESS II is fully deterministic, log files contain only the operator's
actions. In order to obtain variable values between actions, it is necessary to interpolate
using the existing log file. Dloggen generates a log iile containing data with a known fixed
selectable interval. For example, one could retrieve the state of the trial every 15 seconds.
From the newly created log file, one could analyze the data variables using dxtract.
How to
...
Set Up DURESS I1
Obtaining and setting up the DURESS I1 software package is an easy process. It
can be obtained by using a file transfer protocol:
% ftp ftp.ie.utoronto.ca
5% login: anonymous
5% password: [type in yozir 3/11login o~klress]
5% cd incoming
5% get duress.Nick.tar.gz
Once you have the received the iile unzip it using:
% gunzip duress.Nick.tar.gz
% tar -xf duress.Nick.tar
DURESS 11 user's Manual
16
-
These commands will unpack all the files and place them into their appropriate
directories.
Create A Collfiguratiolz File
Several sample configuration files are included in the DURESS I1 software
package. In order to create a unique configuration file:
1.
2.
3.
4.
enter a text editor such as vi or jot
open an existing configuration file
make desired alterations to existing variables
save file under a new filename
Run A Trial
Once the DURESS I1 software package has been installed, simply type 'duress' at
the prompt. From there a window titled 'DURESS SIMULATOR' will open.
1. Click on the ConFile box
2. Enter the directory where the coniiguration files are located
3. Choose the desired configuration file
4. Click on 'Ready'
5. If the trial needs to be stored for further analysis, a subject name and trial
number must he entered in the appropriate boxes. Otherwise, no log file will be
created. (Hint: Choose "01" rather than " 1" for the first trial number to keep the log
files in numerical order.)
6. To choose an interface, click repeatedly on the interface box until the desired
interface is shown
The DURESS II simulator offers the option of having an on-screen timer and either
a limited or unlimited simulation time. For the on-screen timer, click 'on' or 'off. For the
simulation time, click 'limited' or 'unlimited'. If the former is chosen, a time limit box will
appear; enter the desired time limit there in minutes. Once the simulation has reached the
DURESS II User's Manual
17
time limit, it will automatically halt the simulation. Once all the parameters are properly set,
click on 'OK' and the trial will begin immediately.
R u n dplayer
To use the dplayer trial replay module, type 'dplayer' at the prompt and a window
titled 'Duress Player' will open.
1. Click on the Log File box and go to the directory containing the log files. Select
the desired log file and click on 'Ready'. (Hint: Only yncomnressed log files will
be listed.)
2. Clicking repeatedly on the intermediate values box gives the option whether or
not to generate intermediate values . If the intermediate values are desired, then
they will be calculated by interpolating between control actions. This only applies
to the continuous mode of play.
3. As well, the speed of the continuous replay can be varied by sliding the bar in
the speed box anywhere between normal and fast.
4. Click on 'OKt.
The interface is configured to match the state of the system- at the beginning of a trial.
There is a graphic in the bottom left hand corner of the screen which contains the controls for
Dplayer. Dplayer can be controlled somewhat like a tape player or VCR. It operates in two
modes: discrete steps and continuous replay.
Discrete Steps
In the discrete mode, Dplayer can be controlled using two keys: the key with the
blue double arrow pointing to the right (>>) and the key with the blue double arrow
pointing to the left (<<). The >> key allows the user to move forward through the trial,
step by step. Similarly, the <<key backs up through the trial, step by step.
There is a small clock just above these keys which indicates the time that has
elapsed in the trial. At the beginning, the clock reads O0:OO:Oo. In the step by step play
DURESS 11 User's Manual
18
mode, the clock will not advance uniformly. It displays only the times at which control
actions were made.
When the >> key is pressed, the first control action is highlighted with a large
green arrow. As the trial progresses by pressing the >> key, each control action in turn
is highlighted by the large green arrow. It should be noted that the time intervals between
each control action are not equal.
Another way to determine the relative position within the trial is to refer to the slider
just below the timer. When the indicator is in its extreme left hand position, the trial is just
beginning. When the indicator is in its extreme right hand position, the trial is at the end.
At intermediate times in the trial, the indicator will show the position relative to the
beginning and end of the trial. However, in the discrete steps mode of operation, Dplayer
will not advance beyond the last control action even if this is not yet the end of the trial.
C o ~ t t i ~ z u o uReplay
s
In the continuous replay mode, it is possible to play the trial continuously using the
key with the blue single arrow pointing to the right (>). In this mode of operation, the key
with the blue square pauses the trial. To resume playing the trial again, the > key will
restart the continuous replay. The keys to the right of the timer control the speed of the
replay. The up arrow (6)speeds up the rate of replay, while the down arrow (V) slows
down the rate of replay.
In the continuous replay mode of operation, a message box will indicate the end of the trial
and the reason for the termination (e.g., steady state was reached). Additional information
from the trial can also he accessed by clicking on the 'inf.' button in the 'IDURESS Control
Panel' window. The foIIowing information will be listed in the window:
*
*
*
Subject
Trial
Date 8i time of trial
Interface used
Total time of trial
Configuration file used
How the trial was terminated
DURESS I1 User's Manual
19
D
low
T
low
727.1
gcod
17.8
high
1438.6
g=cd
high
1491
0
40.60%
L
FIGURE 6. A SCORE BOX DISPLAYED BY DPLAYER'S 'INFO' BIJTION.
Furthermore, there is a score box, illustrated in Figure 5, which gives statistics on
the amount of water that was released from the system, in and out of the temperature and
demand goals. It also gives the percentage of water released which was completely in the
goal regions. For instance, in Figure 6 the score box shows that 40.6% of the fluid that the
operator released from the system that was within both temperature and demand goal
regions.
Rurz dxtract
In order to analyze individual variables, or groups of variables, from the Log Files,
dxtract can be used in a multitude of ways. For example, if the user wanted to extract the
flow through valve VA from the Log File 'xx.Ol.log', the following commands must be
executed ( the % sign indicates the UNIX prompt and the system response is indented ):
% dxtract xx.0l.log > VAflow
# 'VAflow' is an arbitrary destination file
# name
DURESS n: User's Manual
20
1. PA state
2. PB state
3. VA setting
4. VA flow
5. VA1 setting
...*
42. Actions
Choice: 4
# Enter 4 for VA flow data
Or alternatively, if the user know's which component number they want to extract,
it can be typed in directly:
% dxtract -v 4 xx.0l.log > VAflow
To extract VB flow from a file called 'xx.0l.log' and save it in file 'Vbflow', the
following command should be typed:
% dxtract -v 10 xx.0l.log > VBflow
Files created with 'dxtract' will have two columns of data separated by tabs. The
first column is always 'time' and the second the extracted variable. The first row contains a
header describing the data in each column.
To combine two (or more) already extracted files into one, e-g., 'VAflow' and
'VBflow' into 'flows', use:
% combine VAflow VBtlow > flows
This will create the file 'flows' with three columns: time in the first, VAflow in the second,
VBflow in the third. An algorithm to run dxtract for a series of log files is included in
Appendix D.
DURESS PI User's Manual
21
Run dgraph & dgraphgen
To use dgraph, the analysis must be run from a directory where dxtract, dgraphgen,
and dgraph are all accessible. Once this is done, the following commands must be typed:
% dxtract -v42 <logfile> > 1ogfile.d~
# takes the 'action' data from the
# desired logfile and places it in a file
# called 'logfile-dx'
% cut -f1,2 1ogfile.d~> 1ogiile.cut
# puts the first 2 columns from
# '1ogfile.d~'into a file called
# '1ogfile.cut'
5% cat 1ogfile.cut I dgraphgen 1 I dgraph
# sends '1ogiile.cut' to dgraphgen and
# using style 1 (all the components) to
# dgraph which plots it on the screen
Once the graph has been displayed on the screen, adjustments can be made to make
clarify the graph. For instance, if a node happens to be blocking a path line, the node can
be moved slightly by dragging and dropping it. Also, if the subject repeatedly switched
between two nodes, the path line will be very thick, thus obstructing the view of other
lines. The overall thickness of the lines can be reduced using the slider in the bottom left
corner of the screen. Once the graph is satisfactory, it can be saved to a file of any format
by clicking on the 'Save' button.
In order to use dloggen, the user must be in the same directory as the log files.
Then the user must decide the time interval for the interpolation. The following command
shows how to use dloggen if one desires an interval time of 10 seconds for the file called
'old-log' to be saved as 'new.log'
% dloggen 10 old.log new.log
DURESS 11 User's Manual
22
References
Moray, N., Looststeen, P., & Pajak, J. (1986). Acquisition of process control
skills. IEEE Transactions qf Systems, Mund, and Cybernetics, SMC-16, 497-504.
Vicente, K. J. & Rasmussen J. (1990). The ecology of human-machine systems E:
Mediating "direct perception" in complex work domains. Ecological Psychology, 2, 207249.
DURESS 11User's Manual
23
Appendices
Appelzdix A:
Sample colzfiguratiolz file
#
#
#
#
#
#
#
# Sample configuration file for DURESS I1
#
# + recommended values to change are marked with #*
# + use -1 as the fault time when no fault needed;
# all fault times are in minutes
# + comments start with # and continue to the end of line
#
#
# global values
0.1
5
0
1.5
1
#
#
#
#
#
simulation interval (sec)
steady time (min)
time after which steady state is checked (min)
temperature margin (C)
demand margin (kdsec)
#****************+**Demandchange*************************
# change in demand for upper reservoir
# the name
dcl
# maximum demand (kE/sec)
20
6
#* initial demand (kdsec)
6
#* initial demand (kg!sec)
0.1
# time constant
#* demand when fault 1 (O..maximum flow)
0
#* time of fault 1
-1
#* demand when fault 2 (O..maximum flow)
0
#* time of fault 2
-1
# change in demand for lower reservoir
# the name
dc2
# maximum demand (kE/sec)
20
9
#* initial demand (kdsec)
9
#* initial demand (kglsec)
0.1
# time constant
#* demand when fault 1 (O..maximum flow)
0
#* time of fault 1
-1
#* demand when fault 2 (O..maximum flow)
0
#* time of fault 2
-1
#**+***************Hiddenheaters .........................
# inflow
hh0 # the heater name
#* maximum temperature (C)
50
#* initial temperature (C)
10
#* initial temperature (C)
10
15
# time constant
#* temperature when fault 1 (O..maximum flow)
0
-
DURESS II User's Manual
24
-1
0
-1
#* time of fault 1
#* temperature when fault 2 (0..maximum flow)
#* time of fault 2
# reservoir 1
hh 1 # the heater name
2.09e6 # max heat flow to reservoir 1 (W)
0
# initial heat flow
0
# initial heat flow
15
# time constant
#* heat flow when fault 1 (O..maximum flow)
0
#* time of fault 1
-1
#* heat flow when fault 2 (O..maximum flow)
0
-1
#* time of fault 2
# reservoir 2
hh2 # the heater name
2.09e6 # max heat flow to reservoir 2 (W)
0
# initial heat flow
0
# initial heat flow
15
# time constant
#* heat flow when fault 1 (O..maximurn flow)
0
#* time of fault 1
-1
#* heat flow when fault 2 (O..maximum flow)
0
#* time of fault 2
-1
#*******************Upperstring**************************
# pump PA
PA
# the pump name
#* initial state (0: off, 1: on)
0
0.05 # minimum flow through pump
# maximum flow through pump (kdsec)
10
5
# time constant
-1
#* time of fault
5
# time to blow up when valves are closed
# valve VA
VA
# the valve name
# maximum flow through valve (kg/sec)
10
#* initial valve setting (O..maximum flow)
0
#* initial flow thru valve (O..maximum flow)
0
5
# time constant
#* valve setting when fault 1 (O..maximum flow)
0
#* time of fault 1
-1
#* valve setting when fault 2 (O..maximum flow)
0
-1
#* time of fault 2
# valve VA1
VAl # the valve name
# maximum flow through valve (kdsec)
10
#* initial valve setting (O..maximum flow)
0
#* initial flow thru valve (O..maximum flow)
0
5
# time constant
#* valve setting when fault 1 (O..maximum flow)
0
#* time of fault 1
-1
#* valve setting when fault 2 (O..maximum flow)
0
DURESS I1 User's Manual
25
#* time of fault 2
# valve VA2
vA2
# the valve name
# maximum flow through valve (kdsec)
#* initial valve setting (O..maximum flow)
#* initial flow thru valve (O..maximum flow)
# time constant
#* valve setting when fault 1 (O..maximum flow)
#* time of fault 1
#* valve setting when fault 2 (O..maximum flow)
#* time of fault 2
# splitter
20
# maximum flow through splitter (kglsec)
# +*++*+******+**+***
Lower string ..........................
# pump PB
# the pump name
PB
#* initial state (0, 1)
0
0.05 # minimum flow through pump
# maximum flow through pump (kdsec)
10
5
# time constant
-1
#* time of fault
# time to blow up
5
# valve VB
VB
# the valve name
# maximum flow through valve (kdsec)
10
#* initial valve setting (O..maximum flow)
0
#* initial flow thru valve (O..maximum flow)
0
5
# time constant1
#* valve setting when fault 1 (O..maximum flow)
0
#* time of fault 1
-1
#* valve setting when fault 2 (O..maximum flow)
0
#* time of fault 2
-1
# valve VB 1
VB 1 # the valve name
# maximum flow through valve
10
#* initial valve setting (O..maximum flow)
0
#* initial flow thru valve (O..maximum flow)
0
5
# time constant
0
#* valve setting when fault 1 (O..maximum flow)
#* time of fault 1
-1
#* valve setting when fault 2 (O..maximum flow)
0
#* time of fault 2
-1
# valve VB2
VB2 # the valve name
# maximum flow through valve
10
#* initial valve setting (O..maximum flow)
0
#* initial flow thru valve (O..maximum flow)
0
# time constant
5
#* valve setting when fault 1 (O..maximum flow)
0
-1
#* time of fault 1
#* valve setting when fault 2 (O..maximum flow)
0
- 1 #* time of fault 2
# splitter
DURESS II User's Manual
26
20
# maximum flow through splitter (kgfsec)
# upper heater
# the maximum heater setting (O..inf)
10
#* initial heater setting (O..maximum setting)
0
#* initial heater output (O..maximum setting)
0
1.25e6 # maximum heat flow from heater (W)
15
# time constant
-1
#* time of fault
-1
#* output percentage when fault occurs
# lower heater
# the maximum heater setting (O..inf)
10
#* initial heater setting (O..maximum setting)
0
#* initial heater output (O..maximum setting)
0
1.25e6 # maximum heat flow from heater (W)
15
# time constant
-1
#* time of fault
-1
#* percentage of fault
# upper reservoir
Reservoir 1 # the reservoir name
# maximum water inflow (kglsec)
20
# maximum water outflow (kgfsec)
20
#* initial water level (m)
0
0.0 1 # minimum water level
1
# maximum water level
#* water demand temperature (C)
40
50
# maximum water temperature
2.09e3 # minimum energy inflow
2.09e6
2.09e6
0
168e6
1
1 0
4.2e3
100
# maximum energy inflow
# maximum energy outflow
#* initial energy stored in reservoir (J)
# maximum energy stored in reservoir
-3
#* additional water inflow (kgfs)
#
>0: additional inflow, <O:leak
#* additional inflow temperature (C)
needed when water inflow is > 0
#
#* time of additional inflow fault
# time for reservoir to blow up
0
3
30
#
#
#
#
tank area (m2)
water density (kglm3)
specific heat capacity of water (J1kg.C)
water boiling temperature (C)
# lower tank
Reservoir 2
20
20
0
0.0 1
# the reservoir name
# maximum water inflow (kglsec)
# maximum water outflow &dsec)
# initial water level (m)
# minimum water level
DURESS II User's Manual
27
# maximum water level
1
#* water demand temperature (C)
20
# maximum water temperature
50
2.09e3 # minimum energy inflow
2.09e6 # maximum energy inflow
2.09e6 # maximum energy outflow
#* initial energy stored in reservoir (J)
0
168e6 # maximum energy stored in reservoir
# tank area (m2)
1
1000 # water density (kglm3)
4.2e3 # specific heat capacity of water (J1kg.C)
100 # water boiling temperature (C)
3
30
4
30
#* additional water inflow (kds)
#
>0: additional inflow, <():leak
#* additional inflow temperature (C)
needed when water inflow is > 0
#
#* time of additional inflow fault
# time for reservoir to blow up
# valve VOI
v01
20
0
0
5
0
-1
0
-1
# valve V 0 2
V02
20
0
0
5
0
-1
0
-1
# the valve name
# maximum flow through valve (kdsec)
#* initial valve setting (O..maximum flow)
#* initial flow through valve (O..maximum flow)
# time constant
#* valve setting when fault 1 (O..maximum flow)
#* time of fault 1
#* valve setting when fault 2 (O..maxirnum flow)
#* time of fault 2
# the valve name
# maximum flow through valve (kdsec)
#* initial valve setting (O..maximum flow)
#* initial flow through valve (O..maximum flow)
# time constant
#* valve setting when fault 1 (O..maximum flow)
#* time of fault 1
#* valve setting when fault 2 (O..maximum flow)
#* time of fault 2
DURESS ll User's Manual
28
Appendix B:
Dxtraet Variables
1. PA state
2. PB state
3. VA setting
4. VA flow
5. VAl setting
6. VA1 flow
7. VA2 setting
8. VA2 flow
9. VB setting
10. VB flow
11. VB 1 setting
12. VB 1 flow
13. VB2 setting
14. VB2 flow
15. V 0 1 setting
16. V 0 2 setting
17. HTRl setting
18. HTRl flow
19. HTR2 setting
20. HTR2 flow
2 1. Reservoir 1 water level
22. Reservoir 1 water temperature
23. Reservoir 1 water inflow
24. Reservoir 1 water outtlow
25. Reservoir 1 water demand
26. Reservoir 1 energy inflow from water
27. Reservoir 1 energy inflow from heater
28. Reservoir 1 energy outflow
29. Reservoir 1 energy level
30. Reservoir 1 water target temperature
3 1. Reservoir 2 water level
32. Reservoir 2 water temperature
33. Reservoir 2 water inflow
34. Reservoir 2 water outflow
35. Reservoir 2 water demand
36. Reservoir 2 energy inflow from water
37. Reservoir 2 energy inflow from heater
38. Reservoir 2 energy outflow
39. Reservoir 2 energy level
40. Reservoir 2 water target temperature
41. Window
42. Actions
DURESS If User's Manual
29
Appendix C:
Appendix D:
Sample action-transition graph
Dxtract log file extraction program
-.
It may be tedious to run the dxtmct command for a large number of trials, the
following UNIX shell program will run through a simple loop changing subject names, log
fde numbers, and executing the dxtract command line for each one. In the following
example, the 42nd variable (Actions) will be extracted hut this can be changed to suit one's
needs:
for SUBJECT in [list qf sul?jrcts srpclruted by a space]
do
for LOG in [list qf log.fi1e nurnl3rrs sepuruted b y a space]
do
input = $SUBJECT.$LOG.log
outputdx = $SUBJECT.$LOG.dx
echo $input " -> " $outputdx
dxtract -42 $input $ouputdx
done
done
DURESS I1 User's Manual
30
Appetzdix E:
List of commatzds
duress:
The DURESS II simulator. Usage:
5% duress
dplayer:
Replays a session using the log file created with duress. Usage:
% dplayer
dxtract:
Extracts a particular variable from a log file. Usage
% dxtract [-h] [-v vnr#] infile [nutfile]
dgraphgen:
Generates the action-transition graph of a session. Usage:
%J dgraphgen graph#
dgraph:
Displays a graph generated by dgraphgen. Allows re-positioning of vertices and
generation of Postscript files. Usage:
%I dgraph [grf~phfile]
dloggen:
Creates a "complete" log file by interpolating the data obtained from a log file
generated with DURESS 11. Usage:
%I dloggen interval infile outfile
combine:
Combines columns of data obtained with dxtract in a single file. Usage:
56 combine file1 file2 ...
1ogfile.summary.macro:
Lists all trials where the simulation was stopped because steady state was reached
or a system breakdown occurred. The data is listed in three columns. The first is
the log file name; the second is the reason for termination; and the last is the total
time elapsed for the trial. Usage:
DURESS 11 User's Manual
31
compress & uncompress:
Because some files (especially the log tiles) are very large, it is advisable to
compress them. This will make file management much more efficient and save a
considerable amount of disk space. Usage:
% compress [file name]
However, before a file can be used in programs such as dplayer, it must be
uncompressed. Usage:
% uncompress [file name]
Note that compressed files will have the extension '.Z'
Cognitive
Engineering
CEL TECHNICAL REPORT SERIES
CEL 93-01
"Egg-suck~ng,Mousetraps, and the Tower of Babel
Mahne Human Factors Guldance More Access~hleto
~esignkrs"
Klm J. Vicente, Catherine M. Burns, & William S.
Pawlak
CEL 93-02
"Effects of Expertise on Reasoning Trajectories in an
Abstraction Hierarchy: Fault Diagnosis in a Process
Control System"
Klaus Christoffersen, Alex Pereklita, & Kim J. Vicente
CEL 95-09
"To the Beat of a Different Dmmmer: The Role of Individual
Differences in Ecological Interface Design"
Dianne Howie
CEL 95-10
"Emergent Features and Temporal Information: Shall the Twain
Ever Meet'!"
JoAnne H. Wang
CEL 95-1 1
"Physical and Functional Displays in Process Supervision
and Control"
Catherine M. Burns & Kim J. Vicente
CEL 96-01
"Shaping Expertise Through Ecological Interface Design:
Strategies, Metacognition, and Individual Differences"
Dianne E. Howie
CEL 94-01
~laus'~hristoffer&n,
christGpher ~ r ~ u n t e&r ,Kim 1.
Vicente
CEL 94-02
"Muddling Through Wicked Problems: Exploring the
Role of Human Factors Information in Design"
Catherine M. Burns
CEL 96-02
"Skill, Participation, and Competence: Implications of
Ecological Interface Design for Working Life"
Peter Benda, Giuseppe Cioffi, & Kim J. Vicente
CEL 94-03
"Cognitive Work Analysis for the DURESS 11 System"
Kim J. Vicente & William S. Pawlak
CEL 96-03
"Practical Problem Solving in a Design Microworld: An
Exploratory Study'
Klaus Christoffersen
CEL 94-04
"Inducing Effective Control Strategies Through
Ecological Interface Design"
W i l l i a m S. Pawlak
CEL 96-04
"Review of Alarm Systems for Nuclear Power Plants"
Kim J. Vicente
CEL 96-05
"DURESS I1 User's Manual: A Thermal-hydraulic Process
Simulator for Research and Teaching"
Lisa C. Orchanian, Thomas P. Smahel, Dianne E. Howie, &
Kim J. Vicente
CEL 94-05
"Research on Factors Influencing Human Cognitive
Behaviour (I)"
Klaus Christoffersen, Christopher N. Hunter, & Kim J.
Vicente
CEL 94-06
"Ecological Interfaces for Complex Industrial Plants"
Nick Dinadis & Kim J. Vicente
CEL 94-07
"Evaluation of a Display Design Space: Transparent
Layered User Interfaces''
Beverlv L. Harrison. Hiroshi Isbii. Kim J. Vicente. &
Bill ~ u x t o n
CEL 94-08
"Designing and Evaluating Semi-Transparent 'Silk' User
Interface Objects:
Supporting Focused and Divided Attention"
Beverly L. Harrison, Shumin Zhai, Kim J. Vicente, &
Bill Buxton
CEL 95-01
"An Ecological Theory of Expertise Effects in Memory
Recall''
Kim J. Vicente & JoAnne H. Wang
CEL 95-02
"Strategic Plan - 1995"
Cognitive Engineering Lahoratory
CEL 95-03
"Cognitive Engineering Laboratory Profile"
Cognitive Engineering Laboratory
CEL 95-04
"A Field Study of Operator Cognitive Monitoring at
Pickering Nuclear Generating Station-B"
Kim J. Vicente & Catherine M. Burns
CEL 95-05
"An Empirical Investigation of the Effects of Training and
Interface Design on the Control of Complex Systems"
Christopher N. Hunter
CEL 95-06
"Applying Human Factors to the Design of Medical
Equipment: Patient-Controlled Analgesia''
Laura Lin, Racquel Isla, Karine Doniz, Heather Harkness,
Kim J. Vicente, & D. John Doyle
CEL 95-07
"An Experimental Evaluation of Transparent Menu Usage"
Beverly L. Harrison & Kim J. Vlcente
CEL 95-08
"Research on Factors Influencing Human Cognitive
Behav~our(11)"
Christopher N. Hunter, Michael E. Janzen, & Kim J. Vicente