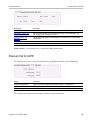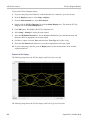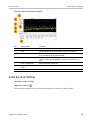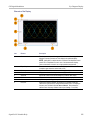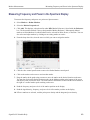
1
xx
ZZZ
SignalVu-PC
Vector Signal Analysis Software
Printable Help
*P077072003*
077-0720-03
ZZZ
SignalVu-PC
Vector Signal Analysis Software
Printable Help
www.tektronix.com
077-0720-03
Copyright © Tektronix. All rights reserved. Licensed software products are owned by Tektronix or its
subsidiaries or suppliers, and are protected by national copyright laws and international treaty provisions.
Tektronix products are covered by U.S. and foreign patents, issued and pending. Information in this
publication supersedes that in all previously published material. Specifications and price change privileges
reserved.
TEKTRONIX and TEK are registered trademarks of Tektronix, Inc.
Online help version: 076-0281-03
Contacting Tektronix
Tektronix, Inc.
14150 SW Karl Braun Drive
P.O. Box 500
Beaverton, OR 97077
USA
For product information, sales, service, and technical support:
In North America, call 1-800-833-9200.
Worldwide, visit www.tektronix.com to find contacts in your area.
Table of Contents
Table of Contents
Welcome
Welcome .............................................................................................................
1
About the Tektronix Signal Analyzer
Product software ....................................................................................................
Options
Options..........................................................................................................
Documentation and support
Documentation .................................................................................................
Video tutorials..................................................................................................
3
3
3
4
Orientation
Selecting Files for Analysis .......................................................................................
Right-Click Action Menu .........................................................................................
Elements of the Display............................................................................................
7
7
9
Using SignalVu-PC
Restoring Default Settings........................................................................................
Presets...............................................................................................................
Settings Options ...................................................................................................
Connectivity........................................................................................................
13
13
18
20
Using the Measurement Displays
Selecting Displays .................................................................................................
27
Taking Measurements
Measurements
Available Measurements .....................................................................................
29
General Signal Viewing
Overview ...........................................................................................................
DPX
DPX Display Overview ......................................................................................
DPX Display ..................................................................................................
DPX Settings ..................................................................................................
Time Overview
Time Overview Display ......................................................................................
Time Overview Settings .....................................................................................
SignalVu-PC Printable Help
37
37
37
42
47
48
i
Table of Contents
Navigator View ...............................................................................................
Spectrum
Spectrum Display .............................................................................................
Spectrum Settings.............................................................................................
Spectrogram
Spectrogram Display .........................................................................................
Spectrogram Settings .........................................................................................
Amplitude Vs Time
Amplitude Vs Time Display .................................................................................
Amplitude Vs Time Settings ................................................................................
Frequency Vs Time
Frequency Vs Time Display .................................................................................
Frequency Vs Time Settings.................................................................................
Phase Vs Time
Phase Vs Time Display.......................................................................................
Phase Vs Time Settings ......................................................................................
RF I & Q Vs Time
RF I & Q vs Time Display ...................................................................................
RF I & Q vs Time Settings...................................................................................
Common Controls for General Signal Viewing Displays
General Signal Viewing Shared Measurement Settings ..................................................
50
53
55
56
59
63
64
65
66
67
68
69
70
71
Analog Modulation
Overview ...........................................................................................................
AM
AM Display ...................................................................................................
AM Settings ...................................................................................................
FM
FM Display ....................................................................................................
FM Settings....................................................................................................
PM
PM Display ....................................................................................................
PM Settings....................................................................................................
81
81
82
87
89
95
97
RF Measurements
Overview .........................................................................................................
Channel Power and ACPR
Channel Power and ACPR (Adjacent Channel Power Ratio) Display................................
Channel Power and ACPR Settings ......................................................................
MCPR
MCPR (Multiple Carrier Power Ratio) Display .........................................................
MCPR Settings..............................................................................................
ii
105
105
108
111
115
SignalVu-PC Printable Help
Table of Contents
Occupied BW & x dB BW
Occupied BW & x dB BW Display.......................................................................
Occupied BW & x dB BW Settings ......................................................................
CCDF
CCDF Display...............................................................................................
CCDF Settings ..............................................................................................
Settling Time Measurements
Settling Time Measurement Overview ...................................................................
Settling Time Displays
Settling Time Displays .....................................................................................
Settling Time Settings ......................................................................................
Common Controls for Settling Time Displays
Settling Time Displays Shared Measurement Settings .................................................
SEM (Spectrum Emission Mask)
SEM Display ................................................................................................
Spectrum Emission Mask Settings........................................................................
Common Controls for RF Measurements Displays
RF Measurements Shared Measurement Settings .......................................................
121
124
126
127
128
133
141
141
149
153
161
WLAN Measurements
WLAN Overview................................................................................................
WLAN Chan Response
WLAN Channel Response Display .......................................................................
WLAN Channel Response Settings.......................................................................
WLAN Constellation
WLAN Constellation Display .............................................................................
WLAN Constellation Settings.............................................................................
WLAN EVM
WLAN EVM Display ......................................................................................
WLAN EVM Settings ......................................................................................
WLAN Mag Error
WLAN Magnitude Error Display .........................................................................
WLAN Magnitude Error Settings.........................................................................
WLAN Phase Error
WLAN Phase Error Display ...............................................................................
WLAN Phase Error Settings...............................................................................
WLAN Power vs Time
WLAN Power vs Time Display ...........................................................................
WLAN Power vs Time Settings...........................................................................
WLAN Spectral Flatness
WLAN Spectral Flatness Display.........................................................................
WLAN Spectral Flatness Settings ........................................................................
SignalVu-PC Printable Help
169
171
173
174
175
176
177
178
179
180
181
182
184
185
186
iii
Table of Contents
WLAN Summary
WLAN Summary Display .................................................................................
WLAN Summary Settings .................................................................................
WLAN Symb Table
WLAN Symbol Table Display ............................................................................
WLAN Symbol Table Settings ............................................................................
Common Controls for WLAN Analysis Displays
WLAN Analysis Shared Measurement Settings ........................................................
187
191
192
194
194
OFDM Analysis
Overview .........................................................................................................
OFDM Chan Response
OFDM Channel Response Display .......................................................................
OFDM Channel Response Settings .......................................................................
OFDM Constellation
OFDM Constellation Display .............................................................................
OFDM Constellation Settings .............................................................................
OFDM EVM
OFDM EVM Display ......................................................................................
OFDM EVM Settings ......................................................................................
OFDM Flatness
OFDM Spectral Flatness Display .........................................................................
OFDM Spectral Flatness Settings.........................................................................
OFDM Mag Error
OFDM Magnitude Error Display .........................................................................
OFDM Magnitude Error Settings .........................................................................
OFDM Phase Error
OFDM Phase Error Display ...............................................................................
OFDM Phase Error Settings ...............................................................................
OFDM Power
OFDM Power Display .....................................................................................
OFDM Power Settings .....................................................................................
OFDM Summary
OFDM Summary Display..................................................................................
OFDM Summary Settings .................................................................................
OFDM Symb Table
OFDM Symbol Table Display.............................................................................
OFDM Symbol Table Settings ............................................................................
Common Controls for OFDM Analysis Displays
OFDM Analysis Shared Measurement Settings .........................................................
iv
205
205
207
208
209
209
210
211
212
213
214
215
216
217
218
219
220
221
222
222
SignalVu-PC Printable Help
Table of Contents
Pulsed RF
Overview .........................................................................................................
Pulse Table Display
Pulse Table Display.........................................................................................
Pulse Table Settings ........................................................................................
Pulse Trace Display
Pulse Trace Display.........................................................................................
Pulse Trace Settings ........................................................................................
Pulse Statistics
Pulse Statistics Display.....................................................................................
Pulse Statistics Settings ....................................................................................
Common Controls for Pulsed RF Displays
Pulsed RF Shared Measurement Settings ................................................................
231
231
232
233
235
235
237
238
APCO P25 Analysis
APCO P25 Analysis.............................................................................................
Overview ....................................................................................................
P25 Standards Presets ......................................................................................
P25 Displays ................................................................................................
P25 Measurements..........................................................................................
P25 Test Patterns............................................................................................
P25 Constellation
P25 Constellation Display .................................................................................
P25 Constellation Settings .................................................................................
P25 Eye Diagram
P25 Eye Diagram Display .................................................................................
P25 Eye Diagram Settings .................................................................................
P25 Power vs Time
P25 Power vs Time Display ...............................................................................
P25 Power vs Time Settings ...............................................................................
P25 Summary
P25 Summary Display .....................................................................................
P25 Summary Settings .....................................................................................
P25 Symbol Table
P25 Symbol Table Display.................................................................................
P25 Symbol Table Settings ................................................................................
P25 Frequency Deviation Vs Time
P25 Frequency Dev Vs Time Display ....................................................................
P25 Frequency Dev Vs Time Settings....................................................................
Common Controls for P25 Analysis Displays
P25 Analysis Shared Measurement Settings.............................................................
SignalVu-PC Printable Help
249
249
250
251
252
260
263
265
265
267
268
269
270
273
273
275
276
278
279
v
Table of Contents
Audio Analysis
Overview .........................................................................................................
Audio Spectrum
Audio Spectrum Display ...................................................................................
Audio Spectrum Settings...................................................................................
Audio Summary
Audio Summary Display...................................................................................
Audio Summary Settings ..................................................................................
Common Controls for Audio Analysis Displays
Audio Analysis Measurement Settings ...................................................................
291
292
293
294
295
296
GP Digital Modulation
Overview .........................................................................................................
Constellation
Constellation Display.......................................................................................
Constellation Settings ......................................................................................
Demod I & Q vs Time
Demod I & Q vs Time Display ............................................................................
Demod I & Q vs Time Settings ...........................................................................
EVM vs Time
EVM vs Time Display......................................................................................
EVM vs Time Settings .....................................................................................
Eye Diagram
Eye Diagram Display.......................................................................................
Eye Diagram Settings ......................................................................................
Frequency Deviation vs Time
Frequency Deviation vs Time Display ...................................................................
Frequency Deviation vs Time Settings ...................................................................
Magnitude Error vs Time
Magnitude Error vs Time Display ........................................................................
Magnitude Error vs Time Settings ........................................................................
Phase Error vs Time
Phase Error vs Time Display ..............................................................................
Phase Error vs. Time Settings .............................................................................
Signal Quality
Signal Quality Display .....................................................................................
Signal Quality Settings .....................................................................................
Symbol Table
Symbol Table Display ......................................................................................
Symbol Table Settings......................................................................................
Trellis Diagram
Trellis Diagram Display....................................................................................
vi
307
308
309
310
312
312
313
314
316
316
318
319
320
321
322
323
328
329
330
331
SignalVu-PC Printable Help
Table of Contents
Trellis Diagram Settings ...................................................................................
Common Controls for GP Digital Modulation Displays
GP Digital Modulation Shared Measurement Settings .................................................
Standard Settings Button...................................................................................
Symbol Maps
Symbol Maps................................................................................................
User Filters
Overview: User Defined Measurement and Reference Filters.........................................
User Filter File Format .....................................................................................
333
333
334
351
356
357
Marker Measurements
Using Markers
Using Markers...............................................................................................
Controlling Markers with the Right-Click Actions Menu..............................................
Measuring Frequency and Power in the Spectrum Display ............................................
Common Marker Actions
Marker Action Controls ...............................................................................
Peak......................................................................................................
Next Peak ...............................................................................................
Marker to Center Frequency ..........................................................................
Define Markers Control Panel
Enabling Markers and Setting Marker Properties ..................................................
Markers Toolbar
Using the Markers Toolbar............................................................................
Noise Markers in the Spectrum Display
Measuring Noise Using Delta Markers in the Spectrum Display.................................
361
361
363
364
364
364
364
364
366
367
Mask Testing
The Mask Test Tool .............................................................................................
Mask Test Settings...............................................................................................
Define Tab (Mask Test) .........................................................................................
Actions Tab.......................................................................................................
371
371
371
376
Analyzing Data
Analysis Settings
Analysis Settings............................................................................................
Analysis Time Tab ..........................................................................................
Spectrum Time Tab .........................................................................................
Frequency Tab...............................................................................................
Units Tab.....................................................................................................
Analyzing Data Using Replay
Replay Overview ...........................................................................................
SignalVu-PC Printable Help
377
377
379
379
382
383
vii
Table of Contents
Replay Menu ................................................................................................
Acq Data .....................................................................................................
DPX Spectra.................................................................................................
Replay All Selected Records ..............................................................................
Replay Current Record .....................................................................................
Replay from Selected.......................................................................................
Pause .........................................................................................................
Stop...........................................................................................................
Select All ....................................................................................................
Select Records from History...............................................................................
Replay Toolbar ..............................................................................................
385
386
386
386
386
387
387
387
387
387
387
Amplitude Corrections
Amplitude Settings ..............................................................................................
External Gain/Loss Correction Tab............................................................................
External Gain Value ........................................................................................
External Loss Tables .......................................................................................
389
389
389
389
Controlling the Acquisition of Data
Acquisition Controls in the Acquire Control Panel
Acquire.......................................................................................................
Acquisition Data ............................................................................................
IQ Sampling Parameters ...................................................................................
Frequency Reference ......................................................................................
Record........................................................................................................
Triggering
Triggering....................................................................................................
Trigger Settings .............................................................................................
Event Tab ....................................................................................................
Advanced Tab (Triggering) ................................................................................
Actions Tab (Triggering)...................................................................................
393
394
395
396
396
397
399
400
401
402
Managing Data, Settings, and Pictures
Saving and Recalling Data, Settings, and Pictures...........................................................
Data, Settings, and Picture File Formats ......................................................................
Printing Screen Shots ...........................................................................................
403
410
414
Reference
Online Help ......................................................................................................
About the Vector Signal Analysis Software ..................................................................
Mapping Measurements
Mapping Measurements....................................................................................
viii
415
415
416
SignalVu-PC Printable Help
Table of Contents
Menus
Menu Overview .............................................................................................
File Menu
File Menu ...............................................................................................
View Menu
View Menu .............................................................................................
Run Menu
Run Menu...............................................................................................
Replay
Replay Menu ...........................................................................................
Markers Menu
Markers Menu ..........................................................................................
Setup Menu
Setup Menu .............................................................................................
Presets Menu
Presets Menu ...........................................................................................
Tools Menu
Tools Menu .............................................................................................
Live Link Menu
Live Link Menu ........................................................................................
Window Menu
Window Menu..........................................................................................
Help Menu
Help Menu ..............................................................................................
Troubleshooting
Error and Information Messages ..........................................................................
Displaying the Windows Event Viewer ..................................................................
Upgrading the Product Software
How to Find Out if Software Upgrades are Available ..................................................
Activating a License
Activating SignalVu-PC options in evaluation mode ...................................................
Activating SignalVu-PC Options .........................................................................
Activating with Internet Access ......................................................................
Activating without internet access ...................................................................
Managing Licenses
Managing SignalVu-PC Licenses .........................................................................
Changing Settings
Settings.......................................................................................................
416
417
422
423
424
424
424
425
425
425
426
426
427
433
434
434
435
435
436
437
438
Glossary
Index
SignalVu-PC Printable Help
ix
Table of Contents
x
SignalVu-PC Printable Help
Welcome
Welcome
Welcome
This help provides in-depth information on how to use the SignalVu-PC Vector Signal Analysis Software.
Using the signal analysis engine of the RSA5100 and RSA6100 Series real-time signal analyzer,
SignalVu-PC vector signal analysis software helps you move your analysis of acquisitions off the
instrument.
But with SignalVu-PC’s Live Link feature, you can connect to an RSA306 USB Spectrum Analyzer
or an MDO4000B oscilloscope, acquiring live data. Several features and settings become available in
SignalVU-PC once connected to one of these instruments. These are noted where appropriate throughout
the help system.
This help is also available in a PDF format for printing.
NOTE. Many of the screen illustrations in this document are taken from the vector signal analysis
software version that runs on the RSA51000 Series Real-time Signal Analyzers. These instruments
support additional hardware-based functionality and buttons that are not present in the SignalVu™
or SignalVu-PC application.
SignalVu-PC Printable Help
1
Welcome
2
Welcome
SignalVu-PC Printable Help
About the Tektronix Signal Analyzer
Product software
Product software
You can obtain the SignalVu-PC software two ways:
You can download the software from the Web. When you purchase the software, you will receive an
email with option keys that enables you to activate the software and options.
You can purchase the software and choose to have it shipped to you on a DVD. The package you
receive will contain a document with an option key that enables you to activate the software.
NOTE. If you purchased an MDO4000B Series instrument or an RSA306 spectrum analyzer, a 30-day
free trial of the SignalVu-PC software is included.
Occasionally, new versions of software may become available at our Web site. Visit
www.tektronix.com/downloads for information.
Options
To view a listing of the software options installed in your software, select Help > About Tektronix
Real Time Signal Analyzer.
Options can be added to your software. For the latest information on available option upgrades, see
the Tektronix Web site.
Documentation
In addition to the application Help, the following documents are available. For the most up to date
documentation, visit the Tektronix Web site www.tektronix.com/downloads.
SignalVu-PC Read This First (Tektronix part number 077-1024-XX). This PDF document
(located on the software CD or within the downloaded software archive) explains how to install the
SignalVu-PC software and activate the software. The Instructions also provide a brief overview of the
SignalVu-PC software. It identifies elements of the SignalVu-PC screen and elements of different
displays. The Read This First is also available for download at www.tektronix.com/downloads.
SignalVu-PC Programmer Manual (077-0721-XX). This PDF document provides supplementary
information about the remote commands for the SignalVu-PC software. Because SignalVu-PC is
based on the RSA6100B/RSA5100B Series signal analyzers, it uses the same remote commands
with some limitations (primarily based on hardware). The SignalVu-PC Programmer Manual details
which RSA6100B/RSA5100B/SPECMONB Series commands are not supported by SignalVu-PC and
explains how to use the programming interface for SignalVu-PC. For detailed descriptions of the
SignalVu-PC Printable Help
3
About the Tektronix Signal Analyzer
Video tutorials
remote commands, see the RSA6100, RSA5100, or SPECMON Series Real-Time Signal Analyzers
Programmer Manual.
SignalVu-PC Printable Help Document (PDF) (077-0720-XX). A PDF file version of the help that
can easily be printed.
The most recent versions of the product documentation, in PDF format, can be downloaded from
www.tektronix.com/manuals. You can find the manuals by searching on the product name.
Video tutorials
You can browse the Tektronix YouTube channel (www.youtube.com/user/tektronix) to find video tutorials
about various topics related to your product. You can also subscribe to the Tektronix YouTube channel to
keep up with new postings.
Searching for topics
For example, you can watch a video tutorial about WLAN Presets and using Live Link (Option CON) to
connect to an MDO4000B. To find a video on this topic, do the following. The following image shows you
what the Tektronix YouTube Channel looks like.
1. Click on the search icon located just above the video you see when the page first loads.
NOTE. This icon allows you to search the Tektronix YouTube channel specifically. The search icon located
at the top of the page allows you to search all of YouTube .
2. Type in the keyword “WLAN” in the search field.
3. Click the search icon to start the search.
4. Videos related to the topic will appear. Click a video to view it.
4
SignalVu-PC Printable Help
About the Tektronix Signal Analyzer
SignalVu-PC Printable Help
Video tutorials
5
About the Tektronix Signal Analyzer
6
Video tutorials
SignalVu-PC Printable Help
Orientation
Selecting Files for Analysis
Selecting Files for Analysis
The SignalVu-PC software can analyze waveform files saved by Tektronix oscilloscopes and real-time
signal analyzers. SignalVu-PC can open several file types, including .wfm, .tiq, .iqt and .mat files. For
more detailed information on opening the supported file types, see Recalling Waveforms with SignalVuPC
(see page 404).
Right-Click Action Menu
You can change marker settings and how waveforms are displayed by using the right-click Actions menu.
To use the right-click Actions menu, right-click in the graph area.
SignalVu-PC Printable Help
7
Orientation
Icon
Right-Click Action Menu
Menu
Description
Select
Selects markers and adjusts their position.
Span Zoom
Zooms the graph area about the selected point. Right-click in
the graph display at a point of interest and drag to increase or
decrease the span about the point of interest. Span Zoom adjusts
the span control.
CF Pan
Adjusts the Center Frequency according to horizontal movement.
Zoom
Adjusts horizontal and vertical scale of the graph. The first
direction with enough movement becomes the primary scale of
adjustment. Adjustment in the secondary direction does not occur
until a threshold of 30 pixels of movement is crossed.
Dragging to the left or down zooms out and displays a smaller
waveform (increases the scale value). Dragging to the right or up
zooms in and displays a larger waveform (decreases the scale
value).
Pan
Adjusts horizontal and vertical position of the waveform. The first
direction with enough movement becomes the primary direction of
movement. Movement in the secondary direction does not occur
until a threshold of 30 pixels of movement is crossed.
-
Reset Scale
Returns the horizontal and vertical scale and position settings
to their default values.
-
Marker to peak
Moves the selected marker to the highest peak. If no marker is
turned on, this control automatically adds a marker.
-
Add marker
Defines a new marker located at the horizontal center of the graph.
-
All markers off
Removes all markers.
xxx
SignalVu-PC Markers Menu
The SignalVu-PC Markers menu appears when you right-click on a marker. The SignalVu-PC Markers
menu enables you to assign a marker to a different trace and pan the trace to place the marker at the
measurement frequency.
Icon
-
Menu
Description
Pan to marker
Adjusts horizontal position of the waveform to locate the selected
marker at the measurement frequency.
-
Assign to trace
Assigns the selected marker to Trace 1, Trace 2, Trace 3 or the
Math trace. A trace must be enabled to assign a marker to it.
xxx
8
SignalVu-PC Printable Help
Orientation
Elements of the Display
Elements of the Display
The main areas of the application window are shown in the following figure.
Specific elements of the display are shown in the following figure.
SignalVu-PC Printable Help
9
Orientation
10
Elements of the Display
SignalVu-PC Printable Help
Orientation
Elements of the Display
Ref
number
Setting
Description
1
Recall
Displays the Open window in order to recall setup files, acquisition data files,
or trace files.
2
Save
Opens the Save As dialog in order to save setup files, pictures (screen
captures), acquisition data files, or export measurement settings.
3
Undo/Redo
Undoes or redoes the previous edit to a display or measurement settings, a
preset, or a measurement change.
4
Displays
Opens the Select Displays dialog box so that you can select measurement
displays.
5
Markers
Opens or closes the Marker toolbar at the bottom of the window.
6
Settings
Opens the Settings control panel for the selected display. Each display has
its own control panel.
7
Acquisition
Opens the Acquisition control panel, which displays the Sample Rate and
Record length of the recalled waveform file.
8
Analysis
Opens the Analysis control panel so that you can define the analysis settings
such as frequency, analysis time, and units.
9
Amplitude
Opens the Amplitude control panel so that you can specify external gain/loss
corrections.
10
Center Frequency
Displays the Center Frequency. To change the value, click the text and enter the
frequency with a keyboard. For fine adjustments, you can use the mouse wheel.
11
Reference Level
Displays the reference level. To change the value, click the text and enter a
number using a keyboard, or use a mouse scroll wheel.
12
Connection
Indicates the connection status of an MDO4000B with Live Link.
13
Presets
Recalls the Main (see page 13) preset.
14
Replay
Runs a new measurement cycle on the existing acquisition data record using
any new settings.
15
Trigger
Opens the Trigger control panel so that you can define the RSA306 trigger
settings.
16
Audio
Opens the Audio control panel so that you can define the audio demodulation
settings for the RSA306.
xxx
SignalVu-PC Printable Help
11
Orientation
12
Elements of the Display
SignalVu-PC Printable Help
Using SignalVu-PC
Restoring Default Settings
Restoring Default Settings
To restore the software to its factory default settings:
1. Select Presets > Preset Options.
2. In the Presets tab of the Options control panel, click to the view the Preset type drop down menu
and select Main.
3. Click to the view the Presets drop down menu and select Original.
4. Click the red X icon in the top right corner of the Options control panel to close the panel.
5. Select Presets > Main from the menu bar to return the software to its original factory default settings.
NOTE. You can also click the Preset button on the right-hand side of the menu bar to load the Main preset.
NOTE. The Original Main preset resets all settings and clears all acquisition data (previously recalled
waveform files). Settings that have not been saved will be lost.
Presets
Menu Bar: Presets
SignalVu-PC includes a set of configurations or presets that are tailored to specific applications or types of
analysis. These configurations, referred to as Presets, open selected displays and load settings that are
optimized to address specific application requirements.
Available Presets
Select Presets from the menu bar to access the types of factory presets: Main, Standards, and Application.
(DPX is added when connected to an RSA306 spectrum analyzer.) In addition to these factory defined
presets, you can create your own presets, called User presets. All of these presets types and their subtypes
are described in the following table.
SignalVu-PC Printable Help
13
Using SignalVu-PC
Preset
Presets
Description
Main
Current
This Preset sets the instrument to display a Spectrum display with settings appropriate
for typical spectrum analysis tasks.
Original (see page 13)
This Preset is the original factory preset used with your original SignalVu-PC software.
This version of the factory preset is included to allow you to maintain compatibility with
existing remote control software.
DPX
Open the DPX display
The Open the DPX display opens the DPX display without closing existing displays.
Swept
The DPX Swept Preset displays the DPX Spectrum display with the span set to maximum
and the center frequency set to 1/2 the span.
Real Time
The DPX Real Time Preset displays the DPX Spectrum display with the center frequency
set to 1.5 GHz and the span set to the maximum available real-time bandwidth.
Standards
WLAN (see page 169)
This preset sets the instrument to display the WLAN Summary, WLAN Constellation, and
SEM displays. After you select the standards and bandwidth, the software configures
these displays to apply the parameters appropriate for typical WLAN analysis tasks.
P25 (see page 249)
This preset sets the instrument to display the P25 MCPR, Summary, P25 Constellation,
and Time Overview displays. After you select the standard and modulation type, the
software configures these displays to apply the parameters appropriate for typical P25
analysis tasks.
Application
Modulation Analysis (see
page 15)
The Modulation Analysis setup application preset provides you with the most common
displays used during modulation analysis. Only present when Option 21 is installed.
Pulse Analysis (see
page 16)
The Pulse Analysis application preset provides you with the most common displays
used during pulse analysis, and makes changes to the default parameters to settings
better optimized for pulsed signal analysis.
Time-Frequency Analysis
(see page 17)
The Time-Frequency preset configures the instrument with settings suited to analyzing
signal behavior over time.
Spectrum Analysis (see
page 17)
The Spectrum Analysis application preset provide you with the settings commonly used
for general purpose spectrum analysis.
Spur Search Multi Zone
9k-1GHz (see page 18)
The Spur Search application preset sets the instrument to display all spurs that exceed
the Threshold and Excursion values for the entire 9 k through 1 GHz range.
User (see page 15)
Setting the type to User displays Presets you have created. Initially, this field contains the following presets:
User Preset 1
This preset sets the instrument to show these displays: Frequency vs Time, Time
Overview, Spectrogram, and Spectrum.
User Preset 2
This preset sets the instrument to show the Spurious display.
xxx
Preset Options
Select the Presets > Preset Options menu to open the Options control panel. This panel does the
following. Once you have chosen these settings, you can access any preset or list of presets from Presets
on the menu bar.
14
SignalVu-PC Printable Help
Using SignalVu-PC
Presets
Preset type: Select the Preset type.
Presets: Select which preset you want to display for that particular preset type.
Preset action: Recalling Presets results in either of two actions. One action is to immediately execute
a Preset. The second action displays a list of Presets from which you select the Preset you want to
recall. You can select from Recall selected preset or Show list.
Recalling a Preset
To recall a preset, select Presets and then the desired preset type.
NOTE. You can set which presets to recall from the Presets > Preset Options (see page 14) control panel.
NOTE. You can also click the Preset button on the right-hand side of the menu bar to load the Main preset.
Creating User Presets
You can add your own user presets to the list that appears in the User Presets dialog box. Create a Setup
file and save a copy of it to C:\SignalVu-PC Files\User Presets. The name you give the file will be shown
in the User Presets list. For instructions on how to save a Setup file, see Saving Data (see page 403).
Standards Presets
The Standards presets allow you to recall preconfigured displays for the standards that you select. You
can select from the following standards groups.
Application Preset: Modulation Analysis
The Modulation Analysis application preset opens the following displays:
DPX display: Shows you a continuous spectrum monitoring of the specified carrier frequency.
Signal Quality: Shows a summary of modulation quality measurements (EVM, rho, Magnitude
Error, Phase Error, and others).
Constellation: Shows the I and Q information of the signal analyzed in an I vs Q format.
Symbol Table: Shows the demodulated symbols of the signal.
To use the Modulation Analysis preset (assuming the Preset action is set to Show list in the Presets tab
of the Options control panel):
SignalVu-PC Printable Help
15
Using SignalVu-PC
Presets
1. Select Presets > Application. Select Modulation Analysis and then click OK.
2. Set the reference level so that the peak of your signal is about 10 dB below the top of the DPX display.
3. Set the modulation parameters for your signal. This includes the Modulation Type, Symbol Rate,
Measurement Filter, Reference Filter, and Filter Parameter. All of these settings are accessed by
selecting Tools > Settings.
For most modulated signals, the Modulation Analysis application preset should present a stable display of
modulation quality. Additional displays can be added by selecting Setup > Displays, and other settings
can be modified to better align with your signal requirements.
Application Preset: Pulse Analysis
The Pulse Analysis application preset opens the following displays:
DPX: The DPX display is opened with the maximum available span.
Time Overview: Shows amplitude vs. time over the analysis period.
Pulse Table: This shows a full report for the user-selected pulse measurements.
Pulse Trace: Shows the trace of the selected pulse and a readout of the selected measurement from
the pulse table.
You can make a selected pulse and measurement appear in the Pulse Trace display by highlighting it in the
Pulse Measurement Table. Key pulse-related parameters that are set by the Pulse Analysis application
preset are:
Measurement Filter: No Filter-Max BW
Measurement Bandwidth: This is set to the maximum real-time bandwidth of the instrument.
NOTE. The label on the “Measurement Bandwidth” setting is just “Bandwidth”. Like the main instrument
Preset command and the other application presets, the Pulse Analysis application preset also sets most
other instrument controls to default values.
Power threshold to detect pulses: This is set to –10 dBc.
Minimum OFF time between pulses: This is set to 400.000 ns o ensure a good probability of catching
several pulses for typical signals.
Max number of pulses: Check this box to limit the number of pulses to measure.
To use the Pulse Analysis preset (assuming the Preset action is set to Show list in the Presets tab of the
Options control panel):
1. Select Presets > Application. Select Pulse Analysis and then click OK.
2. Set the Center Frequency control to the carrier frequency of your pulsed signal.
3. Set the Reference Level to place the peak of the pulse signal approximately 0-10 dB down from
the top of the Time Overview display.
16
SignalVu-PC Printable Help
Using SignalVu-PC
Presets
You may need to trigger on the signal to get a more stable display. This is set up in the Trigger control
panel. (“Trig” button). Using the Power trigger type with the RF Input source works well for many
pulsed signals.
4. Set the Analysis Period to cover the number of pulses in your signal that you want to analyze. To do
this, click in the data entry field of the Time Overview window and set the analysis length as needed.
Application Preset: Spectrum Analysis
The Spectrum Analysis application preset opens a Spectrum display and sets several parameters. The
Spectrum Analysis preset sets the analyzer as follows.
Spectrum Analysis : Sets the frequency range to maximum for the analyzer, and sets the RF/IF
optimization to Minimize Sweep Time.
To use the Spectrum Analysis preset (assuming the Preset action is set to Show list in the Presets tab
of the Options control panel):
1. Select Presets > Application. Select Spectrum Analysis and then click OK.
2. Set the measurement frequency using the front-panel knob or keypad.
3. Adjust the span to show the necessary detail.
Application Preset: Time-Frequency Analysis
The Time-Frequency Analysis application preset opens the following displays:
Time Overview: Shows a time-domain view of the analysis time ‘window’.
Spectrogram: Shows a three-dimensional view of the signal where the X-axis represents frequency,
the Y-axis represents time, and color represents amplitude.
Frequency vs. Time: This display's graph plots changes in frequency over time and allows you to
make marker measurements of settling times, frequency hops, and other frequency transients.
Spectrum: Shows a spectrum view of the signal. The only trace showing in the Spectrum graph
after selecting the Time-Frequency Analysis preset is the Spectrogram trace. This is the trace from
the Spectrogram display that is selected by the active marker. Stop acquisitions with the Run button
because its easier to work with stable results. In the Spectrogram display, move a marker up or down
to see the spectrum trace at various points in time.
The analysis period (scale) is set to 5 ms.
To use the Time-Frequency Analysis preset (assuming that Time-Frequency Analysis is the selected preset
on the list of Application Presets and Preset action is set to Recall selected preset):
1. Select Presets > Application. Select Time-Frequency Analysis and then click OK.
2. When the preset's displays and settings have all been recalled and acquisitions are running, adjust the
center frequency and span to capture the signal of interest.
SignalVu-PC Printable Help
17
Using SignalVu-PC
Settings Options
3. Set the Reference Level to place the peak of the signal approximately 0-10 dB down from the top of
the Spectrum graph.
4. If the signal is transient in nature, you might need to set a trigger to capture it. You will need to use
an oscilloscope triggering function to capture the signal. (Option CON with Live Link required to
connect to an MDO4000B.)
When the signal has been captured, the spectrogram shows an overview of frequency and amplitude
changes over time. To see frequency transients in greater detail, use the Frequency vs. Time display.
The Time-Frequency Analysis preset sets the analysis period to 5 ms. The Spectrum Span is 40 MHz. The
RBW automatically selected for this Span is 300 kHz. For a 300 kHz RBW, the amount of data needed for
a single spectrum transform is 7.46 μs. A 5 ms Analysis Length yields 671 individual spectrum transforms,
each one forming one trace for the Spectrogram to display as horizontal colored lines. This preset scales
the Spectrogram time axis (vertical axis) to -2, which means that the Spectrogram has done two levels of
time compression, resulting in one visible line for each four transforms. This results in 167 lines in the
Spectrogram for each acquisition, each covering 29.84 μs.
Application Preset: Spur Search Multi Zone 9k-1GHz
The Spur Search Multi Zone 9k-1GHz application preset opens the Spurious display, which is set to
display all spurs that exceed the Threshold and Excursion values for the entire 9 k through 1 GHz range.
To use the Spur Search Multi Zone 9k-1GHz preset (assuming that Preset action is set to Recall selected
preset):
1. Select Presets > Application. Select Spur Search Multi Zone 9k-1GHz and then click OK.
2. Click Setup > Settings when the preset's display and settings have all been recalled and acquisitions
are running.
3. Select the Ranges and Limits tab in the Spurious Settings control panel to view the spur information.
You can click the Expand button to view the table in a separate window.
NOTE. You can read more about the Spurious display and its various parameters and settings in the RF
Measurements section.
Settings Options
Menu Bar: Tools > Options
There are several settings you can change that are not related to measurement functions. The Option
settings control panel is used to change these settings.
18
SignalVu-PC Printable Help
Using SignalVu-PC
Settings Options
Settings tab
Description
Presets
Use this tab to configure Presets. You can select Presets and specify the action to
take when a preset is recalled.
Analysis Time
Use this tab to specify the method used to automatically set the analysis and spectrum
offsets when the Time Zero Reference (see page 377) is set to Trigger.
Save and Export
Use this tab to specify whether or not save files are named automatically and what
information is saved in acquisition data files.
Security
Selecting the Hide Sensitive readouts check box causes the instrument to replace
measurement readouts with a string of asterisks.
Prefs
Use this tab to select different color schemes for the measurement graphs and specify
how markers should react when dragged.
xxx
Presets
The Presets tab in the Options control panel allows you to specify actions taken when you press the Preset
button. You can read more about this tab here .
Analysis Time
The Analysis Time tab in the Options control panel is used to specify the method used to automatically set
the analysis and spectrum offsets when the Time Zero Reference (see page 377) is set to Trigger. The
available settings are:
Include trigger point – Selects an algorithm that uses the measurements to determine how far in
advance of the trigger to set the analysis offset. The analyzer tries to ensure that data about the trigger
point is included in the analyses.
Start at trigger point (legacy) – The method used by the instrument in prior versions, which sets the
Analysis Offset to zero when possible. The analyzer tries to ensure that data following the trigger
point is included in the analyses. Use this method if your measurements or procedures depend on past
behavior of the Auto Analysis Offset function.
Save and Export
The Save and Export tab allows you to specify whether or not files are saved with an automatically
generated name, and how much data is saved in an acquisition data file.
All files. The Automatically increment filename/number function can automatically name saved files by
appending a number to a base file name. Use this tab to enable/disable automatic naming of files. For
SignalVu-PC Printable Help
19
Using SignalVu-PC
Connectivity
example, if Automatically Increment Filename Number is disabled, when you select Save from the File
menu, you will have to enter a name for the file.
Acquisition data files. This setting specifies whether saved data files include the entire acquisition record
or only the data for the analysis length (a subset of the acquisition record).
TIQ acquisition data files. Specifies which data records to save. You can choose from the following:
Current acquisition: Saves the current acquisition.
Current frame: If Fast Frame is enabled, saves only the current frame. The current frame is the
one most recently analyzed.
Selected frames: If Fast Frame is enabled, saves the specified frames.
All in history: Saves all acquisition records in the history.
Save TIQ file now: Invokes the Save As dialog box with the Save as type drop-down list set to TIQ.
Security
The Security tab enables you to hide sensitive readouts in displays with readouts, such as the OFDM
Summary display.
Prefs
The Prefs tab enables you to set properties that apply to all displays.
Connectivity
Live Link allows you to connect your PC (with SignalVu-PC installed) to the following instruments:
MDO4000B Series instrument via USB, wireless, or LAN (Option CON for SignalVu-PC required)
RSA306 Spectrum Analyzer via USB 3.0
Connecting to an RSA306 Spectrum Analyzer
USB3 connection. To establish a Live Link connection using USB, perform the following procedures in
the order given.
1. Power on the PC and wait until the PC has fully completed its start-up cycle.
2. Connect a USB 3.0 cable from the PC to the RSA306.
After the USB cable is connected, the RSA306 starts its boot up cycle. The indicator light turns green
when the RSA306 is ready for use.
20
SignalVu-PC Printable Help
Using SignalVu-PC
Connectivity
NOTE. Your PC may notify you that it has found a new USB device and has loaded the device drivers. If
you see these notifications, wait until the drivers are loaded before continuing to the next step.
3. Double click the SignalVu-PC icon on the Desktop to start the application.
NOTE. The signalVu-PC software version must be at or above the version provided with the RSA306. The
latest version of software is available from the Tektronix web site www.tektronix.com/downloads .
4. Click Live Link on the menu bar to view the drop down menu.
NOTE. See Elements of the Display (see page 9) for information about menus and toolbars.
5. Select Connect To Instrument. You should see the USB connected to the RSA306 in the Connect To
Instrument list.
NOTE. If the PC is currently connected to another instrument, that connection will also show in the
Connect To Instrument list. You must select Disconnect From Instrument to end that connection before
connecting to the newly found instrument.
6. Select the RSA306 instrument.
7. A Connect Status dialog box will appear to confirm the instrument is connected.
NOTE. You can quickly verify connection status by looking at the Connection indicator square on the
menu bar. It is green ( ) when an instrument is connected. It is red ( ) when it is not. You can also view
the name of the instrument that is connected by hovering the mouse indicator over the .
8. Connect a DUT (device under test) to the RSA306.
9. Use SignalVu-PC to configure the RSA306.
NOTE. Press F1 on your keyboard to open the SignalVu-PC help for information about configuring
and using the application. You can also click on Help > User Manual in the SignalVu-PC menu bar
to open the help.
10. When you want to connect to a different instrument, select Disconnect From Instrument to end
the current connection.
SignalVu-PC Printable Help
21
Using SignalVu-PC
Connectivity
Connecting to an MDO4000B Series instrument
NOTE. You can watch a video tutorial about using Live Link (Option CON) to connect to an MDO4000B
Series instrument and about WLAN Presets at www.youtube.com/user/tektronix. Learn more about the
Tektronix YouTube channel here (see page 4).
USB connection. To establish a Live Link connection using USB, perform the following procedures in
the order given.
1. Check that the MDO4000B is on.
2. Connect a USB cable to the MDO.
3. Connect the other end of that USB cable to the PC.
NOTE. Your PC may notify you that it has found a new USB device and has loaded the device drivers. If
you see these notifications, wait until the drivers are loaded before continuing to the next step.
4. Double click the SignalVu-PC icon on the Desktop to start the application.
5. Click Live Link on the menu bar to view the drop down menu.
NOTE. See Elements of the Display (see page 9) for information about menus and toolbars.
6. Select Connect To Instrument. You should see the USB connected MDO in the Connect To
Instrument list.
NOTE. If the PC is currently connected by LAN or USB to another MDO4000B, that connection will
also show in the Connect To Instrument list. You must select Disconnect From Instrument to end that
connection before connecting to the newly found instrument.
7. If you do not see the USB MDO, click Search for Instrument. TekVISA is now searching for
instruments. A notification will briefly appear stating that the instrument was found. Check that the
newly found instrument now appears in the Connect To Instrument list.
8. Select the instrument.
9. A Connect Status dialog box will appear to confirm the instrument is connected.
NOTE. You can quickly verify connection status by looking at the Connection indicator square on the
menu bar. It is green ( ) when an instrument is connected. It is red ( ) when it is not. You can also view
the name of the instrument that is connected by hovering the mouse indicator over the .
22
SignalVu-PC Printable Help
Using SignalVu-PC
Connectivity
10. Connect a DUT (device under test) to the MDO.
11. Use SignalVu-PC to configure the MDO. Frequency, Amplitude, Span, Bandwidth, and Time Scaling
parameters for the RF channels can only be changed using SignalVu-PC.
NOTE. Press F1 on your keyboard to open the SignalVu-PC help for information about configuring
and using the application. You can also click on Help > User Manual in the SignalVu-PC menu bar
to open the help.
12. When you are ready to connect to a different instrument, select Disconnect From Instrument to first
end the current connection.
NOTE. For more search options using TekVISA, go to the Visa Resource Manager (double click in the
applications tray).
SignalVu-PC Printable Help
23
Using SignalVu-PC
Connectivity
LAN or wireles connection. To establish a Live Link connection using a LAN or wireless connection,
perform the following procedures in the order given.
1. Check that the PC has a working LAN or wireless network connection.
2. Use an Ethernet cable to connect the MDO to the network.
3. Check that the MDO is on and wait for the IP Address to display on the screen. Write down the IP
address to help you identify the MDO in the SignalVu-PC application.
4. Double click the SignalVu-PC icon on the Desktop to start the application.
5. Click Live Link on the menu bar to view the drop down menu.
NOTE. See Elements of the Display (see page 9) for information about menus and toolbars.
6. Select Search For Instrument. TekVISA is now searching for instruments.
7. A notification will briefly appear stating that the instrument was found. Check that the newly found
instrument now appears in the Connect To Instrument list and then click on the instrument name
to connect.
NOTE. If the PC is currently connected by LAN/wireless or USB to another MDO4000B, that connection
will also show in the Connect To Instrument list. You must select Disconnect From Instrument to end that
connection before connecting to the newly found instrument.
8. If you do not see the LAN address of the MDO, click Manually Search for LAN Instrument. You
will then need to enter the IP address of the MDO into the IP Address dialog box and click Connect.
9. A Connect Status dialog box will appear to confirm the instrument is connected.
NOTE. You can quickly verify connection status by looking at the Connection indicator square on the
menu bar. It is green ( ) when an instrument is connected. It is red ( ) when it is not. You can also view
the name of the instrument that is connected by hovering the mouse indicator over the .
10. Connect a DUT (device under test) to the MDO.
11. Use SignalVu-PC to configure the MDO. Frequency, Amplitude, Span, Bandwidth, and Time Scaling
parameters for the RF channels can only be changed using SignalVu-PC.
NOTE. Press F1 on your keyboard to open the SignalVu-PC help for information about configuring
and using the application. You can also click on Help > User Manual in the SignalVu-PC menu bar
to open the help.
12. When you are ready to connect to a different instrument, select Disconnect From Instrument to first
end the current connection.
24
SignalVu-PC Printable Help
Using SignalVu-PC
Connectivity
NOTE. For more search options using TekVISA, go to the Visa Resource Manager (double click in the
applications tray).
SignalVu-PC Printable Help
25
Using SignalVu-PC
26
Connectivity
SignalVu-PC Printable Help
Using the Measurement Displays
Selecting Displays
Selecting Displays
Menu Bar: Setup > Displays
Application Toolbar:
Use the Select Displays dialog to choose the displays that appear on the screen.
To select displays:
1. Select Setup > Displays or click the displays icon.
2. Select one of the choices under Measurements. The measurement chosen determines the choices
available in Available displays.
3. Double-click the desired display in the Available displays box or select the desired display and
click Add.
4. Click OK.
SignalVu-PC Printable Help
27
Using the Measurement Displays
28
Selecting Displays
SignalVu-PC Printable Help
Taking Measurements
Available Measurements
Available Measurements
The automatic measurements available include RF power measurements, OFDM analysis, WLAN
analysis, APCO P25 analysis, audio analysis, analog modulation measurements, digital modulation
measurements, and pulsed RF measurements.
Power measurements
Measurement
Description
Channel Power
The total RF power in the selected channel (located in the Chan Pwr and ACPR display).
Adjacent Channel Power Ratio
(ACPR)
Measure of the signal power leaking from the main channel into adjacent channels.
Multi-Carrier Power Ratio
(MCPR)
The ratio of the signal power in the reference channel or group of channels to the power
in adjacent channels.
Peak/Avg Ratio
Ratio of the peak power in the transmitted signal to the average power in the transmitted
signal (located in the CCDF display).
CCDF
The Complementary Cumulative Distribution Function (CCDF). CCDF shows how much
time a signal spends at or above a given power level relative to the average power of
a measured signal.
xxx
OFDM analysis
Measurement
Description
Channel Response
Plots the channel response (magnitude or phase) versus the subcarrier or frequency.
Here, the channel refers to all sources of signal frequency response impairment up to
the analyzer input, including the transmitter itself, as well as any transmission medium
through which the signal travels between the transmitter and the analyzer.
Constellation
Measure of the signal power leaking from the main channel into adjacent channels.
EVM
The normalized RMS value of the error vector between the measured signal and the ideal
reference signal over the analysis length. The EVM is generally measured on symbol or
chip instants and is reported in units of percent and dB. EVM is usually measured after
best-fit estimates of the frequency error and a fixed phase offset have been removed.
These estimates are made over the analysis length. Displays RMS and Peak values with
location of Peak value.
Flatness
Ratio of the peak power in the transmitted signal to the average power in the transmitted
signal
Mag Error
The RMS magnitude difference between the measured signal and the reference signal
magnitude. Displays RMS and Peak values with location of Peak value.
Phase Error
The RMS phase difference between the measured signal and the ideal reference signal.
Displays RMS and Peak values with location of Peak value.
Power
shows the data symbols' individual subcarrier Power values versus symbol interval (time)
and subcarrier (frequency).
xxx
SignalVu-PC Printable Help
29
Taking Measurements
Available Measurements
WLAN measurements
Measurement
Description
Channel Response
Plots the channel response (magnitude or phase) versus the subcarrier or frequency.
Here, the channel refers to all sources of signal frequency response impairment up to
the analyzer input, including the transmitter itself, as well as any transmission medium
through which the signal travels between the transmitter and the analyzer.
Constellation
Measure of the signal power leaking from the main channel into adjacent channels.
EVM
The normalized RMS value of the error vector between the measured signal and the ideal
reference signal over the analysis length. The EVM is generally measured on symbol or
chip instants and is reported in units of percent and dB. EVM is usually measured after
best-fit estimates of the frequency error and a fixed phase offset have been removed.
These estimates are made over the analysis length. Displays RMS and Peak values with
location of Peak value.
Flatness
Ratio of the peak power in the transmitted signal to the average power in the transmitted
signal
Mag Error
The RMS magnitude difference between the measured signal and the reference signal
magnitude. Displays RMS and Peak values with location of Peak value.
Phase Error
The RMS phase difference between the measured signal and the ideal reference signal.
Displays RMS and Peak values with location of Peak value.
Power vs Time
The signal power amplitude versus time. For 802.11b signals, the packet Power-On and
Power-Down ramp times are also measured.
Summary
Shows several measurements of WLAN signal quality.
Symbol Table
Shows decoded data values for each data symbol in the analyzed signal packet. For
OFDM (non-802.11b) signals, results are presented with subcarrier (frequency) indices
in the horizontal dimension and symbol (time) intervals in the vertical dimension. For
802.11b signals, the Preamble, Header, and Data (PSDU) symbol values are presented
sequentially, with symbol indices in the left column.
xxx
xxx
30
SignalVu-PC Printable Help
Taking Measurements
Available Measurements
Digital Modulation measurements
Measurements for all modulation types except nFSK, C4FM, OQPSK and SOQPSK
Measurement
Description
EVM
The normalized RMS value of the error vector between the measured signal and the ideal
reference signal over the analysis length. The EVM is generally measured on symbol or
chip instants and is reported in units of percent and dB. EVM is usually measured after
best-fit estimates of the frequency error and a fixed phase offset have been removed.
These estimates are made over the analysis length. Displays RMS and Peak values with
location of Peak value.
Phase Error
The RMS phase difference between the measured signal and the ideal reference signal.
Displays RMS and Peak values with location of Peak value.
Mag Error
The RMS magnitude difference between the measured signal and the reference signal
magnitude. Displays RMS and Peak values with location of Peak value.
MER (RMS)
The MER is defined as the ratio of I/Q signal power to I/Q noise power; the result is
indicated in dB.
IQ Origin Offset
The magnitude of the DC offset of the signal measured at the symbol times. It indicates
the magnitude of the carrier feed-through signal.
Frequency Error
The frequency difference between the measured carrier frequency of the signal and the
user-selected center frequency of the instrument.
Gain Imbalance
The gain difference between the I and Q channels in the signal generation path.
Constellations with gain imbalance show a pattern with a width that is different form
height.
Quadrature Error
The orthogonal error between the I and Q channels. The error shows the phase
difference between I and Q channels away from the ideal 90 degrees expected from the
perfect I/Q modulation. Not valid for BPSK modulation type.
Rho
The normalized correlated power of the measured signal and the ideal reference signal.
Like EVM, Rho is a measure of modulation quality. The value of Rho is less than 1 in all
practical cases and is equal to 1 for a perfect signal measured in a perfect receiver.
xxx
SignalVu-PC Printable Help
31
Taking Measurements
Available Measurements
Measurements for OQPSK and SOQPSK modulation types
Measurement
Description
EVM
The normalized RMS value of the error vector between the measured signal and the ideal
reference signal over the analysis length. The EVM is generally measured on symbol or
chip instants and is reported in units of percent and dB. EVM is usually measured after
best-fit estimates of the frequency error and a fixed phase offset have been removed.
These estimates are made over the analysis length. Displays RMS and Peak values with
location of Peak value.
Offset EVM
Offset EVM is like EVM except for a difference in the time alignment of the I and Q
samples. For EVM, I and Q samples are collected at the same time, for every symbol
decision point (twice the symbol rate for offset modulations). For Offset EVM, the I and Q
symbol decision points are time-aligned before collecting the I and Q samples. In this
case, one I and one Q sample is collected for each symbol (half as many samples as the
same number of symbols for (non-offset) EVM.
Phase Error
The RMS phase difference between the measured signal and the ideal reference signal.
Displays RMS and Peak values with location of Peak value.
Mag Error
The RMS magnitude difference between the measured signal and the reference signal
magnitude. Displays RMS and Peak values with location of Peak value.
MER (RMS)
The MER is defined as the ratio of I/Q signal power to I/Q noise power; the result is
indicated in dB.
IQ Origin Offset
The magnitude of the DC offset of the signal measured at the symbol times. It indicates
the magnitude of the carrier feed-through signal.
Frequency Error
The frequency difference between the measured carrier frequency of the signal and the
user-selected center frequency of the instrument.
Gain Imbalance
The gain difference between the I and Q channels in the signal generation path.
Constellations with gain imbalance show a pattern with a width that is different form
height.
Quadrature Error
The orthogonal error between the I and Q channels. The error shows the phase
difference between I and Q channels away from the ideal 90 degrees expected from the
perfect I/Q modulation. Not valid for BPSK modulation type.
Rho
The normalized correlated power of the measured signal and the ideal reference signal.
Like EVM, Rho is a measure of modulation quality. The value of Rho is less than 1 in all
practical cases and is equal to 1 for a perfect signal measured in a perfect receiver.
xxx
32
SignalVu-PC Printable Help
Taking Measurements
Available Measurements
Measurements for nFSK modulation types
Measurement
Description
Peak FSK err
Peak value of the frequency deviation error at the symbol point.
RMS FSK Err
RMS value of the frequency deviation error at the symbol point.
Peak Mag Err
The Peak magnitude difference between the measured signal and the reference signal
magnitude.
RMS Mag Err
The RMS magnitude difference between the measured signal and the reference signal
magnitude.
Freq Error
The frequency difference between the measured carrier frequency of the signal and the
user-selected center frequency of the instrument.
Freq Deviation
Frequency distance from the center frequency at the symbol point.
Symbol Rate Error
This compares the user-entered symbol rate to the instrument calculated symbol rate of
the analyzed signal.
Symbol Rate
When in Auto-symbol rate, the instrument calculates the symbol rate of the signal and
the instrument calculates the error between the user entered value and the instrument
calculated value.
xxx
Measurements for C4FM modulation type
Measurement
Description
RMS Error Magnitude
RMS value of the frequency deviation error at the symbol point.
Carrier Frequency Error
Frequency difference between averaged signal frequency and the center frequency.
Deviation
Frequency distance from the center frequency at the symbol point.
Length
Number of symbols in the analysis area.
xxx
Analog Modulation measurements
Measurements for AM modulation
Measurement
Description
+AM
Positive peak AM value.
-AM
Negative peak AM value.
Total AM
Total AM value, which is equal to the peak-peak AM value divided by 2.
xxx
Measurements for FM modulation
Measurement
Description
+Pk
Positive peak frequency deviation.
–Pk
Negative peak frequency deviation.
RMS
RMS value of the frequency deviation.
Pk-Pk/2
Peak-to-peak frequency deviation divided by 2.
Pk-Pk
Peak-to-peak frequency deviation.
xxx
SignalVu-PC Printable Help
33
Taking Measurements
Available Measurements
Measurements for PM modulation
Measurement
Description
+Pk
Positive peak phase deviation.
–Pk
Negative peak phase deviation.
RMS
RMS value of the phase deviation.
Pk-Pk
Peak-to-peak phase deviation.
xxx
APCO P25 measurements
Measurement
Description
MCPR
The Reference Power and the ratio of each adjacent channel to the Reference Power.
You can select whether the Reference Power is the total of all active channels or a
single channel.
Constellation
Measure of the signal power leaking from the main channel into adjacent channels.
Eye Diagram
The digitally modulated signal overlapped on itself to reveal variations in the signal.
Time Overview
The entire acquisition record and how the spectrum time and analysis time fit within the
acquisition record.
Freq Dev vs Time
Measures the deviation of the measured frequency of the modulated signal with the
ideal frequency over time.
Power vs Time
Measures the signal power amplitude over time.
Summary
Shows several measurements of P25 signal quality.
Symbol Table
Shows decoded data values for each data symbol in the analyzed signal packet. Results
are presented with subcarrier (frequency) indices in the horizontal dimension and symbol
(time) intervals in the vertical dimension.
xxx
Pulse measurements
34
Measurement
Description
Average ON Power
The average power transmitted during pulse on.
Peak Power
Maximum power during pulse on.
Average Transmitted Power
The average power transmitted, including both the time the pulse is on and the time
it is off, and all transition times.
Pulse Width
The time from the rising edge to the falling edge at the –3 dB / –6 dB level (50%) of the
user selected 100% level. Level is user selectable for Volts or Watts.
Rise Time
The time required for a signal to rise from 10% to 90% (or 20% to 80%) of the user
selected 100% level.
Fall Time
The time required for a signal to fall from 90% to 10% (or 80% to 20%) of the user
selected 100% level.
Repetition Interval
The time from a pulse rising edge to the next pulse rising edge.
Repetition Rate
The inverse of repetition interval.
Duty Factor (%)
The ratio of the width to the pulse period, expressed as a percentage.
Duty Factor (Ratio)
The ratio of the pulse width to the pulse period.
SignalVu-PC Printable Help
Taking Measurements
Available Measurements
Measurement
Description
Ripple
Ripple is the peak-to-peak ripple on the pulse top. It does not include any preshoot,
overshoot, or undershoot. By default, the first 25% and the last 25% of the pulse top is
excluded from this measurement to eliminate distortions caused by these portions of
the pulse.
If the Amplitude units selected in the Amplitude panel (affects all amplitude measurements
for the analyzer) are linear, the Ripple results will be in %Volts. For log units, the Ripple
results will be in %Watts. The default for the general Units control is dBm, so the Ripple
results default is %Watts.
See also Ripple (see page 452).
Ripple dB
The Ripple measurement expressed in dB.
Droop
Droop is the power difference between the beginning and the end of the pulse On time. A
straight-line best fit is used to represent the top of the pulse. The result is a percentage
referenced to the Average ON Power.
Droop dB
The Droop measurement expressed in dB.
Overshoot
The amount by which the signal exceeds the 100% level on the pulse rising edge. Units
are %Watts or %Volts.
Overshoot dB
The Overshoot measurement expressed in dB.
Pulse-Pulse Phase Difference
The phase difference between the selected pulse and the first pulse in the analysis
window. The instantaneous phase is measured at a user-adjustable time following the
rising edge of each pulse.
Pulse-Pulse Freq Difference
The difference between the frequency of the current pulse and frequency of the previous
pulse. The instantaneous frequency is measured at a user-adjustable time following the
rising edge of each pulse.
RMS Freq Error
The RMS Frequency Error measurement is the RMS average of the Freq Error vs. Time
trace, computed over the Measurement Time.
Max Freq Error
The maximum frequency error is the difference between the measured carrier frequency
of the signal and the user-selected center frequency of the analyzer.
RMS Phase Error
The RMS Phase Error measurement is the RMS average of the Phase vs Time trace,
computed over the Measurement Time.
Max Phase Error
The phase is measured at each point during the pulse's ON time. The phase error for
each point is the difference between the measured phase value and the calculated ideal
phase value. After the phase error is calculated for all points in the acquisition record,
the largest error in the positive direction and the largest in the negative direction are
determined. Whichever of these two values has the greater absolute value is designated
the Max Phase Error.
Freq Deviation
The Frequency Deviation measurement is the difference between the maximum and
minimum measured values of the signal frequency during the Measurement Time.
SignalVu-PC Printable Help
35
Taking Measurements
Available Measurements
Measurement
Description
Delta Frequency (Non-chirped
pulse)
The Delta Frequency measurement is the difference from the measurement frequency
to each pulse frequency. Pulse frequency is calculated across the time defined by the
Frequency Domain Linearity setting in the Define tab.
The measurement is available for modulation types CW (Constant Phase), CW
(Changing phase). and Other (manual) setting in the Freq Estimation tab.
The measurement is not specified for chirp or other signals and no answer is returned
when frequency estimation is set to Chirp.
If frequency estimation is set to Other, then Frequency Offset must be set to 0 Hz and the
Range can be set to ±40% of the acquisition bandwidth.
A least-square fit of slope of phase vs. time over the measurement period is used for the
measurement of the individual pulse frequency. Frequency difference is calculated as the
difference between the reference frequency and the calculated frequency of the pulse.
Phase Deviation
The Phase Deviation is the difference between the maximum and minimum Phase values
measured during the ON time of a pulse.
Impulse Response Amplitude
The difference in dB between the levels of the main lobe and highest side lobe.
Impulse Response Time
The difference in time between the main lobe and highest side lobe.
Time
This is the time in seconds relative to the time reference point in the first acquisition
record in the data set.
xxx
36
SignalVu-PC Printable Help
General Signal Viewing
Overview
Overview
The displays in General Signal Viewing (Displays > Measurements > General Signal Viewing) are:
Amplitude vs Time
DPX Spectrum
Frequency vs Time
Phase vs Time
RF I & Q vs Time
Spectrogram
Spectrum
Time Overview
These displays provide extensive time-correlated multi-domain views that connect problems in time,
frequency, phase and amplitude for enabling you to more quickly understand cause and effect when
troubleshooting.
DPX Display Overview
The DPX display enables you to see how traces change over time and thus displays signal events that
cannot be seen on a swept spectrum analyzer. A DPX Spectrum indicates how traces change in two ways.
First, it uses color shading to show how consistent the shape of a trace is. Second, it uses persistence to
hold signals on the screen so you can see them longer.
DPX Display
The DPX display works by using a two-dimensional array to represent points on the display. Each time a
trace writes to a point on the display, a counter in the array is incremented. A color is assigned to each point
in the display based on the value of its counter. Thus, as acquisitions occur over time, a colored waveform,
the Bitmap, develops on the display that shows how frequently each display point has been written to.
An important feature of the DPX display is dot persistence. Dot persistence sets how long a point on the
display will be visible. You can set the Dot Persistence to be Variable or Infinite. In variable persistence
mode, you specify a decay period that limits how long a point will be displayed. In infinite persistence
mode, once a point in the display has been written to, it will remain visible indefinitely.
The DPX display can plot the trace in the following views:
SignalVu-PC Printable Help
37
General Signal Viewing
DPX Display
Spectrum – This view plots power on the vertical axis versus frequency on the horizontal axis. This
display is similar to a standard Spectrum display. In SignalVu-PC, this display appears as part of the
Split view. In the Split view, the only trace that can be displayed is the Ogram Line.
DPXogram - This view is a spectrogram version (time plotted along the vertical axis versus frequency
on the horizontal axis) of the DPX Spectrum trace. DPX spectrogram (on the instrument that created
the DPX acquisition data) creates the spectrogram in real time, and does not require an acquisition to
be transferred into memory and analyzed. Because of this real time processing, there are no gaps in the
spectral lines, even for monitoring periods that can last for several days.
Split - This view consists of two DPX views. A DPXogram view appears on the top half of the display
and a DPX Spectrum view appears on the bottom half of the display.
To display a DPX view:
1. Recall a DPX waveform acquisition data file.
2. Select Frequency and set the measurement frequency.
3. Select the Displays icon or Setup > Displays. This displays the Select Displays dialog box.
4. From the Measurements box, select General Signal Viewing.
5. Select DPX from the Available displays box.
6. Click the Add button. This will add the DPX icon to the Selected Displays box (and remove it from
the Available displays box).
7. Click the OK button. This displays the DPX Spectrum view.
SignalVu-PC will display the Split view of the recalled acquisition data.
DPX Split View
38
SignalVu-PC Printable Help
General Signal Viewing
DPX Display
Elements of the DPX Display
Item
Display element
Description
1
Vert Position
Sets the top of graph value. This is only a visual control for panning the graph.
The Reference Level is adjusted in the Toolbar and the Ampl control panel. By
default, Vert Position = Ref Level.
2
dB/div
Sets the vertical scale value. The maximum value is 20.00 dB/division.
3
RBW
Sets the resolution bandwidth. Note that when the RBW is set to Auto, its value is
italicized.
4
DPX view
Selects the DPX view. Choices are Spectrum, Zero Span, Frequency, Phase,
DPXogram, and Split.
5
Autoscale
Adjusts the Vertical and Horizontal scaling to display the entire trace on screen.
6
Pos/CF
Spectrum: Center Frequency - Adjusts the analyzer center frequency. For Zero
Span, Frequency, or Phase the Position is in seconds.
7
Span/Scale, Sweep/Scale
Spectrum display: Span - Adjusts frequency range of the measurement. Scale - If
Horizontal scale has been manually adjusted in Settings > Scale, then this control
adjusts the visual graph scaling without affecting the Span. Zero Span, Frequency,
Phase displays: Sweep - adjusts the trace duration in seconds. Scale - adjusts the
visual graph scaling without affecting the Sweep time.
8
Clear
Erases the bitmap and traces in the graph and restarts multi-trace functions
(Avg, Hold).
9
Function
Readout of the Detection and Function selections for the selected trace.
SignalVu-PC Printable Help
39
General Signal Viewing
DPX Display
Item
Display element
Description
10
Show
Controls whether the selected Trace is visible or not. When trace is Off, the box is
not checked.
11
Trace
Selects a trace. Touching here pops up a context menu listing the available
traces, whether they are enabled or not. If user selects a trace that is not currently
enabled, it will be made enabled.
xxx
Additional Elements of the DPXogram Split Display
Item
Display element
Description
1
Spectrums/line
Appears only when the display is stopped. Readout of the number of spectrum
lines represented by each line of the DPXOgram display. This value changes
when the Time/div or Time resolution settings are changed.
2
Color scale
Legend at the right side of the DPX Spectrum display. This element illustrates the
relationship between the colors in the DPXogram plot and the amplitude axis of the
DPX Spectrum plot. This scale changes with Color (DPXogram) palette selection
and Max and Min settings on the Ampl Scale tab.
3
DPXogram trace
The selected line in the DPXogram graph can be shown in the DPX Spectrum
graph of the Split view. The most recent DPXogram line, usually at the bottom
of the graph, is selected by default. If any markers are on, the selected marker
determines the selected line.
xxx
Time Resolution of DPXogram Display
Due to the large amount of data produced by the DPX hardware during acquisitions, a compressed version
of the plot is shown while running. This plot is limited to 500 lines, with each line having 267 points.
However, a much longer record, with higher frequency resolution is being collected. As soon as the
instrument is stopped, this underlying data is shown, replacing the temporary version. There are 50 lines
in each vertical division of the 2-D DPXogram plot, so the time resolution of the graph is Time/div
40
SignalVu-PC Printable Help
General Signal Viewing
DPX Display
divided by 50. However, you can set the instrument to collect multiple spectra per line, allowing you to
zoom in later on this high-time-resolution data.
When the DPXogram display is stopped, the analyzer can display the full resolution of the captured data.
The Time Resolution readout applies only when the DPXogram is running.
Effects of Changing Time Resolution. The Time Resolution control affects acquisition parameters for the
DPX hardware. This means that if you change the Time Resolution value while the instrument is stopped,
the new value applies to the NEXT acquisition, and might not represent the results currently shown in
the display.
Time resolution can be changed either directly, by manually adjusting the Time Resolution control, or
automatically, by changing the Time/div control. Auto is the default, yielding one spectrum per line in the
display. When the Time Resolution is decreased below its auto value, multiple spectra are collected to
create each line in the DPXogram graph. Once you stop the instrument, you can decrease the Time/div
value or use Zoom to see increased time resolution.
If the time resolution is set to a very small number while the Time/div is set to a large value, you might
notice that there is a limit to the number of spectra that can be collected. This limit depends on the number
of trace points selected. For 801-point spectra, 60,000 underlying spectra can be collected. The number of
2401-point spectra collected is 20,000, and for 4001-point spectra the number is 12,000. When the limit is
reached, the oldest spectra are discarded as newer spectra are captured.
Touchscreen Actions on Markers in the Graph Area
Action
Description
Mouse click within 1/2 div. of
a marker
Selects the marker and updates the marker display to show the selected marker's values.
Click on a marker to select
and then use the arrow keys
to move the marker
Adjust the setting associated with the Marker.
Click and drag a marker
Changes marker position to the "drop point". You can use Tools > Options > Prefs to
change whether markers jump from one peak to the next while dragging or move smoothly
along the trace.
xxx
Available Traces for Display in SignalVu-PC
The DPX display shows two types of displays, the DPXogram and Split display. The Split display consists
of a DPXogram display on the top half of the display and a DPX Spectrum display on the bottom half of
the display.
For the DPXogram display, only one trace is available – the DPXogram trace.
For the Split display, the DPX Spectrum display shows only the Ogram Line (the selected line in the
DPXogram display) on the bottom half of the display.
Reference. Changing the DPX Spectrum Display Settings (see page 293)
SignalVu-PC Printable Help
41
General Signal Viewing
DPX Settings
DPX Settings
Menu Bar: Setup > Settings
Front Panel / Application Toolbar: Settings
The measurement settings for the DPX display are shown in the following table.
Settings tab
Description
Freq & Span (see page 72)
Sets frequency and span parameters for the DPX display. This tab appears for the
Spectrum and DPXogram displays.
BW (see page 76)
Sets Resolution Bandwidth.
Traces Tab
Allows you to select the number and types of traces to display and their functions.
Amplitude Scale Tab (see
page 45)
The Amplitude Scale tab allows you to change the vertical scale and offset, enable the
3-D Waterfall display, and set the color scheme used for the DPXogram trace.
Time & Freq Scale Tab (see
page 46)
The Time and Freq Scale tab allows you to change the vertical and horizontal scale
settings, number of points in the trace, and Time resolution.
Prefs (see page 79)
Specifies whether certain display elements are visible.
xxx
Traces Tab
The Traces Tab allows you to set the display characteristics of the DPXOgram and Ogram traces in
the DPX display.
Setting
Description
Trace drop-down list
Selects which trace to configure. In SignalVu-PC, the only configurable traces are
DPXogram and Ogram.
Show
Specifies whether or not the trace shown in the Trace setting is displayed.
Freeze
Halts updates to the selected trace.
Detection
Sets the Detection method used for the trace. Available detection methods are +Peak,
-Peak, and Avg (VRMS).
Save Trace As
Saves the Ogram trace to a file for later recall and analysis.
xxx
42
SignalVu-PC Printable Help
General Signal Viewing
Traces Tab
Detection
Trace Detection occurs when the trace is being decimated by the measurement. For example, if the
maximum number of trace points is 100,000, and the selected analysis region is 200,000 samples, the
measurement must decimate the 200,000 resulting trace points by 2 to prevent exceeding the 100,000 trace
point limit. Since only one value can be selected for each trace point, an algorithm must be used to select
(detect) the appropriate value to use.
The available detection methods are:
+Peak – Each point on the trace is the result of detecting the positive peak value present in the set of
IQ samples available to that trace point.
-Peak – Each point on the trace is the result of detecting the negative peak value present in the set of
IQ samples available to that trace point.
Avg (VRMS) [Average VRMS] – Each point on the trace is the result of determining the RMS Voltage
value for all of the IQ samples available to the trace point. When displayed in either linear (Volts,
Watts) or Log (dB, dBm), the correct RMS value results. When the averaging function is applied to a
trace, the averaging is performed on the linear (Voltage) values, resulting in the correct average
for RMS values.
NOTE. The Detection setting does not affect the trace until the spectrum length is longer than the Auto
setting.
Saving Traces
To save an Ogram trace for later analysis:
1. Select the Save Trace As button. This displays the Save As dialog box.
SignalVu-PC Printable Help
43
General Signal Viewing
Traces Tab
2. Type a name for the saved trace and click Save.
Recalling Traces
You can recall a previously saved trace for comparison to a live trace. First, specify a trace for recall and
second, enable Show Recalled Trace.
To select a trace for recall:
1. Click the ... button to display the Open dialog box.
2. Navigate to the desired file and click Open.
3. Check the Show Recalled Trace check box.
4. Verify that the trace's Show check box is selected (either on this tab or next to the drop-down list
located at the top-left corner of the graph).
44
SignalVu-PC Printable Help
General Signal Viewing
Amplitude Scale Tab
Amplitude Scale Tab
The Amplitude Scale tab allows you to change the vertical and horizontal scale settings, enable the 3-D
Waterfall display, and set the color scheme used for the DPXogram trace.
Setting
Description
Height
Height controls apply only to the 3-D Waterfall display.
Scale
Changes the vertical scale for trace Amplitude in the graph (not the vertical scale for
Time).
Position
Specifies the level displayed at the bottom edge of the graph. (Bottom front edge in
the 3-D view).
Autoscale
Adjusts the vertical position bottom for linear units like Amps and Volts. Adjust the vertical
position top for log units like dBm. dBm is the default.
3-D Waterfall
Displays the DPXogram in a 3-D format.
Northeast
Shifts the perspective of the 3-D graph so that the oldest traces move back and to the
right.
Northwest
Shifts the perspective of the 3-D graph so that the oldest traces move back and to the left.
Reset Scale
Resets the Height and Color settings to their default values.
Color (DPXogram)
Color
Displays a drop-down list that allows you to set the color scheme used for the DPXogram
trace.
Max
Sets the power level represented by the top of the color scale.
Min
Sets the power level represented by the bottom of the color scale.
xxx
SignalVu-PC Printable Help
45
General Signal Viewing
Time & Freq Scale Tab
Time & Freq Scale Tab
The Time and Freq Scale tab allows you to change the vertical and horizontal scale settings, set the time
resolution and number of trace points of the DPXogram display.
Description
Setting
Vertical (time)
Time/div
For most Spectrogram applications. Primary time scale control is Time/div. Time
scale can be zoomed in or out when acquisitions are stopped.
Position
The position of the DPXOgram record at the bottom of the display. Position cannot
be changed while acquisitions are active, and is reset to zero when acquisitions
are started again.
Time at position
Displays the time of the DPXogram line shown at the bottom of the graph. This time
is relative to the Time Zero Reference of the current acquisition. If Position is set to a
negative value, the Time at position readout will be blanked.
Reset Scale
Sets the Time/div and Position settings to their default values.
Trace Points
Sets the number of trace points computed for each DPXogram line. These are the
points used for marker measurements and for results export.
Time resolution
Specifies the length of time represented by each line in the graph.
Auto
Sets the time represented by each line in the graph to be adjusted by the analyzer
checked) or manually (when unchecked). When Auto is enabled, Time Resolution
change based on Time/div.
Capacity
Readout of the total length of time that can be captured. This readout is provided
so that you can see how changing the Trace Points and Time resolution affects
the amount of data that can be captured. Capacity is represented in the format
dd:hh:mm:ss.
Horizontal (frequency)
Scale
Sets the displayed frequency range of the graph. This control affects only visual
scaling, and does not change the acquisition or analysis parameters.
Position
Sets the frequency displayed at the center of the graph. Changing this value does
not change the Frequency setting.
Autoscale
Sets the frequency scale to the Spectrogram Span value.
xxx
46
SignalVu-PC Printable Help
General Signal Viewing
Time Overview Display
Time Overview Display
The Time Overview display shows the entire acquisition record and shows you how the spectrum time and
analysis time fit within the acquisition record. This enables you to see how you can adjust the spectrum
time and analysis time to measure portions of the data.
You can specify the maximum number of trace points in the Time Overview display. You can set the
maximum number of trace points to 1K, 10K, 100K, 1M points or to Never decimate. If the Acquisition
Length includes more than 10,000 sample points (and Max trace points is not set to Never decimate), the
trace is decimated (using the +Peak method, similar to +Peak detection in a Spectrum display) to 10,000
points. This decimated trace is what is used for marker measurements.
The Time Overview window displays the Spectrum Length and Analysis Length. The Spectrum Length
is the period of time within the acquisition record over which the spectrum is calculated. The Analysis
Length is the period of time within the acquisition record over which all other measurements (such as
Amplitude vs. Time) are made. The Spectrum Length and Analysis Length can be locked together so
that the data used to produce the Spectrum display is also used for measurement displays; however, they
do not have to be tied together. They are by default specified separately and used to analyze different
parts of the acquisition record.
Elements of the Time Overview Display
SignalVu-PC Printable Help
47
General Signal Viewing
Time Overview Settings
Item
Element
Description
1
Time
Select the type of time analysis to be performed. You can select Analysis,
Spectrum, or Linked.
2
Offset
Sets the offset of the selected analysis time control.
3
Length
Sets the length of the selected analysis time control.
4
Position and Scale
Adjusts the vertical scale and position.
5
Scale indicators
Shows the vertical scale.
6
Autoscale button
Resets the horizontal scale to display the entire acquisition record and the
vertical scale to show all trace points.
7
Horizontal offset
Adjusts the horizontal offset.
8
Results Timeline
This fuchsia line indicates the portion of the record actually used for
calculating the selected result. For example: if a pulse measurement is
selected, it shows the period of the specific pulse. For a constellation display,
it shows the points included in the demodulation.
9
Amplitude vs. Time graph
The trace represents the entire acquisition record (at full horizontal scale).
The graph indicates the Analysis Length or Spectrum Length on the graph
with a darker background.
10
Horizontal Scale
Adjusts the span of the graph. By decreasing the scale, the graph essentially
becomes a window that you can move over the acquisition record by adjusting
the offset.
11
Spectrum Length and Offset
Indicator (red line, top of
graph)
This red line indicates the Spectrum Length and Offset. The longer the time,
the longer the bar. Adjusting the offset shifts the bar left or right.
12
Analysis Length and Offset
Indicator (blue line, top of
graph below red line)
The blue line indicates the Analysis Length and Offset. The longer the time,
the longer the bar. Adjusting the offset shifts the bar left or right.
xxx
NOTE. The area with black background (not gray) in the Amplitude vs. Time Graph highlights the control
selected in the Analysis Time Control drop-down list.
Changing the Time Overview Display Settings (see page 48)
Time Overview Settings
Menu Bar: Setup > Settings
Application Toolbar:
The Setup settings for Time Overview are shown in the following table.
48
SignalVu-PC Printable Help
General Signal Viewing
Time Overview Settings
Settings tab
Description
Scale (see page 78)
Adjusts the vertical and horizontal scale and offset of the display.
Trace (see page 51)
Allows you to select the types of trace to display and its function.
Prefs (see page 79)
Specifies whether or not certain display elements are shown.
xxx
SignalVu-PC Printable Help
49
General Signal Viewing
Navigator View
Navigator View
The Time Overview Navigator View places the Time Overview display across the top of the application
screen. This allows you to adjust the area of interest in the Navigator View and see the results
simultaneously in the other displays. For example, in the following image, adjusting the mask in the
Navigator View moves the trace and markers in all of the other displays.
Show Navigator View
To show the Navigator View, select View > Navigator View. To remove the Navigator View, deselect
Navigator View in the View menu.
50
SignalVu-PC Printable Help
General Signal Viewing
Trace Tab
Trace Tab
The Trace Tab allows you to set the display characteristics of displayed traces.
Setting
Description
Show
Shows / hides the selected trace.
Detection
Sets the Detection method used for the trace. Not available for saved traces. Available
detection methods are +Peak, -Peak, +/-Peak, Avg (VRMS), and Sample. Not all
detection methods are available in all displays.
Function
Selects the trace processing method. Available settings are: Normal, Average, Max
Hold, and Min Hold.
(Number of Traces)
Sets the number of traces averaged to generate the displayed trace. (Present only
when Function is set to Average.)
Freeze
Halts updates to the selected trace.
Save Trace As
Saves the selected trace to a file for later recall and analysis.
Show Recalled trace
Displays a saved trace instead of a live trace.
xxx
Detection
Trace Detection occurs when the trace is being decimated by the measurement. For example, if the
maximum number of trace points is 100,000, and the selected analysis region is 200,000 samples, the
measurement must decimate the 200,000 resulting trace points by 2 to prevent exceeding the 100,000 trace
point limit. Since only one value can be selected for each trace point, an algorithm must be used to select
(detect) the appropriate value to use.
The IQ samples in a data acquisition can be detected in a variety of ways. The number of IQ samples
available to each trace point varies with both analysis length and trace length. For example, with Spectrum
Length set to ‘Auto’ in the Analysis menu, the instrument analyzes just enough samples to produce one
IQ sample pair per trace point. In this case, the detection method chosen has very little effect, as the
+Peak, -Peak, Avg (VRMS) and Sample values are all equal. Changing the Spectrum Length causes the
available detection methods to differ in value because they have a larger set of samples for the various
detection methods to process.
The available detection methods (depending on the display) are:
SignalVu-PC Printable Help
51
General Signal Viewing
Trace Tab
+Peak – Each point on the trace is the result of detecting the positive peak value present in the set of
IQ samples available to that trace point.
-Peak – Each point on the trace is the result of detecting the negative peak value present in the set of
IQ samples available to that trace point.
+/-Peak – Selects the highest and lowest values of all the samples contained in two consecutive
acquisition intervals.
Avg (VRMS) [Average VRMS] – Each point on the trace is the result of determining the RMS Voltage
value for all of the IQ samples available to the trace point. When displayed in either linear (Volts,
Watts) or Log (dB, dBm), the correct RMS value results. When the averaging function is applied to a
trace, the averaging is performed on the linear (Voltage) values, resulting in the correct average
for RMS values.
Sample – The result is calculated based on the first sample available in the set of IQ samples for
each trace point.
Trace Processing
Traces can be processed to display in different ways. The Function setting controls trace processing.
Normal - Each new trace is displayed and then replaced by the next trace. Each data point contains a
single vertical value.
Average - Multiple traces are averaged together to generate the displayed trace. There is one vertical
value for each underlying frequency data point. Once the specified number of traces have been
acquired and averaged to generate the displayed trace, each new trace takes the place of the oldest
trace in the calculation. The Number of Traces setting specifies how many traces averaged.
Max Hold - Displays the maximum value in the trace record for each display point. Each new trace
display point is compared to the previous maximum value and the greater value is retained for display
and subsequent comparisons.
Min Hold - Displays the minimum value in the trace record for each display point. Each new trace
display point is compared to the previous minimum value and the lesser value is retained for display
and subsequent comparisons.
Saving Traces
To save a trace for later analysis:
1. Select the Save icon
. This displays the Save As dialog box.
2. Navigate to the desired folder or use the default.
3. Type a name for the saved trace and click Save.
Recalling Traces
You can recall a previously saved trace for analysis or comparison to a live trace.
52
SignalVu-PC Printable Help
General Signal Viewing
Spectrum Display
To select a trace for recall:
1. Select the trace into which the recalled trace will be loaded, from the Trace drop-down list.
2. Check the Show check box.
3. Click the ... button to display the Open dialog box.
4. Navigate to the desired file and click Open.
5. Check the Show Recalled Trace check box.
6. Verify that the trace's Show check box is selected (either on this tab or next to the drop-down list
located at the top-left corner of the graph).
Spectrum Display
To display a spectrum:
1. Click the Displays button or select Setup > Displays.
2. From the Measurements box, select General Signal Viewing.
3. Double-click the Spectrum icon in the Available displays box. This adds the Spectrum icon to the
Selected displays box (and removes it from the Available displays box). Alternatively, you can click
the Spectrum icon and then click the Add button to select Spectrum for display.
4. Click the OK button.
SignalVu-PC Printable Help
53
General Signal Viewing
Spectrum Display
Elements of the Spectrum Display
Item
Display element
Description
1
dB/div
Sets the vertical scale value. The maximum value is 20.00 dB/division.
2
RBW
Sets the resolution bandwidth. Note that when the RBW is set to Auto, its
value is italicized.
3
VBW
Enables the VBW (Video Bandwidth) filter. See Setup > Settings > BW Tab
(see page 76).
4
Autoscale
Adjusts the Vertical and Horizontal scaling to display the entire trace on
screen.
5
Position
Default function is CF - center frequency (equivalent to the Freq setting).
If Horizontal scaling has been manually adjusted in Settings > Scale, then
Offset will replace CF as the setting at the bottom-left corner of the screen.
6
Span / Scale
Default function is Span - frequency difference between the left edge of
the display and the right edge. If Horizontal scaling has been manually
adjusted in Settings > Scale, then Scale will replace Span as the setting at
the bottom-right corner of the screen.
7
Clear
Restarts multi-trace functions (Avg, Hold).
8
Function
Readout of the Detection and Function selections for the selected trace.
9
Show
Controls whether the selected Trace is visible or not. When trace is Off, the
box is not checked.
10
Trace
Selects a trace. Touching here pops up a context menu listing the available
traces, whether they are enabled or not. If user selects a trace that is not
currently enabled, it will be made enabled.
xxx
54
SignalVu-PC Printable Help
General Signal Viewing
Spectrum Settings
Changing the Spectrum Display Settings (see page 55)
Spectrum Settings
Menu Bar: Setup > Settings
Application Toolbar:
The settings for the Spectrum display are shown in the following table.
Settings tab
Description
Freq & Span (see page 72)
Sets frequency and span parameters for the Spectrum Analysis display.
BW (see page 76)
Sets Resolution Bandwidth and windowing parameters.
Traces (see page 73)
Sets Trace display parameters.
Traces (Math) (see page 76)
Sets the traces used to create the Math trace.
Scale Tab (see page 56)
Sets vertical and horizontal scale and position parameters.
Prefs Tab (see page 79)
Specifies whether or not certain display elements are shown.
xxx
SignalVu-PC Printable Help
55
General Signal Viewing
Scale Tab
Scale Tab
The Scale tab allows you to change the vertical and horizontal scale settings. Changing the scale settings
changes how the trace appears on the display but does not change control settings such as Measurement
Frequency. In effect, these controls operate like pan and zoom controls.
Setting
Description
Vertical
Scale
Changes the vertical scale.
Position
Vertical Position adjusts the top of graph amplitude value. This control allows you to
move (“pan”) the traces up and down in the graph without changing the Reference Level.
Autoscale
Resets the Offset so that the trace appears below the top of the graph.
Horizontal
Scale
Allows you to change the range of frequencies shown in the graph without changing the
span or measurement frequency.
Position
Allows you pan the graph.
Autoscale
Resets Scale to the Span setting.
Reset Scale
Resets all settings to their default values.
Log scale
Resets the display to show the frequency axis in a logarithmic scale.
xxx
Spectrogram Display
The Spectrogram is a display with the vertical axis (time) composed of successive spectral displays, each
having the amplitude represented by color or intensity. The horizontal axis represents frequency. The most
recently acquired spectrum results are added to the bottom of the spectrogram. The addition of a new
spectrum can occur at the fastest rate that new spectra can be plotted, or, if you choose, new spectra can be
added at a timed rate. The spectrogram view is well-suited to displaying long-term trends of spectral data.
The maximum number of lines that can be displayed in a spectrogram is 125,000.
The spectrogram can also be displayed in a 3-D waterfall format. In the 3-D waterfall format, the
spectrogram displays the time axis along a simulated Z-axis.
NOTE. Spectrogram data is shared with the Spectrum display. There is no linkage between DPX and
Spectrogram.
56
SignalVu-PC Printable Help
General Signal Viewing
Spectrogram Display
To display a Spectrogram:
1. Select the Displays button or select Setup > Displays. This displays the Select Displays dialog box.
2. From the Measurements box, select General Signal Viewing.
3. Double-click the Spectrogram icon in the Available Displays box. This adds the Spectrogram icon
to the Selected displays box.
4. Click the OK button. This displays the spectrogram view.
5. To display a 3-D version of the spectrogram, select the 3-D checkbox.
Elements of the Spectrogram Display
SignalVu-PC Printable Help
57
General Signal Viewing
Spectrogram Display
Item
Display element
Description
1
Check mark indicator
The check mark indicator in the upper, left-hand corner of the display shows
when the Spectrogram display is the optimized display.
NOTE. When Best for multiple windows is selected in the Amplitude control
panel's RF & IF Optimization control, none of the measurement displays
shows a checkmark, as there is not a single optimized measurement.
58
2
Time/div
Sets the length of time represented by each vertical division. Divisions are
indicated by tick marks along the left edge of the graph.
3
RBW
Sets the resolution bandwidth. Note that when the RBW is set to Auto, its
value is italicized.
4
VBW
Enables the VBW (Video Bandwidth) filter. See Setup > Settings > BW Tab
(see page 76).
5
3-D checkbox
Enables and disables the 3-D view.
6
Selected records indicators
Shows the positions of the start and stop records selected on the Select data
records tab. Drag the indicators to select which records will be played by
Replay All. Note that these are not visible while acquisitions are running; the
instrument must be stopped for the indicators to be visible.
7
T
Trigger indicator. This icon indicates the trigger point within the current
acquisition.
8
Pos
Position indicates the bottom line visible in graph. Changing this setting
scrolls the window up and down through the displayed acquisition records.
9
Autoscale
Resets Vertical and Horizontal scale and Pos to default values.
10
CF
Sets the Center Frequency.
11
Span
Sets the span of the spectrogram display.
12
Current data record indicator
A blue line indicates the current data record. When the analysis length is
short, the blue line appears as a thin line much like the selected indicator
line. When the analysis length is relatively long, the blue line appears more
like a blue bar.
13
Position scroll bar
Changes the position of the trace in the window. Changing the position scroll
bar is the same as adjusting the Pos setting.
14
Selected indicator
This inverse-colored line indicates the Spectrogram line that will appear in
the Spectrum display when the Spectrogram trace is enabled. This line is
attached to the selected marker.
15
Clear
Clears the spectrogram display; however, data records in acquisition history
remain in memory and are available for replay. To clear memory, select File >
Acquisition Data Info > Delete All Data.
16
Marker indicators
These icons indicate the position of markers in the spectrogram. You can
move markers by dragging the desired marker indicator.
17
Detection setting
Displays the selected Detection method (see Settings > Trace (see page 60)
tab).
SignalVu-PC Printable Help
General Signal Viewing
Spectrogram Settings
Item
Display element
Description
18
Marker readout
Marker readout for the selected marker. In the Spectrogram display, the
marker readout includes a date and timestamp. The time is displayed
in a 24-hour format. The timestamp readout can be shown or hidden
independently of the other marker readouts (see Settings > Prefs (see
page 79)).
19
Time Scale status readout
Three readouts can appear here depending on settings: Time/update,
Spectrums/line, and Overlap. See Time Scale Status Readout (see page 59).
xxx
Time Scale Status Readout
Three types of readouts can appear in the display depending on settings:
Time/update – Displays minutes:seconds when Spectrum Monitor is selected in the Settings > Time
& Freq Scale tab in the Vertical (Time) section.
Spectrums/line – Displays an integer number when vertical scale is Normal and each line contains the
results from one or more frequency transforms (whether zoomed out or not).
Overlap – Displays the overlap percentage when vertical scale is Normal and each line's transform
shares some points with the transforms of lines before and after it (zoomed in). Overlap can only be
done when the Analysis Length > 2x RBW frame length.
The Spectrogram can show results from one or multiple acquisitions and it can show one or multiple
lines for each acquisition.
Changing the Spectrogram Display Settings (see page 59)
Spectrogram Settings
Menu Bar: Setup > Settings
Application Toolbar:
The Setup settings for the Spectrogram display are visible when Spectrogram is the selected display.
Settings tab
Description
Freq & Span (see page 72)
Sets frequency and span parameters for the Spectrogram display.
BW (see page 76)
Sets Resolution Bandwidth and windowing parameters.
Trace (see page 60)
Sets Trace display parameters.
Amplitude Scale (see page 61)
Selects between 2-D and 3-D, sets height scale, position and orientation for 3-D display.
Sets color parameters for the spectrogram trace.
Time & Freq Scale (see
page 61)
Sets the vertical and horizontal scale parameters for the spectrogram trace. The
Spectrum Monitor controls are also on this tab.
Prefs (see page 79)
Specifies whether or not certain display elements are shown.
xxx
SignalVu-PC Printable Help
59
General Signal Viewing
Trace Tab
Trace Tab
The Spectrogram Trace tab controls let you specify the Detection method, save traces, and recall saved
traces for display. The Spectrogram Trace tab does not have all the controls that other Trace tabs contain,
however, it does have a unique display element, the Selected Line readout. For details on Detection,
Freeze, and saving and recalling traces, see the Traces Tab (see page 73).
Selected Line
Displays the time at the Selected Line. If Markers are enabled, the selected line is positioned by the
selected marker. If no markers are enabled, the selected line is the first line in the current analysis period.
60
SignalVu-PC Printable Help
General Signal Viewing
Amplitude Scale Tab
Amplitude Scale Tab
The Amplitude Scale tab allows you to change the vertical and horizontal scale settings, enable the 3-D
Waterfall display, and set the color scheme used for the spectrogram trace.
Setting
Description
Height (3-D only)
Scale
Changes the vertical scale for trace Amplitude in the graph (not the vertical scale for
Time).
Position
Specifies the level displayed at the bottom edge of the graph. (Bottom front edge in
the 3-D view).
Autoscale
Adjusts the vertical position and scale of the trace lines to bring them into the visible
portion of the graph.
3–D Waterfall
Displays the spectrogram in a 3-D format.
Northeast
Shifts the perspective of the 3-D graph so that the oldest traces move back and to the
right.
Northwest
Shifts the perspective of the 3-D graph so that the oldest traces move back and to the left.
Reset Scale
Resets the Height and Color settings to their default values.
Color (Power)
Color
Displays a drop-down list that allows you to set the color scheme used for the
spectrogram trace.
Max
Sets the maximum power level represented by the top of the color scale.
Min
Sets the minimum power level represented by the bottom of the color scale.
xxx
Time & Freq Scale Tab
The Time and Freq Scale tab allows you to change the vertical and horizontal scale settings, enable the 3-D
Waterfall display, and set the color scheme used for the spectrogram trace.
SignalVu-PC Printable Help
61
General Signal Viewing
Time & Freq Scale Tab
Description
Setting
Vertical (Time)
Normal
For most Spectrogram applications. Primary time scale control is Time/div. Time scale
can be zoomed in or out.
Spectrum Monitor
For long-term signal monitoring applications. In spectrum monitor mode, each line in the
spectrogram represents the period of time specified by the Time/update parameter. Time
scale can be zoomed out, but not zoomed in (no overlap).
Time/update
Sets the time, in minutes and seconds, represented by each line of the spectrogram.
Only available in Spectrum Monitor.
Reset Scale
Resets the Time/div and Pos settings to their default values.
Autoscale
Scales the vertical (time) axis to compress all existing trace lines into the visible area
of the graph. Resets the Position value to zero, placing the most recent spectrogram
line at the bottom of the spectrogram display. Only Position is affected by Autoscale
when Spectrum Monitor is selected.
Time/div
Sets the time displayed per division.
Visible elapsed time
Position
Time at position
Displays the length of time visible in the display. This does not represent the total time
available to view.
Adjusts vertical position of the trace within the graph area. Setting represents the offset,
in divisions, between the bottom of the graph and the bottom (most recent) line in the
results trace.
Displays the time of the spectrogram line shown at the bottom of the graph. This time is
relative to the Time Zero Reference of the current acquisition.
Horizontal (Frequency)
Scale
Sets the frequency range of the graph without changing the Span value.
Position
Sets the frequency displayed at the center of the graph. Changing this value does not
change the Freq setting.
Autoscale
Sets the frequency scale to the Spectrogram Span value.
xxx
Spectrum Monitor
Spectrum Monitor performs long term monitoring. The monitor mode compresses time into each line
of the spectrogram, which enables you to monitor long periods of time (from 1 second per line up to
600 minutes per line). With extended memory (Option 53) installed in the instrument, you can capture up
to 125,000 lines. With standard memory installed in the instrument, the maximum number of lines you
can capture is 31,250.
During each line's collection period, spectrum transforms are computed for each acquisition taken by the
instrument. As each transform completes, it is incorporated into the current spectrogram line. How each
62
SignalVu-PC Printable Help
General Signal Viewing
Amplitude Vs Time Display
line of the spectrogram is created in spectrum monitor mode depends on the detection setting (Settings >
Trace). For example, if Detection is set to +Peak, each spectrogram line is effectively a peak hold display
of all the spectral data captured since the prior line.
Amplitude Vs Time Display
The Amplitude vs. Time display plots the signal amplitude against time. The amplitude appears on the
vertical axis while time is plotted along the horizontal axis.
Note that the trace(s) in the Amplitude vs. Time display can be set to a maximum of 100,000 points
(however, the actual number of trace points can extend up to 1,000,000 points if Max trace points is set
to Never Decimate). If the Analysis Length includes more than the selected Max trace points value, the
trace is decimated (using the method specified with the Detection control) to be equal to or less than the
Max trace points setting (except when Max trace points is set to Never Decimate). This decimated (or
undecimated) trace is what is used for marker measurements and for results export. You can set the Max
trace points on the Settings > Prefs tab.
To show Amplitude vs. Time display:
1. Press the Displays button or select Setup > Displays.
2. In the Select Displays dialog, select General Signal Viewing in the Measurements box.
3. In the Available displays box, double-click the Amplitude vs. Time icon or select the icon and click
Add. The Amplitude vs. Time icon will appear in the Selected displays box and will no longer
appear under Available displays.
4. Click OK.
Elements of the Display
SignalVu-PC Printable Help
63
General Signal Viewing
Amplitude Vs Time Settings
Item
Display element
Description
1
Vertical scale adjustment
Adjusts the vertical scaling.
2
Span
Adjust the bandwidth of the data to be analyzed. (Not the period of time
shown in the display.)
3
Autoscale
Adjusts the vertical and horizontal settings to provide the best display.
4
Offset
Adjust the horizontal offset.
5
Max and Min readouts
Displays the maximum and minimum amplitudes, as well as when those
values occur.
6
Scale
Sets the time spanned by the graph.
7
Clear button
Restarts multi-trace functions (Avg, Hold).
8
Trace function
Displays the current trace function setting (Settings > Trace tab > Function).
xxx
Reference. Changing Amplitude vs Time Display Settings (see page 64)
Amplitude Vs Time Settings
Menu Bar: Setup > Settings
Application Toolbar:
The settings for the Amplitude vs. Time display are shown in the following table.
Settings tab
Description
Freq & BW (see page 65)
Sets the Bandwidth Method used for setting the measurement bandwidth.
Traces (see page 73)
Allows you to select the type of trace to display and their functions.
Traces (Math) (see page 76)
Sets the traces used to create the Math trace.
Scale (see page 78)
Sets the vertical and horizontal scale parameters.
Prefs (see page 79)
Specifies whether certain display elements are visible.
xxx
64
SignalVu-PC Printable Help
General Signal Viewing
Freq & BW Tab
Freq & BW Tab
The Freq & BW (Bandwidth) tab allows you to specify the bandwidth parameters used for setting
measurement bandwidth. This determines what Acq BW the measurement will request.
Settings
Description
xxx
Frequency Vs Time Display
The Frequency vs. Time Display shows how the signal frequency varies with time.
Note that the trace(s) in the Frequency vs. Time display can be set to a maximum of 100,000 points
(however, the actual number of trace points can extend up to 1,000,000 points if Max trace points is set
to Never Decimate). If the Analysis Length includes more than the selected Max trace points value, the
trace is decimated (using the method specified with the Detection control) to be equal to or less than the
Max trace points setting (except when Max trace points is set to Never Decimate). This decimated (or
undecimated) trace is what is used for marker measurements and for results export. You can set the Max
trace points on the Settings > Prefs tab.
To display the Frequency vs. Time Display:
1. Select the Displays button or Setup > Displays.
2. In the Select Displays dialog, select General Signal Viewing in the Measurements box.
3. In the Available displays box, double-click the Frequency vs. Time icon or select the icon and click
Add. The Frequency vs. Time icon will appear in the Selected displays box and will no longer
appear under Available displays.
4. Click OK to display the Freq vs. Time display.
SignalVu-PC Printable Help
65
General Signal Viewing
Frequency Vs Time Settings
Elements of the Display
Item
Display element
Description
1
Top of graph adjustment
Use the knob to adjust the frequency range displayed on the vertical axis.
2
Offset adjustment
Adjusts the frequency shown at the center of the display.
3
Autoscale button
Adjusts the offset and range for both vertical and horizontal to provide the
best display.
4
Maximum and Minimum
frequency readouts
Displays the maximum and minimum values, as well as when those values
occur.
5
Horizontal Scale
Sets the time spanned by the graph.
6
Clear button
Restarts Average trace.
7
Trace function
Displays the current trace function setting (Settings > Trace > Function).
xxx
Changing Frequency vs Time Display Settings (see page 66)
Frequency Vs Time Settings
Menu Bar: Setup > Settings
Application Toolbar:
The Setup settings for Frequency vs. Time are shown in the following table.
66
SignalVu-PC Printable Help
General Signal Viewing
Phase Vs Time Display
Settings tab
Description
Freq & BW (see page 71)
Sets the frequency and bandwidth parameters.
Trace (see page 73)
Sets the trace display parameters.
Scale (see page 78)
Sets the Vertical and Horizontal scale and offset parameters.
Prefs (see page 79)
Specifies whether certain display elements are visible.
xxx
Phase Vs Time Display
The Phase vs. Time display plots the signal phase against time. The phase appears on the vertical axis
while time is plotted along the horizontal axis.
Note that the trace(s) in the Phase vs. Time display can be set to a maximum of 100,000 points (however,
the actual number of trace points can extend up to 1,000,000 points if Max trace points is set to Never
Decimate). If the Analysis Length includes more than the selected Max trace points value, the trace is
decimated (using the method specified with the Detection control) to be equal to or less than the Max trace
points setting (except when Max trace points is set to Never Decimate). This decimated (or undecimated)
trace is what is used for marker measurements and for results export. You can set the Max trace points
on the Settings > Prefs tab.
To display Phase vs. Time:
1. Press the Displays button or select Setup > Displays.
2. In the Select Displays dialog, select General Signal Viewing in the Measurements box.
3. In the Available displays box, double-click the Phase vs. Time icon or select the icon and click
Add. The Phase vs. Time icon will appear in the Selected displays box and will no longer appear
under Available displays.
4. Click OK to show the Phase vs. Time display.
SignalVu-PC Printable Help
67
General Signal Viewing
Phase Vs Time Settings
Elements of the Display
Item
Display element
Description
1
Top of graph adjustment
Adjusts the vertical scale. Use the knob to adjust the value of the top of the
graph.
2
Vertical offset adjustment
Adjusts the phase error shown at the vertical center of the display.
3
Autoscale button
Adjusts the vertical and horizontal settings so that the entire trace fits in the
view.
4
Horizontal Offset
Adjusts the horizontal position of the trace.
5
Max and Min readouts
Displays the maximum and minimum value of the phase error within the
analysis times and the times at which they occurred.
6
Horizontal Scale
Sets the time spanned by the graph.
7
Clear button
Restarts multi-trace functions (Avg, Hold).
8
Trace function
Shows the trace function as set on the Settings > Trace tab.
xxx
Changing the Phase vs Time Display Settings (see page 68)
Phase Vs Time Settings
Menu Bar: Setup > Settings
Application Toolbar:
The settings for the Phase vs. Time display are shown in the following table.
68
SignalVu-PC Printable Help
General Signal Viewing
RF I & Q vs Time Display
Settings tab
Description
Freq & BW (see page 71)
Sets the frequency and bandwidth parameters.
Trace (see page 73)
Sets the trace display parameters.
Scale (see page 78)
Sets the Vertical and Horizontal scale and offset parameters.
Prefs (see page 79)
Specifies whether certain display elements are visible.
xxx
RF I & Q vs Time Display
This is a plot of the baseband In-Phase (I) and Quadrature (Q) components of a modulated carrier. The plot
is in the time domain, with I and/or Q values the Y-axis.
Note that the trace(s) in the RF I & Q vs. Time display can be set to a maximum of 100,000 points
(however, the actual number of trace points can extend up to 1,000,000 points if Max trace points is set
to Never Decimate). If the Analysis Length includes more than the selected Max trace points value, the
trace is decimated (using the method specified with the Detection control) to be equal to or less than the
Max trace points setting (except when Max trace points is set to Never Decimate). This decimated (or
undecimated) trace is what is used for marker measurements and for results export. You can set the Max
trace points on the Settings > Prefs tab.
To display an RF I & Q vs. Time display:
1. Select the Displays button or select Setup > Displays. This shows the Select Displays dialog box.
2. From the Measurements box, select General Signal Viewing.
3. Double-click the RF I&Q vs. Time icon in the Available Displays box. This adds the RF I & Q vs.
Time icon to the Selected displays box.
4. Click the OK button.
SignalVu-PC Printable Help
69
General Signal Viewing
RF I & Q vs Time Settings
Elements of the Display
Item
Display element
Description
1
Top of Graph adjustment
Use the knob to adjust the vertical scaling.
2
Vertical offset adjustment
Adjusts the level shown at the center of the display.
3
Autoscale button
Adjusts the offset and scale for both vertical and horizontal to provide the
best display.
4
Maximum and Minimum level
readouts
Displays the maximum and minimum values, within the Analysis Time, as well
as the times at which they occurred.
5
Scale
Sets the time spanned by the graph.
6
Clear button
Restarts multi-trace functions (Avg, Hold).
7
Trace function
Displays the current trace function setting (Settings > Trace > Function). If the
traces are averaged, the number of averages is displayed.
8
Trace Control
Selects which trace is displayed (using the drop-down list) and which trace is
active (click on the trace name to display a menu).
xxx
Changing the RF I & Q vs Time Display Settings (see page 70)
RF I & Q vs Time Settings
Menu Bar: Setup > Settings
Application Toolbar:
The Setup settings for RF I&Q vs. Time are shown in the following table.
70
SignalVu-PC Printable Help
General Signal Viewing
General Signal Viewing Shared Measurement Settings
Settings tab
Description
Freq & BW (see page 71)
Sets the frequency and bandwidth parameters.
Trace (see page 73)
Sets the trace display parameters.
Scale (see page 78)
Sets the Vertical and Horizontal scale and offset parameters.
Prefs (see page 79)
Specifies whether certain display elements are visible.
xxx
General Signal Viewing Shared Measurement Settings
The control panel tabs in this section are identical or very similar for each of the displays in the General
Signal Viewing folder (Setup > Displays). Some tabs are shared by all the displays, some tabs are shared
by only a couple of displays.
For some tabs, the control values are shared across all the General Signal Viewing displays. For other
control values, each display has unique values for the controls. Details are provided for the specific tabs.
Common controls for general signal viewing displays
Settings tab
Description
Freq & Span (see page 72)
Sets the frequency and span parameters.
Trace (see page 73)
Sets the trace display parameters.
Traces – Math (see page 76)
Sets the traces used to create the Math trace.
BW (see page 76)
Sets the Bandwidth Method used for setting the measurement bandwidth.
Scale (see page 78)
Sets the Vertical and Horizontal scale and offset parameters.
Prefs (see page 79)
Specifies whether certain display elements are visible.
xxx
Freq & BW Tab — Freq vsTime, Phase vs Time, RF I & Q vs Time Display
The Freq & BW tab provides access to settings that control frequency settings for the Freq vs Time, Phase
vs Time, RF I & Q vs Time display.
SignalVu-PC Printable Help
71
General Signal Viewing
Freq & Span Tab
Setting
Description
Measurement Freq
The frequency at the which measurements are made. This value is the same as the
setting for Frequency in the Application bar.
Measurement BW
This control limits the bandwidth of measurements. You use the measurement bandwidth
setting to improve the signal-to-noise ratio of the measurement, resulting in lower
measurement uncertainty. However, if the measurement bandwidth is set too low,
resulting in fewer samples per second, it can reduce the number of points within the
measurement length below the 256 stable samples required, thus causing the analysis
to fail.
Link to Span
When enabled, the measurement bandwidth of the RF I & Q display is determined by
the span of the analyzer. When unchecked, the measurement bandwidth is specified by
the user, and no additional filter is applied.
Set to max BW
Sets the measurement bandwidth to the maximum acquisition bandwidth of the
instrument.
xxx
Freq & Span Tab
The Freq & Span tab provides access to settings that control frequency settings for the trace display. The
control values set in this tab are shared by all the General Signal Viewing displays.
Setting
Description
Center
The frequency at the center of the selected Span.
Start
The lowest frequency in the span.
Stop
The highest frequency in the span.
Step Size
Sets the increment/decrement size for Center, Start and Stop values.
Span
The difference between the start and stop frequencies. This is the measurement
bandwidth for the general signal viewing displays.
Max Span
Sets the Span to the maximum value.
xxx
Center, Start, Stop, and Span Frequencies Are Correlated
Changing the values for Center frequency, Start frequency, Stop frequency or Span will change the values
for the other settings, depending on which setting you change. For example, if you change the Center
frequency, the Start and Stop frequencies will be adjusted automatically to maintain the same Span.
Note however that if the Start and Stop frequencies are changed so that they are closer than the minimum
span setting, the Start and Stop frequencies will be adjusted to maintain the minimum Span setting.
Setting Changed Manually
Settings Changed Automatically As
a Result
Setting Not Automatically Changed
Start
Center, Span
Stop
Stop
Center, Span
Start
Center
Start, Stop
Span
Span
Start, Stop
Center
xxx
72
SignalVu-PC Printable Help
General Signal Viewing
Traces Tab
Traces Tab
The Traces Tab allows you to set the display characteristics of displayed traces.
Setting
Description
Trace
Selects a trace. (This setting is not present for every display.)
Show
Shows / hides the selected trace.
Function
Selects the trace processing method. Available settings are: Normal, Average, Max
Hold, and Min Hold.
Count
Sets the number of traces averaged to generate the displayed trace. (Present only when
Function is set to Average, Min Hold, or Max Hold.)
Freeze
Halts updates to the selected trace.
Save Trace As
Saves the selected trace to a file for later recall and analysis.
Show Recalled trace
Displays a saved trace instead of a live trace.
xxx
Trace
Available traces for Spectrum are: Trace 1, Trace 2, Trace 3, Math, and Spectrogram. Other displays
support fewer traces. Traces 1-3 are based on the input signal and enable you to display the input signal
using different processing. For example, you could display Trace 1 with Function set to Normal, Trace 2
with Function set to Max Hold and Trace 3 with Function set to Min Hold.
The Math trace is the result of subtracting one trace from another.
The Spectrogram trace applies only to the Spectrum display and is available only if the Spectrogram
display is shown. The Spectrogram trace shows the trace selected in the Spectrogram as a spectrum trace.
Detection
Trace Detection is used to reduce the results of a measurement to the desired number of trace points. For
example, if the maximum number of trace points is 100,000, and a measurement over the selected analysis
length yields 200,000 points, the measurement must decimate these 200,000 trace points by 2 to prevent
exceeding the 100,000 trace point limit. Since only one value can be represented for each trace point, an
algorithm must be used to select (detect) the appropriate value to use.
The results array from an analysis can be detected (or “decimated”) in a variety of ways. The number
of results points produced for each trace point varies with both analysis length and trace length. For
SignalVu-PC Printable Help
73
General Signal Viewing
Traces Tab
example, the frequency transform used for the Spectrum display produces just one output value for each
desired trace point. In this case, the detection method chosen has no effect, as no decimation is required.
Increasing the Analysis Length (or for the Spectrum display, the Spectrum Length), causes the available
detection method's output traces to differ from each other because they have a larger set of samples for the
various detection methods to process.
The available detection methods (depending on the display) are:
+Peak – The highest value is selected from the results to be compressed into a trace point.
-Peak – The lowest value is selected from the results to be compressed into a trace point.
+/-Peak – Both the highest and lowest values are selected from the results to be compressed into a
trace point.
Avg (VRMS) [Average VRMS] – Each point on the trace is the result of determining the RMS Voltage
value for all of the results values it includes. When displayed in either linear (Volts, Watts) or Log (dB,
dBm), the correct RMS value results.
Avg (of logs) – The detector is used to emulate legacy spectrum analyzer results and for the
specification of displayed average noise level. In older swept analyzers, a voltage envelope detector is
used in the process of measuring signal level, and the result is then converted to Watts and then to
dBm. Averaging is then applied to the resultant traces.
For CW signals, this method results in an accurate power measurement. However, with random noise
and digitally modulated carriers, errors result from this 'average of logs' method. For random noise,
the average of logs methods results in power levels -2.51 dB lower than that measured with a power
meter, or with a signal analyzer that measures the rms value of a signal, and performs averaging on the
calculated power in Watts and not dBm or other log-power units.
This detector should be used when following a measurement procedure that specifies it, or when
checking the Displayed Averaged Noise Level (DANL) of the instrument. The 'average of logs'
detection and trace function is used for DANL specification to provide similar results to other
spectrum/signal analyzers for comparison purposes. Use of the Average of Logs method of
measurement is not recommended for digitally modulated carriers, as power measurement errors
will occur.
NOTE. The Detection setting does not affect the trace until the spectrum length is longer than the Auto
setting.
Sample – The first value is selected from the set of results to be compressed into a trace point.
CISPR Peak – The trace value is calculated by the methods described for peak detectors in the
CISPR documents.
Trace Processing
Traces can be processed to display in different ways. The Function setting controls trace processing.
74
SignalVu-PC Printable Help
General Signal Viewing
Traces Tab
Normal - Each new trace is displayed and then replaced by the next trace. Each data point contains a
single vertical value.
Average - Multiple traces are averaged together to generate the displayed trace, which will contain just
one vertical value for each underlying frequency data point. Once the specified number of traces have
been acquired and averaged to generate the displayed trace, additional traces contribute to the running
average, except in Single Sequence run mode. In the case of Single Sequence, the instrument stops
running after the specified number of traces have been averaged together. The Number of Traces
setting specifies how many traces are averaged. The averaging is performed on the linear (Voltage)
values, resulting in the correct RMS average).
Max Hold - Displays the maximum value in the trace record for each display point. Each new trace's
display point is compared to the previous maximum value and the greater value is retained for display
and subsequent comparisons.
Min Hold - Displays the minimum value in the trace record for each display point. Each new trace's
display point is compared to the previous minimum value and the lesser value is retained for display
and subsequent comparisons.
Saving Traces
To save a trace for later analysis:
1. Select the Save Trace As button. This displays the Save As dialog box.
2. Navigate to the desired folder or use the default.
3. Type a name for the saved trace and click Save.
Recalling Traces
You can recall a previously saved trace for analysis or comparison to a live trace.
To select a trace for recall:
1. Select the trace into which the recalled trace will be loaded, from the Trace drop-down list.
2. Check the Show check box.
3. Click the ... button to display the Open dialog box.
4. Navigate to the desired file and click Open.
SignalVu-PC Printable Help
75
General Signal Viewing
Traces Tab - Math Trace
5. Check the Show Recalled Trace check box.
6. Verify that the trace's Show check box is selected (either on this tab or next to the drop-down list
located at the top-left corner of the graph).
Traces Tab - Math Trace
This tab is not a distinct tab, it is just how the Traces tab appears when Math is selected in the Traces
drop-down list.
Trace 4 is a mathematically-derived trace defined as Trace A minus Trace B. You can select Trace 1, 2, or
3 to serve as either Trace A or Trace B.
Setting
Description
Trace
When set to Trace 4 (Math), this tab is displayed.
Show
Shows / hides the selected trace.
Freeze
Halts updates to the selected trace.
Save Trace As
Saves the selected trace to a file for later recall and analysis.
Trace minus Trace
Selects which traces serve as Trace A and Trace B.
xxx
BW Tab
The BW (bandwidth) tab allows you to change Resolution Bandwidth and Video Bandwidth settings,
and set the windowing method used by the transform process by selecting a filter shape (not present
for all displays).
76
SignalVu-PC Printable Help
General Signal Viewing
BW Tab
Setting
Description
RBW
Sets the Resolution Bandwidth value to be used in the spectrum analysis view. The
value is italicized when Auto is selected.
Auto
When Auto is checked, the RBW is calculated as a percentage of the Span. Kaiser is
selected as the windowing method. When Auto is unchecked, the RBW is set by the user.
Selecting any Window other than Kaiser changes the RBW setting to manual.
Span/RBW ratio
If Auto is checked, this value is used to calculate the RBW. If Auto is unchecked, this
setting is not selectable.
Filter Shape
Specifies the windowing method used for the transform (when Auto is unchecked).
(Spectrum and Spectrogram displays only.)
VBW
Adjusts the VBW (Video Bandwidth) value. (Spectrum and Spectrogram displays only.)
xxx
Filter Shape Settings
In the analyzer, computationally efficient discrete Fourier transform algorithms such as FFT (Fast Fourier
Transform) or CZT (Chirp-Z Transform) are generally employed to transform time-domain signals into
frequency-domain spectra. There is an assumption inherent in the mathematics of Discrete Fourier
Transforms that the data to be processed is a single period of a periodically repeating signal. The
discontinuities between successive frames will generally occur when the periodic extension is made to the
signal. These artificial discontinuities generate spurious responses not present in the original signal, which
can make it impossible to detect small signals in the presence of nearby large ones. This phenomenon is
called spectral leakage.
Applying a filter, such as Kaiser, to the signal to be transformed is an effective method to combat the
spectral leakage problem. Generally the filter has a bell shape. Multiplying the transform frame by the
filter function eliminates or reduces the discontinuities at the ends of the frame, however, at the expense of
increased RBW.
Filter Shape Characteristics
The choice of filter shape depends on its frequency response characteristics such as side-lobe level,
equivalent noise bandwidth and maximum amplitude error. Use the following guidelines to select the
best filter shape.
Filter Shape
Characteristics
Kaiser (RBW)
Best side-lobe level, shape factor closest to the traditional Gaussian RBW.
-6dB RBW (MIL)
These filters are specified for bandwidth at their -6 dB point, as required by military
EMI regulations.
CISPR
These filters comply with the requirements specified in the P-CISPR 16 -1-1 document
for EMI measurements.
Blackman-Harris 4B
Good side-lobe level.
Uniform (None)
Best frequency resolution, poor side-lobe level and amplitude accuracy.
Flat-Top
Best amplitude accuracy, best representation of brief events captured near the beginning
or end of the time-domain data frame, poor frequency resolution.
Hanning
Good frequency resolution, high side-lobe roll-off rate.
xxx
SignalVu-PC Printable Help
77
General Signal Viewing
Scale Tab
VBW
The VBW setting enables/disables the Video Bandwidth filter. VBW is used in traditional swept analyzers
to reduce the effect of noise on the displayed signal. The VBW algorithm in the analyzer emulates the
VBW filters of traditional swept analyzers.
The maximum VBW value is the current RBW setting. The minimum VBW value is 1/10,000 of the RBW
setting. VBW is disabled when the Filter shape is set to CISPR.
Scale Tab
The Scale tab allows you to change the vertical and horizontal scale settings. Changing the scale settings
changes how the trace appears on the display but does not change control settings such as Measurement
Frequency. In effect, these controls operate like pan and zoom controls.
The Scale tab values are unique to each display. Also, note that each display uses horizontal and vertical
units that are appropriate for the display. For example, for the Spectrum display uses power (dBm) units
and frequency (Hz) units; the Amplitude vs. Time display uses power (dBm) and time (seconds) units; and
the Phase vs. Time display uses phase (degrees) and time (seconds) units.
Setting
Description
Vertical
Controls the vertical position and scale of the trace display.
Scale
Changes the vertical scale.
Offset
Vertical Offset adjusts the reference level away from top of the graph.
Autoscale
Resets the scale of the vertical axis to contain the complete trace.
Horizontal
Controls the span of the trace display and position of the trace.
Zoom Start
Sets the starting frequency for ...
Zoom Stop
Sets the stop frequency for ...
Log
Resets the scale of the horizontal axis to contain the complete trace.
Reset Scale
Resets all settings to their default values.
xxx
78
SignalVu-PC Printable Help
General Signal Viewing
Prefs Tab
Prefs Tab
The Prefs tab enables you to change parameters of the measurement display. The parameters available on
the Prefs tab vary depending on the selected display, but include such items as enabling/disabling Marker
Readout, switching the Graticule display on/off, and Marker Noise mode.
Each of the General Signal Viewing displays maintains its own separate values for the controls that appear
on the Prefs tab. Some parameters appear with most displays while others appear with only one display.
For example, in the following image, the Show Marker readout in graph check box appears in the Prefs tab
for every display. However, the Show Power Trigger level check box only appears on the Amplitude vs
Time Prefs tab.
The following image shows the Prefs tab for the Time Overview display.
The following table explains the controls that can appear on the Prefs tab.
SignalVu-PC Printable Help
79
General Signal Viewing
Prefs Tab
Setting
Description
Show:
Selects the horizontal settings that appear below the graph area. You can choose Start,
Stop or Center, Span.
Trace points
Sets the number of trace points used for marker measurements and for results export.
Max trace points
(Time Overview Display only)
Sets the maximum number of trace points used for marker measurements and for
results export.
Show trace legend
Enables display of a legend in the measurements area that shows the Detection method
and Function setting for displayed traces. The color of the legend text matches the color
of the associated trace.
Show graticule
Select to display or hide the graticule.
Navigator View
(Time Overview Display only)
Places the Time Overview display across the top of the application window, above all
other active displays.
Show Marker readout in graph
(selected marker)
Shows or hides the readout for the selected marker in the graph area.
Show timestamp in graph
(selected line)
For spectrogram displays, this readout shows or hides the timestamp associated with the
selected line or marker position.
Show Power Trigger Level
Displays or hides a green line in the graph that indicates the level at which the power
trigger is set. The line is not displayed if Trigger is set to Free Run.
Marker Noise mode
Select to enable or disable the Marker Noise mode. Use this mode to measure noise on
the trace. See Using Noise Markers in the Spectrum Display (see page 367).
xxx
80
SignalVu-PC Printable Help
Analog Modulation
Overview
Overview
The displays in Analog Modulation (Displays > Measurements > Analog Modulation) are:
AM
FM
PM
The Analog Modulation displays provide measurements and time-domain trace displays.
AM Display
The Amplitude Modulation Display is a graph of Modulation Factor vs Time. The AM display includes
three numeric readouts.
To show the AM display:
1. Select the Displays button or select Setup > Displays. This shows the Select Displays dialog box.
2. From the Measurements box, select Analog Modulation.
3. Double-click the AM icon in the Available Displays box. This adds the AM icon to the Selected
displays box.
4. Click the OK button. This shows the AM display.
Elements of the Display
SignalVu-PC Printable Help
81
Analog Modulation
AM Settings
Item
Element
Description
1
Check mark indicator
The check mark indicator in the upper, left-hand corner of the display shows
when the AM display is the optimized display.
NOTE. When Best for multiple windows is selected in the Amplitude control
panel's RF & IF Optimization control, none of the measurement displays
shows a checkmark, as there is not a single optimized measurement.
2
Top of Graph
Sets the %AM indicated at the top of the graph by increasing or decreasing
the vertical scale. Changing the top value affects the bottom of graph value
because the graph scales about vertical center. Also, note that the top of
graph setting interacts with the internal vertical scale setting (which is not
user settable).
3
Position
Specifies the %AM shown at the center of the graph display.
4
Bottom Readout
Displays the value of the modulation factor shown at the bottom of graph.
5
Measurement readouts
Displays numeric values for the +AM (positive modulation factor), –AM
(negative modulation factor), and Total AM.
6
Position
Specifies the horizontal position of the trace on the graph display.
7
Scale
Adjusts the horizontal range of the graph. By decreasing the scale (time
across the entire graph), the graph essentially becomes a window that you
can move over the trace by adjusting the position.
8
Clear
Erases the trace from the graph.
9
Trace Detection readout
Displays the Settings > Trace > Detection setting.
xxx
Changing the AM Settings (see page 82)
AM Settings
Menu Bar: Setup > Settings
Application Toolbar:
The AM Settings control panel provides access to settings that control parameters of the AM Display.
82
SignalVu-PC Printable Help
Analog Modulation
Parameters Tab
Setting
Description
Parameters (see page 83)
Sets the Carrier Amplitude Detection method. You can choose either Average or Median.
Trace (see page 84)
Sets Trace display parameters.
Scale (see page 86)
Sets vertical and horizontal scale and position parameters.
Prefs (see page 87)
Specifies whether or not certain display elements are shown. Specifies the maximum
number of points shown in the display graph.
xxx
Parameters Tab
The Parameters tab enables you to specify two parameters that control the carrier amplitude detection.
Setting
Description
Average
Selects the Average method for computing the average baseline for measurements.
Median
Selects the Median method for computing the average baseline for measurements.
Measurement BW
Specifies the bandwidth about the center frequency at which measurements are made.
xxx
AM Modulation
An amplitude modulated carrier can be described mathematically by:
A, in the above equation, represents the carrier amplitude, a(t) represents the time-varying modulation
and ω0 represents the carrier frequency.
The signal modulation envelope is given by:
There are several ways to express the AM modulation depth, expressed as a percentage.
Peak method
Trough Method
Max-Min Method
SignalVu-PC Printable Help
83
Analog Modulation
Trace Tab
In each case, the value of the carrier amplitude, A, needs to be estimated from the input signal.
The instrument represents signals in a sampled form. The sampled envelope can be expressed as a function
of sample index K and sampling period T as:
The instrument allows the choice of two methods for estimating the carrier amplitude:
Average Method
Median Method
In both cases, the instrument computes the average and the median over the analysis period. It should be
noted that the two methods give the same result for sinusoidal modulation where the sampling frequency
is much higher than the modulation frequency.
Trace Tab
The Trace Tab allows you to set the display characteristics of a trace.
Setting
Description
Show
Shows/hides the trace. If the instrument continues to run, the measurement results below
the graph display continue to update even if the trace is hidden.
Detection
Sets the Detection method used for the trace. Available detection methods are +Peak,
-Peak, and Avg (VRMS). Not available for saved traces.
Function
Selects the trace processing method. The only available setting is Normal.
Freeze
Halts updates to the trace.
Save Trace As
Saves the trace to a file for later recall and analysis.
Show recalled trace
Displays a saved trace instead of a live trace.
xxx
84
SignalVu-PC Printable Help
Analog Modulation
Trace Tab
Detection
Detection refers to the method of processing the data acquisition points when creating a trace. The IQ
samples in a data acquisition can be detected in a variety of ways. The number of IQ samples available to
each trace point varies with both analysis length and trace length. For example, with Spectrum Length set
to ‘Auto’ in the Analysis menu, the instrument analyzes just enough samples to produce one IQ sample
pair per trace point. In this case, the detection method chosen has very little effect, as the +Peak, -Peak,
and Avg (VRMS) are all equal. Changing the Spectrum Length causes the available detection methods to
differ in value because they have a larger set of samples for the various detection methods to process.
The available detection methods are:
+Peak – Each point on the trace is the result of detecting the positive peak value present in the set of
IQ samples available to that trace point.
-Peak – Each point on the trace is the result of detecting the negative peak value present in the set of
IQ samples available to that trace point.
Avg (VRMS) [Average VRMS] – Each point on the trace is the result of determining the RMS Voltage
value for all of the IQ samples available to the trace point. When displayed in either linear (Volts,
Watts) or Log (dB, dBm), the correct RMS value results. When the averaging function is applied to a
trace, the averaging is performed on the linear (Voltage) values, resulting in the correct average
for RMS values.
Trace Processing
Traces can be processed to display in different ways. The Detection setting controls trace decimation,
when needed. When the trace points each cover more than one sample data point, the vertical results
values for multiple data points are combined into each trace point. Each trace point ends up with a single
vertical value.
Average - Each trace point is computed by averaging together the multiple results points it represents.
+Peak - Each trace point represents the highest vertical value among the results it includes.
–Peak - Each trace point represents the lowest vertical value among the results it includes.
Saving Traces
To save a trace for later analysis:
1. Select the Save Trace As button. This displays the Save As dialog box.
2. Navigate to the desired folder or use the default.
3. Type a name for the saved trace and click Save.
Recalling Traces
You can recall a previously saved trace for analysis or comparison to a live trace.
To select a trace for recall:
SignalVu-PC Printable Help
85
Analog Modulation
Scale Tab
1. Click the ... button to display the Open dialog box.
2. Navigate to the desired file and click Open.
3. Check the Show Recalled Trace check box.
4. Verify that the Show check box is selected.
Scale Tab
The Scale tab allows you to change the vertical and horizontal scale settings. Changing the scale settings
changes how the trace appears on the display but does not change control settings such as Measurement
Frequency. In effect, these controls operate like pan and zoom controls.
Setting
Description
Vertical
Scale
Changes the range shown between the top and bottom of the graph.
Position
Adjusts the level shown at the center of the graph.
Autoscale
Resets the Position so that the entire trace is in the graph.
Horizontal
Scale
Changes the range shown between the left and right sides of the graph.
Position
Adjusts the position of the acquisition record shown at the left edge of the graph.
Autoscale
Resets the Scale and Position settings to provide the optimum display.
xxx
86
SignalVu-PC Printable Help
Analog Modulation
Prefs Tab
Prefs Tab
The Prefs tab enables you to change appearance characteristics of the AM display.
Setting
Description
Show graticule
Shows or hides the graticule.
Show Marker readout in graph
(selected marker)
Shows or hides the readout for the selected marker in the graph area.
Max trace points
The trace in the AM display can be set to a maximum of 100,000 points (however, the
actual number of trace points can extend up to 500,000 points if Max trace points is
set to Never Decimate). If the Analysis Length includes more than the selected Max
trace points value, the trace is decimated (using the method specified with the Detection
control) to be equal to or less than the Max trace points setting (except when Max trace
points is set to Never Decimate). This decimated (or undecimated) trace is what is used
for marker measurements and for results export.
xxx
FM Display
The Frequency Modulation Display shows Frequency Deviation vs. Time. The vertical axis units are
Hertz and the horizontal axis units are seconds. When taking measurements, only the first burst in the
Analysis period is analyzed. No trace points are shown for data outside the first detected burst, nor are
measurements made on data outside the first detected burst.
To show the FM display:
1. Select the Displays button or select Setup > Displays. This shows the Select Displays dialog box.
2. From the Measurements box, select Analog Modulation.
3. Double-click the FM icon in the Available Displays box. This adds the FM icon to the Selected
displays box.
4. Click the OK button. This shows the FM display.
SignalVu-PC Printable Help
87
Analog Modulation
FM Display
Elements of the Display
88
SignalVu-PC Printable Help
Analog Modulation
FM Settings
Item
Element
Description
1
Check mark indicator
The check mark indicator in the upper, left-hand corner of the display shows
when the FM display is the optimized display.
NOTE. When Best for multiple windows is selected in the Amplitude control
panel's RF & IF Optimization control, none of the measurement displays
shows a checkmark, as there is not a single optimized measurement.
2
Top of Graph control
Sets the frequency indicated at the top of the graph. Since the Position value
at the vertical center of this graph remains constant as the Top of Graph value
is adjusted, the Vertical Scale increases as the Top of Graph value increases,
which also affects the bottom of graph readout. Vertical Scale can also be
controlled from the Settings control panel's Scale tab.
3
Position
Specifies the frequency shown at the center of the graph display. Changing
this value moves the trace up and down in the graph, which affects the Top of
Graph and Bottom of Graph values as well.
4
Bottom of Graph Readout
Displays the frequency value at the bottom of the graph.
5
Measurement readouts
Displays numeric values for the +Pk (positive frequency deviation), –Pk
(negative frequency deviation), RMS (RMS value of the deviation), Pk-Pk
(peak-to-peak frequency deviation), and Pk-Pk/2 (peak-to-peak frequency
deviation divided by two).
6
Position
Specifies the horizontal position of the trace on the graph display.
7
Scale
Adjusts the time range of the graph. By decreasing the scale (full-scale time
over 10 divisions), the graph essentially becomes a window that you can
move over the acquisition record by adjusting the horizontal position.
8
Clear
Clears the trace and numeric measurement results.
9
Trace Detection readout
Displays the Settings > Trace > Detection setting.
10
Freq Error
This readout can show Freq Error or Freq Offset. When it displays Freq
Error, it shows the difference between the instrument Frequency setting and
the measured value of the signal's carrier frequency. When it displays Freq
Offset, it shows the frequency offset specified on the Settings > Parameters
tab. If Freq Error is displayed, it also indicates that the Carrier frequency
detection setting is Auto. If Freq Offset is displayed, it indicates that the
Carrier frequency detection setting is manual.
xxx
Changing the FM Settings (see page 89)
FM Settings
Menu Bar: Setup > Settings
Application Toolbar:
The FM Settings control panel provides access to settings that control parameters of the FM Display.
SignalVu-PC Printable Help
89
Analog Modulation
FM Settings
Setting
Description
Parameters (see page 296)
Sets the burst detection threshold, measurement bandwidth, and carrier frequency
detection method.
Trace (see page 92)
Sets Trace display parameters.
Scale (see page 94)
Sets vertical and horizontal scale and position parameters.
Prefs (see page 95)
Specifies whether or not certain display elements are shown. Specifies the maximum
number of points shown in the display graph.
xxx
90
SignalVu-PC Printable Help
Analog Modulation
Parameters Tab
Parameters Tab
The Parameters tab enables you to specify parameters for carrier detection.
Setting
Description
Burst detect threshold
This parameter specifies the power level used to determine whether a burst is present.
A valid burst is required to take measurements. The burst detected first is used for
the analysis. The units for burst detect threshold are dBc, relative to the maximum
acquisition sample data points level.
Measurement BW
Specifies the bandwidth about the center frequency at which measurements are made.
Frequency offset
Displays the carrier signal's offset from the instrument's measurement frequency. Auto is
used to select the method for determining the carrier frequency. When Auto is selected,
the instrument determines the carrier frequency by analyzing the signal. When Auto is
deselected, you can set the carrier frequency offset using Frequency Offset.
Load from Marker
Pressing this button sets the frequency offset to the frequency offset of the selected
marker. (Pressing this button automatically deselects Auto.)
xxx
Frequency Offset
In Auto (Auto is selected), the instrument scans the measurement bandwidth about the measurement
frequency and looks for the highest-powered signal. This is defined as the carrier frequency. In Manual
(Auto is deselected), the carrier frequency is specified by adding/subtracting the specified Frequency offset
from the measurement frequency. Range: -(Measurement BW*1.1)/2 to +(Measurement BW*1.1)/2. If
the Load from Marker button is pressed, the frequency offset is determined from the phase difference
between the two markers on screen compared to the time between the two markers. This function is useful
for removing frequency slope from the phase modulated signal.
Load from Marker
When the Auto check box is selected, the instrument scans the measurement bandwidth about the center
frequency and looks for the highest-powered signal. This is defined as the carrier frequency. When
the Auto check box is deselected, the carrier frequency is specified by adding/subtracting the specified
Frequency offset from the center frequency. Pressing the Load from Marker button loads the marker
frequency into the Frequency offset box.
SignalVu-PC Printable Help
91
Analog Modulation
Trace Tab
Trace Tab
The Trace Tab allows you to set the display characteristics of displayed traces.
Setting
Description
Show
Shows / hides the trace. If the instrument continues to run, the measurement results
below the graph display continue to update even if the trace is hidden.
Detection
Sets the Detection method used for the trace. Available detection methods are +Peak,
-Peak, and Avg (VRMS). Not available for saved traces.
Function
Selects the trace processing method. The only available setting is Normal.
Freeze
Halts updates to the trace.
Save Trace As
Saves the trace to a file for later recall and analysis.
Show Recalled trace
Displays a saved trace instead of a live trace.
xxx
Detection
Detection refers to the method of processing the data acquisition points when creating a trace. The IQ
samples in a data acquisition can be detected in a variety of ways. The number of IQ samples available to
each trace point varies with both analysis length and trace length. For example, with Spectrum Length set
to ‘Auto’ in the Analysis menu, the instrument analyzes just enough samples to produce one IQ sample
pair per trace point. In this case, the detection method chosen has very little effect, as the +Peak, -Peak,
and Avg (VRMS) are all equal. Changing the Spectrum Length causes the available detection methods to
differ in value because they have a larger set of samples for the various detection methods to process.
The available detection methods are:
+Peak – Each point on the trace is the result of detecting the positive peak value present in the set of
IQ samples available to that trace point.
-Peak – Each point on the trace is the result of detecting the negative peak value present in the set of
IQ samples available to that trace point.
Avg (VRMS) [Average VRMS] – Each point on the trace is the result of determining the RMS Voltage
value for all of the IQ samples available to the trace point. When displayed in either linear (Volts,
Watts) or Log (dB, dBm), the correct RMS value results. When the averaging function is applied to a
trace, the averaging is performed on the linear (Voltage) values, resulting in the correct average
for RMS values.
92
SignalVu-PC Printable Help
Analog Modulation
Trace Tab
Trace Processing
Traces can be processed to display in different ways. The Function setting controls trace processing.
Normal - Each new trace is displayed and then replaced by the next trace. Each data point contains a
single vertical value.
Average - Each trace point is computed by averaging together the multiple results points it represents.
+Peak - Each trace point represents the highest vertical value among the results it includes.
–Peak - Each trace point represents the lowest vertical value among the results it includes.
Saving Traces
To save a trace for later analysis:
1. Select the Save Trace As button. This displays the Save As dialog box.
2. Navigate to the desired folder or use the default.
3. Type a name for the saved trace and click Save.
Recalling Traces
You can recall a previously saved trace for analysis or comparison to a live trace.
To select a trace for recall:
1. Click the ... button to display the Open dialog box.
2. Navigate to the desired file and click Open.
3. Check the Show Recalled Trace check box.
4. Verify that the Show check box is selected.
SignalVu-PC Printable Help
93
Analog Modulation
Scale Tab
Scale Tab
The Scale tab allows you to change the vertical and horizontal scale settings. Changing the scale settings
changes how the trace appears on the display but does not change control settings such as Measurement
Frequency. In effect, these controls operate like pan and zoom controls.
Setting
Description
Vertical
Scale
Changes the range shown between the top and bottom of the graph.
Position
Adjusts the frequency shown at the center of the graph.
Autoscale
Resets the Position so that the entire trace fits within the graph.
Horizontal
Scale
Changes the range shown between the left and right sides of the graph.
Position
Adjusts the position of the acquisition record shown at the left edge of the graph.
Autoscale
Resets the Scale and Position settings to provide the optimum display.
xxx
94
SignalVu-PC Printable Help
Analog Modulation
Prefs Tab
Prefs Tab
The Prefs tab enables you to change appearance characteristics of the FM display.
Setting
Description
Show graticule
Shows or hides the graticule.
Show Marker readout in graph
(selected marker)
Shows or hides the readout for the selected marker in the graph area.
Max trace points
The trace in the FM display can be set to a maximum of 100,000 points (however, the
actual number of trace points can extend up to 500,000 points if Max trace points is
set to Never Decimate). If the Analysis Length includes more than the selected Max
trace points value, the trace is decimated (using the method specified with the Detection
control) to be equal to or less than the Max trace points setting (except when Max trace
points is set to Never Decimate). This decimated (or undecimated) trace is what is used
for marker measurements and for results export.
xxx
PM Display
The Phase Modulation Display shows Phase vs. Time. The vertical axis units are degrees and the
horizontal axis units are seconds. When taking measurements, only the first burst in the Analysis period is
analyzed. No trace points are shown for data outside the first detected burst, nor are measurements made
on data outside the first detected burst.
SignalVu-PC Printable Help
95
Analog Modulation
PM Display
Elements of the Display
96
SignalVu-PC Printable Help
Analog Modulation
PM Settings
Item
Element
Description
1
Check mark indicator
The check mark indicator in the upper, left-hand corner of the display shows
when the PM display is the optimized display.
NOTE. When Best for multiple windows is selected in the Amplitude control
panel's RF & IF Optimization control, none of the measurement displays
shows a checkmark, as there is not a single optimized measurement.
2
Top of Graph control
Sets the phase value indicated at the top of the graph. Since the Position
value at the vertical center of this graph remains constant as the Top of Graph
value is adjusted, the Vertical Scale increases as the Top of Graph value
increases, which also affects the bottom of graph readout. Vertical Scale can
also be controlled from the Settings control panel's Scale tab.
3
Position
Specifies the phase shown at the center of the graph display. Changing this
value moves the trace up and down in the graph, which affects the Top of
Graph and Bottom of Graph values as well.
4
Bottom of Graph Readout
Displays the phase value at the bottom of the graph.
5
Measurement readouts
Displays numeric values for the +Pk (positive phase deviation), –Pk (negative
phase deviation), Pk-Pk (peak-to-peak phase deviation), and RMS (RMS
value of the phase deviation).
6
Position
Specifies the horizontal position of the trace on the graph display.
7
Scale
Adjusts the time range of the graph. By decreasing the scale (full-scale time
over 10 divisions), the graph essentially becomes a window that you can
move over the acquisition record by adjusting the horizontal position.
8
Clear
Clears the measurement results.
9
Trace Detection readout
Displays the Trace Detection setting (see Settings > Trace > Detection).
10
Freq Error
This readout can show Freq Error or Freq Offset. When it displays Freq
Error, it shows the difference between the instrument Frequency setting and
the measured value of the signal's carrier frequency. When it displays Freq
Offset, it shows the frequency offset specified on the Settings > Parameters
tab. If Freq Error is displayed, it also indicates that the Carrier frequency
detection setting is Auto. If Freq Offset is displayed, it indicates that the
Carrier frequency detection setting is manual.
xxx
Changing the PM Settings (see page 97)
PM Settings
Menu Bar: Setup > Settings
Application Toolbar:
The PM Settings control panel provides access to settings that control parameters of the PM Display.
SignalVu-PC Printable Help
97
Analog Modulation
Parameters Tab
Setting
Description
Parameters (see page 98)
Sets the Carrier Frequency Detection method. You can choose either Automatic or
Manual. Sets burst threshold and phase detection method.
Trace (see page 99)
Sets Trace display parameters.
Scale (see page 102)
Sets vertical and horizontal scale and position parameters.
Prefs (see page 103)
Specifies whether or not certain display elements are shown. Specifies the maximum
number of points shown in the display graph.
xxx
Parameters Tab
The Parameters tab enables you to specify parameters that control the carrier frequency and phase detection.
98
SignalVu-PC Printable Help
Analog Modulation
Trace Tab
Setting
Description
Burst detect threshold
Specifies the power level used to determine whether a burst is present. A valid burst is
required to take measurements. The burst detected first is used for the analysis. The
units for burst detect threshold are dBc, relative to the maximum acquisition sample
data points level.
Measurement BW
Specifies the bandwidth about the center frequency at which measurements are made.
Frequency offset
Displays the carrier signal's frequency offset from the instrument's Measurement
Frequency. Auto is used to select the method for determining the carrier frequency. When
Auto is selected, the instrument determines the carrier frequency by analyzing the signal.
When Auto is deselected, you can set the carrier frequency offset using Frequency Offset.
Load Δ from Marker
Pressing this button disables the Auto Frequency Offset function and sets the Frequency
offset to the frequency offset calculated from the difference between MR (the marker
reference) and the selected marker (or M1 if MR is currently the selected marker).
Phase offset
Displays the phase offset. When Auto is selected, the instrument determines the phase
offset. When Auto is deselected, the user sets the phase offset with this control.
Load from marker
Pressing this button sets the phase offset to the phase offset of the selected marker.
(Pressing this button automatically deselects Auto.)
xxx
Frequency Offset
In Auto (Auto is selected), the instrument scans the measurement bandwidth about the Measurement
Frequency and looks for the highest-powered signal. This is defined as the carrier frequency. In Manual
(Auto is deselected), the carrier frequency is specified by adding/subtracting the specified Frequency offset
from the Measurement Frequency. Range: -(Measurement BW*1.1)/2 to +(Measurement BW*1.1)/2. If
the Load Δ from marker button is pressed, the frequency offset is determined from the phase difference
between the two markers on screen compared to the time between the two markers. This function is useful
for removing frequency slope from the phase modulated signal.
Phase Offset
In Auto (Auto is selected), the instrument sets the phase offset to fit the waveform to the screen centering
0° phase on the vertical axis. The actual phase offset is indicated on the Phase Offset readout. In Manual
(Auto is deselected), the instrument sets the phase offset using the value specified in Phase offset. For
example, when Phase offset is set to 10°, the waveform shifts upward by 10° on screen. Selecting Load
from marker sets the phase offset to the value of the selected marker. Range: –180 to +180°.
Trace Tab
The Traces Tab allows you to set the display characteristics of displayed traces.
SignalVu-PC Printable Help
99
Analog Modulation
Trace Tab
Setting
Description
Show
Shows / hides the trace. If the instrument continues to run, the measurement results
below the graph display continue to update even if the trace is hidden.
Detection
Sets the Detection method used for the trace. Available detection methods are +Peak,
-Peak, and Avg (VRMS). Not available for saved traces.
Function
Selects the trace processing method. The only available setting is Normal.
Freeze
Halts updates to the trace.
Save Trace As
Saves the trace to a file for later recall and analysis.
Show Recalled trace
Displays a saved trace instead of a live trace.
xxx
Detection
Detection refers to the method of processing the data acquisition points when creating a trace. The IQ
samples in a data acquisition can be detected in a variety of ways. The number of IQ samples available to
each trace point varies with both analysis length and trace length. For example, with Spectrum Length set
to ‘Auto’ in the Analysis menu, the instrument analyzes just enough samples to produce one IQ sample
pair per trace point. In this case, the detection method chosen has very little effect, as the +Peak, -Peak,
and Avg (VRMS) are all equal. Changing the Spectrum Length causes the available detection methods to
differ in value because they have a larger set of samples for the various detection methods to process.
The available detection methods are:
+Peak – Each point on the trace is the result of detecting the positive peak value present in the set of
IQ samples available to that trace point.
-Peak – Each point on the trace is the result of detecting the negative peak value present in the set of
IQ samples available to that trace point.
Avg (VRMS) [Average VRMS] – Each point on the trace is the result of determining the RMS Voltage
value for all of the IQ samples available to the trace point. When displayed in either linear (Volts,
Watts) or Log (dB, dBm), the correct RMS value results. When the averaging function is applied to a
trace, the averaging is performed on the linear (Voltage) values, resulting in the correct average
for RMS values.
Trace Processing
Traces can be processed to display in different ways. The Function setting controls trace processing.
100
SignalVu-PC Printable Help
Analog Modulation
Trace Tab
Normal - Each new trace is displayed and then replaced by the next trace. Each data point contains a
single vertical value.
Average - Each trace point is computed by averaging together the multiple results points it represents.
+Peak - Each trace point is represents the highest vertical value among the results it includes.
–Peak - Each trace point is represents the lowest vertical value among the results it includes.
Saving Traces
To save a trace for later analysis:
1. Select the Save Trace As button. This displays the Save As dialog box.
2. Navigate to the desired folder or use the default.
3. Type a name for the saved trace and click Save.
Recalling Traces
You can recall a previously saved trace for analysis or comparison to a live trace.
To select a trace for recall:
1. Click the ... button to display the Open dialog box.
2. Navigate to the desired file and click Open.
3. Check the Show Recalled Trace check box.
4. Verify that the Show check box is selected.
SignalVu-PC Printable Help
101
Analog Modulation
Scale Tab
Scale Tab
The Scale tab allows you to change the vertical and horizontal scale settings. Changing the scale settings
changes how the trace appears on the display but does not change control settings such as Measurement
Frequency. In effect, these controls operate like pan and zoom controls.
Setting
Description
Vertical
Scale
Changes the range shown between the top and bottom of the graph.
Position
Adjusts the phase shown at the center of the graph.
Autoscale
Resets the Position so that the entire trace in the graph.
Horizontal
Scale
Changes the range shown between the left and right sides of the graph.
Position
Adjusts the phase shown at the left edge of the graph.
Autoscale
Resets the Scale and Position settings to show the entire trace within the graph.
xxx
102
SignalVu-PC Printable Help
Analog Modulation
Prefs Tab
Prefs Tab
The Prefs tab enables you to change appearance characteristics of the PM display.
Setting
Description
Show graticule
Shows or hides the graticule.
Show Marker readout in graph
(selected marker)
Shows or hides the readout for the selected marker in the graph area.
Max trace points
The trace in the PM display can be set to a maximum of 100,000 points (however, the
actual number of trace points can extend up to 500,000 points if Max trace points is
set to Never Decimate). If the Analysis Length includes more than the selected Max
trace points value, the trace is decimated (using the method specified with the Detection
control) to be equal to or less than the Max trace points setting (except when Max trace
points is set to Never Decimate). This decimated (or undecimated) trace is what is used
for marker measurements and for results export.
xxx
SignalVu-PC Printable Help
103
Analog Modulation
104
Prefs Tab
SignalVu-PC Printable Help
RF Measurements
Overview
Overview
The displays in RF Measurements (Displays > Measurements > RF Measurements) are:
CCDF
Channel Power and ACPR
Frequency and Phase Settling Time (Option SVT)
MCPR
Occupied Bandwidth
The RF Measurements power measurements and signal statistics help you characterize components and
systems. With Option 11, the RF Measurements also includes Phase Noise and Jitter Measurements.
Power Measurements
Measurement
Description
Channel Power
The total RF power in the selected channel (located in the ACPR display).
Adjacent Channel Power Ratio
Measure of the signal power leaking from the main channel into adjacent channels.
Multi-Carrier Power Ratio
The ratio of the signal power in the reference channel or group of channels to the power
in adjacent channels.
Peak/Avg Ratio
Ratio of the peak power in the transmitted signal to the average power in the transmitted
signal (located in the CCDF display).
CCDF
The Complementary Cumulative Distribution Function (CCDF). CCDF shows how much
time a signal spends at or above a given power level relative to the average power of
a measured signal.
xxx
Channel Power and ACPR (Adjacent Channel Power Ratio) Display
Use the Channel Power and ACPR measurement to measure channel power by itself, or adjacent channel
leakage ratio with one main channel.
SignalVu-PC Printable Help
105
RF Measurements
Channel Power and ACPR (Adjacent Channel Power Ratio) Display
Measuring Adjacent Channel Power Ratio
1. Recall the acquisition data file you wish to analyze.
2. Select the Displays button.
3. Select RF Measurements from the Measurements box.
4. Double-click Chan Power and ACPR in the Available displays box. Click OK to complete your
selection.
5. Press the front-panel Freq button and use the front panel keypad or knob to adjust the frequency to
that of your main channel.
6. Press the Settings button. This displays the control panel for Chan Power and ACPR (the tab displayed
will be the tab displayed the last time the Settings panel was opened).
7. To set the number of adjacent channels, select the Channels tab. Enter the number of channels in
the Number of adjacent pairs value box. If zero is entered for the number of adjacent pairs, the
resultant measurement will be channel power only.
NOTE. As you add adjacent channels, the span of the display is adjusted so that all the channels can be
seen. Use the horizontal scale and offset to zoom the display in on any portion of the trace.
106
SignalVu-PC Printable Help
RF Measurements
RF Channel Power Measurement
8. To set the spacing between channel centers, enter the required value in the Channel Spacing value box.
9. To set the channel bandwidth, enter the required value in the Channel Bandwidth value box.
10. After you have configured the channel settings, click the close button (
press the Settings button again to remove the settings panel.
) in the Settings panel or
11. Press Replay to take measurements on the recalled acquisiton data.
Viewing Results
Measurement results are displayed in a table below the graph and within the graph itself (which can be
enabled/disabled in the Settings > Prefs tab). To see all measurements, you might need to scroll the
table. The size of the results table can be changed by dragging the horizontal divider bar between the
graph and table areas.
Heading
Description
Channel
Identifies the displayed channels. A1 means the first adjacent channel. A2 means
second adjacent channel. Adjacent channels are numbered according to their offset from
the Main channel. The closest channel is numbered 1. The next closest channel is
numbered 2; and so forth.
Lower
The power measured for the lower adjacent channel. Adjacent channel power
measurements are displayed in dB relative to the Main channel.
Upper
The power measured for the upper adjacent channel. Adjacent channels power
measurements are displayed in dB relative to the Main channel.
Avg Channel Power (Main)
The power measured for the Main channel. The detection type used for measuring
channel power and adjacent channel powers is Average. This means that the average of
the linear (pre-log) samples is used to determine the power. The Main channel power is
displayed in dBm.
xxx
Setting Channel Power and ACPR Settings Parameters (see page 108)
RF Channel Power Measurement
The RF channel power gives an indication of the total average (and other measures) RF power in a given
channel.
For some communications systems, there is an “out-of-service” total power measurement defined in the
specifications that calls for a specified constant modulation. In this case, the output power should be
relatively constant. For many measurements, this may not be the case, and the Power Measurement
results will vary as the signal varies.
SignalVu-PC Printable Help
107
RF Measurements
Channel Power
Average power is the square root of the sum of the squares of the voltage samples over the measurement
time.
The defined “channel” width for the Power Measurement defines the bandwidth and shape of the filter
used to remove any RF power on frequencies outside of the channel bandwidth.
Channel Power
The total RF power in the selected frequency band. The detection type used for measuring channel power
is Average. This means that the average of the linear (pre-log) samples is used to determine the channel
power. To measure channel power, use the ACLR measurement, and set the number of adjacent channels
to zero. This results in only the channel power being measured.
Average Channel Power
The total RF power in the selected channel (located in the ACPR display).
Adjacent Channel Leakage Power Ratio
Adjacent Channel Leakage power Ratio (ACLR) is the ratio of the mean power centered on the
assigned channel frequency to the mean power centered on an adjacent channel frequency. In the 3GPP
specification, both the main channel and adjacent channels are required to be filtered with RRC (Root
Raised Cosine) filters.
Adjacent Channel Power
Measure of the signal power leaking into nearby channels.
Channel Power and ACPR Settings
Menu Bar: Setup > Settings
Application Toolbar:
The settings for the Channel Power and ACPR display are shown in the following table.
108
SignalVu-PC Printable Help
RF Measurements
Channels Tab for ACPR
Settings tab
Description
Freq & RBW (see page 117)
Specify the frequency and resolution bandwidth used for the ACPR measurement.
Measurement Params (see
page 117)
Specify several parameters that control the measurement, such as channel filter, chip
rate, averaging, and correcting for noise floor.
Channels (ACPR) (see
page 109)
This tab specifies the BW and offset parameters of the Channels for the selected ACPR
measurement.
Scale (see page 166)
Specifies the vertical and horizontal scale settings.
Prefs (see page 167)
Specifies whether certain display elements are visible.
xxx
Restore defaults. Sets parameters for a 1-channel WCDMA measurement.
Channels Tab for ACPR
The Channels tab is where you specify parameters for the channels measured in the ACPR display.
Setting
Description
Number of adjacent pairs
Specifies the number of adjacent channel pairs. Range: 1 - 50; Resolution 1.
Channel Bandwidth
Specifies the frequency width of each channel (all channels share the same value).
Channel Spacing
Specifies the difference in frequency between the centers of each channel.
xxx
The following figure illustrates the settings controlled from the Channels tab.
SignalVu-PC Printable Help
109
RF Measurements
Channels Tab for ACPR
Changing the Number of Adjacent Pairs
1. Select Number of adjacent pairs number entry box.
2. Enter a value for the number of adjacent pairs using the knob or the keypad.
NOTE. As you change the value for the number of adjacent pairs, the analyzer will update the spectrum
display to identify the adjacent channels.
3. Select the Close box when you have finished making changes.
Changing the Channel Bandwidth
1. Select the Channel Bandwidth number entry box.
2. Enter a value for the number of adjacent pairs using the knob or the keypad.
NOTE. As you change the value for the number of adjacent pairs, the analyzer will update the display to
indicate the channel bandwidth.
3. Select the Close box when you have finished making changes.
Channel Spacing
1. Select Channel Spacing number entry box.
2. Enter a value for the difference in center frequency between channels using the knob or the keypad.
110
SignalVu-PC Printable Help
RF Measurements
MCPR (Multiple Carrier Power Ratio) Display
NOTE. As you change the value for the number of adjacent pairs, the analyzer will update the display to
indicate the channel bandwidth.
3. Select Close when you have finished making changes.
MCPR (Multiple Carrier Power Ratio) Display
Use the MCPR measurement to measure adjacent channel power ratio for multiple main channels or
when adjacent channel pairs have different offsets and/or bandwidths. The MCPR display show the
Reference Power and the ratio of each adjacent channel to the Reference Power. You can select whether
the Reference Power is the total of all active channels or a single channel.
Measuring Multiple Carrier Power Ratio
1. Recall an appropriate acquisition data file.
2. Press the front-panel Displays button.
3. From the Select Displays window, select RF Measurements or P25 Analysis from the Measurements
box.
4. Double-click the MCPR icon in the Available displays box. Click OK to complete your selection.
5. Press the front-panel Freq button and use the front panel keypad or knob to adjust the frequency to
that of the main channel. Select Meas. Freq to set the measurement frequency. Use the front panel
knob to adjust the frequency.
6. Press the Settings button. This displays the control panel for MCPR (the tab displayed will be the tab
displayed the last time the Settings panel was opened).
7. Click on the Channels tab. To set the number of Main channels, enter the number of Main channels in
the Number text entry box under Main Channels.
NOTE. As you add channels, the span of the display will be adjusted so that all the channels can be seen.
8. To set the bandwidth of all main channels, enter a value in the BW value box.
9. To set the spacing between the main channels, enter a value in the Spacing value box.
SignalVu-PC Printable Help
111
RF Measurements
MCPR (Multiple Carrier Power Ratio) Display
10. To prevent a main channel power level from being included in the Power Reference (Total) calculation,
select the channel to be excluded in the Inactive box.
11. To add adjacent channels, click the Add button under Adj Chans.
12. To edit Frequency Offset or Bandwidth, click within the value box and use the front-panel knob or
your keyboard to set the value. Click Close to save your changes.
NOTE. Frequency Offset is the difference between the center frequency of the selected channel and
the Measurement Frequency. All channels (Main or Adjacent) are specified by their offset from the
Measurement Frequency.
13. To enable and define power limits, check the Enable Power Limits box and enter the desired Upper
and Lower limits. You can read more about power limits here (see page 114).
112
SignalVu-PC Printable Help
RF Measurements
MCPR (Multiple Carrier Power Ratio) Display
14. After you have configured the Main and Adjacent channels, click the close button (
Settings panel or the Settings button to remove the settings panel.
) in the
15. Click the Replay button to take measurements on the recalled acquisition data file.
Viewing Results
MCPR measurement results are displayed both in the spectrum graph and in a table below the spectrum
display. Individual Main channel power measurements appear in the graph under their channel identifiers.
Individual adjacent channel power ratios also appear in the graph under the adjacent channel identifier.
The following table details the entries in the results table.
SignalVu-PC Printable Help
113
RF Measurements
MCPR (Multiple Carrier Power Ratio) Display
Heading
Description
Ch
Identifies the adjacent channels. Adjacent channels are numbered according to their
offset from the Main channel. The closest channel is numbered 1. The next closet
channel is numbered 2; and so forth. The prefix “L” means lower; “U” means upper.
Offset
The offset is the difference in frequency between the Measurement Frequency and the
center frequency of the channel.
Lower
Displays the ratio of the lower adjacent channel power to the Power Reference.
Upper
Displays the ratio of the upper adjacent channel power to the Power Reference.
L. Limit
Displays the lower power limit.
U. Limit
Displays the upper power limit.
Power Reference
Depending on the selected Power Ref, this readout displays either the power of the
selected main channel or the total power in the active main channels.
xxx
Depending on the number of adjacent channels, to see all the measurements, you might need to drag
the divider bar between the main display and the results table at the bottom of the window to change
the height of the results table.
Setting MCPR Measurement Parameters (see page 117)
Setting Power Limits
When power limits are enabled (Settings > Channels > Add), the comparison of the actual results of an
adjacent channel is done against the limits. If there is a failure, the Lower and Upper power cells in the
MCPR table will be red and the failure segments of the trace display will be red. The words Fail in red
will also appear in the top left corner of the display (even if one adjacent band fails). See the following
image for an example.
114
SignalVu-PC Printable Help
RF Measurements
Multiple Carrier Power Ratio
Multiple Carrier Power Ratio
The ratio of the signal power in an adjacent channel to the power in one or more main channels.
MCPR Settings
Menu Bar: Setup > Settings
The Setup control panel tabs for MCPR (Multiple Carrier Power Ratio) are:
SignalVu-PC Printable Help
115
RF Measurements
MCPR Settings
Settings tab
Description
Freq & RBW (see page 117)
Specify the frequency and resolution bandwidth used for the MCPR measurements.
Measurement Params (see
page 117)
Specifies parameters controlling how the MCPR measurement is made.
Channels (see page 119)
Specifies the parameters of the channels to be measured.
Scale (see page 166)
Specifies the vertical and horizontal scale and offset values.
Prefs (see page 167)
Specifies whether or not certain display elements are shown.
xxx
Restore defaults. Sets parameters for a 4-carrier WCDMA measurement.
116
SignalVu-PC Printable Help
RF Measurements
Freq & RBW Tab for ACPR and MCPR Displays
Freq & RBW Tab for ACPR and MCPR Displays
The Freq & RBW tab specifies frequency parameters for the Channel Power & ACPR measurements and
MCPR measurement.
Setting
Description
Meas Freq
Specifies the center/measurement frequency.
Step
The Step control sets the increment/decrement size for the adjustment of the center
frequency. If Auto is enabled, the analyzer will adjust the Step size as required.
RBW
Select Auto or Manual. Adjusts the RBW for the entire measurement. This setting is
Independent of the Spectrum view's RBW setting.
VBW
Adjusts the VBW (Video Bandwidth) value. VBW Maximum = current RBW value. VBW
Minimum = 1/10,000 RBW setting.
xxx
NOTE. While the center frequency and step settings on this control tab are shared between ACPR, MCPR
and Occupied Bandwidth, the RBW setting is not shared. The RBW setting is unique for each measurement.
VBW
The VBW setting enables/disables the Video Bandwidth filter. VBW is used in traditional swept analyzers
to reduce the effect of noise on the displayed signal. The VBW algorithm in the analyzer emulates the
VBW filters of traditional swept analyzers.
The maximum VBW value is the current RBW setting. The minimum VBW value is 1/10,000 of the
RBW setting.
Measurement Params for ACPR and MCPR Displays
The Measurement Params tab is where you set parameters that control the ACPR and MCPR measurements.
SignalVu-PC Printable Help
117
RF Measurements
Measurement Params for ACPR and MCPR Displays
Parameter
Description
Average
Enables/disables measurement averaging. Averaging can be enabled in either the
Frequency Domain or Time Domain.
Frequency-domain
This setting takes the average linear value of the traces (so that rms values are
preserved). The number of averages is user-defined. Frequency domain averaging
is available in spans larger (or smaller) than the maximum real time bandwidth.
This is the mode to use unless you need to extract maximum dynamic range from
an ACPR measurement.
Time-domain
This setting takes the average linear value of the traces. It is useful if you need to
extract maximum dynamic range from an ACPR measurement. The number of traces
is user defined. But, the signals must be triggered and repeating. That is, the signal
needs to be exactly the same for each acquisition. When this condition is met, each
waveform contains the same signal, but the random noise changes from acquisition
to acquisition and the average value of the random noise is lowered, while the signal
value remains constant. Time domain averaging is not available in spans wider
than the maximum real-time bandwidth.
Number
Specifies the number of acquisitions to be averaged when Averaging is set to
Frequency Domain. Specifies the number of successive capture records that are
averaged when Averaging is set to Time Domain.
Power Reference
Specifies power against which the results are compared. Choices available are each
of the existing main channels and “Total (active channels”.
Only present when MCPR is the selected display.
Channel Filter
Specify the channel filter used. Select between None (default) and Root-raised
Cosine.
Filter Parameter
Value entry box for the Root-raised Cosine filter Adjacent Channel Filter.
Present only when the Channel Filter is set to Root-raised Cosine.
Chip Rate
Value entry box for the Root-raised Cosine chip rate.
Present only when the Channel Filter is set to Root-raised Cosine.
xxx
118
SignalVu-PC Printable Help
RF Measurements
Channels Tab for MCPR
Channels Tab for MCPR
Path: Setup > Settings > Channels
Application Toolbar / Front Panel: Settings
The Channels tab is where you specify the parameters for the channels measured in the MCPR display.
Setting
Description
Main Channels
Number
Sets the number of Main channels.
BW
Sets the bandwidth of the Main channels.
Spacing
Sets the frequency difference between the centers of the Main channels.
Inactive
Selected channels are ignored by the measurement routine.
Adj Chans
Add
Opens the Edit Channel Parameters dialog, which you use to specify the parameters of a
new pair of adjacent channels. You can add up to 50 adjacent channel pairs.
Edit
Opens the Edit Channel Parameters dialog box. (You must first select a channel to
enable the Edit button.)
Delete
Deletes the selected main channel or adjacent channel pair.
Channel Definition table
A table of the parameters for every channel. Offset is the frequency difference between
the Center Frequency and center of the selected channel. Nothing in the table is editable
directly. You can set the upper and lower limits by clicking on the Add button.
xxx
The following figure illustrates the settings controlled from the Channels tab.
SignalVu-PC Printable Help
119
RF Measurements
Channels Tab for MCPR
Editing Channel Parameters
To edit the offset or bandwidth of a Main channel:
1. Select the value in the BW or Spacing number entry boxes.
2. Adjust the value as required. All the Main channels share the same BW and Spacing.
3. Select the appropriate check box to make a channel Inactive, as appropriate.
4. Click the Close button when you have finished making changes.
To edit the offset or bandwidth of an Adjacent channel:
1. Select the channel to be edited in the channel definition table.
2. Select Edit. This displays the Edit Channel Parameters dialog box.
3. Adjust the values for the Frequency Offset, Bandwidth, and upper and lower Limits, as required.
4. Click the Close button when you have finished making changes.
Adding Channels
To add a main channel:
1. Select the Number entry box.
2. Use the knob to enter a value for the desired number of Main channels.
3. Click the Close button when you have finished making changes.
To add an adjacent channel pair:
120
SignalVu-PC Printable Help
RF Measurements
Occupied BW & x dB BW Display
1. Select Add. This displays the Edit Channel Parameters dialog box.
2. Use the knob to enter values for the Frequency Offset, Bandwidth, and upper and lower Limits, as
required. The Frequency Offset is measured from the Meas Frequency of the Main channels.
3. Click the Close button when you have finished making changes.
Deleting Channels
To delete a main channel:
1. Select the Number entry box.
2. Use the knob to reduce the number of channels or enter a new value using the front-panel keypad.
3. Click the Close button when you have finished making changes.
To delete an adjacent channel:
1. Select the channel to be deleted in the channel definition table.
2. Select Delete. This removes the selected channel from the channel table.
3. Click the Close button when you have finished making changes.
Occupied BW & x dB BW Display
The Occupied BW display shows the bandwidth within which 99% (a user-defined value, the default is
99%) of the power transmitted within the measurement bandwidth falls.
To show the Occupied BW display:
1. Recall an appropriate acquisition data file.
2. Press the Displays button or select Setup > Displays.
3. In the Select Displays dialog, select RF Measurements in the Measurements box.
4. In the Available displays box, double-click the Occupied Bandwidth icon or select the icon and
click Add. The Occupied Bandwidth icon will appear in the Selected displays box and will no
longer appear under Available displays.
5. Click OK to display the Occupied Bandwidth.
6. Press the Replay button to take measurements on the recalled acquisition data file.
SignalVu-PC Printable Help
121
RF Measurements
Occupied BW & x dB BW Display
Elements of the Display
122
SignalVu-PC Printable Help
RF Measurements
Occupied BW & x dB BW Display
Item
Display element
Description
1
Check mark indicator
The check mark indicator denotes the display for which the acquisition
hardware is optimized. This indictor appears only when the display is the
selected display.
NOTE. When Best for multiple windows is selected in the Amplitude control
panel's RF & IF Optimization control, none of the measurement displays
shows a checkmark, as there is not a single optimized measurement.
2
Averaging readout
Appears when averaging is enabled (Settings > Parameters tab > Average
results). Displays "Avg: n of m" while averaging the results and "Avg: m"
once the requested number of results have been averaged.
3
Autoscale
Adjusts the vertical and horizontal settings so that the entire trace fits in the
graph.
4
Trace function readout
Displays either Normal or MaxHold to indicate trace function.
5
Clear
Resets count for Average and MaxHold functions. Enabled only when
Averaging or MaxHold is enabled. Pressing Clear will clear the trace and, if
acquisition is running, restart the averaging or hold process.
6
Graph
Displays the input signal. Shaded areas indicate the measurement bandwidth
(Settings > Parameters tab > Measurement BW).
7
Blue lines
The blue lines indicate where the selected results (selected in the Main
results area) are being measured on the trace.
8
Grid divider
Determines the portion of the display allocated to the graph and detailed
results area. You can move the grid divider all the way to the top or bottom
and any position in between.
9
Detailed results area
Displays additional measurements results.
10
Position and dB/div
Position sets the top of graph value. The dB/div setting is the vertical scale
value.
11
Main results area
Displays results for Occupied Bandwidth (OBW) and x dB bandwidth. Use
the two radio buttons to select which of the two results are illustrated in the
graph with the blue lines and arrows. There are also controls for adjusting
OBW % Power, x dB BW, and RBW.
12
VBW
Enables the VBW (Video Bandwidth) filter. Displays current VBW filter setting.
See Setup > Settings > Freq & RBW tab (see page 117).
xxx
Detailed Results Readouts
Measurement
Description
Freq Error
The frequency difference between the measured carrier frequency of the signal and the
user-selected center frequency of the analyzer.
OBW Level left
The signal level at the left edge of the occupied bandwidth.
OBW Level right
The signal level at the right edge of the occupied bandwidth.
OBW Ref Power
The total power measured within the measurement bandwidth.
x dB BW Ref Power
The peak power measured within the measurement bandwidth.
xxx
SignalVu-PC Printable Help
123
RF Measurements
Occupied Bandwidth
Changing the Occupied Bandwidth Settings (see page 124)
Occupied Bandwidth
Bandwidth within which some defined percentage of the power transmitted on a single channel lies.
Occupied BW & x dB BW Settings
Menu Bar: Setup > Settings
The control panel tabs for the Occupied Bandwidth display are shown in the following table.
Settings tab
Description
Freq & RBW (see page 162)
Allows you to specify the Center Frequency, Step size and RBW.
Parameters (see page 125)
Allows you to specify the Occupied BW % Power, x dB level, Measurement BW, enable
averaging and the Max Hold function.
Scale (see page 166)
Allows you to set the vertical and horizontal scale parameters.
Prefs (see page 167)
The Prefs tab enables you to set characteristics of the measurement display.
xxx
124
SignalVu-PC Printable Help
RF Measurements
Parameters Tab
Parameters Tab
The Parameters tab enables you to specify parameters that control the Occupied BW measurement.
Setting
Description
Occupied BW % Power
Specifies the proportion of power within the occupied bandwidth (referenced against the
total power in the measurement bandwidth).
x dB level
x dB level defines the x dB BW level search threshold.
Measurement BW
Specifies the frequency range used by the measurement.
Max Hold spectral data
Enables the Max Hold function.
Average results
Enables/disables results averaging. Note that this is not an averaging of the trace, but an
averaging of the results.
Count
Specifies the number of results averaged to calculate the Occupied BW. Range: 2 to
10,000.
xxx
x dB Level
The x dB level determines the x dB BW. The instrument analyzes the spectrum trace to locate the
frequencies at which the level is x dB down from the peak level calculated over the measurement
bandwidth. The frequency difference between the upper and lower crossing thresholds is the x dB BW.
Range: -80.0 to -1.0 dB; Resolution: 0.1%; Inc/dec small: 0.1%, large: 1%; Default: -26 dB
Max Hold Spectral Data
Max Hold displays the maximum value in the acquisition record for each display point. Each new trace
display point is compared to the previous maximum value and the greater value is retained for display
and subsequent comparisons.
SignalVu-PC Printable Help
125
RF Measurements
CCDF Display
CCDF Display
The CCDF (Complementary Cumulative Distribution Function) is a statistical characterization that plots
power level on the x-axis and probability on the y-axis of a graph. Each point on the CCDF curve shows
what percentage of time a signal spends at or above a given power level. The power level is expressed in
dB relative to the average signal power level. The CCDF Display also shows the Average power level
and the Peak/Average ratio.
To show the CCDF display:
1. Recall an appropriate acquisition data file.
2. Press the Displays button or select Setup > Displays. This shows the Select Displays dialog box.
3. From the Measurements box, select RF Measurements.
4. Double-click the CCDF icon in the Available Displays box. This adds the CCDF icon to the Selected
displays box.
5. Click the OK button.
6. Press the Replay button to take measurements on the recalled acquisition data file.
Elements of the CCDF Display
126
SignalVu-PC Printable Help
RF Measurements
CCDF Settings
Item
Display element
Description
1
100%
The top of the graph represents the 100% probability that the signal will be at
or above the average signal level.
2
Power level select
Adjust to display the value of the CCDF curve at a specific power level. The
selected power level is indicated by a small triangle on the CCDF curve.
3
CCDF value
Readout of the value of the CCDF curve at the selected power level.
4
Avg
Readout of the Average power level and the CCDF value at the Average
power level.
5
Readout Table
Readout of the CCDF curve at six points.
6
Pk / Avg
Readout of the Peak to Average power ratio.
7
Measurement time
Readout of the length of time used for the measurement. Displays --- s when
the Measurement time is set to continuous.
xxx
Changing the CCDF Display Settings (see page 127)
CCDF Settings
Menu Bar: Setup > Settings
Application Toolbar:
The control panel tabs for the CCDF Display are shown in the following table.
Settings tab
Description
Parameters (see page 128)
Specifies the time to be measured.
Traces (see page 163)
Select the trace to be measured and select reference trace for display.
Prefs (see page 167)
Specifies whether on not certain display elements are shown.
xxx
Restore defaults. Sets the CCDF parameters to their default values.
SignalVu-PC Printable Help
127
RF Measurements
Parameters Tab
Parameters Tab
The Parameters tab enables you to specify several parameters that control signal acquisition for the
CCDF Display.
Setting
Description
Single
When Single is selected, the CCDF measurement is based on the Analysis Time
parameters set on Analysis control panel (Setup > Analysis > Analysis Time), shared by
all displays. In Single, CCDF is time-correlated with the other open displays.
Total Time
When Total Time is selected, you can adjust its value. The value set here does not affect
the Analysis Length value set in the Analysis control panel. If the Total Time value is
longer than the Analysis Length, CCDF uses multiple acquisitions to collect signal data.
Continuous
When Continuous is selected, the CCDF measurement combines each new record
(Actual Analysis Length) into the existing result. It does not erase and start over until
user presses STOP or CLEAR.
Span
Specifies the range of frequencies used for analysis.
xxx
Single
To have statistically meaningful results, CCDF works best when calculated on at least 1 ms of data.
Depending on the Analysis Time setting, the CCDF display may present error messages:
If the Actual Analysis Time is greater than 1 ms, the CCDF Display will calculate the trace without
any problems.
If the Actual Analysis time is less than 1 ms, the CCDF Display will measure the data as best if
can, but if it receives fewer than 20 samples, the CCDF display will clear the trace and report "Not
enough samples".
Settling Time Measurement Overview
The Settling Time measurement (Option SVT) is used to measure frequency and phase settling time
of frequency-agile oscillators and subsystems. Automated measurements can reduce user-to-user
measurement variations, improve repeatability and measurement confidence, and save time in gathering
results.
128
SignalVu-PC Printable Help
RF Measurements
Settling Time Measurement Overview
Measurement Definitions
Settling time. The time measured from a reference point to when the signal of interest settles to within
user-defined tolerance.
Settled frequency. The final reference frequency, determined automatically or manually. The tolerance
band is centered about this settled frequency.
Settled phase. The final reference phase, determined automatically or manually. The tolerance band is
centered about this settled phase.
Mask Testing
Mask testing is a tool to automatically determine the pass/fail state of the Device-Under-Test. The mask
is defined over three or fewer user-defined time zones, with an independent limit band for each time
zone. If the mask is violated, the area of violation is highlighted in red on screen, and a Fail message is
displayed. The pass/fail status of the mask test can be queried over GPIB for rapid results. To configure
Mask testing, see the Mask tab (see page 145).
The instrument's Search function can watch the Settling Time measurement for either pass or fail results,
and perform actions such as stopping or saving data when the defined condition occurs. See Mask Test
Limits Settings (see page 371) for details on configuring Mask Test.
Frequency Settling Time Theory of Operation
The following paragraphs describe how a frequency and phase settling measurement is made.
SignalVu-PC Printable Help
129
RF Measurements
Settling Time Measurement Overview
Frequency settling time flow diagram
130
SignalVu-PC Printable Help
RF Measurements
Settling Time Measurement Overview
Phase settling time flow diagram
Acquisition hardware collects I and Q samples at the measurement frequency. Sample Rate is based
on the measurement bandwidth setting.
The instantaneous phase is computed as:
SignalVu-PC Printable Help
131
RF Measurements
Settling Time Measurement Overview
The instantaneous frequency is the derivative of the phase:
Data smoothing is applied (if selected by the user). This filtering method uses ±n adjacent samples to
produce an average value that is used to replace the values of the original 2n samples. An example
is shown below.
If averaging is turned on, the smoothed data array is averaged with data arrays of previous acquisitions on
a point-by-point basis. Smoothing has the advantage of reducing noise-like variations in the measurement,
but carries the risk of masking real measurement data. The amount of smoothing applied must be
determined by evaluating the waveform you see for artifacts that result from the process.
Next, Settled Frequency is calculated. Settled frequency is the average frequency determined by looking
back in time from the point set by the Measurement Length control over a minimum of 256 samples. This
value is used to determine the frequency level about which to center the Tolerance range. The measurement
then searches backward through the data until it finds the first point that exceeds the tolerance range. A
maximum of 20 million acquisition data samples can be processed by the measurement.
Settling Time is measured as the time from the start reference to the point where the frequency remains
within the tolerance band. The start reference can be any of three points:
The trigger point
The beginning of the analysis period. This result can only be computed when the instrument can find a
previous settled state within the measurement period
The point at the end of the previous frequency hop where the frequency first leaves the tolerance band.
This result can only be computed when the instrument can find a previous settled state within the
measurement period.
132
SignalVu-PC Printable Help
RF Measurements
Settling Time Displays
Settling time start reference points
All measurements are now complete and the numeric settling time values can be sent to the display.
However, no result traces have been produced yet. Detection is used to reduce the measured points (which
can number up to 10 million) to a number more easily processed by the display processor. +/- Peak
detection is always used, preserving the maximum positive and negative excursions for display. Reducing
the number of points in the result reduces the time resolution of the markers. If averaging is on, the
measurement results are computed on the average of the undecimated results.
Phase Settling Time Overview
Phase settling time is determined, as described previously, with the addition of tilt correction.
The instrument estimates tilt (or slope of the phase) using linear least square fitting over (at least)
256 samples of the phase vs. time waveform, looking backwards from the point set by the Measurement
Length. The instrument adjusts the phase waveform so that its phase is of zero value at the point set
by the Measurement Length.
Settling Time Displays
The Frequency Settling Time measurement is used to measure the frequency settling time of
frequency-agile oscillators and subsystems. The Phase Settling Time measurement is used to measure
the phase settling time of phase-agile oscillators and subsystems. Automated measurements can reduce
user-to-user measurement variations, improving repeatability and measurement confidence and saving
time in gathering results. To measure phase settling, a phase reference is required. This means that the
measurement tool must be frequency- referenced to the device under test, or must act as the frequency
reference to the device under test. To lock the reference to an external source, go to Setup > Configure
In/Out > Frequency Reference and choose External. Values from 1 MHz to 25 MHz in 1 MHz steps
can be used as an external reference.
SignalVu-PC Printable Help
133
RF Measurements
Settling Time Displays
To show a Settling Time display:
1. Recall an appropriate acquisition data file.
2. Click the Displays button or select Setup > Displays.
3. From the Measurements box, select RF Measurements.
4. Double-click the Freq Settling icon or the Phase Settling icon in the Available displays box. This
adds the selected display to the Selected displays box (and removes it from the Available displays box).
5. Click the OK button.
6. Press the Replay button to take measurements on the recalled acquisition data file.
Frequency settling time display
134
SignalVu-PC Printable Help
RF Measurements
Settling Time Displays
Phase settling time display
SignalVu-PC Printable Help
135
RF Measurements
Settling Time Displays
Elements of the Display
Item
Display element
Description
1
Top of graph
Sets the frequency/phase that appears at the top of the graph. However,
note that the top of graph setting, vertical scale setting (Settings > Scale
tab), and Vertical Position settings interact. Adjusting this value changes the
frequency/phase at the top of the graph by adjusting the scale setting.
Phase Settling Time: Sets
2
Vertical Position
Sets the frequency/phase value at the vertical center of the graph.
3
Autoscale
Adjusts the Vertical and Horizontal scaling to display the entire trace on
screen.
4
Horizontal Position
Sets the horizontal position of the trace on the graph.
5
Measurement readouts
Displays measurement results. See Measurement Readout Text Color below.
6
Signal transition start indicator
A blue vertical line that indicates the staring point of the Settling Time
measurement that is based on the signal transition away from the previous
settled state, if a previous settled state is found within the measurement
period.
7
Trigger point indicator
An orange line and “T” (which appears below the graph) that indicates the
location of the trigger point in time.
8
+/- Tolerance indicators
A pair of blue horizontal lines that show the tolerance range.
9
Settled time indicator
A blue vertical bar that shows the point on the trace at which the measurement
has determined the signal frequency or phase to be settled.
10
Measurement length indicator
A magenta vertical line that specifies the end of the allowed measurement
period. This is a control, not a result.
11
Scale
Adjusts the horizontal (time) scale of the graph.
12
Clear
Restarts multi-trace functions (Avg, Hold) and erases the trace.
13
Function
Displays the Detection and Function selections for the selected trace.
(Detection is always +/-Peak for Settling Time measurements.)
14
Show
Controls whether the selected Trace is visible or not. When trace is Off, the
box is not checked.
15
Trace
Selects a trace. Touching here displays a menu that shows the available
traces and whether they are enabled or not. If you select a trace that is not
currently enabled, it will be enabled.
xxx
Measurement Readout Text Color
The measurement readouts can appear in either black text or red text. Measurement results that appear
in black text indicate:
the signal is settled AND
the signal is settled longer than the minimum settled duration AND
the settling time is valid OR the settling time from trigger is valid
If any of the conditions listed are not met, the measurement results text is red.
136
SignalVu-PC Printable Help
RF Measurements
Settling Time Displays
Elements of the Frequency Settling Time Graph
The following illustration shows the various indicators that appear in the Frequency Settling Time graph.
NOTE. The blue vertical bar that indicates the end of the previous settled state may not always appear.
For frequency settling time, this can happen because the starting frequency is outside the measurement
bandwidth.
Elements of the Phase Settling Time Graph
The following illustration shows the various indicators that appear in the Phase Settling Time graph. For
most phase settling time measurements, there is not a previous settled state within the measurement
period, making it impossible to measure the settling time from the previous settled value. However, the
settling time from trigger is typically available.
SignalVu-PC Printable Help
137
RF Measurements
Settling Time Displays
NOTE. The blue vertical bar indicating the measurement start time may not appear. Zero phase is
referenced to the measured hop, as the phase will not typically have a settled value during the previous hop.
Measuring Settling Time
1. Select the Displays button.
2. Select RF Measurements from the Measurements box.
3. Double-click the Freq Settling icon or Phase Settling icon in the Available displays box. Click OK
to complete your selection.
4. Select General Signal Viewing from the Measurements box.
5. Double-click the Time Overview icon in the Available displays box. Click OK to complete your
selection.
6. Press the front-panel Freq button and use the front-panel keypad or knob to adjust the frequency to
that of the signal you want to measure.
138
SignalVu-PC Printable Help
RF Measurements
Settling Time Displays
7. Select the Trig button.
8. In the Trigger control panel, select Triggered. Configure the trigger settings an needed to achieve a
triggered signal.
For the next step in measuring settling time, you must set the starting point of the measurement. To do
this, you will use the Time Overview display.
9. Select the Time Overview display.
10. At the left edge of the graph, drag across the graph to adjust the analysis offset. Adjust the Analysis
Offset to locate the start of the settling time measurement just ahead of the signal transition where
you want to measure the settling time. Any portion of the signal in the gray area will be excluded
from the settling time measurement.
Setting the starting point of the settling time measurement
Even if the signal transition is difficult to see on the Time Overview display, you can set the starting
point based on the location of the Trigger indicator below the graph. Or open the Frequency vs. Time
graph to see the frequency transition.
11. Click in the Settling Time display to select it.
12. Select the Settings button to display the Settling Time Settings control panel.
13. On the Define tab, adjust the Meas BW (see page 142) to improve the signal-to-noise ratio as
appropriate. Make sure the bandwidth covers the settled frequency, particularly when the instrument
Measurement Frequency is not locked to the spectrum Center Frequency (Analysis control panel >
Frequency tab).
14. Set the Target reference (see page 143) to Auto or Meas freq as appropriate. If you select Meas freq,
also set Offset to fine-tune the measurement frequency if necessary.
15. Set the Tolerance (see page 143) as required for your measurement.
If your signal must be settled for a period of time before it is considered settled, you can specify a
minimum settled duration for the settling time measurement.
SignalVu-PC Printable Help
139
RF Measurements
Settling Time Displays
16. Select the Time Params tab. Adjust the Min settled duration (see page 144) as required.
To get the measurement made in the correct location on the signal, you must adjust the measurement
length. You do this by dragging the magenta line in the Settling Time graph.
17. Drag the measurement length indicator (magenta line) to the correct location on the signal. Choose a
point at which the signal appears to be well settled. The measurement will then find the exact time at
which the signal actually settled to within the specified tolerance.
Note the difference in the settling time in the two illustrations that follow. In both examples, the Target
reference is set to Auto. The only difference is the measurement length, as shown by the magenta line.
Frequency settling time display before setting the measurement length
140
SignalVu-PC Printable Help
RF Measurements
Settling Time Settings
Frequency settling time display after setting the measurement length
Settling Time Settings
Application Toolbar:
The settings for the Frequency and Phase Settling Time displays are shown in the following table.
Settings tab
Description
Define (see page 142)
Sets the measurement parameters that characterize the settling time measurement.
Time Params (see page 144)
Sets measurement end-time and minimum settled duration parameters.
Mask (see page 145)
Enable or disables mask testing and sets the parameters that specify the three zones
used for mask testing.
Trace (see page 145)
Specifies trace display characteristics and which traces are displayed.
Scale (see page 166)
Sets vertical and horizontal scale and position parameters.
Prefs (see page 167)
Specifies whether or not to show certain display elements, the maximum number of points
in the exported trace, and the displayed precision of the settling time measurement.
xxx
Settling Time Displays Shared Measurement Settings
The control panel tabs in this section are shared by the Frequency and Phase Settling Time displays. These
control panel tabs are not shared with other RF Measurement displays. With few exceptions, each display
shares values for each of the controls on these tabs. For example, Vertical Scale values are independent for
each of the displays (degrees for Phase Settling Time and Hertz for Frequency Settling Time).
SignalVu-PC Printable Help
141
RF Measurements
Define Tab for Settling Time Displays
Common controls for settling time measurement displays
Settings tab
Description
Define (see page 142)
Specifies the parameters that characterize the settling time measurement.
Time Params (see page 144)
Specifies the Measurement length and minimum settled duration for the settling time
measurement.
Mask (see page 145)
Specifies the parameters used for Mask testing.
Trace (see page 145)
Specify which traces to show and how they are computed.
Scale (see page 148)
Specifies the vertical and horizontal scale settings.
Prefs (see page 149)
Specifies display parameters of the Settling Time displays.
xxx
Define Tab for Settling Time Displays
The Define tab for the Frequency Settling Time measurement controls several parameters that affect
how the measurement is made.
Meas Freq
Select the frequency of the signal to be measured. Measurement Frequency can be selected as the target
frequency (see Target Reference).
NOTE. If Lock Center Frequency of Spectrum Display to Measurement Frequency is unchecked, then
Measurement Frequency is independent of Center Frequency) Range: Entire input frequency of the
instrument
Meas BW
This control limits the bandwidth of the Settling Time measurement. You use the measurement bandwidth
setting to improve the signal-to-noise ratio of the measurement, resulting in lower measurement
uncertainty. However, if the measurement bandwidth is set too low, resulting in fewer samples per second,
it can reduce the number of points within the measurement length below the 256 stable samples required,
thus causing the analysis to fail. The measurement bandwidth depends on the oscilloscope on which the
recalled file was acquired. To see the effect of measurement bandwidth on measurement uncertainty, see
the RSA6100B Series Specifications and Performance Verification Reference, Tektronix part number
077-0647-XX. This manual can be downloaded from www.tek.com/manuals.
142
SignalVu-PC Printable Help
RF Measurements
Define Tab for Settling Time Displays
Target Reference
The target reference is a calculated or user-specified value of final settled frequency within the
measurement period. When set to Auto, the instrument determines this value by averaging at least the last
256 samples at the end of the measurement period. When set to Meas freq, the Target Reference is set to
the Measurement Frequency of the instrument. You can enter a manual offset from the target frequency to
fine-tune the Target Reference when Meas freq is selected.
Tolerance(+/-)
The Tolerance is the frequency or phase range within which the signal must remain to be considered
settled. This is set as a ± value by the user. In the frequency settling time measurement, the tolerance
band is centered about the target value. In the phase settling time measurement, the tolerance band is
centered about the settled phase value.
The target frequency depends on the Target reference value setting:
If Target Reference is set to AUTO, then the target value is the settled value (the frequency at which
the signal is considered settled).
If Target Reference is set to MeasFreq, then the Target value = Meas Frequency + Offset.
Offset
Offset is used for fine-tuning the Target Reference when Meas freq is selected. The value for Offset is
entered manually.
SignalVu-PC Printable Help
143
RF Measurements
Time Params Tab for Settling Time Displays
Time Params Tab for Settling Time Displays
The Time Params tab is used to set the Measurement length and minimum settled duration parameters.
Measurement Length
Measurement length locates the end of the measurement period for settling time. This value is set
independently of the analysis period for other measurements in the analyzer. This allows other
measurements to display multiple frequency hops during an analysis, while focusing the settling time
analysis on a single hop. You can set the measurement length either by entering a value in the entry box, or
by dragging the magenta bar to the desired location in the graph. Traces and the display to the right of
the measurement time are shown in grey to indicate that this section of the waveform is not being used
in the measurement. If your signal does not settle to within your tolerance band, make sure that the
measurement time ends during the settled portion of the waveform. The beginning of the settling time
measurement is set with the analysis offset control, the same as other measurements in the instrument.
Use analysis offset to exclude earlier hops from the measurement. See Analysis Time (see page 377)
for setting the analysis offset control.
If there is more than one phase or frequency hop in the signal to be analyzed, use the Measurement Length
control to instruct the analyzer which hop to measure. First, adjust the main Analysis Offset control to a
point in time slightly earlier than the transition you wish to measure. Do this in the Time Overview display
or the Analysis Settings control panel. Then adjust the Measurement Length so the end of the Settling Time
measurement falls within the apparent settled period after the signal transition. The reason it is important
for the user to set this control is that the Settling Time measurements start at this point and look backwards
in time (towards the signal transition) to find the latest trace point that is not inside the tolerance band.
NOTE. If your signal does not settle to within your tolerance bands, make sure that the measurement time
ends during the settled portion of the waveform.
Min Settled Duration
The minimum settled duration is the amount of time the signal must remain within the tolerance band to be
considered settled. Some user specifications require that the signal be settled for a minimum period. If this
is not required in your application, set this value to the default of 0 seconds.
144
SignalVu-PC Printable Help
RF Measurements
Mask Tab for Settling Time Displays
Mask Tab for Settling Time Displays
The Mask tab is used to specify the parameters used for Mask testing.
Enable Mask Test
Enables or disables mask testing.
Start 1, 2, 3
Sets the starting point for the time zone of interest. If you don't want to use all three zones, set the Start
Time for the unneeded zones to a time after the end of the Measurement Length.
Stop
Sets the end point for the final time zone of interest.
Limit (+/-)
Sets the mask violation limits for each time zone.
Mask Time Reference
When mask testing is enabled, the Mask time reference selection specifies the starting point of the mask.
You can choose to start the mask test at the trigger point or at the point on the trace where the signal began
its transition from its previous settled frequency or phase level to the level you intend to measure.
This capability is useful because some applications do not have a trigger signal available. For those
situations where a trigger signal is available, the specification for the device-under-test may require
that measurements be referenced to that signal.
Trace Tab for Settling Time Displays
The Traces Tab allows you to set the display characteristics of displayed traces.
SignalVu-PC Printable Help
145
RF Measurements
Trace Tab for Settling Time Displays
Smooth
Smooth is a low-pass filter function that uses n points in the trace to determine the smoothed value. For
example, in the case of n=3, 3 consecutive points are averaged to determine the result of the smoothed
output. This is very useful for single-shot signals that contain significant noise where multiple trace
averages cannot be used. However, smoothing does have limits, and the user should visually determine
whether smoothing is removing noise from the measurement, or if it is affecting the signal. The following
illustration shows the effect smoothing has on the displayed trace.
The range for the Smooth function is 2–1000. The setting resolution is 1. The knob increments this value
by 1, and the arrow keys increment it in steps of 1, 2, 5, 10. When smoothing is enabled, it applies
to both traces. Smooth is turned off by default.
Average
This sets the number of acquisitions to be averaged together to produce the result. Averaging reduces
random variations but maintains the correct waveshape for repeating signal aberrations. To use averaging,
the signal must be repetitive. For example, the tuning direction must always be same for each measurement
146
SignalVu-PC Printable Help
RF Measurements
Trace Tab for Settling Time Displays
to be averaged. Signals that vary in tuning direction will tend to average positive-going effects with
negative-going effects and the settling time characteristics will cancel out.
The range for the Average function is 2–1000. The resolution is 1. When averaging is enabled, it applies
to both traces. Average is turned off by default.
Trace
Selects a trace for display. Choices are Trace 1 and 2. Either trace can be a recalled trace.
Saving Traces
To save a trace for later analysis:
1. Select the Save Trace As button. This displays the Save As dialog box.
2. Navigate to the desired folder or use the default.
3. Type a name for the saved trace and click Save.
Recalling Traces
You can recall a previously saved trace for analysis or comparison to a live trace.
To select a trace for recall:
1. Select the trace into which the recalled trace will be loaded, from the Trace drop-down list.
2. Check the Show check box.
3. Click the ... button to display the Open dialog box.
4. Navigate to the desired file and click Open.
5. Check the Show Recalled Trace check box.
6. Verify that the trace's Show check box is selected (either on this tab or next to the drop-down list
located at the top-left corner of the graph).
SignalVu-PC Printable Help
147
RF Measurements
Scale Tab for Settling Time Displays
Scale Tab for Settling Time Displays
The Scale tab allows you to change the vertical and horizontal scale settings. Changing the scale settings
changes how the trace appears on the display but does not change control settings such as Measurement
Frequency. In effect, these controls operate like pan and zoom controls.
Setting
Description
Vertical
Scale
Changes the vertical scale or span of the graph.
Position
Sets the frequency (or phase) at the vertical center of the graph.
Relative Freq
Autoscale
Sets the vertical (position) display readouts to show frequency values relative to the
center frequency or as absolute values.
Resets the Scale and Position to center the trace in the graph.
Horizontal
Scale
Sets the range of time shown in the graph.
Position
Allows you to pan the graph left and right.
Autoscale
Resets Scale and Position to the automatically determined settings.
xxx
148
SignalVu-PC Printable Help
RF Measurements
Prefs Tab for Settling Time Displays
Prefs Tab for Settling Time Displays
The Prefs tab allows you to change display parameters of the Settling Time displays.
The following table explains the controls that can appear on the Prefs tab.
Setting
Description
Max trace points
Sets the number of trace points used for marker measurements and for results export.
Show graticule
Select to display or hide the graticule.
Show Marker readout in graph
(selected marker)
Shows or hides the readout for the selected marker in the graph area.
Settling Time decimal places
Specifies the precision of the settling time measurement readout that appears below the
graph. This setting does not affect the precision of internal calculations.
xxx
SEM Display
The SEM (Spectrum Emission Mask) display measures out-of-band emissions immediately outside the
channel bandwidth that result from the modulation process and non-linearity in the transmitter. The
Spectrum Emission Mask display allows you to define up to six pair of masks, or offsets, that specify the
limits for out-of-band emissions and performs a pass/fail tests of the signal against the defined offsets
and limits.
To show the Spectrum Emission Mask display:
1. Recall an appropriate acquisition data file.
2. Select Displays or select Setup > Displays.
3. In the Select Displays dialog, select RF Measurements or WLAN Analysis in the Measurements box.
4. In the Available displays box, double-click the SEM icon or select the icon and click Add. The SEM
icon will appear in the Selected displays box and will no longer appear under Available displays.
5. Click OK to show the Spectrum Emission Mask display.
6. Press the Replay button to take measurements on the recalled acquisition data file.
SignalVu-PC Printable Help
149
RF Measurements
150
SEM Display
SignalVu-PC Printable Help
RF Measurements
SEM Display
Elements of the Display
Item
Display element
Description
1
Check mark indicator
Indicates the display for which the acquisition hardware is optimized.
NOTE. When Best for multiple windows is selected in the Amplitude control
panel's RF & IF Optimization control, none of the measurement displays
shows a checkmark, as there is not a single optimized measurement.
2
Top-of-graph setting
Sets the level that appears at the top of the graph.
3
dB/div
Sets the vertical scale value. The maximum value is 20.00 dB/division.
4
Bottom-of-graph readout
Indicates the amplitude at the bottom of the graph. This value changes with
the dB/div and Vertical Position settings.
5
Autoscale
Properly offsets the peak of the display from the top of the screen.
If the screen has been enlarged through a manual vertical (dB/div) setting
entry, the view is not vertically rescaled when Autoscale is used.
6
CF / Pos
Default function is CF - center frequency (equivalent to the Measurement
Freq setting). If Horizontal scaling has been manually adjusted in Setup >
Settings > Scale, then Pos replaces CF as the setting at the bottom-left
corner of the screen. Adjusting Pos shifts the trace left or right in the graph,
but does not change the measurement frequency.
7
Span / Scale
Default function is Span - frequency difference between the left edge of
the display and the right edge. If Horizontal scaling has been manually
adjusted in Settings > Scale, then Scale will replace Span as the setting at
the bottom-right corner of the screen.
8
Clear
Erases the current results from the display.
9
Function readout
Readout of the Function selection for the Reference channel (Setup >
Processing > Function).
Spurious
10
Detection readout
Readout of the Detection selection for the Reference channel (Setup >
Processing > Detection).
11
Pass / Fail readout
Readout indicating whether any part of the trace has exceeded the any of
the limits defined in the Offsets & Limits table (Setup > Settings > Offsets
& Limits Table).
xxx
Pass / Fail Readout
This readout displays either Pass or Fail XX%. When the signal exceeds the mask in any offset, it is
considered a mask violation, and results in Fail XX% being displayed. If there are no mask violations,
Pass is displayed.
How the fail percentage is determined. Each offset has two sides, one lower and one upper. For example,
Offset A has two sides: AL (lower side) and AU (upper side). In the SEM display, there is a maximum of
six offsets (A-F) and each offset can have a maximum of two sides (if Both is selected for Side in the Offsets
& Limits table). This results in a total of six offsets multiplied by two sides per offset, which results in 12
offsets. Mask violations can occur in any of these offsets. The failure percentage is calculated as follows:
Fail percentage = Number of offsets with mask violations x 100 / Total number of enabled offsets
SignalVu-PC Printable Help
151
RF Measurements
SEM Display
For example: Assume there are three enabled offsets: A, B, C, and all these offsets have both lower and
upper sides. Thus, the total number of enabled offsets is equal to six. Suppose there are mask violations
in the offsets AL and CU, then the number of offsets having mask violations is equal to 2. Therefore,
Fail percentage = 2 * 100 / 6 = 33%.
Results Display
The Results Display shows the measurement results for the SEM display.
Readout
Description
Ref:
A two-part readout to the left of the table that displays information about the
Reference Channel. The first part of the readout displays the Measurement Type
selected on the Parameters tab. The second part of the readout displays the
measurement result for the Reference channel.
Row
A sequence number for ordering the offsets. Click to organize by row number,
resort rows from high to low or low to high.
Offset
The Offset name. A combination of the offset (A-F) and the location (U for upper
and L for Lower).
Start Freq
The start frequency of the offset (relative to the Measurement Freq).
Stop Freq
The stop frequency of the offset (relative to the Measurement Freq).
Peak Abs
Absolute power peak power at worst case margin of the offset
Margin Abs
The worst case difference between the trace and the absolute limit line. Note that
an offset can have different start and stop levels, thus, the margin can vary if the
offset start and stop levels are different.
Peak Rel
Relative peak power of worst case margin of the offset. Relative with respect
to the reference power level.
Margin Rel
The worst-case difference between the trace and the relative limit line. Because
an offset can have different start and stop levels, the margin can vary if the offset
start and stop levels are different.
@Freq
The frequency at which the worst margin occurs.
Integ Abs
The absolute integrated power of the offset.
Integ Rel
The relative integrated power of the offset (with respect to the reference power).
xxx
Reordering results in the results table. You can sort the results in the Results table by clicking the column
heading containing the values you want to sort on. You can sort results for the following columns: Row,
Offset, Start Frequency, Stop Frequency, Peak Abs, and Peak Rel.
152
SignalVu-PC Printable Help
RF Measurements
Spectrum Emission Mask Settings
Rearranging columns in the results table. You can rearrange the order of the columns and their size. To
rearrange columns, select the column heading you want to move and drag it to the new position; the new
location is indicated by a dark blue bar that appears between column headings.
You can resize the columns by selecting the divider between columns and dragging it to a new position.
Spectrum Emission Mask Settings
Application Toolbar:
The settings for the Spectrum Emission Mask display are visible when SEM is the selected display. To
display the SEM Settings, select Setup > Settings.
Settings tab
Description
Parameters Tab (see
page 153)
Specifies several characteristics that control how the measurement is made.
Processing Tab (see page 156)
Specifies settings for detection on the Reference channel and the offsets. Specifies
the function setting.
Ref Channel Tab (see
page 157)
Specifies how the measurements on the reference channel are performed.
Offsets & Limits Table (see
page 157)
Specifies characteristics of offsets and mask limits.
Scale Tab (see page 160)
Specifies the vertical and horizontal scale settings.
Prefs Tab (see page 161)
Specifies the appearance features of the graph area and the maximum trace points.
Standards Presets (see
page 14) button
Click this button to access the Standards Presets options dialog window. You can select
the standard and bandwidth to apply to the standard you select. Click on the link to the
left for information about standards presets.
xxx
Parameters Tab - SEM
The Parameters tab specifies several characteristics that control how the Spectrum Emission Mask
measurements are made.
SignalVu-PC Printable Help
153
RF Measurements
Parameters Tab - SEM
Setting
Description
Meas Freq
Specify the frequency of the signal to be measured.
Step
Sets the increment size when changing the Frequency using the knob or mouse wheel.
Auto
When Auto is enabled, the step size is adjusted automatically based on the span setting.
Real-Time
When Real-Time mode is enabled, the entire SEM span is measured using a
real-time/contiguous acquisition. Not all described parameters are available in Real-Time
mode.
Noise correction controls
NOTE. The following two noise correction controls are only available when SignalVu-PC
is connected to an MDO4000B instrument.
Measure Noise floor
Takes preliminary acquisitions to measures the instrument noise floor. This initiates a
noise correction. A noise correction signal is created by switching off the RF input to
the MDO4000B and performing acquisitions of the instrument’s internal noise. Fifty
acquisitions are averaged to create the noise reference signal. The noise reference
signal is measured for the Reference channel and each Offset is defined by the
measurement settings.
Apply noise correction
This item is enabled and the check box automatically checked after the noise reference
signal is taken when the Measure Noise floor button is clicked. This initiates noise
reference subtraction from the incoming signal power for each region to create the
corrected result. All calculations are performed in Watts and then converted to the
desired units.
The amount of noise correction is limited to 20 dB to avoid the possibility of a negative
power measurement. This is a rare condition that could occur if the subtraction of the
reference power from the channel power results in a negative value (or “infinite” dBm).
The noise reference for a region is subtracted from each trace point in the channel,
rather than offsetting the entire region by a single amount. This produces a smooth trace
with no discontinuities at the region edges.
NOTE. If any relevant settings (such as reference level, frequency, span, RBW) are
changed once the noise reference is measured, the following warning message will be
displayed to notify you that Noise Correction was not applied:
Noise correction not applied - select Measure Noise Floor for new noise correction.
Measurement Type
Total Power
Sets the reference to the integrated power of the reference channel within the reference's
integration bandwidth.
PSD
Sets the reference to the mean of the power spectral density (dBm/Hz) of the reference
channel. The trace and the absolute and relative limits line are also in dBm/Hz
Peak
Sets the reference to the Peak power of the reference channel.
Offset definition
154
Specifies the type of measurement for the reference channel; used as a reference for
the offsets.
Defines the relative position of the start/stop frequency of an offset. Choose the offset
definition based on the standard.
Ref center to OS center
Specifies that the start/stop frequencies are defined from the center frequency of the
reference channel to the center of the filter BW.
Ref center to OS edge
Specifies that the start/stop frequencies are defined from the center frequency of the
reference channel to the center of the (inner) edge of the filter BW of the offset.
Ref Edge to OS center
Specifies that the start/stop frequencies are defined from the edge of the reference
channel to the center of the filter BW of the offset.
SignalVu-PC Printable Help
RF Measurements
Setting
Ref Edge to OS edge
Filter Shape
Parameters Tab - SEM
Description
Specifies that the start/stop frequencies are defined from the edge of the reference
channel to the (inner) edge of the filter BW of the offset.
Specifies the shape of the filter determined by the window that is applied to the data
record, in the spectrum analysis, to reduce spectral leakage. 3GPP specifies a Gaussian
window shape be applied to the reference channel measurements.
Gaussian
This filter shape provides optimal localization in the frequency domain.
Rectangular
This filter shape provides the best frequency, worst magnitude resolution. This is
essentially the same as no window.
xxx
SignalVu-PC Printable Help
155
RF Measurements
Processing Tab - SEM
Processing Tab - SEM
The Processing tab controls the Detection settings for the Reference Channel and Offsets, as well as
selecting the Function.
Settings tab
Description
Detection (in each sweep)
Ref Channel
Specifies the Detection method used for the Reference Channel. Detection is used to
produce the desired measurement result (peak or average) and to reduce the results
of a measurement to the desired number of trace points.
Avg (VRMS)
For each sweep, each point of the trace is the result of determining the RMS voltage
value for the last 'n counts' of the collected traces for the same point. When 'n count' has
not been reached, partial averaging results are displayed.
+Peak
Selects the +Peak detection method. With this method, the highest value is selected from
the results to be compressed into a trace point.
Offsets
Specifies the detection method used for the offsets.
Avg (VRMS)
Selects the Average Vrms detection method. With this method, each point on the trace
in each offset is the result of determining the RMS Voltage value for all of the results
values it includes.
+Peak
Selects the +Peak detection method. With this method, the highest value in each offset is
selected from the results to be compressed into a trace point.
Function (across multiple sweeps)
Function
Selects the trace processing method. Available settings are: Normal, Avg (VRMS),
and Hold.
Normal
When a new trace has been computed, it replaces the previous trace.
Max Hold
With each sweep, each trace point in the new trace is compared to the point’s value in
the old trace and the greater value is retained for display and subsequent comparisons.
Avg (VRMS)
For each sweep, each point on the trace is the result of determining the RMS Voltage
value for all of the collected traces' values for the same point.
xxx
156
SignalVu-PC Printable Help
RF Measurements
Ref Channel Tab
Ref Channel Tab
The Ref Channel tab controls how the measurement of the Reference channel is performed.
Settings tab
Description
Power Reference
The value used to calculate relative measurements.
Auto
When Auto is unchecked, you can enter a value for the reference power, and the
measured reference power is not used or displayed
RBW
Sets the RBW for the Reference Channel.
VBW
Enables/disables the Video Bandwidth filter. VBW is used in traditional swept analyzers
to reduce the effect of noise on the displayed signal. The VBW algorithm in the analyzer
emulates the VBW filters of traditional swept analyzers. When the checkbox next to
VBW is not checked, the VBW filter is not applied. SEM standards specify what value of
VBW should be applied, if any.
Channel width
Specifies the width of the reference channel.
Integration BW
Specifies the integration bandwidth used to compute the total power in the reference
channel.
Channel Filter
Specifies the measurement filter used in the Reference Channel. Choices are None
and Root-raised Cosine.
Filter param
Specifies the alpha value (or roll-off factor) of the Root-raised cosine filter. Present only
when Channel Filter is set to Root-raised Cosine.
Chip rate
Specifies the chip rate used for the Root-raised Cosine filter. Present only when Channel
Filter is set to Root-raised Cosine.
xxx
Offsets & Limits Table Tab - SEM
The Offsets & Limits Table tab is used to specify parameters that define Offsets and masks.
SignalVu-PC Printable Help
157
RF Measurements
Offsets & Limits Table Tab - SEM
Expanded display of Offsets & Limits Table
158
SignalVu-PC Printable Help
RF Measurements
Setting
Offsets & Limits Table Tab - SEM
Description
Buttons
Expand
Displays the Offsets & Limits Table in a new, resizeable window.
Reset Layout
You can reorder columns in the Offsets & Limits Table by dragging the columns to a new
position. Clicking Reset Layout returns the column order to the factory default order.
Load
Click to load a saved Offsets & Limits table from a file.
Save As
Click to save the current Offsets & Limits table to a file.
Done
When the table is expanded, click Done when you have finished editing the table to save
your changes and close the expanded table display.
Table columns
On
Specifies whether or not measurements are taken in the specified offset.
Start (Hz)
Start Frequency of the selected offset.
Stop (Hz)
Stop Frequency of the selected offset.
Side
Specifies whether the specified range appears on both side of the carrier frequency or
just one side (left or right).
RBW (Hz)
Specifies the RBW for the selected range.
n (RBWS)
An integer value that specifies how many times to multiply the RBW to set the Filter
bandwidth.
Filter BW (n x RBW)
Displays the Filter BW. Filter BW is the equivalent BW of each point in the offset. When
n > 1, an integration technique is used to achieve the Filter BW using narrower RBWs.
For most SEM measurements, this value is set to 1. The 3GPP standard suggests n
greater than 1.
VBW (Hz)
Adjusts the VBW (Video Bandwidth) value. VBW Maximum: RBW current value; VBW
Minimum: 1/10,000 RBW setting.
VBW On
Specifies whether the VBW filter is applied.
Mask
Select the type of limits used for Pass/Fail testing. Signal excursions that exceed the
mask settings are considered violations. The available choices are shown below.
Abs Start (dBm)
Specifies the mask level at the inner edge of the selected offset.
Abs Stop (dBm)
Specifies the mask level at the outer edge of the selected offset.
Abs Same
Specifies whether the value for the inner and outer edges of the offset must be the same
value. When enabled, the Abs Stop cell is grayed-out and set to the value of the Abs
Start cell.
Rel Start (dBm)
Specifies the mask level for the Relative mask at the inner edge of the selected offset.
Rel Stop (dBm)
Specifies the mask level for the Relative mask at the outer edge of the selected offset.
Rel Same
Specifies whether the inner and outer edges of the offset must be the same value.
When enabled, the Rel Stop cell is grayed-out and its value is set to the value of the
Rel Start cell.
xxx
SignalVu-PC Printable Help
159
RF Measurements
Scale Tab - SEM
Scale Tab - SEM
Use the Scale tab to change the vertical and horizontal scale settings. Changing the scale settings changes
how the trace appears on the display. In effect, these controls operate like pan and zoom controls.
Setting
Description
Vertical
Controls the vertical position and scale of the trace display.
Scale
Changes the vertical scale units.
Position
Adjusts the reference level away from top of the graph.
Autoscale
Resets the scale of the vertical axis to contain the complete trace.
Horizontal
Controls the span of the trace display and position of the trace.
Scale
Specifies the frequency range displayed in the graph
Position
Specifies the frequency shown at the center of the graph.
Autoscale
Resets the scale of the horizontal axis to optimize the display of the trace.
Reset Scale
Resets all settings to their default values.
xxx
160
SignalVu-PC Printable Help
RF Measurements
Prefs Tab - SEM
Prefs Tab - SEM
The Prefs tab enables you to change parameters of the measurement display. The parameters available on
the Prefs tab vary depending on the selected display, but include such items as enabling/disabling Marker
Readout, switching the Graticule display on/off, and Marker Noise mode. Some parameters appear with
most displays while others appear with only one display.
Setting
Description
Show graticule
Controls the vertical position and scale of the trace display.
Max Trace points (per range)
When the spectrum analysis produces more than the selected maximum number of
points, the method specified in Detection control is used to decimate the result. This
setting applies to both the Reference channel and offsets.
Show Marker readout in graph
Adjusts the reference level away from top of the graph.
Show limits
Controls the appearance of mask limits in the graph.
Shaded
Shows limits using a shaded area. Green shading is used to identify Absolute limits. Blue
shading is used to indicate Relative limits.
Line only
Shows limits using only a line. A green line is used to identify Absolute limits. A blue line
is used to indicate Relative limits.
None
No lines or shading are used to indicate limits in the graph. Violations of the mask are still
identified by red shading.
xxx
RF Measurements Shared Measurement Settings
The control panel tabs in this section are shared by multiple displays in the RF Measurement folder (Setup
> Displays). With few exceptions, each display maintains separate values for each of the controls on these
tabs. For example, Scale values are independent for each of the displays.
SignalVu-PC Printable Help
161
RF Measurements
Freq & RBW Tab
Common controls for RF measurement displays
Settings tab
Description
Freq & RBW (see page 162)
Allows you to specify the Center Frequency, Step size and RBW.
Traces (see page 163)
Specifies trace parameters such as detection method and whether smoothing in enabled.
Traces can also be saved and loaded for reference from this tab.
Scale (see page 166)
Specify vertical and horizontal scale settings.
Prefs (see page 167)
Specify appearance features of the graph area.
xxx
Freq & RBW Tab
The Freq & RBW tab specifies frequency parameters for some of the RF Measurements displays.
Setting
Description
Meas Freq
Specifies the measurement frequency.
Step
The Step control sets the increment/decrement size for the adjustment of the center
frequency. If Auto is enabled, the analyzer will adjust the Step size as required.
RBW
Select Auto or Manual. Adjusts the RBW for the entire measurement. This setting is
Independent of the Spectrum view's RBW setting.
VBW
Adjusts the VBW (Video Bandwidth) value.
xxx
NOTE. While the measurement frequency and step settings on this control tab are shared between ACPR,
MCPR and Occupied Bandwidth, the RBW setting is not shared. The RBW setting is unique for each
measurement.
VBW
The VBW setting enables/disables the Video Bandwidth filter. VBW is used in traditional swept analyzers
to reduce the effect of noise on the displayed signal. The VBW algorithm in the analyzer emulates the
VBW filters of traditional swept analyzers.
The maximum VBW value is the current RBW setting. The minimum VBW value is 1/10,000 of the
RBW setting.
162
SignalVu-PC Printable Help
RF Measurements
Traces Tab
Traces Tab
The Traces tab enables you to select traces for display. You can choose to display live traces and/or
recalled traces. The Trace tab (see page 145) for Settling Time displays is described in the Settling Time
controls section.
NOTE. Not all RF Measurements support multiple traces and/or save and recall of traces.
Setting
Description
Trace
Selects a trace for display. Choices are Trace 1, 2, and Gaussian (CCDF display only).
Trace 1 and 2 can be recalled traces.
Show
Shows / hides the selected trace.
Freeze
Halts updates to the selected trace.
Save Trace As
Saves the selected trace to a file for later recall and analysis.
Show recalled trace
Used to select a saved trace for display.
Detection (Phase Noise only)
Sets the Detector used for the trace. Only +/- Peak and Avg (VRMS) are available for the
Phase Noise display. This setting is not available for saved traces. +/-Peak detection
results in a trace with two Y values for each X location, with shading between.
Function
Selects the trace processing method (Spurious display only). Possible settings are:
Normal, Average (VRMS), Avg (of logs), and Max Hold.
Smoothing (Phase Noise only)
When enabled, diminishes point-to-point trace variations. Smoothing +/- Peak traces
treats + and - lines independently. The smoothing value adjusts how many points are in
each filter set. Range: 1 - 20; Default: 5.
xxx
Trace Processing
The trace can be processed to display in different ways. The Function setting controls trace processing.
Max Hold - Displays the maximum value in the trace record for each display point. Each new trace
display point is compared to the previous maximum value and the greater value is retained for display
and subsequent comparisons.
Normal - Displays the trace record for each display point without additional processing.
Avg (VRMS) [Average VRMS] – Each point on the trace is the result of determining the RMS Voltage
value for all of the IQ samples available to the trace point. When displayed in either linear (Volts,
SignalVu-PC Printable Help
163
RF Measurements
Traces Tab
Watts) or Log (dB, dBm), the correct RMS value results. When the averaging function is applied to a
trace, the averaging is performed on the linear (Voltage) values, resulting in the correct average
for RMS values.
Avg (of logs) – This is a trace function used to emulate legacy spectrum analyzer results and for the
specification of displayed average noise level. In older swept analyzers, a voltage envelope detector is
used in the process of measuring signal level, and the result is then converted to Watts and then to
dBm. Averaging is then applied to the resultant traces.
For CW signals, this method results in an accurate power measurement. However, with random noise
and digitally modulated carriers, errors result from this 'average of logs' method. For random noise,
the average of logs methods results in power levels -2.51 dB lower than that measured with a power
meter, or with a spectrum analyzer that measures the rms value of a signal, and performs averaging on
the calculated power in Watts and not dBm or other log-power units.
This detector should be used when following a measurement procedure that specifies it, or when
checking the Displayed Averaged Noise Level (DANL) of the instrument. The 'average of logs'
detection and trace function is used for DANL specification to provide similar results to other
spectrum/signal analyzers for comparison purposes. Use of the Average of Logs method of
measurement is not recommended for digitally modulated carriers, as power measurement errors
will occur.
NOTE. The Detection setting does not affect the trace until the spectrum length is longer than the Auto
setting.
Saving Traces
To save a trace for later analysis:
1. Select the Save Trace As button. This displays the Save As dialog box.
2. Navigate to the desired folder or use the default.
3. Type a name for the saved trace and click Save.
Recalling Traces
You can recall a previously saved trace for analysis or comparison to a live trace.
To select a trace for recall:
1. Select the trace into which the recalled trace will be loaded, from the Trace drop-down list.
2. Check the Show check box.
3. Click the ... button to display the Open dialog box.
164
SignalVu-PC Printable Help
RF Measurements
Traces Tab
1. Navigate to the desired file and click Open.
2. Check the Show Recalled Trace check box.
3. Verify that the trace's Show check box is selected (either on this tab or next to the drop-down list
located at the top-left corner of the graph).
Gaussian Trace
The Gaussian trace is a reference trace that you can compare your trace against. Because the Gaussian
trace is for reference, there are no settings for the trace other than whether or not it is shown.
SignalVu-PC Printable Help
165
RF Measurements
Scale Tab
Scale Tab
The Scale tab allows you to change the vertical and horizontal scale settings. Changing the scale settings
changes how the trace appears on the display but does not change control settings such as Center Frequency.
Setting
Description
Vertical
Controls the vertical position and scale of the trace display.
Scale
Changes the vertical scale units. This is only accessible when the vertical units are
set to dBm.
Offset
Adjusts the Reference Level away from the top of the trace display.
Autoscale
Resets the scale of the vertical axis to contain the complete trace.
Horizontal
Controls the span of the trace display and position of the trace.
Scale
Allows you to, in effect, change the span.
Offset
Allows you to pan a zoomed trace without changing the Measurement Frequency. Offset
is only enabled when the span, as specified by Freq / div, is less than the acquisition
bandwidth.
Autoscale
Resets the scale of the horizontal axis to contain the complete trace.
Log (Spurious only)
Resets the display to show the frequency axis in a logarithmic scale.
xxx
166
SignalVu-PC Printable Help
RF Measurements
Prefs Tab
Prefs Tab
The Prefs tab enables you to change parameters of the measurement display. The parameters available on
the Prefs tab vary depending on the selected display, but include such items as enabling/disabling Marker
Readout, switching the Graticule display on/off, and Marker Noise mode. Some parameters appear with
most displays while others appear with only one display.
Setting
Description
Show graticule
Shows or hides the graticule.
Show Marker readout in graph
(selected marker)
Shows or hides the readout for the selected marker in the graph area.
Max trace points
In general, time-domain traces can include up to 100K points and frequency-domain
traces can include up to 10K points. When the analysis produces a results array longer
than the selected trace length, the trace is decimated (using the method specified with
the Detection control) to be equal to or less than the Max trace points setting (except
when Max trace points is set to Never Decimate). This decimated (or undecimated) trace
is what is used for marker measurements and for results export.
Settling Time decimal places
(Frequency and Phase Settling
Time displays only)
Specifies the number of decimal places shown in the results readout below the graph.
This setting does not affect the precision of internal calculations.
Show trace legend (Phase
Noise display only)
Displays or hides the trace legend.
xxx
SignalVu-PC Printable Help
167
RF Measurements
168
Prefs Tab
SignalVu-PC Printable Help
WLAN Measurements
WLAN Overview
WLAN Overview
The WLAN Analysis option allows you to evaluate WLAN signals, performing standards based
transmitter measurements in the time, frequency, and modulation domains. WLAN measurements can
be made on signals defined by 802.11a/b/g/j/n/p (standard IEEE 802.11-2012) and 802.11ac (draft IEEE
P802.11ac-D4.0 or later). User controls allow you to modify signal parameters for analysis of signals.
The analysis results give multiple views of WLAN signal characteristics to allow the diagnosis of signal
imperfections and impairments quickly and easily. Display controls allow you to selectively display the
analysis results to help locate trouble-spots in the signal.
WLAN Standards
The following options support the given standards:
Option SV23: Supports IEEE 802.11a, g, j, and p OFDM signals and 802.11b DSSS/CCK signals
Option SV24: Supports IEEE 802.11n signals with bandwidths of 20 MHz and 40 MHz
Option SV25: Supports IEEE 802.11ac signals with bandwidths of 20, 40, 80, and 160 MHz
WLAN Standards Presets
The Standards Presets button located on the WLAN Settings Control Panel allows you to recall
preconfigured displays for the standards and bandwidths that you select. You can also access these presets
from Presets on the display menu bar. You can read more information about the Standards Presets (see
page 13).
The following table shows the center frequency and displays that are automatically loaded for each of the
listed standards and bandwidths. SEM masks are also loaded and are explained here (see page 251).
SignalVu-PC Printable Help
169
WLAN Measurements
WLAN Overview
Table 1: WLAN presets standards, bandwidths, center frequencies, and displays
Center
frequency
(GHz)
Standard
Bandwidth
(MHz)
802.11a
20
5.18
802.11g
20
2.412
802.11j
10
5.18
Displays loaded
SEM, Time Overview, WLAN Constellation, WLAN
Summary
20
802.11p
5
5.8
10
20
802.11n
20
2.412
40
802.11ac
20
5.18
40
5.19
80
5.21
160
5.25
802.11b
2.412
xxx
SEM mask parameters. The SEM wireless standard masks that are applied to the WLAN signal depend on
the standard you select when you configure the preset. Once you select a standard and bandwidth, the
application will automatically load the mask that best fits the signal for which the standard applies. All
mask parameters are derived from IEEE standards and loaded for you. This provides you the assurance
that you are evaluating the signal with the most appropriate mask.
WLAN Displays
The displays in WLAN Analysis (Setup > Displays > Measurements) are:
SEM (see page 149)
WLAN Channel Response (see page 171)
WLAN Constellation (see page 174)
WLAN EVM (see page 176)
WLAN Magnitude Error (see page 178)
WLAN Phase Error (see page 180)
WLAN Power versus Time (see page 182)
WLAN Spectral Flatness (see page 185)
170
SignalVu-PC Printable Help
WLAN Measurements
WLAN Channel Response Display
WLAN Summary (see page 187)
WLAN Symbol Table (see page 192)
WLAN Channel Response Display
The WLAN Channel Response display plots the channel response (magnitude and phase) versus the
subcarrier or frequency. Here, the channel refers to all sources of signal frequency response impairment up
to the analyzer input, including the transmitter itself, as well as any transmission medium through which
the signal travels between the transmitter and the analyzer.
NOTE. WLAN Channel Response is only available for OFDM (non-802.11b) signals.
To show the WLAN Channel Response display:
1. If you are analyzing a stored data file, recall the data file now. Otherwise, go to the next step.
2. Press the Displays button or select Setup > Displays.
3. In the Select Displays dialog, select WLAN Analysis in the Measurements box.
4. In the Available displays box, double-click the WLAN Chan Response icon or select the icon and
click Add. The WLAN Chan Response icon will appear in the Selected displays box and will no
longer appear under Available displays.
5. Click OK to show the WLAN Chan Response display.
6. Set the Frequency appropriate for the signal.
7. Select Setup > Settings to display the control panel.
8. Select the Modulation Params tab. Set the Standard, Guard Interval, Subcarrier Spacing, and
Bandwidth controls as appropriate for the input signal.
9. If you are analyzing a data file, press the Replay button to take measurements on the recalled
acquisition data file.
SignalVu-PC Printable Help
171
WLAN Measurements
WLAN Channel Response Display
Elements of the Display
172
SignalVu-PC Printable Help
WLAN Measurements
WLAN Channel Response Settings
Item
Display element
1
Magnitude graph (top graph)
Description
1a
Top of graph
Sets the level that appears at the top of the magnitude graph. This
is only a visual control for panning the graph. The Reference Level
is adjusted in the Toolbar and the Ampl control panel. By default, Vert
Position = Ref Level.
1b
Position (dB)
Sets the vertical position value. The maximum value is 20.00 dB. The
readout indicates the subcarrier (for non-b standards only) or frequency
shown at the bottom of the display.
1c
Bottom of graph readout
Indicates the magnitude at the bottom of the top graph. This value
changes with the dB and vertical Position settings.
2
Phase graph (bottom graph)
2a
Top of graph
Sets the phase value indicated at the top of the graph. Since the Position
value at the vertical center of this graph remains constant as the Top of
Graph value is adjusted, the Vertical Scale increases as the Top of Graph
value increases, which also affects the bottom of graph readout.
2b
Position (°)
Specifies the phase shown at the center of the graph display. Changing
this value moves the trace up and down in the graph, which affects the
Top of Graph and Bottom of Graph values as well.
2c
Bottom of bottom graph
readout
Indicates the phase at the bottom of the bottom graph. This value
changes with the Position setting.
3
Autoscale
Adjusts the Vertical and Horizontal scaling to optimize the trace display
on screen.
4
Start (Position)
Shifts the trace left or right in the graph. The readout indicates the
subcarrier (for non-b standards only) or frequency shown at the left
edge of the display.
5
Stop (Scale)
Specifies the number of subcarriers (for non-b standards only) shown
in the graph.
xxx
WLAN Channel Response Settings
The WLAN Channel Response Settings control panel provides access to settings that control parameters of
the Channel Response Display.
Settings tab
Description
Modulation Params (see
page 195)
Specifies the input signal standard and additional user-settable signal parameters.
Analysis Params (see
page 196)
Specifies parameters used by the instrument to analyze the input signal.
Data Range Tab (see
page 198)
Specifies which symbols and subcarriers of the signal to display.
Analysis Time Tab (see
page 199)
Specifies parameters that define the portion of the acquisition record that is used for
analysis. Also allows you to specify the time units (Symbols or Seconds) for WLAN
Analysis displays.
SignalVu-PC Printable Help
173
WLAN Measurements
WLAN Constellation Display
Settings tab
Description
Traces Tab (see page 200)
Enables you to select from magnitude or phase trace, save a trace, and recall an trace
Scale Tab (see page 201)
Specifies the Zoom scale, and vertical and horizontal positions of the display.
Prefs Tab (see page 204)
Specifies the units of the display and whether elements of the graphs are displayed.
xxx
WLAN Constellation Display
The WLAN Constellation Display shows the WLAN signal modulation amplitude and phase in I
(horizontal) versus Q (vertical) form. For multicarrier WLAN OFDM signals, the points show all data
symbol subcarriers' modulation. For single-carrier 802.11b, each point corresponds to a single modulated
chip.
To show the WLAN Constellation display:
1. If you are analyzing a stored data file, recall the data file now. Otherwise, go to the next step.
2. Press the Displays button or select Setup > Displays.
3. In the Select Displays dialog, select WLAN Constellation in the Measurements box.
4. In the Available displays box, double-click the WLAN Constellation icon or select the icon and
click Add. The WLAN Constellation icon will appear in the Selected displays box and will no
longer appear under Available displays.
5. Click OK to show the WLAN Constellation display.
6. Set the Frequency appropriate for the signal.
7. Select Setup > Settings to display the control panel.
8. Select the Modulation Params tab. Set the Standard, Guard Interval, Channel Bandwidth, and
Subcarrier Spacing controls as appropriate for the input signal.
9. If you are analyzing a data file, press the Replay button to take measurements on the recalled
acquisition data file.
174
SignalVu-PC Printable Help
WLAN Measurements
WLAN Constellation Settings
Elements of the Display
Item
Display element
Description
1
Plot
Constellation graph.
2
Marker readout
If markers are enabled, the marker readout shows the selected Marker,
Symbol, Subcarrier, Type, Value, Magnitude, and Phase for the symbol at
the marker location. Located to the left of the constellation plot or below it,
depending on the size of the window.
3
Marker controls
Define and position markers.
xxx
WLAN Constellation Settings
Application Toolbar:
The WLAN Constellation Settings control panel provides access to settings that control parameters of the
Constellation Display.
SignalVu-PC Printable Help
175
WLAN Measurements
WLAN EVM Display
Settings tab
Description
Modulation Params (see
page 195)
Specifies the input signal standard and additional user-settable signal parameters.
Analysis Params (see
page 196)
Specifies parameters used by the instrument to analyze the input signal.
Data Range (see page 198)
Specifies which symbols and subcarriers of the signal to display.
Analysis Time Tab (see
page 199)
Specifies parameters that define the portion of the acquisition record that is used for
analysis. Also allows you to specify the Units (Symbols or Seconds) for WLAN Analysis
displays.
Trace Tab (see page 200)
Enables you to freeze the display or hide the measurement or average trace.
Scale Tab (see page 201)
Specifies the Zoom scale, and vertical and horizontal positions of the display.
Prefs Tab (see page 204)
Specifies the units of the display and whether elements of the graphs are displayed.
xxx
WLAN EVM Display
The WLAN EVM display shows the data symbols' individual subcarrier Error Vector Magnitude values
versus symbol interval (time) and subcarrier (frequency).
NOTE. For 802.11b analysis, the subcarrier graph is not displayed.
To show the WLAN EVM display:
1. If you are analyzing a stored data file, recall the data file now. Otherwise, go to the next step.
2. Press the Displays button or select Setup > Displays.
3. In the Select Displays dialog, select WLAN EVM in the Measurements box.
4. In the Available displays box, double-click the WLAN EVM icon or select the icon and click Add.
The WLAN EVM icon will appear in the Selected displays box and will no longer appear under
Available displays.
5. Click OK to show the WLAN EVM display.
6. Set the Frequency appropriate for the signal.
7. Select Setup > Settings to display the control panel.
8. Select the Modulation Params tab. Set the Standard as appropriate. Set the Standard, Guard Interval,
Channel Bandwidth, and Subcarrier Spacing controls as appropriate for the input signal.
9. If you are analyzing a data file, press the Replay button to take measurements on the recalled
acquisition data file.
176
SignalVu-PC Printable Help
WLAN Measurements
WLAN EVM Settings
Elements of the Display
Item
Display element
Description
1
Top of graph
Sets the EVM value that appears at the top of the graph. This is only a visual
control for panning the graph.
2
Bottom of graph
Sets the EVM value that appears at the bottom of the graph. This is only a
visual control for panning the graph.
3
Autoscale
Adjusts the vertical and horizontal settings to provide the best display.
4
Start (Position)
Specifies the horizontal position of the trace on the graph display.
5
Stop (Scale)
Adjusts the horizontal range of the graph. By decreasing the scale, the graph
essentially becomes a window that you can move over the analysis results by
adjusting the position.
xxx
WLAN EVM Settings
Application Toolbar:
The settings for the WLAN EVM display are shown in the following table.
SignalVu-PC Printable Help
177
WLAN Measurements
WLAN Magnitude Error Display
Settings tab
Description
Modulation Params (see
page 195)
Specifies the type of modulation used for the input signal and other parameters.
Analysis Params (see
page 196)
Specifies parameters used by the instrument to analyze the input signal.
Data Range (see page 198)
Specifies which symbols and subcarriers of the signal to display.
Analysis Time (see page 199)
Specifies parameters that define the portion of the acquisition record that is used for
analysis. Also allows you to specify the Units (Symbols or Seconds) for WLAN Analysis
displays.
Trace (see page 200)
Enables you to freeze the display or hide the measurement or average trace.
Scale (see page 201)
Specifies the vertical, subcarrier (for non-b standards only) and symbols scale and
position settings.
Prefs (see page 204)
Specifies the units of the display and whether elements of the graphs are displayed.
xxx
WLAN Magnitude Error Display
The WLAN Magnitude Error display shows the data symbols' individual subcarrier Magnitude Error
values versus symbol interval (time) and subcarrier (frequency).
NOTE. For 802.11b analysis, the subcarrier graph is not displayed.
To show the WLAN Magnitude Error display:
1. If you are analyzing a stored data file, recall the data file now. Otherwise, go to the next step.
2. Press the Displays button or select Setup > Displays.
3. In the Select Displays dialog, select WLAN Analysis in the Measurements box.
4. In the Available displays box, double-click the WLAN Mag Error icon or select the icon and click
Add. The WLAN Mag Error icon will appear in the Selected displays box and will no longer appear
under Available displays.
5. Click OK to show the WLAN Mag Error display.
6. Set the Frequency appropriate for the signal.
7. Select Setup > Settings to display the control panel.
8. Select the Modulation Params tab. Set the Standard, Guard Interval and Spacing and Bandwidth
controls as appropriate for the input signal.
9. If you are analyzing a data file, press the Replay button to take measurements on the recalled
acquisition data file.
178
SignalVu-PC Printable Help
WLAN Measurements
WLAN Magnitude Error Settings
Elements of the Display
Item
Display element
Description
1
Top of graph
Sets the Magnitude Error value that appears at the top of the graph. This is
only a visual control for panning the graph.
2
Bottom of graph
Sets the Magnitude Error value that appears at the bottom of the graph. This
is only a visual control for panning the graph.
3
Autoscale
Adjusts the vertical and horizontal settings to provide the best display.
4
Pos
Specifies the horizontal position of the trace on the graph display.
5
Scale
Adjusts the horizontal range of the graph. By decreasing the scale, the graph
essentially becomes a window that you can move over the analysis results by
adjusting the position.
xxx
WLAN Magnitude Error Settings
Application Toolbar:
The settings for the WLAN Mag Error display are shown in the following table.
SignalVu-PC Printable Help
179
WLAN Measurements
WLAN Phase Error Display
Settings tab
Description
Modulation Params (see
page 195)
Specifies the type of modulation used for the input signal and other parameters.
Analysis Params (see
page 196)
Specifies parameters used by the instrument to analyze the input signal.
Data Range (see page 198)
Specifies which symbols and subcarriers of the signal to display.
Analysis Time Tab (see
page 199)
Specifies parameters that define the portion of the acquisition record that is used for
analysis. Also allows you to specify the Units (Symbols or Seconds) for WLAN Analysis
displays.
Trace (see page 200)
Enables you to display or hide the measurement or average trace.
Scale Tab (see page 201)
Specifies the vertical, subcarrier (for non-b standards only), and symbols scale and
position settings.
Prefs Tab (see page 204)
Specifies the units of the display and whether elements of the graphs are displayed.
xxx
WLAN Phase Error Display
The WLAN Phase Error display shows the data symbols' individual subcarrier Phase Error values versus
symbol interval (time) and subcarrier (frequency).
NOTE. For 802.11b analysis, the subcarrier graph is not displayed.
To show the WLAN Phase Error display:
1. If you are analyzing a stored data file, recall the data file now. Otherwise, go to the next step.
2. Press the Displays button or select Setup > Displays.
3. In the Select Displays dialog, select WLAN Analysis in the Measurements box.
4. In the Available displays box, double-click the WLAN Phase Error icon or select the icon and click
Add. The WLAN Phase Error icon will appear in the Selected displays box and will no longer
appear under Available displays.
5. Click OK to show the WLAN Phase Error display.
6. Set the Frequency appropriate for the signal.
7. Select Setup > Settings to display the control panel.
8. Select the Modulation Params tab. Set the Standard, Guard Interval and Spacing and Bandwidth
controls as appropriate for the input signal.
9. If you are analyzing a data file, press the Replay button to take measurements on the recalled
acquisition data file.
180
SignalVu-PC Printable Help
WLAN Measurements
WLAN Phase Error Settings
Elements of the Display
Item
Display element
Description
1
Top of graph
Sets the Phase Error value that appears at the top of the graph. This is only a
visual control for panning the graph.
2
Bottom of graph
Sets the Phase Error value that appears at the bottom of the graph. This is
only a visual control for panning the graph.
3
Autoscale
Adjusts the vertical and horizontal settings to provide the best display.
4
Pos
Specifies the horizontal position of the trace on the graph display.
5
Scale
Adjusts the horizontal range of the graph. By decreasing the scale, the graph
essentially becomes a window that you can move over the analysis results by
adjusting the position.
xxx
WLAN Phase Error Settings
Application Toolbar:
The settings for the WLAN Phase Error display are shown in the following table.
SignalVu-PC Printable Help
181
WLAN Measurements
WLAN Power vs Time Display
Settings tab
Description
Modulation Params (see
page 195)
Specifies the type of modulation used for the input signal and other parameters.
Analysis Params (see
page 196)
Specifies parameters used by the instrument to analyze the input signal.
Data Range (see page 198)
Specifies which symbols and subcarriers of the signal to display.
Analysis Time Tab (see
page 199)
Specifies parameters that define the portion of the acquisition record that is used for
analysis. Also allows you to specify the Units (Symbols or Seconds) for WLAN Analysis
displays.
Trace (see page 200)
Enables you to display or hide the measurement or average trace.
Scale Tab (see page 201)
Specifies the vertical, subcarrier (for non-b standards only), and symbols scale and
position settings.
Prefs Tab (see page 204)
Specifies the units of the display and whether elements of the graphs are displayed.
xxx
WLAN Power vs Time Display
The WLAN Power vs Time display shows the signal power amplitude versus time. For 802.11b signals,
the packet Power-On and Power-Down ramp times are also measured.
To show the WLAN Power vs Time display:
1. If you are analyzing a stored data file, recall the data file now. Otherwise, go to the next step.
2. Press the Displays button or select Setup > Displays.
3. In the Select Displays dialog, select WLAN Analysis in the Measurements box.
4. In the Available displays box, double-click the WLAN Power vs Time icon or select the icon and
click Add. The WLAN Power vs Time icon will appear in the Selected displays box and will no
longer appear under Available displays.
5. Click OK to show the WLAN Power vs Time display.
6. Set the Frequency appropriate for the signal.
7. Select Setup > Settings to display the control panel.
8. Select the Modulation Params tab. Set the Standard, Guard Interval and Spacing and Bandwidth
controls as appropriate for the input signal.
9. If you are analyzing a data file, press the Replay button to take measurements on the recalled
acquisition data file.
182
SignalVu-PC Printable Help
WLAN Measurements
WLAN Power vs Time Display
Elements of the Display
SignalVu-PC Printable Help
183
WLAN Measurements
WLAN Power vs Time Settings
Item
Display element
Description
1
Top of graph, first settting
Sets the Power level that appears at the top of the graph, in dBm. This is only
a visual control for panning the graph.
2
Top of graph, second setting
Sets the vertical Scale of the graphs, in dB/div. This is only a visual control
for panning the graph.
3
View
Selects the specific view of the packet burst within the display:
- Full Burst displays the entire packet, with vertical lines indicating length
of the packet
- Rising Edge zooms the display into the interval around the packet rising
edge, with vertical lines indicating the 10% to 90% Power-On Ramp time
- Falling Edge zooms the display into the interval around the packet falling
edge, with vertical lines indicating the 90% to 10% Power-Down Ramp time
4
Bottom of graph readout
Shows the Power level at the bottom of the graph in dBm.
5
Autoscale
Adjusts the vertical and horizontal settings to provide the best display.
6
Bottom of graph, left side
Sets the starting time of the graph in seconds
7
Bottom of graph, right side
Sets the scale (width) of the graph in seconds
8
Table below graph
- Burst Power: Average power of the burst packet, in dBm
- Burst Width: Measured time width of the burst packet from Power-On to
Power-Down (or end of waveform, if that occurs before Power-Down), in
seconds
NOTE. Power-On Ramp Time and Power-Down Ramp Time values are
only available for 802.11b analysis.
- Power-On Ramp Time: Time interval for signal level to increase from 10%
to 90% of maximum packet power, in seconds
- Power-Down Ramp Time: Time interval for signal level to decrease from
90% to 10% of maximum packet power, in seconds. This value is not available
is the analysis record does not include the packet power-down portion.
xxx
WLAN Power vs Time Settings
Application Toolbar:
The settings for the WLAN Power vs Time display are shown in the following table.
184
SignalVu-PC Printable Help
WLAN Measurements
WLAN Spectral Flatness Display
Settings tab
Description
Modulation Params (see
page 195)
Specifies the type of modulation used for the input signal and other parameters.
Analysis Params (see
page 196)
Specifies parameters used by the instrument to analyze the input signal.
Data Range (see page 198)
Specifies which symbols and subcarriers of the signal to display.
Analysis Time (see page 199)
Specifies parameters that define the portion of the acquisition record that is used for
analysis. Also allows you to specify the Units (Symbols or Seconds) for WLAN Analysis
displays.
Scale (see page 201)
Specifies the vertical, subcarrier (for non-b standards only), and symbols scale and
position settings.
Prefs (see page 204)
Specifies the units of the display and whether elements of the graphs are displayed.
xxx
WLAN Spectral Flatness Display
The WLAN Spectral Flatness display shows the average power levels of subcarriers across the signal
bandwidth and indicates if they remain within the limits defined for a particular standard.
The averaged subcarrier level is shown as a line on the display, while the individual subcarrier levels are
shown as points. The Pass or Fail result indicates whether the average line remains between the upper and
lower limit mask boundaries.
NOTE. WLAN Spectral Flatness is only available for OFDM (non-802.11b) signals.
To show the WLAN Spectral Flatness display:
1. If you are analyzing a stored data file, recall the data file now. Otherwise, go to the next step.
2. Press the Displays button or select Setup > Displays.
3. In the Select Displays dialog, select WLAN Analysis in the Measurements box.
4. In the Available displays box, double-click the WLAN Flatness icon or select the icon and click
Add. The WLAN Flatness icon will appear in the Selected displays box and will no longer appear
under Available displays.
5. Click OK to show the WLAN Flatness display.
6. Set the Frequency appropriate for the signal.
7. Select Setup > Settings to display the control panel.
8. Select the Modulation Params tab. Set the Standard, Guard Interval, Subcarrier Spacing, and
Channel Bandwidth controls as appropriate for the input signal.
9. If you are analyzing a data file, press the Replay button to take measurements on the recalled
acquisition data file.
SignalVu-PC Printable Help
185
WLAN Measurements
WLAN Spectral Flatness Settings
Elements of the Display
Item
Display element
Description
1
Top of graph, first setting
Sets the Flatness value that appears at the top of the graph in dB. This is only
a visual control for panning the graph.
2
Top of graph, second setting
Sets the lower range of the Flatness value that appears at the top of the
graph in dB/div. This is only a visual control for panning the graph.
3
Bottom of graph
Shows the Flatness value set at the bottom of the graph.
4
Autoscale
Adjusts the vertical and horizontal settings to provide the best display.
5
Posn
Specifies the horizontal position of the trace on the graph display.
6
Scale
Adjusts the horizontal range of the graph. By decreasing the scale, the graph
essentially becomes a window that you can move over the analysis results by
adjusting the position.
xxx
WLAN Spectral Flatness Settings
Application Toolbar:
The settings for the WLAN Spectral Flatness display are shown in the following table.
186
SignalVu-PC Printable Help
WLAN Measurements
WLAN Summary Display
Settings tab
Description
Modulation Params (see
page 195)
Specifies the type of modulation used for the input signal and other parameters.
Analysis Params (see
page 196)
Specifies parameters used by the instrument to analyze the input signal.
Data Range (see page 198)
Specifies which symbols and subcarriers of the signal to display.
Analysis Time Tab (see
page 199)
Specifies parameters that define the portion of the acquisition record that is used for
analysis.
NOTE. The Units control on this tab only affects the Analysis Length (AFAIK). Use the
Units control in the Prefs tab to affect the displays.
Trace (see page 200)
Enables you to display or hide the measurement or average trace.
Scale Tab (see page 201)
Specifies the vertical, subcarrier (for non-b standards only), and symbols scale and
position settings.
Prefs Tab (see page 204)
Specifies the units of the display and whether elements of the graphs are displayed.
xxx
WLAN Summary Display
The WLAN Summary display shows several measurements of WLAN signal quality. The summary display
and it’s contents will vary by standard selected. Not all of the display contents are provided in this section.
To show the WLAN Summary display:
1. If you are analyzing a stored data file, recall the data file now. Otherwise, go to the next step.
2. Press the Displays button or select Setup > Displays.
3. In the Select Displays dialog, select WLAN Analysis in the Measurements box.
4. In the Available displays box, double-click the WLAN Summary icon or select the icon and click
Add. The WLAN Summary icon will appear in the Selected displays box and will no longer appear
under Available displays.
5. Click OK to show the WLAN Summary display.
6. Set the Frequency appropriate for the signal.
7. Select Setup > Settings to display the control panel.
8. Select the Modulation Params tab. Set the Standard, Guard Interval and Spacing and Bandwidth
controls as appropriate for the input signal.
9. If you are analyzing a data file, press the Replay button to take measurements on the recalled
acquisition data file.
SignalVu-PC Printable Help
187
WLAN Measurements
WLAN Summary Display
WLAN Summary Display for 802.11a/g/j/p/n/ac Signals
188
SignalVu-PC Printable Help
WLAN Measurements
WLAN Summary Display
Elements of the Display for 802.11a/g/j/p/n/ac Signals
Measurement
Description
Standard
Display of the standard selected on the Setup > Settings > Modulation Params tab.
Bandwidth
Display of the channel bandwidth selected on Setup > Settings > Modulation Parameters
tab.
Burst Power
The average power of all symbols in the packet, including Preamble and Data segments.
Peak-to-Average
The ratio of the highest instantaneous signal power level to the average signal power.
Burst Index
The index of the analyzed packet within the analysis record.
IQ Origin Offset
The average magnitude of the DC subcarrier level relative to total signal power. It
indicates the level of carrier feedthrough detected at the center (DC) subcarrier.
Frequency Error
The frequency difference between the measured carrier frequency of the signal and the
measurement frequency setting.
Common Pilot Error
The RMS magnitude error of the pilots over all data symbols.
Symbol Clk Error
The symbol clock error in parts per million.
EVM
The RMS and Peak values of the normalized subcarrier Error Vector Magnitude values.
The normalized subcarrier EVM values are calculated as the difference between the
detected received signal subcarrier constellation points and ideal reference points
estimated by the instrument from the received signal. Values are reported in units of
percent or dB. Peak values include the symbol and subcarrier location.
RMS and Peak values are displayed for groupings of all subcarriers, Pilots only and Data
only. Results are calculated over all Data symbols in the packet.
Average RMS and Peak RMS values are accumulated over multiple packet analysis
cycles. The Clear button on the display resets these values by clearing the result memory.
Packet Format
Displays the packet format: AG, HT_MF, HT_GF, VHT.
Data Modulation
Displays the modulation used in the Data symbols: BPSK, QPSK, 16QAM, 64QAM,
256QAM.
Guard Interval
Displays the Guard Interval used by the Data symbols: 1/4, 1/8.
Symbols, EVM, Avg Power
Displays the type and number of symbols, EVM-RMS and average power of the
Preamble and Data portions of the packet.
SIG Data
L-SIG Data
HT-SIG Data
VHT-SIG Data
Displays he decimal values of the received packet SIGNAL, HT-SIGNAL and
VHT-SIGNAL symbols' fields. The Pass/Fail result in each heading line indicates whether
the calculated Parity or CRC value matches the received Parity or CRC value of the
corresponding SIGNAL symbol grouping.
xxx
SignalVu-PC Printable Help
189
WLAN Measurements
WLAN Summary Display
WLAN Summary Display for 802.11b Signals
190
SignalVu-PC Printable Help
WLAN Measurements
WLAN Summary Settings
Elements of the Display for 802.11b Signals
Measurement
Description
Standard
Display of the standard selected on the Setup > Settings > Modulation Parameters tab.
Burst Power
The average power of the entire packet.
Peak-to-Average
The ratio of the highest instantaneous packet signal power level to the average signal
power.
Burst Index
The index of the analyzed packet within the analysis record.
IQ Origin Offset
The amount of power at the signal carrier frequency relative to the total power of the
signal.
Frequency Error
The frequency difference between the measured carrier frequency of the signal and the
measurement frequency setting.
EVM
The RMS and Peak values of the normalized Error Vector Magnitudes taken at signal
chip intervals. The normalized EVM values are calculated as the difference between the
detected received signal constellation points and ideal reference points estimated by the
instrument from the received signal. Values are reported in units of percent or dB. Peak
values indicate the associated chip locations.
RMS and Peak values are displayed for groupings of All chips, and the first 1000 (1k)
chips.
Average RMS and Peak RMS values are accumulated over multiple packet analysis
cycles. The Clear button on the display resets these values by clearing the result memory.
Packet Format
Displays the packet format: DSSS 1M, DSSS 2M, CCK 5.5M or CCK 11M.
Data Modulation
Displays the modulation used in the PSDU/Data packet segment.
Chips, EVM, Avg Power
Displays the number of chips, EVM-RMS and average power of the Preamble, Header
and Data portions of the packet.
Header Data
Displays he decimal values of the received packet Header's Signal, Service, Length, and
CRC fields. The CRC Pass/Fail result indicates if the received CRC value is equal to the
CRC value computed from the received Signal, Service and Length values.
xxx
WLAN Summary Settings
Application Toolbar:
The settings for the WLAN Summary display are shown in the following table.
SignalVu-PC Printable Help
191
WLAN Measurements
WLAN Symbol Table Display
Settings tab
Description
Modulation Params (see
page 195)
Specifies the type of modulation used for the input signal and other parameters.
Analysis Params (see
page 196)
Specifies parameters used by the instrument to analyze the input signal.
Data Range (see page 198)
Specifies which symbols and subcarriers of the signal to display.
Analysis Time (see page 199)
Specifies parameters that define the portion of the acquisition record that is used for
analysis. Also allows you to specify the Units (Symbols or Seconds) for WLAN Analysis
displays.
EVM (see page 203)
Specifies the EVM units (dB or %) and Max Bursts to Avg. The EVM is generally
measured on symbol or chip instants and is usually measured after best-fit estimates of
the frequency error and a fixed phase offset have been removed.
Prefs (see page 204)
Specifies the units of the display and whether elements of the graphs are displayed.
xxx
WLAN Symbol Table Display
The WLAN Symbol Table display shows decoded data values for each data symbol in the analyzed
signal packet. For OFDM signals (all standards except 802.11b), results are presented with subcarrier
(frequency) indices in the horizontal dimension and symbol (time) intervals in the vertical dimension.
For 802.11b signals, the Preamble, Header, and Data (PSDU) symbol values are presented sequentially,
with symbol indices in the left column.
To show the WLAN Symbol Table display:
1. If you are analyzing a stored data file, recall the data file now. Otherwise, go to the next step.
2. Press the Displays button or select Setup > Displays.
3. In the Select Displays dialog, select WLAN Analysis in the Measurements box.
4. In the Available displays box, double-click the WLAN Symb Table icon or select the icon and click
Add. The WLAN Symbol icon will appear in the Selected displays box and will no longer appear
under Available displays.
5. Click OK to show the WLAN Symbol Table display.
6. Set the Frequency appropriate for the signal.
7. Select Setup > Settings to display the control panel.
8. Select the Modulation Params tab. Set the Standard, Guard Interval and Spacing and Bandwidth
controls as appropriate for the input signal.
9. If you are analyzing a data file, press the Replay button to take measurements on the recalled
acquisition data file.
192
SignalVu-PC Printable Help
WLAN Measurements
WLAN Symbol Table Display
WLAN Symbol Table for OFDM signals
Item
Description
1
Subcarrier identifiers (OFDM only). Yellow column indicates Pilot subcarrier locations.
2
Symbol identifiers.
3
Subcarrier data values.
4
Marker readout when markers are enabled.
xxx
WLAN Symbol Table for 802.11b signals
SignalVu-PC Printable Help
193
WLAN Measurements
WLAN Symbol Table Settings
Item
Description
1
Symbol number index (from beginning of packet or segment) of first Symbol data value on the line.
2
Symbol values, with the value in column 2 of each row corresponding to the symbol number index in
column 1, and then the symbol value in column 3 corresponding to the next symbol number index,
etc., to the end of each row.
For example: The symbol number index 130 = 0 in column 2. The symbol number index for column 3
is 131, which equals 0. The symbol number index for column 4 is 132, which equals 1. This pattern
continues to the end of the row.
xxx
WLAN Symbol Table Settings
Application Toolbar:
The settings for the WLAN Symbol Table display are shown in the following table.
Settings tab
Description
Modulation Params (see
page 195)
Specifies the type of modulation used for the input signal and other parameters.
Analysis Params (see
page 196)
Specifies parameters used by the instrument to analyze the input signal.
Data Range (see page 198)
Specifies which symbols and subcarriers of the signal to display.
Analysis Time (see page 199)
Specifies parameters that define the portion of the acquisition record that is used for
analysis. Also allows you to specify the Units (Symbols or Seconds) for WLAN Analysis
displays.
Prefs (see page 204)
Specifies the units of the display and whether elements of the graphs are displayed.
xxx
WLAN Analysis Shared Measurement Settings
Application Toolbar:
The control panel tabs in this section are shared between the displays in the WLAN Analysis folder (Setup
> Displays). Some tabs are shared by all the displays, some tabs are shared by only a subset of displays.
The settings available on some tabs change depending on the selected display.
194
SignalVu-PC Printable Help
WLAN Measurements
Modulation Params Tab - WLAN
Common controls for WLAN analysis displays
Settings tab
Description
Modulation Params (see
page 195)
Specifies the type of modulation used for the input signal and other parameters.
Analysis Params (see
page 196)
Specifies parameters used by the instrument to analyze the input signal.
Data Range (see page 198)
Specifies which symbols and subcarriers of the signal to display.
Analysis Time (see page 199)
Specifies parameters that define the portion of the acquisition record that is used for
analysis. Also allows you to specify the Units (Symbols or Seconds) for WLAN Analysis
displays.
Trace (see page 200)
Enables you to display or hide the measurement or average trace.
Scale (see page 201)
Specifies the vertical, subcarrier (for non-b standards only), and symbols scale and
position settings.
EVM (see page 203)
Specifies the EVM units and max burst averages.
Prefs (see page 204)
Specifies the units of the display and whether elements of the graphs are displayed.
xxx
Modulation Params Tab - WLAN
The Modulation Params tab specifies the type of modulation used by the input signal and other parameters
that define the signal format.
SignalVu-PC Printable Help
195
WLAN Measurements
Analysis Params Tab - WLAN
Settings
Description
Standard
Specifies the standard used for the input signal. Choices are
802.11a/b/g/j/n/p/ac.
Guard Interval
Specifies the guard interval used in the input signal. You can select the
following:
– Auto from SIG uses the Guard Interval value extracted from the signal
– 1/8 allows setting the value manually
– 1/4 allows setting the value manually
Channel Bandwidth
Specifies the nominal channel bandwidth. This setting affects the Subcarrier
Spacing value when the Subcarrier Spacing Auto box is checked.
Subcarrier Spacing
Specifies the spacing between subcarriers. When Auto is selected, this setting
is automatically calculated according to the Channel Bandwidth value. If Auto is
unchecked, a custom subcarrier spacing value can be entered for nonstandard
signal definition.
FFT Sample Rate
Indicates the FFT sample rate, based on the bandwidth or subcarrier setting.
FFT Length
Indicates the fixed FFT length.
xxx
Analysis Params Tab - WLAN
The Analysis Params tab contains parameters that control the analysis of the input signal.
196
SignalVu-PC Printable Help
WLAN Measurements
Analysis Params Tab - WLAN
Settings
Description
Burst Selection Index
Allows specifying the burst you want to measure when multiple bursts are
present in an acquisition. Index number of the first burst is 1, second burst
is 2, etc.
Frequency Error
When the Auto box is checked, the analysis determines the Frequency Error
and the measured Frequency Error is displayed. When the Auto box is
unchecked, the entered value is used by the analysis as a fixed frequency
offset. This is useful when the exact frequency offset of the signal is known.
Symbol Analysis Offset
Specifies the analysis offset in the symbol interval. This value is a percentage
of the Guard Interval. The allowable range is -100% to 0%. -100% positions
the FFT to start at the beginning of the Guard Interval, 0% positions it to start
at the end of the Guard Interval. Default value is -50% which usually gives
the best measurement results.
Swap I & Q
Select the checkbox to swap the I and Q components of a signal. This
compensates the input signal for spectral inversion.
Equalizer Training
Specifies the method used to estimate channel frequency response and
equalization. This control can be used to diagnose changes in frequency
response over the signal packet.
Preamble
The instrument uses only the Preamble to estimate channel frequency
response. This response is then used to equalize the entire signal packet.
Preamble + Data
The instrument makes an initial channel frequency response estimate from the
Preamble. It then estimates the channel response for each data symbol using
the decoded data content to derive equalization for each symbol individually.
This allows compensation for time-varying channel response over the packet.
Data Modulation
Allows choice of automatic or manual method of data symbol modulation
identification, as follows:
– Auto Detect estimates the modulation from the data symbol IQ content.
– Auto from SIG sets the modulation as indicated by the embedded SIG
preamble symbol format data.
– Manual allows specifying the modulation type regardless of the signal
content.
Pilot tracking
Specifies if pilot subcarriers should be used to correct amplitude, phase, and
symbol timing variations over the packet. The choices available are Phase,
Amplitude, and Timing. The default setting is Phase correction enabled,
Amplitude and Timing correction disabled..
Subcarrier derotation
Allows some displays to show subcarriers with or without Gamma subcarrier
phase rotation removed. Gamma phase rotation is applied to 802.11n and
802.11ac subcarriers in defined subranges depending on the selected Channel
Bandwidth >40 MHz. Only Constellation and Symbol Table results are affected
by this control.
When the box is unchecked, the rotation is not removed, which provides a
direct view of the physical modulation on the channel.
When the box is checked, the rotation is removed, allowing easier decoding of
the underlying data content.
xxx
SignalVu-PC Printable Help
197
WLAN Measurements
Data Range Tab - WLAN
Data Range Tab - WLAN
The Data Range tab enables you to control how much signal is analyzed, as well as specify the range of
results that are displayed for the WLAN Constellation, EVM, Flatness, Magnitude Error, Phase Error, and
Symbol Table graphs. The tab contents vary by standard.
Data Range tab for non-b standards.
Settings
Symbols
Description
Specifies which symbols are displayed in the graphs.
All
Select All to display all symbols.
Range
Select Range to specify a subset of symbols for display.
Start
Specifies the first symbol to include in the display.
Stop
Specifies the last symbol to include in the display.
Single
Index
Subcarriers
Select Single to display a single symbol.
Use Index to specify the symbol you want to display.
Specifies which subcarriers are displayed.
All
Select All to display all subcarriers in the signal.
Pilots
Select Pilot to display only pilot subcarriers.
Data
Select Data to display only data subcarriers.
Single
Specifies a specific subcarrier for display.
Index
Range
Specifies the specific subcarrier to be displayed.
Specifies a range of subcarriers to be displayed.
Start
Specifies the start value of the range to be displayed.
Stop
Specifies the ending value of the range to be displayed.
Max symbols to analyze
Specifies how many symbols are analyzed. You can use this setting to speed
analysis by limiting the number of symbols being analyzed.
xxx
Data Range tab for 802.11b standards.
198
SignalVu-PC Printable Help
WLAN Measurements
Analysis Time Tab - WLAN
Settings
Description
Chips
Specifies which symbols are displayed in the graphs.
All
Select All to display all chips.
Preamble Only
Select to include only the Preamble in the display.
Header Only
Select to include only the Header in the display.
Data Only
Select to include only the Data in the display.
Max number of chips to analyze
Specifies how many chips are analyzed. You can use this setting to speed
analysis by limiting the number of chips being analyzed. Check this box and
then enter the maximum number of chips to analyze.
xxx
Analysis Time Tab - WLAN
The Analysis Time tab contains parameters that define how the signal is analyzed in the WLAN Analysis
displays.
Settings
Description
Analysis Length
Specifies the length of the analysis period to use in measurements. Length is specified in
either symbols or seconds, depending on the Units setting.
Use this to specify how long a period of time is analyzed.
– Range: minimum value depends on modulation type
– Resolution: 1 symbol
Auto
Units
When enabled, causes the instrument to set the Analysis Length value based on the
requirements of the selected display.
Specifies the units of the Analysis Length in either Symbols or Seconds.
xxx
SignalVu-PC Printable Help
199
WLAN Measurements
Trace Tab - WLAN
Trace Tab - WLAN
The Trace tab allows you to set the trace display characteristics of the selected display. This tab is not
available for all WLAN displays.
Settings
Description
Trace
Use this drop-down list to select whether or not the Average trace or the measurement
trace is displayed. The measurement trace depends on the selected display.
Show Symbols
Select or deselect this checkbox to show or hide symbols.
Freeze
Selecting Freeze halts updates to the symbols.
xxx
Traces Tab - WLAN Channel Response
The Traces tab allows you to set the trace display characteristics of the WLAN Channel Reponse display.
Settings
Description
Trace
Selects the Magnitude or Phase trace for saving or recalling.
Save Trace As . . .
Select to save a trace.
Recall Trace . . .
Select to recall a trace.
xxx
200
SignalVu-PC Printable Help
WLAN Measurements
Scale Tab - WLAN
Scale Tab - WLAN
The Scale tab allows you to change the scale settings that control how the trace appears on the display but
does not change control settings such as Measurement Frequency. There are four versions of the Scale
tab for WLAN displays. One version is used for the Constellation display, one for the Spectral Flatness
display, one for the Power vs Time display, and one for the EVM, Magnitude Error, Phase Error, and
Channel Response displays.
Scale tab for the WLAN Power vs Time display
Scale tab for WLAN EVM, Magnitude Error, Phase Error, and Channel Response displays
Scale tab for WLAN Constellation display
SignalVu-PC Printable Help
201
WLAN Measurements
Scale Tab - WLAN
Scale tab for WLAN Spectral Flatness display
Settings
Description
Vertical
Controls the vertical position and scale of the trace display.
Scale
Changes the vertical scale of the graph.
Position
Adjusts the reference level away from top of the graph.
Autoscale
Resets the scale of the vertical axis to contain the complete trace.
Subcarrier
Controls the scale of the subcarrier graph and position of the trace.
Scale
Specifies how many subcarriers are displayed horizontally.
Position
Specifies the subcarrier that appears at the left edge of the subcarrier graph.
Autoscale
Resets the scale of the horizontal axis to contain the complete trace.
Symbols
Controls the scale of the Symbols graph.
Scale
Specifies the number of symbols that appear in the symbols graph.
Position
Specifies the symbol that appears at the left edge of the Symbols graph.
Autoscale
Resets the scale and position settings to optimize the display.
Auto
When Auto is checked, the scale and position values for the Symbols graph are
automatically adjusted to maintain the optimal display.
Zoom
Sets the Constellation display size and position.
Scale
Sets the magnification value for the Constellation display.
Vertical Position
Sets the vertical location of the Constellation display within the graph. Range is -3.7 to
+3.7.
Horizontal Position
Sets the horizontal location of the Constellation display within the graph. Range is -3.7 to
+3.7.
xxx
202
SignalVu-PC Printable Help
WLAN Measurements
EVM Tab - WLAN
EVM Tab - WLAN
The EVM Tab enables you to chose between dB and percent for the EVM units and to select to set the
maximum bursts to average. The EVM Tab is only available for the WLAN Summary display.
Settings
Description
EVM units
Specifies whether the displayed EVM units are dB or percent.
Max Bursts to Avg
Specifies the maximum number of bursts to average when Count is selected.
Count
Enables the Max Bursts to Avg function.
xxx
SignalVu-PC Printable Help
203
WLAN Measurements
Prefs Tab - WLAN
Prefs Tab - WLAN
The Prefs tab enables you to change appearance characteristics of the WLAN Analysis displays. Not all
settings on the Prefs tab shown below appear for every WLAN display.
Settings
Description
Time units
Specifies whether the displayed time units are seconds or symbols.
Freq units
Specifies whether the displayed frequency units are frequency (Hz) or subcarrier channel.
Radix
Specifies whether symbol values are displayed in binary or hex format (for example, in
the Symbol Table or markers readouts).
Show graphs
Specifies which graphs are displayed. Select from Symbols, Subcarriers or Both,
Magnitude, Phase, or Both. Disabled (no masks), Shaded Region, or Line Only. These
selections are only available for OFDM signals.
Show graticule
Specifies to show the graticule on the display when checked.
Show marker readout
Specifies to show the marker readout when checked.
xxx
204
SignalVu-PC Printable Help
OFDM Analysis
Overview
Overview
The OFDM Analysis option provides measurements for OFDM signals specified by 802.11a/g/j (Wifi)
and 802.16 (2004) (commonly known as Fixed WiMAX) standards. User controls allow you to modify
signal parameters for analysis of non-standard signals. The analysis results give multiple views of OFDM
signal characteristics to allow diagnosing signal imperfections and impairments quickly and easily.
Display controls provide the ability to selectively display the analysis results to help locate trouble-spots in
the signal.
The displays in OFDM Measurements (Displays > Measurements > OFDM Measurements) are:
OFDM Channel Response (see page 205)
OFDM Constellation (see page 208)
OFDM EVM (see page 209)
OFDM Spectral Flatness (see page 211)
OFDM Mag Error (see page 213)
OFDM Phase Error (see page 215)
OFDM Power (see page 217)
OFDM Summary (see page 219)
OFDM Symbol Table (see page 221)
OFDM Channel Response Display
The OFDM Channel Response display plots the channel response (magnitude or phase) versus the
subcarrier or frequency. Here, the channel refers to all sources of signal frequency response impairment up
to the analyzer input, including the transmitter itself, as well as any transmission medium through which
the signal travels between the transmitter and the analyzer.
To show the OFDM Channel Response display:
1. If you are analyzing a stored data file, recall the data file now. Otherwise, go to the next step.
2. Press the Displays button or select Setup > Displays.
3. In the Select Displays dialog, select OFDM Analysis in the Measurements box.
4. In the Available displays box, double-click the OFDM Chan Response icon or select the icon and
click Add. The OFDM Chan Response icon will appear in the Selected displays box and will no
longer appear under Available displays.
5. Click OK to show the OFDM Chan Response display.
6. Set the Frequency appropriate for the signal.
7. Select Setup > Settings to display the control panel.
SignalVu-PC Printable Help
205
OFDM Analysis
OFDM Channel Response Display
8. Select the Modulation Params tab. Set the Standard, Guard Interval and Spacing and Bandwidth
controls as appropriate for the input signal.
9. If you are analyzing a stored data file, press the Replay button to take measurements on the recalled
acquisition data file.
Elements of the Display
206
SignalVu-PC Printable Help
OFDM Analysis
OFDM Channel Response Settings
Item
Display element
Description
1
Top-of-graph (magnitude)
Sets the level that appears at the top of the magnitude graph. This is only a
visual control for panning the graph. The Reference Level is adjusted in the
Toolbar and the Ampl control panel. By default, Vert Position = Ref Level.
2
dB/div (magnitude)
Sets the vertical scale value. The maximum value is 20.00 dB/division.
3
Display selector
Selects the display type. Channel Response Magnitude or Phase can be
displayed as a Magnitude or Phase graph.
4
Bottom-of-graph readout
(magnitude)
Indicates the amplitude at the bottom of the graph. This value changes with
the dB/div and Vertical Position settings.
5
Autoscale
Adjusts the Vertical and Horizontal scaling to display the optimize the trace
display on screen.
6
Pos
Shifts the trace left or right in the graph. The readout indicates the subcarrier
or frequency shown at the left edge of the display.
7
Scale
Specifies the number of subcarriers shown in the graph.
8
Top-of-graph (phase)
Sets the phase value indicated at the top of the graph. Since the Position
value at the vertical center of this graph remains constant as the Top of Graph
value is adjusted, the Vertical Scale increases as the Top of Graph value
increases, which also affects the bottom of graph readout.
9
Position (phase)
Specifies the phase shown at the center of the graph display. Changing this
value moves the trace up and down in the graph, which affects the Top of
Graph and Bottom of Graph values as well.
10
Bottom-of-graph (phase)
Indicates the phase at the bottom of the graph. This value changes with the
Position setting.
xxx
OFDM Channel Response Settings
The OFDM Channel Response Settings control panel provides access to settings that control parameters of
the Channel Response Display.
Settings tab
Description
Modulation Params (see
page 223)
Specifies the input signal standard and additional user-settable signal parameters.
Advanced Params (see
page 224)
Specifies parameters used by the instrument to analyze the input signal.
Data Range Tab (see
page 225)
Specifies which symbols and subcarriers of the signal to display.
Analysis Time Tab (see
page 225)
Specifies parameters that define the portion of the acquisition record that is used for
analysis. Also allows you to specify the time units (Symbols or Seconds) for OFDM
Analysis displays.
Prefs Tab (see page 229)
Specifies the units of the display and whether elements of the graphs are displayed.
xxx
SignalVu-PC Printable Help
207
OFDM Analysis
OFDM Constellation Display
OFDM Constellation Display
Display shows the OFDM signal subcarriers' amplitude and phase in IQ constellation form.
To show the OFDM Constellation display:
1. If you are analyzing a stored data file, recall the data file now. Otherwise, go to the next step.
2. Press the Displays button or select Setup > Displays.
3. In the Select Displays dialog, select OFDM Constellation in the Measurements box.
4. In the Available displays box, double-click the OFDM Constellation icon or select the icon and
click Add. The OFDM Constellation icon will appear in the Selected displays box and will no
longer appear under Available displays.
5. Click OK to show the OFDM Constellation display.
6. Set the Frequency appropriate for the signal.
7. Select Setup > Settings to display the control panel.
8. Select the Modulation Params tab. Set the Standard, Guard Interval and Spacing and Bandwidth
controls as appropriate for the input signal.
9. If you are analyzing a stored data file, press the Replay button to take measurements on the recalled
acquisition data file.
Elements of the Display
208
SignalVu-PC Printable Help
OFDM Analysis
OFDM Constellation Settings
Item
Display element
Description
1
Plot
Constellation graph.
2
Marker Readout
If markers are enabled, the marker readout shows the selected Marker,
Symbol, Subcarrier, Type, Value, Magnitude, and Phase for the symbol at
the marker location. Located to the left of the constellation plot or below it,
depending on the size of the window.
xxx
OFDM Constellation Settings
Application Toolbar:
The OFDM Constellation Settings control panel provides access to settings that control parameters of the
Constellation Display.
Settings tab
Description
Modulation Params (see
page 223)
Specifies the input signal standard and additional user-settable signal parameters.
Advanced Params (see
page 224)
Specifies parameters used by the instrument to analyze the input signal.
Data Range (see page 225)
Specifies which symbols and subcarriers of the signal to display.
Analysis Time Tab (see
page 225)
Specifies parameters that define the portion of the acquisition record that is used for
analysis. Also allows you to specify the Units (Symbols or Seconds) for OFDM Analysis
displays.
Trace (see page 227)
Enables you to freeze the display or hide the measurement or average trace.
Scale Tab (see page 227)
Specifies the Zoom scale, and vertical and horizontal positions of the display.
Prefs Tab (see page 229)
Specifies the units of the display and whether elements of the graphs are displayed.
xxx
OFDM EVM Display
The OFDM EVM display shows the data symbols' individual subcarrier Error Vector Magnitude values
versus symbol interval (time) and subcarrier (frequency).
To show the OFDM EVM display:
1. If you are analyzing a stored data file, recall the data file now. Otherwise, go to the next step.
2. Press the Displays button or select Setup > Displays.
3. In the Select Displays dialog, select OFDM EVM in the Measurements box.
4. In the Available displays box, double-click the OFDM EVM icon or select the icon and click Add.
The OFDM EVM icon will appear in the Selected displays box and will no longer appear under
Available displays.
5. Click OK to show the OFDM EVM display.
SignalVu-PC Printable Help
209
OFDM Analysis
OFDM EVM Settings
6. Set the Frequency appropriate for the signal.
7. Select Setup > Settings to display the control panel.
8. Select the Modulation Params tab. Set the Standard as appropriate. Set the Standard, Guard Interval
and Spacing and Bandwidth controls as appropriate for the input signal.
9. If you are analyzing a stored data file, press the Replay button to take measurements on the recalled
acquisition data file.
Elements of the Display
Item
Display element
Description
1
Top of graph
Sets the EVM value that appears at the top of the graph. This is only a visual
control for panning the graph.
2
Bottom of graph
Sets the EVM value that appears at the bottom of the graph. This is only a
visual control for panning the graph.
3
Autoscale
Adjusts the vertical and horizontal settings to provide the best display.
4
Pos
Specifies the horizontal position of the trace on the graph display.
5
Scale
Adjusts the horizontal range of the graph. By decreasing the scale, the graph
essentially becomes a window that you can move over the analysis results by
adjusting the position.
xxx
OFDM EVM Settings
Application Toolbar:
The settings for the OFDM EVM display are shown in the following table.
210
SignalVu-PC Printable Help
OFDM Analysis
OFDM Spectral Flatness Display
Settings tab
Description
Modulation Params (see
page 223)
Specifies the type of modulation used for the input signal and other parameters.
Advanced Params (see
page 224)
Specifies parameters used by the instrument to analyze the input signal.
Data Range (see page 225)
Specifies which symbols and subcarriers of the signal to display.
Analysis Time (see page 225)
Specifies parameters that define the portion of the acquisition record that is used for
analysis. Also allows you to specify the Units (Symbols or Seconds) for OFDM Analysis
displays.
Trace (see page 227)
Enables you to freeze the display or hide the measurement or average trace.
Scale (see page 227)
Specifies the vertical, subcarrier, and symbols scale and position settings.
Prefs (see page 229)
Specifies the units of the display and whether elements of the graphs are displayed.
xxx
OFDM Spectral Flatness Display
The OFDM Spectral Flatness display shows the average power levels of subcarriers across the signal
bandwidth and indicates if they remain within the limits defined for a particular standard.
The averaged subcarrier level is shown as a line on the display, while the individual subcarrier levels are
shown as points. The Pass or Fail result indicates whether the average line remains between the upper and
lower limit mask boundaries.
To show the OFDM Spectral Flatness display:
1. If you are analyzing a stored data file, recall the data file now. Otherwise, go to the next step.
2. Press the Displays button or select Setup > Displays.
3. In the Select Displays dialog, select OFDM Analysis in the Measurements box.
4. In the Available displays box, double-click the OFDM Flatness icon or select the icon and click
Add. The OFDM Flatness icon will appear in the Selected displays box and will no longer appear
under Available displays.
5. Click OK to show the OFDM Flatness display.
6. Set the Frequency appropriate for the signal.
7. Select Setup > Settings to display the control panel.
8. Select the Modulation Params tab. Set the Standard, Guard Interval, Subcarrier Spacing and Channel
Bandwidth controls as appropriate for the input signal.
9. If you are analyzing a stored data file, press the Replay button to take measurements on the recalled
acquisition data file.
SignalVu-PC Printable Help
211
OFDM Analysis
OFDM Spectral Flatness Settings
Elements of the Display
Item
Display element
Description
1
Top of graph
Sets the Flatness value that appears at the bottom of the graph in dB. This is
only a visual control for panning the graph.
2
Bottom of graph
Shows the Flatness value set at the top of the graph.
3
Autoscale
Adjusts the vertical and horizontal settings to provide the best display.
4
Pos
Specifies the horizontal position of the trace on the graph display.
5
Scale
Adjusts the horizontal range of the graph. By decreasing the scale, the graph
essentially becomes a window that you can move over the analysis results by
adjusting the position.
xxx
OFDM Spectral Flatness Settings
Application Toolbar:
The settings for the OFDM Spectral Flatness display are shown in the following table.
212
SignalVu-PC Printable Help
OFDM Analysis
OFDM Magnitude Error Display
Settings tab
Description
Modulation Params (see
page 223)
Specifies the type of modulation used for the input signal and other parameters.
Advanced Params (see
page 224)
Specifies parameters used by the instrument to analyze the input signal.
Data Range (see page 225)
Specifies which symbols and subcarriers of the signal to display.
Analysis Time Tab (see
page 225)
Specifies parameters that define the portion of the acquisition record that is used for
analysis. Also allows you to specify the Units (Symbols or Seconds) for WLAN Analysis
displays.
Trace (see page 227)
Enables you to display or hide the measurement or average trace.
Scale Tab (see page 227)
Specifies the vertical, subcarrier, and symbols scale and position settings.
Prefs Tab (see page 229)
Specifies the units of the display and whether elements of the graphs are displayed.
xxx
OFDM Magnitude Error Display
The OFDM Mag Error display shows the data symbols' individual subcarrier Magnitude Error values
versus symbol interval (time) and subcarrier (frequency).
To show the OFDM Magnitude Error display:
1. If you are analyzing a stored data file, recall the data file now. Otherwise, go to the next step.
2. Press the Displays button or select Setup > Displays.
3. In the Select Displays dialog, select OFDM Analysis in the Measurements box.
4. In the Available displays box, double-click the OFDM Mag Error icon or select the icon and click
Add. The OFDM Mag Error icon will appear in the Selected displays box and will no longer appear
under Available displays.
5. Click OK to show the OFDM Mag Error display.
6. Set the Frequency appropriate for the signal.
7. Select Setup > Settings to display the control panel.
8. Select the Modulation Params tab. Set the Standard, Guard Interval and Spacing and Bandwidth
controls as appropriate for the input signal.
9. If you are analyzing a stored data file, press the Replay button to take measurements on the recalled
acquisition data file.
SignalVu-PC Printable Help
213
OFDM Analysis
OFDM Magnitude Error Settings
Elements of the Display
Item
Display element
Description
1
Top of graph
Sets the Magnitude Error value that appears at the top of the graph. This is
only a visual control for panning the graph.
2
Bottom of graph
Sets the Magnitude Error value that appears at the bottom of the graph. This
is only a visual control for panning the graph.
3
Autoscale
Adjusts the vertical and horizontal settings to provide the best display.
4
Pos
Specifies the horizontal position of the trace on the graph display.
5
Scale
Adjusts the horizontal range of the graph. By decreasing the scale, the graph
essentially becomes a window that you can move over the analysis results by
adjusting the position.
xxx
OFDM Magnitude Error Settings
Application Toolbar:
The settings for the OFDM Mag Error display are shown in the following table.
214
SignalVu-PC Printable Help
OFDM Analysis
OFDM Phase Error Display
Settings tab
Description
Modulation Params (see
page 223)
Specifies the type of modulation used for the input signal and other parameters.
Advanced Params (see
page 224)
Specifies parameters used by the instrument to analyze the input signal.
Data Range (see page 225)
Specifies which symbols and subcarriers of the signal to display.
Analysis Time Tab (see
page 225)
Specifies parameters that define the portion of the acquisition record that is used for
analysis. Also allows you to specify the Units (Symbols or Seconds) for OFDM Analysis
displays.
Trace (see page 227)
Enables you to display or hide the measurement or average trace.
Scale Tab (see page 227)
Specifies the vertical, subcarrier, and symbols scale and position settings.
Prefs Tab (see page 229)
Specifies the units of the display and whether elements of the graphs are displayed.
xxx
OFDM Phase Error Display
The OFDM Phase Error display shows the data symbols' individual subcarrier Phase Error values versus
symbol interval (time) and subcarrier (frequency).
To show the OFDM Phase Error display:
1. If you are analyzing a stored data file, recall the data file now. Otherwise, go to the next step.
2. Press the Displays button or select Setup > Displays.
3. In the Select Displays dialog, select OFDM Analysis in the Measurements box.
4. In the Available displays box, double-click the OFDM Phase Error icon or select the icon and click
Add. The OFDM Phase Error icon will appear in the Selected displays box and will no longer
appear under Available displays.
5. Click OK to show the OFDM Phase Error display.
6. Set the Frequency appropriate for the signal.
7. Select Setup > Settings to display the control panel.
8. Select the Modulation Params tab. Set the Standard, Guard Interval and Spacing and Bandwidth
controls as appropriate for the input signal.
9. If you are analyzing a stored data file, press the Replay button to take measurements on the recalled
acquisition data file.
SignalVu-PC Printable Help
215
OFDM Analysis
OFDM Phase Error Settings
Elements of the Display
Item
Display element
Description
1
Top of graph
Sets the Phase Error value that appears at the top of the graph. This is only a
visual control for panning the graph.
2
Bottom of graph
Sets the Phase Error value that appears at the bottom of the graph. This is
only a visual control for panning the graph.
3
Autoscale
Adjusts the vertical and horizontal settings to provide the best display.
4
Pos
Specifies the horizontal position of the trace on the graph display.
5
Scale
Adjusts the horizontal range of the graph. By decreasing the scale, the graph
essentially becomes a window that you can move over the analysis results by
adjusting the position.
xxx
OFDM Phase Error Settings
Application Toolbar:
The settings for the OFDM Phase Error display are shown in the following table.
216
SignalVu-PC Printable Help
OFDM Analysis
OFDM Power Display
Settings tab
Description
Modulation Params (see
page 223)
Specifies the type of modulation used for the input signal and other parameters.
Advanced Params (see
page 224)
Specifies parameters used by the instrument to analyze the input signal.
Data Range (see page 225)
Specifies which symbols and subcarriers of the signal to display.
Analysis Time Tab (see
page 225)
Specifies parameters that define the portion of the acquisition record that is used for
analysis. Also allows you to specify the Units (Symbols or Seconds) for OFDM Analysis
displays.
Trace (see page 227)
Enables you to display or hide the measurement or average trace.
Scale Tab (see page 227)
Specifies the vertical, subcarrier, and symbols scale and position settings.
Prefs Tab (see page 229)
Specifies the units of the display and whether elements of the graphs are displayed.
xxx
OFDM Power Display
The OFDM Power display shows the data symbols' individual subcarrier Power values versus symbol
interval (time) and subcarrier (frequency).
To show the OFDM Power display:
1. If you are analyzing a stored data file, recall the data file now. Otherwise, go to the next step.
2. Press the Displays button or select Setup > Displays.
3. In the Select Displays dialog, select OFDM Analysis in the Measurements box.
4. In the Available displays box, double-click the OFDM Power icon or select the icon and click Add.
The OFDM Power icon will appear in the Selected displays box and will no longer appear under
Available displays.
5. Click OK to show the OFDM Power display.
6. Set the Frequency appropriate for the signal.
7. Select Setup > Settings to display the control panel.
8. Select the Modulation Params tab. Set the Standard, Guard Interval and Spacing and Bandwidth
controls as appropriate for the input signal.
9. If you are analyzing a stored data file, press the Replay button to take measurements on the recalled
acquisition data file.
SignalVu-PC Printable Help
217
OFDM Analysis
OFDM Power Settings
Elements of the Display
Item
Display element
Description
1
Vertical Position
Sets the top of graph value. This is only a visual control for panning the
graph. The Reference Level is adjusted in the Toolbar and the Ampl control
panel. By default, Vert Position = Ref Level.
2
dB/div
Sets the vertical scale value. The maximum value is 20.00 dB/division.
2
Bottom of graph readout
Indicates the amplitude at the bottom of the graph. This value changes with
the dB/div and Vertical Position settings.
3
Autoscale
Adjusts the vertical and horizontal settings to provide the best display.
4
Pos
Specifies the horizontal position of the trace on the graph display.
5
Scale
Adjusts the horizontal range of the graph. By decreasing the scale, the graph
essentially becomes a window that you can move over the analysis results by
adjusting the position.
xxx
OFDM Power Settings
Application Toolbar:
The settings for the OFDM Power display are shown in the following table.
218
SignalVu-PC Printable Help
OFDM Analysis
OFDM Summary Display
Settings tab
Description
Modulation Params (see
page 223)
Specifies the type of modulation used for the input signal and other parameters.
Advanced Params (see
page 224)
Specifies parameters used by the instrument to analyze the input signal.
Data Range (see page 225)
Specifies which symbols and subcarriers of the signal to display.
Analysis Time (see page 225)
Specifies parameters that define the portion of the acquisition record that is used for
analysis. Also allows you to specify the Units (Symbols or Seconds) for OFDM Analysis
displays.
Trace (see page 227)
Enables you to display or hide the measurement or average trace.
Scale (see page 227)
Specifies the vertical, subcarrier, and symbols scale and position settings.
Prefs (see page 229)
Specifies the units of the display and whether elements of the graphs are displayed.
xxx
OFDM Summary Display
The OFDM Summary display shows several measurements of OFDM signal quality.
To show the OFDM Summary display:
1. If you are analyzing a stored data file, recall the data file now. Otherwise, go to the next step.
2. Press the Displays button or select Setup > Displays.
3. In the Select Displays dialog, select OFDM Analysis in the Measurements box.
4. In the Available displays box, double-click the OFDM Summary icon or select the icon and click
Add. The OFDM Summary icon will appear in the Selected displays box and will no longer appear
under Available displays.
5. Click OK to show the OFDM Summary display.
6. Set the Frequency appropriate for the signal.
7. Select Setup > Settings to display the control panel.
8. Select the Modulation Params tab. Set the Standard, Guard Interval and Spacing and Bandwidth
controls as appropriate for the input signal.
9. If you are analyzing a stored data file, press the Replay button to take measurements on the recalled
acquisition data file.
SignalVu-PC Printable Help
219
OFDM Analysis
OFDM Summary Settings
Elements of the Display
Measurement
Description
Standard
Display of the standard selected on the Setup > Settings > Modulation Params tab.
Frequency Error
The frequency difference between the measured carrier frequency of the signal and the
measurement frequency setting.
IQ Origin Offset
The average magnitude of the DC subcarrier level relative to total signal power. It
indicates the level of carrier feedthrough detected at the center (DC) subcarrier.
Average Power
The average power of all symbols in the analysis. Calculated over only the data symbols
in the packet.
Symbols
How many symbols were analyzed.
Symbol Clk Error
The symbol clock error in parts per million.
CPE
CPE, Common Pilot Error, is the RMS magnitude error of the pilots over all analyzed
symbols.
Peak-to-Average
The ratio of the highest instantaneous signal power level to the average signal power.
Calculated over only the data symbols in the packet.
EVM
The RMS and Peak values of the normalized subcarrier Error Vector Magnitude values.
The normalized subcarrier EVM values are calculated as the difference between the
detected received signal subcarrier constellation points and ideal reference points
estimated by the instrument from the received signal. Values are reported in units of
percent and dB. Peak values include the symbol and subcarrier location.
RMS and Peak values are displayed for groupings of all subcarriers, Pilots only and Data
only. Results are calculated over the entire signal packet analyzed, covering the number
of Symbols indicated in the Summary display.
xxx
OFDM Summary Settings
Application Toolbar:
The settings for the OFDM Summary display are shown in the following table.
220
SignalVu-PC Printable Help
OFDM Analysis
OFDM Symbol Table Display
Settings tab
Description
Modulation Params (see
page 223)
Specifies the type of modulation used for the input signal and other parameters.
Advanced Params (see
page 224)
Specifies parameters used by the instrument to analyze the input signal.
Data Range (see page 225)
Specifies which symbols and subcarriers of the signal to display.
Analysis Time (see page 225)
Specifies parameters that define the portion of the acquisition record that is used for
analysis. Also allows you to specify the Units (Symbols or Seconds) for OFDM Analysis
displays.
Prefs (see page 229)
Specifies the units of the display and whether elements of the graphs are displayed.
xxx
OFDM Symbol Table Display
The OFDM Symbol Table display shows decoded data bits for each subcarrier in each symbol in the
analyzed signal packet. Results are presented with subcarrier (frequency) indices in the horizontal
dimension and symbol (time) intervals in the vertical dimension.
To show the OFDM Symbol Table display:
1. If you are analyzing a stored data file, recall the data file now. Otherwise, go to the next step.
2. Press the Displays button or select Setup > Displays.
3. In the Select Displays dialog, select OFDM Analysis in the Measurements box.
4. In the Available displays box, double-click the OFDM Symb Table icon or select the icon and click
Add. The OFDM Symbol icon will appear in the Selected displays box and will no longer appear
under Available displays.
5. Click OK to show the OFDM Symbol Table display.
6. Set the Frequency appropriate for the signal.
7. Select Setup > Settings to display the control panel.
8. Select the Modulation Params tab. Set the Standard, Guard Interval and Spacing and Bandwidth
controls as appropriate for the input signal.
9. If you area analyzing a stored data file, press the Replay button to take measurements on the recalled
acquisition data file.
SignalVu-PC Printable Help
221
OFDM Analysis
OFDM Symbol Table Settings
Item
Description
1
Subcarrier identifiers.
2
Symbol identifiers.
3
Subcarrier data values.
4
Marker readout when markers are enabled.
xxx
OFDM Symbol Table Settings
Application Toolbar:
The settings for the OFDM Symbol Table display are shown in the following table.
Settings tab
Description
Modulation Params (see
page 223)
Specifies the type of modulation used for the input signal and other parameters.
Advanced Params (see
page 224)
Specifies parameters used by the instrument to analyze the input signal.
Data Range (see page 225)
Specifies which symbols and subcarriers of the signal to display.
Analysis Time (see page 225)
Specifies parameters that define the portion of the acquisition record that is used for
analysis. Also allows you to specify the Units (Symbols or Seconds) for OFDM Analysis
displays.
Prefs (see page 229)
Specifies the units of the display and whether elements of the graphs are displayed.
xxx
OFDM Analysis Shared Measurement Settings
Application Toolbar:
222
SignalVu-PC Printable Help
OFDM Analysis
Modulation Params Tab - OFDM
The control panel tabs in this section are shared between the displays in the OFDM Analysis folder (Setup
> Displays). Some tabs are shared by all the displays, some tabs are shared by only a couple of displays.
The settings available on some tabs change depending on the selected display.
Common controls for OFDM analysis displays
Settings tab
Description
Modulation Params (see
page 223)
Specifies the type of modulation used for the input signal and other parameters.
Advanced Params (see
page 224)
Specifies parameters used by the instrument to analyze the input signal.
Data Range (see page 225)
Specifies which symbols and subcarriers of the signal to display.
Analysis Time (see page 225)
Specifies parameters that define the portion of the acquisition record that is used for
analysis. Also allows you to specify the Units (Symbols or Seconds) for OFDM Analysis
displays.
Trace (see page 227)
Enables you to display or hide the measurement or average trace.
Scale (see page 227)
Specifies the vertical, subcarrier, and symbols scale and position settings.
Prefs (see page 229)
Specifies the units of the display and whether elements of the graphs are displayed.
xxx
Modulation Params Tab - OFDM
The Modulation Params tab specifies the type of modulation used by the input signal and other parameters
that control the demodulation of the input signal.
Settings
Description
Standard
Specifies the standard used for the input signal. Choices are 802.11a/g/j and
802.16 (2004).
Guard Interval
Specifies the guard interval used in the input signal. Choices are 1/4, 1/8, 1/16/,
1/32, and User. When you select User, you can enter a percentage value to
specify the size of the guard interval as a percentage of the useful symbol
interval. The Guard Interval range is 0–100%.
Spacing and Bandwidth
Specifies the spacing between subcarriers and the nominal channel bandwidth.
Only one of these settings can be set at a time, the other setting is automatically
calculated.
Sample Rate
Indicates the FFT sample rate, based on the bandwidth or subcarrier setting.
xxx
SignalVu-PC Printable Help
223
OFDM Analysis
Advanced Params Tab - OFDM
Advanced Params Tab - OFDM
The Advanced Params tab contains parameters that control the analysis of the input signal.
Settings
Description
Constellation determination
Specifies the method used to detect the constellation. Auto Detect analyzes the
signal to determine the appropriate constellation, Manual allows you to specify
the constellation type. Manual choices are: BPSK, QPSK, 16QAM, and 64QAM.
Symbol analysis offset
Specifies the analysis offset in the symbol interval. This value is a percentage
of the Guard Interval. The allowable range is -100% to 0%. -100% positions
the FFT to start at the beginning of the Guard Interval, 0% positions it to start
at the end of the Guard Interval. Default value is -50% which usually gives
the best measurement results.
Channel Estimation
Specifies the method used to estimate channel frequency response and
equalization. This control can be used to diagnose changes in frequency
response over the signal packet.
Preamble
When you select Preamble, the instrument uses only the Preamble to estimate
channel frequency response. This response is then used to equalize the entire
signal packet.
Preamble + Data
When you select Preamble + Data, the instrument makes an initial channel
frequency response estimate from the Preamble. Then estimates the channel
response for each data symbol using the decoded data content to derive
equalization for each symbol individually. This allows compensation for
time-varying channel response over the packet.
Pilot tracking
Specifies if pilot subcarriers should be used to correct amplitude, phase, and
symbol timing variations over the packet. The choices available are Phase,
Amplitude, and Timing. The default setting is Phase.
Swap I & Q
Select the checkbox to swap the I and Q components of a signal. This
compensates the input signal for spectral inversion.
xxx
224
SignalVu-PC Printable Help
OFDM Analysis
Data Range Tab - OFDM
Data Range Tab - OFDM
The Data Range tab enables you to control how much signal is analyzed, as well as specify the range of
results that are displayed in the Constellation, EVM, Magnitude Error, Phase Error, Power and Symbol
Table graphs.
Settings
Symbols
Description
Specifies which symbols are displayed in the graphs.
All
Select All to display all symbols.
Range
Select Range to specify a subset of symbols for display.
Start
Specifies the first symbol to include in the display.
Number
Specifies how many symbols to display in the graphs.
Single
Index
Subcarriers
Select Single to display a single symbol.
Use Index to specify the symbol you want to display.
Specifies which subcarriers are displayed.
All
Select All to display all subcarriers in the signal.
Pilots Only
Select Pilot to display only pilot subcarriers.
Data Only
Select Data to display only data subcarriers.
Single
Specifies a specific subcarrier for display.
Index
Range
Specifies the specific subcarrier to be displayed.
Specifies a range to subcarriers to be displayed.
Start
Specifies the start value of the range to be displayed.
Stop
Specifies the ending value of the range to be displayed.
Max symbols to analyze
Specifies how many symbols are analyzed. You can use this setting to speed
analysis by limiting the number of symbols being analyzed.
xxx
Analysis Time Tab - OFDM
The Analysis Time tab contains parameters that define how the signal is analyzed in the OFDM Analysis
displays.
SignalVu-PC Printable Help
225
OFDM Analysis
Analysis Time Tab - OFDM
Settings
Description
Analysis Offset
Specifies the location of the first time sample to use in measurements.
Auto
Analysis Length
When enabled, causes the instrument to set the Analysis Offset value based on the
requirements of the selected display.
Specifies the length of the analysis period to use in measurements. Length is specified in
either symbols or seconds, depending on the Units setting.
Auto
When enabled, causes the instrument to set the Analysis Length value based on the
requirements of the selected display.
Actual
This is a displayed value, not a setting. It is the Analysis Length (time or symbols)
being used by the analyzer, this value may not match the Analysis Length requested
(in manual mode).
Time Zero Reference
Specifies the zero point for the analysis time.
Units
Specifies the units of the Analysis Length to either Symbols or Seconds.
xxx
Analysis Offset
Use analysis offset to specify where measurements begin. Be aware that you cannot set the Analysis
Offset outside the range of time covered by the current acquisition data. (all time values are relative
to the Time Zero Reference).
You can set the Analysis Length so that the requested analysis period falls partly or entirely outside the
current range of acquisition data settings. When the next acquisition is taken, its Acquisition Length will
be increased to cover the new Analysis Length, as long as the Sampling controls are set to Auto. If the
Sampling parameters are set to manual, or if the instrument is analyzing saved data, the actual analysis
length will be constrained by the available data length, but in most cases, measurements are able to be
made anyway. The instrument will display a notification when measurement results are computed from
less data than requested. Range: 0 to [(end of acquisition) - Analysis Length)]. Resolution: 1 effective
sample (or symbol).
Analysis Length
Use the analysis length to specify how long a period of time is analyzed. As you adjust this value, the
actual amount of time for Analysis Length, in Symbol or Seconds units, is shown below the control in the
"Actual" readout. This setting is not available when Auto is checked. Range: minimum value depends on
modulation type. Resolution: 1 symbol.
226
SignalVu-PC Printable Help
OFDM Analysis
Trace Tab - OFDM
Time Zero Reference
All time values are measured from this point (such as marker position or horizontal position (in Y vs Time
displays). Choices are: Acquisition Start or Trigger.
Parameter
Description
Acquisition Start
Offset is measured from the point at which acquisition begins.
Trigger
Offset is measured from the trigger point.
xxx
Trace Tab - OFDM
The Trace tab allows you to set the trace display characteristics of the selected display. This tab is not
available for all OFDM displays.
Settings
Description
Trace
Use this drop-down list to select whether or not the Average trace or the measurement
trace is displayed. The measurement trace depends on the selected display.
Show
Select or deselect this checkbox to show or hide the trace selected in the Trace
drop-down list.
Freeze
Selecting Freeze halts updates to the trace.
xxx
Scale Tab - OFDM
The Scale tab allows you to change the scale settings that control how the trace appears on the display but
does not change control settings such as Measurement Frequency. There are two versions of the Scale tab
for OFDM displays. One version is used only for the Constellation display and the other version is used
for the OFDM EVM, OFDM Magnitude Error, OFDM Phase Error, and OFDM Power displays.
SignalVu-PC Printable Help
227
OFDM Analysis
Scale Tab - OFDM
Scale tab for OFDM EVM, OFDM Mag Error, OFDM Phase Error, and OFDM Power displays
Scale tab for OFDM Constellation display
Settings
Description
Vertical
Controls the vertical position and scale of the trace display.
Scale
Changes the vertical scale of the graph.
Position
Adjusts the reference level away from top of the graph.
Autoscale
Resets the scale of the vertical axis to contain the complete trace.
Subcarrier
Controls the scale of the subcarrier graph and position of the trace.
Scale
Specifies how many subcarriers are displayed horizontally.
Position
Specifies the subcarrier that appears at the left edge of the subcarrier graph.
Autoscale
Resets the scale of the horizontal axis to contain the complete trace.
Symbols
Controls the scale of the Symbols graph.
Scale
Specifies the number of symbols that appear in the symbols graph.
Position
Specifies the symbol that appears at the left edge of the Symbols graph.
Autoscale
Resets the scale and position settings to optimize the display.
Auto
When Auto is checked, the scale and position values for the Symbols graph are
automatically adjusted to maintain the optimal display.
Zoom
Sets the Constellation display size and position.
Scale
Sets the magnification value for the Constellation display.
Vertical Position
Sets the vertical location of the Constellation display within the graph. Range is -3.7 to
+3.7.
Horizontal Position
Sets the horizontal location of the Constellation display within the graph. Range is -3.7 to
+3.7.
xxx
228
SignalVu-PC Printable Help
OFDM Analysis
Prefs Tab - OFDM
Prefs Tab - OFDM
The Prefs tab enables you to change appearance characteristics of the OFDM Analysis displays. Not all
settings on the Prefs tab shown below appear for every OFDM display.
Settings
Description
Time units
Specifies whether the displayed time units are seconds or symbols.
Freq units
Specifies whether the displayed frequency units are frequency (Hz) or subcarrier channel.
Radix
Specifies whether symbol values are displayed in binary or hex format (for example, in
the Symbol Table or markers readouts).
Show graphs
Specifies which graph types are displayed.
Both
Displays both the Subcarrier and Symbol graphs.
Subcarriers
Displays only the subcarrier graph.
Symbols
Displays only the symbol graph.
Show graticule
Displays or hides the graticule in the graphs.
Show marker readout
Displays or hides the marker readouts in the graphs.
xxx
SignalVu-PC Printable Help
229
OFDM Analysis
230
Prefs Tab - OFDM
SignalVu-PC Printable Help
Pulsed RF
Overview
Overview
The displays in Pulsed RF (Displays > Measurements > Pulsed RF) are:
Pulse Statistics
Pulse Table
Pulse Trace
The Pulse measurements provide deep insight into pulse train behavior.
Pulse Measurements
The analyzer takes the following pulse measurements: Average ON Power, Peak Power, Average
Transmitted Power, Pulse Width, Rise Time, Fall Time, Repetition Interval (Sec), Repetition Rate
(Hz), Duty Factor (%), Duty Factor (Ratio), Ripple, Droop, Pulse-Pulse Phase Difference, Pulse-Pulse
Frequency Difference, RMS Frequency Error, Maximum Frequency Error, RMS Phase Error, Maximum
Phase Error, Frequency Deviation, Delta Frequency, Phase Deviation, and Time. See Available
Measurements (see page 29) for definitions.
Pulse Table Display
The Pulse Table lists selected measurements in a spreadsheet format, showing the pulse numbers and all
the results for each measurement on all the detected pulses. Pulses are numbered from one.
SignalVu-PC Printable Help
231
Pulsed RF
Pulse Table Settings
Displaying the Pulse Table
1. Press the Displays button or select Setup > Displays.
2. Select Pulsed RF in the Measurements box.
3. Double-click Pulse Table in the Available displays box to add the display to the Selected displays box.
4. Click OK.
Selecting the Measurements to Show
1. With the Pulse Table selected, press the Settings button.
2. In the Pulse Table Settings control panel, select the Measurements tab.
3. Select the measurements you wish to take from the list of measurements or click Select all to choose
all measurements.
4. Click the close box ( ) to remove the Settings control panel.
Changing the Pulse Table Display Settings (see page 232)
Pulse Table Settings
Menu Bar: Setup > Settings
Application Toolbar:
The Settings control panel tabs for the Pulse Table Display are shown in the following table.
Settings tab
Description
Measurements (see page 233)
Selects the measurements to be show in the Pulse Table.
Params (see page 238)
Specifies several parameters that control how pulses are counted and defined.
Define (see page 240)
Specifies parameters that control where measurements are taken on a pulse.
Levels (see page 245)
Specifies parameters that control the method and levels used to calculate some pulse
values.
Freq Estimation (see
page 245)
Specifies the reference used for computing frequency errors.
xxx
Restore defaults. Sets the Pulse Table parameters to their default values.
232
SignalVu-PC Printable Help
Pulsed RF
Measurements Tab
Measurements Tab
The Measurements tab is used to specify the measurements that appear in the Pulse Table.
Show in Pulse
Checked measurements appear in the Pulse Table.
Select all
Click Select all to choose all measurements for display in the Pulse Table.
Clear all
Click Clear all to remove all measurements from the Pulse Table display.
Pulse Trace Display
The Pulse Trace display shows one measurement result and a trace graph illustrating that measurement
for a selected pulse number. You can also choose to display arrows and lines in the graph that illustrate
where on the pulse the measurement is being taken.
SignalVu-PC Printable Help
233
Pulsed RF
Pulse Trace Display
Elements of the Pulse Trace Display
Item
Display element
Description
1
Check mark indicator
The check mark indicator in the upper, left-hand corner of the display shows
when the Pulse Trace display is the optimized display.
NOTE. When Best for multiple windows is selected in the Amplitude control
panel's RF & IF Optimization control, none of the measurement displays
shows a checkmark, as there is not a single optimized measurement.
2
Result
Use this list to select the measurement to show. The measurement chosen
here selects the same result to be displayed in the Statistics view and
highlighted in the Table view. Selecting a result in any of these views causes
the same result to be selected in all of them.
3
Pulse
Selects which pulse result is shown. Like the Result, this selection is shared
with the Statistics and Table views. The maximum number of pulses that
can be measured is limited to 10000.
4
Pulse threshold indicator
This green triangle indicates the power threshold used to detect pulses. See
Settings > Params > Power threshold to detect pulses.
5
Autoscale
Set the axes to values that show all trace points.
6
Horizontal offset and scale
Located along the bottom edge of the trace display, these controls specify the
offset and scale on the horizontal axis.
7
Top of graph adjustment
Sets the power level shown at the top of the graph. If the number is greater
than the Ref Level, a white line will appear in the graph to indicate the Ref
Level.
8
Vertical scale
Sets the vertical scale value.
xxx
234
SignalVu-PC Printable Help
Pulsed RF
Pulse Trace Settings
Changing the Pulse Trace Display Settings (see page 235)
Pulse Trace Settings
Menu Bar: Setup > Settings
Application Toolbar:
The Setup settings for the Pulse Trace display are shown in the following table.
Settings tab
Description
Params (see page 238)
Specifies several parameters that control how pulses are counted and defined.
Define (see page 240)
Specifies parameters that control where measurements are taken on a pulse.
Levels (see page 245)
Specifies parameters that control the method and levels used to calculate some pulse
values.
Freq Estimation (see
page 245)
Specifies the reference used for computing frequency error.
Scale (see page 247)
Specifies the vertical and horizontal scale settings.
Prefs (see page 248)
Specifies whether on not certain display elements are shown.
xxx
Pulse Statistics Display
The Pulse Statistics view displays a plot of a pulse measurement's values for every pulse in the analysis
period. For example, the Pulse Statistics display will show the rise time measurement for each of 30
pulses, with rise time on the Y axis and pulse number on the X axis. Alternatively, the Statistics Display
can show an FFT trace for the values of a measurement over all the pulses analyzed. Numeric readouts of
Max, Min, and Average in this display summarize results for the selected pulse measurement.
SignalVu-PC Printable Help
235
Pulsed RF
Pulse Statistics Display
Elements of the Pulse Statistics Display
236
SignalVu-PC Printable Help
Pulsed RF
Pulse Statistics Settings
Item
Display element
Description
1
Check mark indicator
The check mark indicator in the upper, left-hand corner of the display shows
when the Pulse Statistics display is the optimized display.
NOTE. When Best for multiple windows is selected in the Amplitude control
panel's RF & IF Optimization control, none of the measurement displays
shows a checkmark, as there is not a single optimized measurement.
2
Result
Use this list to select which measurement statistics to display. The
measurement chosen here selects the same result to be displayed in the
Pulse Trace display and the Pulse Table display. Selecting a result in any of
these views causes the same result to be selected in all of them.
3
Pulse
Selects which pulse's result is shown. Like the Result, this selection is shared
with the Statistics and Table views.
4
Statistics summary
Display of measurement statistics for the selected Result.
5
Vertical range
Located at the top of the left graph edge and at the bottom of the left graph
edge, use these controls to adjust the values at the top of the graph and the
bottom of the graph.
6
Plot
Selects from Trend, Time Trend, FFT, and Histogram for the graph.
7
Autoscale
Set the axes to values that show all trace points.
8
Horizontal offset
Adjusting this value moves the graph right or left.
9
Trigger indicator
Indicates the trigger point on the pulse train if the trigger occurred during the
time frame of the pulse measurements.
10
Pulse indicator
For Trend and Time Trend plot types, this indicates the pulse selected by the
Pulse setting. For the FFT plot type, this indicator marks the trace point at
the selected frequency. For Histogram plot types, this indicator marks the
selected results bin.
11
Scale
Adjusts the horizontal scale.
xxx
Changing the Pulse Statistics Display Settings (see page 237)
Pulse Statistics Settings
Menu Bar: Setup > Settings
Application Toolbar:
The settings for the Pulse Statistics Display are shown in the following table.
SignalVu-PC Printable Help
237
Pulsed RF
Pulsed RF Shared Measurement Settings
Settings tab
Description
Params (see page 238)
Specifies several parameters that control how pulses are counted and defined.
Define (see page 240)
Specifies parameters that control where measurements are taken on a pulse.
Levels (see page 245)
Specifies parameters that control the method and levels used to calculate some pulse
values.
Freq Estimation (see
page 245)
Specifies the reference used for computing frequency errors.
Scale (see page 247)
Specifies the vertical and horizontal scale settings.
Prefs (see page 248)
Specifies whether or not certain elements of the display are shown.
xxx
Pulsed RF Shared Measurement Settings
The control panel tabs in this section are shared by the displays in the Pulsed RF folder (Setup > Displays).
Changing a setting on one tab changes that setting for all the Pulsed RF displays.
Common controls for pulsed RF displays
Settings tab
Description
Params (see page 238)
Specifies several parameters that control how pulses are counted and defined.
Define (see page 240)
Specifies parameters that control where measurements are taken on a pulse.
Levels (see page 245)
Specifies parameters that control the method and levels used to calculate some pulse
values.
Freq Estimation (see
page 245)
Specifies the reference used for computing frequency errors.
Scale (see page 247)
Specifies the vertical and horizontal scale settings.
Prefs (see page 248)
Specifies whether or not certain elements of the display are shown.
xxx
Params Tab
The Params tab enables you to adjust several measurement parameters for Pulsed RF displays.
238
SignalVu-PC Printable Help
Pulsed RF
Params Tab
Setting
Description
Measurement Filter
Specify whether a filter is used to limit the bandwidth of the input signal.
Bandwidth
Sets the bandwidth of the measurement filter.
Power threshold to detect
pulses
Specifies the level used for locating pulses in the data.
Minimum OFF time between
pulses
Specifies the time the signal must fall below the power threshold for two pulses to be
considered separate pulses.
Max number of pulses
Specifies the number of pulses to measure within the analysis time.
xxx
Measurement Filter
Three choices are available for the measurement filter:
No Filter - Max BW: The widest acquisition bandwidth available is used. The Bandwidth setting is
disabled, but shows the value in use.
No Filter: - This is the default. The Bandwidth control is enabled for you to specify an acquisition
bandwidth.
Gaussian - The Bandwidth control is enabled for you to specify a value. The instrument uses an
acquisition bandwidth two times wider than the entered value.
Power Threshold to Detect Pulses
Specifies the minimum power level the trace must exceed to be detected as a pulse. The range for this
setting is: -3 to -70 dBc. The setting resolution is 1 dB. The default value is -10 dB.
Max Number of Pulses
If the Analysis Time contains fewer pulses than specified, the analyzer will measure all the pulse within
the analysis time. If there are more pulses in the Analysis Time, than the specified number, the analyzer
measures the specified number of pulses and ignores the rest. The range for this setting is: 1 - 10000.
The setting resolution is: 1. If this setting is not checked, the analyzer will measure all pulses within the
Analysis Time, up to a maximum of 10000 pulses.
To determine the maximum number of pulses that can be analyzed, use the following equation:
where:
Pulse rate is the number of pulses per second (frequency).
Capacity is a length of time which is displayed on the Acquire > Sampling Parameters tab.
Note that the maximum number of pulses is affected by several parameters. For example, measurement
bandwidth affects the sample rate. The measurement algorithm also can reduce the maximum number of
pulses that can be analyzed (by increasing the sample rate) based on the characteristics of the signal.
Additionally, when FastFrame is enabled, determining the maximum number of pulses is even more
challenging. In FastFrame mode, the signal analyzer samples the signal around events of interest and
SignalVu-PC Printable Help
239
Pulsed RF
Define Tab
ignores the signal between events of interest. Thus, if the instrument is only looking at pulses and
ignoring the signal between pulses, the number of pulses that can be analyzed depends strongly on the
characteristics of the pulse itself (for example, fewer wide pulses can be analyzed than narrow pulses,
all other things being equal).
Define Tab
The Define tab enables you to specify parameters that control where measurements are made on a pulse.
The settings available depend on the measurement selected.
The following paragraphs describe the settings that appear on the Define tab according to the
Measurement(s) selection.
Freq-Domain Linearity
240
SignalVu-PC Printable Help
Pulsed RF
Define Tab
Setting
Description
Time method
Specifies how the measurement's duration is determined. The choices are
Absolute and Relative.
Absolute time method
Ref (R)
Ref specifies the level along the pulse rising edge that is defined as the point
from which Start time is counted. Choices: 50%, 60%, 70%, 80%, 90% 100%;
Default: 100%
Start (S)
Start specifies the time the instrument waits after the rising-edge reference before
starting to measure the pulse. The Start time is measured from the point along the
pulse rising edge specified by the Ref setting. Start Range: ±100 ms; Resolution:
3 digits; inc/dec small: 1 ns, large: 1,2,5,10...; Default: 0
Length (L)
Length specifies the period of time that is used for pulse measurements The
measurement time begins at the Start point and continues for the amount of time
specified by Length.
Relative time method
Length
In the Relative time method, Length specifies the percentage of the top of the pulse
that is used for measurements. The instrument automatically determines the pulse
top. The measurement length is centered within the pulse ON time.
xxx
Impulse Response
SignalVu-PC Printable Help
241
Pulsed RF
Define Tab
Setting
Description
Apply ampl corrections
Enable/disable corrections that remove errors due to the window function and to
the time offset of the side lobe.
Keep-out time (+/-)
The Keep-out time specifies a region that is ignored when the trace is analyzed for
side lobes. The setting defines a region to the left and to the right of the center
of the main lobe. Lobes that fall within this time region are not eligible to be the
“highest side lobe”.
Time method
Specifies how measurement parameters are determined. The choices are
Absolute and Relative.
Absolute time method
Ref (R)
Ref specifies the level along the pulse rising edge that is defined as the point
from which Start time is counted. Choices: 50%, 60%, 70%, 80%, 90% 100%;
Default: 100%
Start (S)
Start specifies the time the instrument waits after the rising-edge reference before
starting to measure the pulse. The Start time is measured from the point along the
pulse rising edge specified by the Ref setting. Start Range: ±100 ms; Resolution:
3 digits; inc/dec small: 1 ns, large: 1,2,5,10...; Default: 0
Length (L)
Amount of time that should be included in the measurement. The measurement
time begins at the Start point and continues for the amount of time specified by
Length.
Relative time method
Length
In the Absolute time method, Length specifies the period of time that is used for
pulse measurements.
In the Relative time method, Length specifies the percentage of the top of the pulse
that is used for measurements. The instrument automatically determines the pulse
top. The measurement length is centered within the pulse ON time.
xxx
Freq Diff, Phase Diff
Setting
Description
Measure point
Specifies the period in time after the 50% rising edge at which frequency and
phase difference measurements are made.
xxx
242
SignalVu-PC Printable Help
Pulsed RF
Define Tab
Ripple
Setting
Description
Length
Length specifies the percentage of the top of the pulse that is used for
measurements. The instrument automatically determines the pulse top. The
measurement length is centered within the pulse ON time. Only the Relative Time
method is available for Ripple.
xxx
Overshoot
SignalVu-PC Printable Help
243
Pulsed RF
Define Tab
Setting
Description
Time method
Specifies how measurement parameters are determined. The choices are
Absolute and Relative.
Absolute time method
Ref (R)
Ref specifies the level along the pulse rising edge that is defined as the point
from which Start time is counted. Choices: 50%, 60%, 70%, 80%, 90% 100%;
Default: 100%
Start (S)
Start specifies the time the instrument waits after the rising-edge reference before
starting to measure the pulse. The Start time is measured from the point along the
pulse rising edge specified by the Ref setting. Start Range: ±100 ms; Resolution:
3 digits; inc/dec small: 1 ns, large: 1,2,5,10...; Default: 0
Length (L)
Amount of time that should be included in the measurement. The measurement
time begins at the Start point and continues for the amount of time specified by
Length.
Relative time method
Ref
Ref specifies the level along the pulse rising edge that is defined as the point
from which Start time is counted. Choices: 50%, 60%, 70%, 80%, 90% 100%;
Default: 100%
Start
Start specifies the time the instrument waits after the rising-edge reference before
starting to measure the pulse. The Start time is measured from the point along the
pulse rising edge specified by the Ref setting. Start Range: ±100 ms; Resolution:
3 digits; inc/dec small: 1 ns, large: 1,2,5,10...; Default: 0
Length
In the Relative time method, Length specifies the percentage of the top of the pulse
that is used for measurements. The instrument automatically determines the pulse
top. The measurement length is centered within the pulse ON time.
xxx
244
SignalVu-PC Printable Help
Pulsed RF
Levels Tab
Levels Tab
Use the Levels tab to set parameters that control the method and levels used to calculate some pulse values.
Setting
Description
100% Level
Specifies the method used to determine the 100% level(s).
50% Level
Specifies the method used to determine the 50% level on the pulse.
Rise/Fall Levels
Select whether to use the 10% to 90% or 20% to 80% points (based on voltage level)
to define the rise and fall times.
xxx
100% Level
Use the 100% Level settings to select the method used to determine the 100% level(s) used for calculating
pulse parameters, for example, Rise, Fall, and Width.
The Pulse Average Amplitude defines the pulse top as the average of the values of all the points along
the pulse top. This average is used as the 100% level, from which the 10, 20, 50, 80 and 90% levels are
calculated. Pulse measurements are referenced against these various levels. For example, Rise is the time
between the 10 and 90% (or 20 and 80%) levels on the rising edge of the pulse. When the Pulse Average
Amplitude method is selected, the same 100% level is used for both rising and falling edges.
Because some RF pulse types have droop (a height difference between the beginning and ending points of
the pulse top), the 100% percent level on the rising edge may not be equal to the 100% level on the falling
edge. The Independent method of pulse point location is designed for pulses with different 100% levels
at their rising and falling edges. The Independent method calculates the 100% level for the rising edge
separately from the 100% level of the falling edge. As a result, the 10, 20, 50, 80 and 90% levels are also
different for the rising and falling edges, allowing for more accurate measurements on pulses with droop.
50% Level
Select Voltage to use -6 dB as the 50% point. Select Power to use -3 dB as the 50% level.
Freq Estimation Tab
Use the Freq Estimation tab to specify parameters used for determining frequency offset.
SignalVu-PC Printable Help
245
Pulsed RF
Freq Estimation Tab
Setting
Description
Modulation type
Specifies which algorithm to use for estimating frequency error.
Pulse Frequency Reference
Specifies the method used to determine the pulse frequency error and if applicable,
the chirp slope.
Auto
Selecting Auto causes the instrument to calculate the frequency offset and if applicable,
the chirp slope.
Freq Offset
If Auto is not enabled, specify the value for frequency offset here. If Auto is enabled, the
offset is set to zero and this readout displays the calculated frequency error.
Chirp BW
If Auto is not enabled, specify the value for Chirp Slope here. If Auto is enabled,
this readout displays the calculated Chirp slope. This setting is used only when the
modulation type is set to Linear Chirp.
xxx
Modulation Type
Frequency estimation is performed by the instrument using selectable methods, depending on signal type.
The selections for modulation type are CW (constant phase), CW (changing phase), Linear Chirp and
Other. Select the method of frequency method based upon a best match to your signal based on the
following descriptions:
CW (constant phase): The signal is not designed to change in either frequency or phase during the
measured pulse train.
CW (changing phase): The signal does not change the carrier phase within each pulse, although it
could change the phase from one pulse to another pulse. The signal is not designed to make frequency
changes.
Linear Chirp: The signal changes frequency in a linear manner during each pulse. The signal has the
same carrier phase at the same time offset from the rising edge of the pulse.
Other: The signal is not one of the listed types. You must manually enter the Frequency Offset value.
The following table maps the appropriate signal type selection with the signal characteristics.
Signature
Phase offset from one pulse to another
Zero
Any (unknown)
CW
CW Constant Phase
CW Changing Phase
LFM
Linear Chirp
N/A
xxx
246
SignalVu-PC Printable Help
Pulsed RF
Scale Tab
Scale Tab
The Scale tab allows you to change the vertical and horizontal scale settings. Changing the scale settings
changes how the trace appears on the display but does not change control settings such as Measurement
Frequency. In effect, these controls operate like pan and zoom controls.
Setting
Description
Vertical
Controls the vertical position and scale of the trace display.
Scale
Changes the vertical scale. The units for this setting depend on the statistic selected
from the Result drop-down list in the Pulse Statistics display.
Position
Adjusts the Reference Level away from the top of the trace display. The units for this
setting depend on the statistic selected from the Result drop-down list in the Pulse
Statistics display.
Autoscale
Resets the scale of the vertical axis to contain the complete trace.
Horizontal
Controls the span of the trace display and position of the trace.
Scale
Allows you to change the span.
Position
Allows you to pan a zoomed trace.
Full Scale (Pulse Trace
display only)
Specifies the Horizontal scale default.
Selected
Sets the horizontal scale default to be based on the result value for the currently-select
pulse.
Max Pulse
Sets the horizontal scale default to be based on the largest value for the selected pulse
measurement.
Autoscale
Resets the scale of the horizontal axis to contain the complete trace.
Plot (Pulse Statistics display
only)
Specifies the FFT, Trend, Time Trend, or Histogram plot.
Reset Scale
Restores all settings to their default values.
xxx
SignalVu-PC Printable Help
247
Pulsed RF
Prefs Tab
Prefs Tab
The Prefs tab enables you to change parameters of the measurement display. The parameters available on
the Prefs tab vary depending on the selected display.
Settings on the Pulsed RF Displays Prefs Tab
The following table describes the settings that appear on the Prefs tab of the Pulsed RF displays: Pulse
Statistics and Pulse Trace. There is no Prefs tab for the Pulse Table display.
Setting
Description
Show graticule
Displays or hides the graticule in the trace display.
Show Marker readout in
graph
When a marker is enabled, this setting displays or hides the maker readout, but not the maker
itself, on Time Trend plots.
Histogram readout
(present only when
Histogram is the selected
plot type)
Controls the parameters Histogram readout and Bins. Histogram readout can be set to either
Count or %. Count indicates the number of hits that fell into each bin. % indicates percentage
of the total count (for the acquisition) that fell into each bin.
Bins
Specifies how many "bins" or histogram bars the results are distributed into.
xxx
248
SignalVu-PC Printable Help
APCO P25 Analysis
APCO P25 Analysis
APCO P25 Analysis
Overview
The Association of Public Safety Communication Officials (APCO) P25 Compliance Testing and
Analysis option allows you to evaluate radio signals to ensure they meet the standards set for the public
safety communications community for interoperable LMR equipment. This complete set of push-button
Telecommunication Industry Association TIA-102 standard-based transmitter measurements includes
modulation measurements, power measurements, and timing measurements. These measurements are also
compared with the limits that best fit the signal for which the standard applies to provide pass/fail results.
The P25 measurements available with this option can be made on signals defined by the Phase 1 (C4FM)
and Phase 2 (HCPM, HDQPSK) P25 standards. With this test suite, test engineers can simplify the
execution of a number of transmitter tests while still allowing for controls to modify signal parameters for
signal analysis. The analysis results give multiple views of P25 signal characteristics to allow the diagnosis
of signal imperfections and impairments quickly and easily. Display controls allow you to selectively
display the analysis results to help locate trouble-spots in the signal.
P25 Topics
The following information about the P25 Analysis option is available:
Reference table of supported P25 measurements (see page 249)
P25 Standards Presets (see page 250)
P25 Displays (see page 251)
P25 Settings (see page 279)
P25 Measurements (see page 252)
P25 Test Patterns (see page 260)
Reference Table of Supported P25 Measurements
TIA-102 transmitter
measurement
Tektronix measurement display(s) (value name if
different from TIA-102 measurement name)
RF output power
Phase 1
Phase 2
P25 Summary
P25 Power vs Time
Yes
Yes
Operating frequency
accuracy
P25 Summary (Operating Freq Accuracy)
Yes
Yes
Modulation emission
spectrum
SEM (The SEM display can be found in Select
Displays > RF Measurements)
Yes
Yes
Unwanted emissions: Non
spurious adjacent channel
power ratio
MCPR (The MCPR display can be found in Select
Displays > P25 Analysis)
Yes
Yes
SignalVu-PC Printable Help
249
APCO P25 Analysis
APCO P25 Analysis
TIA-102 transmitter
measurement
Tektronix measurement display(s) (value name if
different from TIA-102 measurement name)
Phase 1
Phase 2
Frequency deviation
P25 Summary (Freq Dev)
Yes
HCPM
Modulation fidelity
P25 Summary
P25 Constellation
Yes
Yes
Symbol rate accuracy
P25 Summary
Yes
Yes
Transmitter power and
encoder attack time
P25 Summary (Phase1 Tx Attack Time)
P25 Power vs Time (Power Attack Time and Encoder
Attack Time)
Yes
N/A
Transmitter power and
encoder attack time with
busy/idle operations
P25 Summary (Phase1 Tx Attack Time (Busy/Idle))
P25 Power vs Time (Power Attack Time Busy Idle
and Encoder Attack Time Busy Idle)
Yes
N/A
Transmitter throughput
delay
P25 Summary (Phase1 Tx Throughput Delay)
Yes
N/A
Transient frequency
behavior
P25 Freq Dev vs.Time
Yes
N/A
HCPM transmitter logical
channel peak adjacent
channel power ratio
P25 Summary (HCPM Tx Logic Ch Pk ACPR)
N/A
HCPM
HCPM Transmitter logical
channel off slot power
P25 Power vs Time (Off Slot Power)
P25 Summary (HCPM Tx Logic Ch Off Slot)
N/A
HCPM
HCPM Transmitter logical
channel power envelope
P25 Power vs Time (Power Info)
P25 Summary (HCPM Tx Logic Ch Pwr Env Limits)
N/A
HCPM
HCPM Transmitter logical
channel time alignment
P25 Summary (HCPM Tx Logic Ch Time Alignt)
N/A
HCPM
xxx
P25 Standards Presets
The P25 standards preset allows you to access displays preconfigured for the P25 standards you select.
You can read more about how Presets work here .
The P25 standards preset allows you to access displays preconfigured for the P25 standards you select.
You can read more about how Presets work here (see page 13).
The following table shows the bandwidth, modulation type, and displays that are automatically loaded for
each of the listed standards. MCPR masks are also loaded and are explained here (see page 251).
Table 2: P25 standards, modulation type, bandwidth, and displays
Standard
Modulation type
Bandwidth
(kHz)
Phase 1
C4FM
12.5
MCPR, Time Overview, P25 Constellation, P25
Summary
Phase 2
HCPM (inbound)
12.5
HDQPSK (outbound)
12.5
MCPR, Time Overview, P25 Constellation, P25
Summary
Displays loaded with preset
xxx
250
SignalVu-PC Printable Help
APCO P25 Analysis
APCO P25 Analysis
Retain Current Center Frequency
This setting becomes available when P25 is the selected preset in the Standards Preset window. You can
access this window by selecting Presets > Standards and then selecting P25 from the Preset drop down
menu. To activate the Retain current Center Frequency Setting, check the box. This setting allows you
to retain the previously used center frequency. By default, the box is unchecked and therefore the four
P25 preset displays will load with a center frequency of 850 MHz.
The default adjacent channels table for MCPR is different for RF frequencies in the range of 769 to
806 MHz (called 700 MHz band) and for frequency ranges outside it. The option of retaining center
frequency in Standards Preset is therefore useful if you want to load the default table for center frequencies
in the 700 MHz band.
MCPR channel and limit parameters. The MCPR (ACPR) standard channel and limit parameters that are
applied to the P25 signal depend on the standard you select when you configure the preset. Once you
select a standard and center frequency, the application will automatically load the parameters and default
limits recommended for best performance comparison by the Standard document. All channel and limit
parameters are derived from the TIA-102 standard and loaded for you. This provides you the assurance
that you are evaluating the signal with the most appropriate parameters.
NOTE. Changing analysis and display parameters recalculates the measurement results, but does not
affect acquisitions.
P25 Displays
The displays in P25 Analysis (Setup > Displays > Measurements: P25 Analysis) are:
MCPR
P25 Constellation (see page 263)
SignalVu-PC Printable Help
251
APCO P25 Analysis
APCO P25 Analysis
P25 Power vs Time (see page 268)
P25 Eye Diagram (see page 265)
P25 Freq Dev vs Time (see page 276)
P25 Symbol Table (see page 273)
P25 Summary (see page 270)
Time Overview (see page 47)
P25 Measurements
The following topics contain important information you should know about specific P25 measurements.
RF Output Power (Phase 1 and Phase 2)
This is a measure of RF output power when the transmitter is connected to the standard load during
defined duty cycle. This measurement is presented as a scalar result in the P25 Summary display. Power
variation is shown in the P25 Power vs Time display.
Information of note about this measurement:
For bursty HCPM (Phase 2 Inbound) signals, the RF Output Power is measured only during the on slot
regions centered at the middle of the on slot.
The result shown in the P25 Summary Display is the average RF Output Power of all the bursts
selected in the analysis window.
If only one on slot region is chosen in the analysis window, then the RF Output Power of only the
chosen on slot is reported.
For non-bursty data, the entire duration of analysis window is considered to obtain RF Output Power.
The result shown in the P25 Summary display does not account for any attenuation introduced by a
user. Ensure that this attenuation is accounted for when you enter limits for comparison.
The Limits tab in the P25 Summary Settings control panel allows you to compare the results against
limits set for Pass/Fail.
This measurement result is not shown in the P25 Summary display when Trigger Measurements
are selected.
NOTE. Read about important information related to HCPM bursty data measurements here (see page 262).
Operating Frequency Accuracy (Phase 1 and Phase 2)
The Operating Frequency Accuracy is the ability of the transmitter to operate on its assigned frequency.
This measurement is presented as a scalar result in the P25 Summary display.
252
SignalVu-PC Printable Help
APCO P25 Analysis
APCO P25 Analysis
For bursty HCPM (Phase 2 Inbound) signals, the operating frequency accuracy is measured only
during the on slot regions centered at the middle of the on slot.
The result shown in the P25 Summary display is the average of all the bursts selected in the analysis
window.
If only one on slot region is chosen in the analysis window, then the operating frequency accuracy of
only the chosen on slot is reported.
For non-bursty data, the entire duration of the analysis window is considered to obtain the operating
frequency accuracy.
The Limits tab in the P25 Summary Settings control panel allows you to compare the results against
limits set for Pass/Fail.
This measurement result is not shown in the P25 Summary display when Trigger Measurements
are selected.
Unwanted Emissions (ACPR) (Phase 1 and Phase 2)
This measurement is the ratio of the total power of a transmitter under prescribed conditions and
modulation to that of the output power that falls within a prescribed bandwidth centered on the nominal
frequency of adjacent channels. This measurement is shown in the MCPR display.
For HCPM signals, Adjacent Channel Power Ratio analysis is only done on the first on slot region.
When the Modulation Type is set to HCPM from any P25 display or from Standards Presets, there will
be a search for bursts before ACPR analysis is done. If a burst is found, then analysis is done only on
first burst. If a burst is not found, it will show the results of the entire analysis length. The Main Preset
will remove the HCPM modulation Type setting, allowing MCPR to work in its regular mode.
The MCPR display will only have one Main channel for P25 signals in addition to relevant adjacent
channels.
The default adjacent channels table for Unwanted Emissions (ACPR) as suggested by the standard can
be loaded by using the P25 Standards Preset option (for which MCPR is one of the four displays).
The default adjacent channels table for MCPR is different for RF frequencies in the range of 769 to
806 MHz (called 700 MHz band) and for frequency ranges outside it.
To load the default adjacent channels table of a 700 MHz band, first set the center frequency. Next,
select Presets > Standards to view the Standards Preset window. Lastly, check the Retain current
Center Frequency Setting box.
By default, the Retain Center Frequency box is unchecked and therefore the four P25 preset displays
will load with a center frequency of 850 MHz and load the adjacent channels table for non-700 MHz
band.
By default, only six adjacent channels (on either side) will be shown when 700 MHz band is analyzed
in P25 (for visual clarity). However, analysis is done for all the ten channels and results will be
available in the table just under the display. You can zoom out to see the remaining bands.
SignalVu-PC Printable Help
253
APCO P25 Analysis
APCO P25 Analysis
Frequency Deviation (Phase 1 (C4FM) and Phase 2 (HCPM))
This measurement shows the amount of frequency deviation that results for a Low Deviation and High
Deviation test pattern. This measurement is shown in the P25 Summary display.
This measurement only applies to HCPM and C4FM signals and High Deviation or Low Deviation test
patterns. If this measurement is run for any other test patterns or for HDQPSK signals, comparisons for
limits (set in the Limits tab of the control panel) will result in N/A being shown, as the measurement
will not be valid.
This measurement is done using a FM demodulator without any filter. As a result, it will not be exactly
the same as the result given in the P25 Frequency Deviation vs Time display. That display shows the
frequency deviation after complete demodulation and might use relevant shaping filters.
Measurement results are only available when High Deviation, Low Deviation, or Symbol Rate test
pattern is selected.
The scalar result in the P25 Summary display will be shown as f1 (Positive Peak) and f2 (Negative
Peak) when analyzing the High Deviation test pattern (or the Symbol Rate test pattern for C4FM
signals).
The scalar result in the P25 Summary display will be shown as f3 (Positive Peak) and f4 (Negative
Peak) when analyzing the Low Deviation test pattern.
The scalar results in the P25 Summary display do not have a corresponding graphical view. A closely
representative display would be the FM display (Setup > Displays > Analog Modulation).
The Limits tab in the P25 Summary Settings control panel allows you to compare the results against
limits set for Pass/Fail.
Modulation Fidelity (Phase 1 and Phase 2)
This measures the degree of closeness to which the modulation follows the ideal theoretical modulation
determined by the rms difference between the actual deviation and the expected deviation for the
transmitted symbols. This measurement is shown in the P25 Summary and P25 Constellation displays.
This measurement is done on the first on slot region in the analysis window for bursty HCPM data.
The analysis is done on 160 symbols centered at the burst.
This measurement is done on all of the data chosen in the analysis window for non-bursty modulation
types. A warning message is issued if the data is less than 164 symbols (the standard recommends at
least 164 symbols be present for the measurement of non-bursty signals).
This measurement is done by performing the frequency demodulation after taking the signal through
relevant shaping filters and comparing it with expected frequency deviation points.
The Limits tab in the P25 Summary Settings control panel allows you to compare the results against
limits set for Pass/Fail.
This measurement result is not shown in the P25 Summary display when Trigger measurements
are selected.
NOTE. Read about important information related to HCPM bursty data measurements here (see page 262).
254
SignalVu-PC Printable Help
APCO P25 Analysis
APCO P25 Analysis
Symbol Rate Accuracy (Phase 1 and Phase 2)
Symbol Rate Accuracy measures the ability of the transmitter to operate at the assigned symbol rate
(4.8 kHz for Phase 1, 6 kHz for Phase 2). It is a scalar result shown in the P25 Summary display.
This measurement result appears in the P25 Summary display and only applies to High Deviation
or Low Deviation test patterns. Test patterns are selected in the Test Patterns tab in the Settings
control panel.
To check if the results are consistent with the symbol rate used, the measurement is done based on the
number of zero crossings when a High Deviation or Low Deviation test pattern is used.
The Limits tab in the P25 Summary Settings control panel allows you to compare the results against
limits set for Pass/Fail.
This measurement only applies to High Deviation or Low Deviation test patterns. If this measurement
is run for any other test patterns, comparisons for limits will result in N/A being shown, as the
measurement will not be valid.
Common Trigger Related Measurements
The measurements covered in this subsection have some common information. These measurements are:
Transmitter Power and Encoder Attack Time (Phase 1): This measurement is the time required for
a transmitter to prepare and transmit information on the radio channel after changing state from standby
to transmit (applies to conventional mode). This measurement result can be seen in the P25 Summary
display. A graphical representation of these results can be seen in the P25 Power vs Time display.
Transmitter Power and Encoder Attack Time with Busy/Idle Operations (Phase 1): This
measures the time required for a transmitter to prepare and transmit information on the radio channel
after the receiving channel changes state from busy to idle. Transmission is inhibited until a status
symbol indicates an idle channel. This measurement result can be seen in the P25 Summary display. A
graphical representation of these results can be seen in the P25 Power vs Time display.
Transmitter Throughput Delay (Phase 1): This measures the time it requires for audio changes in
the microphone to be encoded and transmitted over the air. A calibrated receiver with a known receiver
throughput delay is used to monitor the transmitted signal. The aggregate delay of the transmitter
under test and calibrated receiver is measured and the desired transmitter throughput delay is then the
aggregate delay less the delay of the calibrated receiver. A calibrated Receiver throughput delay from
the UI is needed. This measurement result can be seen in the P25 Summary display.
Transient Frequency Behavior (Phase 1): This is a measure of difference of the actual transmitter
frequency and assigned transmitter frequency as a function of time when the RF output power is
switched on or off. This measurement appears in the P25 Freq Dev vs Time display.
HCPM Tx Logical Channel Time Alignment (Phase 2 HCPM): This measures the ratio of total
transmitter power under prescribed conditions and modulation to the peak power that falls in a
prescribed bandwidth centred on the nominal frequency of the adjacent channel during the transmitter
power ramping interval. This applies only to inbound signals. This measurement result appears in
the P25 Summary display.
SignalVu-PC Printable Help
255
APCO P25 Analysis
APCO P25 Analysis
NOTE. The following information is important when trigger measurements are taken with SignalVu-PC
interfaced with an MDO4000B Series instrument: 1) The RF signal should be connected to the RF Input of
the MDO. 2) One of the 4 analog channels of the MDO can be set as Trigger input. (Refer to the Trigger
Setup section on how to set a channel as trigger in the MDO manual.) 3) In SignalVu-PC, set Triggered
mode in the Setup > Acquisition control panel.
Common information. The following information applies to all of the measurements in the previous list.
Select the relevant Trigger measurement from the Trig Meas tab of the control panel.
When this measurement is chosen from the Trig Meas tab of the control panel, only this result will be
populated in the P25 Summary display and everything else will have no result.
The Time Zero Reference under the Analysis Time tab in the control panel is forced to Trigger.
Align the Trigger to the RSA/MDO4000B as described in the measurement methods standard
document.
When a trigger measurement is chosen from the Trig Meas tab of the control panel , the following
status message will appear: P25: Set instrument in Triggered Mode.
Use the Acquisition control panel to select enough acquisition length to ensure that sufficient data
is available when the acquisition is triggered.
This measurement operates in Single Acquisition mode as the acquisition is triggered.
You can select to do the same experiment multiple times and this measurement will produce an
average result of the last 10 single acquisitions. Clicking the Clear button on the P25 Summary
display will clear the results and start a new measurement.
Transmitter Power and Encoder Attack Time and Transmitter Power and Encoder Attack Time with Busy/Idle
Operations (Phase 1). The following information is specific to these two measurements.
The Transmitter Power Attack Time analysis is done by measuring the time taken from the trigger
point to the point where the transmitter output power will reach 50% of its maximum value.
For Encoder Attack Time, the initial frame synchronization word is searched in the demodulated
output and the time taken from trigger to the start of the synchronization word is reported as the result.
When a clear power ramp up is not available, the analysis will report the following error, indicating
that no power ramp was received as expected: Input data too short. When the synchronization word is
not found, the analysis will report the following error: IQ Processing error.
The Limits tab in the P25 Summary Settings control panel allows you to compare the results against
limits set for Pass/Fail.
The P25 Power vs Time display shows marking from trigger point to 50% ramp point and also up to
the Synchronization word for Transmitter Power and Encoder Attack Time. Frequency Dev vs Time
can also be used to check for the synchronization word. The following image shows this measurement.
256
SignalVu-PC Printable Help
APCO P25 Analysis
APCO P25 Analysis
Transmitter Throughput Delay (Phase 1). The following information is specific to this measurement.
Select Tx Throughput Delay from the Trig Meas tab of the Settings control panel to get this
measurement.
The original noise source is connected as input to this trigger and the acquisition is triggered when the
input from the noise source exceeds the trigger level set by the user.
The actual input to the MDO4000B comes after the noise signal from the source has passed through
the DUT and calibrated receiver as shown in the setup for this measurement in the measurement
methods standard document.
The level in the Trigger control panel set by the user is used for analysis to determine that input to
the RSA/MDO4000B (after it has gone through the DUT and calibrated receiver) has hit the power
levels desired.
The time difference between the trigger point and the point when the input to the RSA/MDO4000B
has exceeded the level set by the user for triggering is calculated.
The calibrated receiver throughput delay entered by the user in the Trig Meas tab in the Settings
control panel (this option appears when Throughput Delay is selected) is subtracted from the calculated
time difference and reported as Throughput Delay.
A limit comparison can be performed by selecting the appropriate limits from the Limits tab in the
Settings control panel.
Transient Frequency Behavior (Phase 1). The following information is specific to this measurement.
Select Transmitter Frequency Behavior from the Trig Meas tab of the Settings control panel to get
this measurement.
This measurement can be done for On to Off and Off to On behaviors. Select which behavior to
measure by selecting the desired behavior from the Transient Frequency drop down list that appears
SignalVu-PC Printable Help
257
APCO P25 Analysis
APCO P25 Analysis
when the Transient Frequency Behavior measurement is selected in the Trig Meas tab of the Settings
control panel.
Select enough acquisition length (from the Acquisition control panel) to ensure that sufficient data is
available when the acquisition is triggered. For a transient frequency behavior, there is a need for t1+t2
amount of time after ton as defined in the measurement methods standard document. Approximately
100 ms of data after trigger should ensure that all cases are taken care of as suggested by the standard.
t1, t2, and t3 durations are fetched based on the RF frequency range.
The identification of ton is done by looking for a significant frequency deviation after a certain power
level has been achieved. A manual override for the ton is also provided in the Trigger Meas tab of the
Settings control panel when a Transient Frequency Behavior measurement is chosen. This allows you
to manually override the ton that is calculated (by releasing the Auto Option) and place it appropriately
based on the P25 Freq Dev vs Time display. The same is true for toff when the measurement is being
done for the On to Off behavior.
t1 and t2 regions are identified after ton and t3 before toff (for the On to Off behavior).
The mean and max frequency deviation is reported in the regions identified.
A Pass or Fail is also reported by comparing the Mean frequency deviation with the recommended
values given in the standard. A red band is shown if a particular region’s result is less than the
performance recommendation. The following image shows this measurement.
HCPM Tx Logical Channel Time Alignment (Phase 2 HCPM). The following information is specific to this
measurement. This result can be viewed in P25 Summary and P25 Power vs Time displays.
This measurement is done in two steps: First by calculating tOB_sync using HDQPSK data (the
ISCH pattern is looked for) and then by using the result to calculate tIB_sync using HCPM data
(the SACCH pattern is looked for).
The first step is done by choosing Time Alignment (tOB_sync measurement) in the Trig Meas tab
in the Settings control panel.
258
SignalVu-PC Printable Help
APCO P25 Analysis
APCO P25 Analysis
When the second step, Time Alignment (t_error_0 calculation) or (t_error_1 calculation) is selected in
the Trig Meas tab of the control panel, there is an option to override the tOB_sync value calculated
in the first step.
When this measurement is chosen, only this result is provided in the P25 Summary display.
You must provide the ultraframe boundary to the trigger of the analyzer.
An autocorrelation of the input RF signal with the reference patterns is performed to get the peak that
will determine tOB_sync (measured) and t_error_0 or t_error_1 from the trigger point.
HCPM Tx Logical Channel Peak ACPR (Phase 2 HCPM)
This measures the ratio of total transmitter power under prescribed conditions and modulation to the peak
power that falls in a prescribed bandwidth centred on the nominal frequency of the adjacent channel during
the transmitter power ramping interval. This applies only to inbound signals. This measurement result
appears in the P25 Summary display.
This measurement is done by calculating power in the adjacent channels for the entire duration of data
chosen by the user, including the power ramp up and ramp down portions. The standard recommends
360 ms of data for this measurement, unlike the other ACPR measurements for which the analysis
is done only for the on slot region.
The higher and lower adjacent channel power is reported in the P25 Summary display under Power
Measurements.
The two results are then subtracted from the calculated RF output power and the minimum of the two
results is presented as the Min Pk ACPR in the P25 Summary display.
This measurement is only done for bursty HCPM data and not for High Deviation or Low Deviation
test patterns.
The Limits tab in the P25 Summary Settings control panel allows you to compare the results against
limits set for Pass/Fail.
This measurement result is not shown in the P25 Summary display when trigger measurements are
chosen.
NOTE. Read about important information related to HCPM bursty data measurements here (see page 262).
HCPM Transmitter Logical Channel Off Slot power (Phase 2 HCPM)
This measures the power of a TDMA transmitter during the off portion of the TDMA pulse. This
measurement only applies to inbound signals. This result can be viewed in P25 Summary and P25 Power
vs Time displays.
The measurement is done as suggested by the standard to calculate PONREL and POFFREL
PTX is an input expected from the user and this can be given from the Analysis Params tab in the
Settings control panel.
The absolute level of the off slot power is then calculated as POFF = PTX – (PONREL – POFFREL) dBm
SignalVu-PC Printable Help
259
APCO P25 Analysis
APCO P25 Analysis
This measurement is only done for bursty HCPM data and not for High Deviation or Low Deviation
test patterns.
The Limits tab in the P25 Summary Settings control panel allows you to compare the results against
limits set for Pass/Fail.
This measurement result is not shown in the P25 Summary display when trigger measurements are
chosen.
NOTE. Read about important information related to HCPM bursty data measurements here (see page 262).
HCPM Transmitter Logical Channel Power Envelope (Phase 2 HCPM)
This is a measure of how well a portable radio controls the transmitter power as it inserts an inbound
HCPM TDMA burst into a frame on a voice channel. This measurement applies to inbound signals only.
All scalar results relevant to this measurement are shown both in P25 Power vs Time display and
the P25 Summary display.
The measurement results and the duration in which the measurements are made are shown graphically
in P25 Power vs Time display. The results are grouped under Power Info and Time Info in the table
at the bottom of the display.
This measurement is only done for bursty HCPM data and not for High Deviation or Low Deviation
test patterns.
The Limits tab in the P25 Summary Settings control panel allows you to compare the results against
limits set for Pass/Fail.
This measurement result is not shown in the P25 Summary display when trigger measurements are
chosen.
NOTE. Read about important information related to HCPM bursty data measurements here (see page 262).
P25 Test Patterns
A variety of test patterns are specified in the TIA-102 documents for use in performance testing of
transmitters. These test patterns allow the software to compare the measurement result to the standards
limit. Test engineers can select from the test patterns described in the following tables.
NOTE. Although this table gives the test patterns for measurements as recommended by the Standard, other
measurement results are also be provided as additional information for a given test pattern. For example,
Modulation Fidelity results can also be provided for High Deviation and Low Deviation test patterns.
260
SignalVu-PC Printable Help
APCO P25 Analysis
APCO P25 Analysis
Table 3: P25 test patterns, Phase 1 C4FM
TIA-102 Phase 1 C4FM test pattern
Phase 1 (C4FM) measurement
Standard transmitter
RF Output Power
Operating Frequency Accuracy
Modulation Emission Spectrum
Unwanted Emissions (Adjacent Channel Power Ratio)
Modulation Fidelity
Transmitter Power and Encoder Attack Time
Standard Busy
Transmitter Power and Encoder Attack Time (With Busy/Idle Operations)
Low Deviation
Operating Frequency Accuracy
Transient Frequency Behavior
Frequency Deviation
Standard Idle
Transmitter Power and Encoder Attack Time (With Busy/Idle Operations)
Standard Transmitter Symbol Rate
(Same as High Deviation test pattern
Symbol Rate Accuracy
C4FM Modulation Fidelity
Modulation Fidelity
Standard Tone
Can be used for measurements such as RF Output Power, Operating Frequency
Accuracy, Modulation Fidelity, and ACPR
Other
(User created test pattern)
Can be used for measurements such as RF Output Power, Operating Frequency
Accuracy, Modulation Fidelity, and ACPR
Frequency Deviation
xxx
Table 4: P25 test patterns, Phase 2 Inbound and Outbound
TIA-102 Phase 2 test pattern
Phase 2 measurement
Standard Transmitter (Inbound and
Outbound)
RF Output Power
Operating Frequency Accuracy
Modulation Emission Spectrum
Unwanted Emissions (Adjacent Channel Power Ratio)
Modulation Fidelity
Inbound Standard Tone Ch0
Can be used for measurements such as RF Output Power, Operating Frequency
Accuracy, Modulation Fidelity, and ACPR
Inbound Standard Tone Ch1
Can be used for measurements such as RF Output Power, Operating Frequency
Accuracy, Modulation Fidelity, and ACPR
Outbound Standard Tone
Operational Frequency Accuracy
SignalVu-PC Printable Help
261
APCO P25 Analysis
APCO P25 Analysis
Table 4: P25 test patterns, Phase 2 Inbound and Outbound (cont.)
TIA-102 Phase 2 test pattern
Phase 2 measurement
Inbound Symmetrical Time Slot
RF Output Power
Modulation Emission Spectrum
Modulation Fidelity
HCPM (Peak ACPR)
HCPM (Off slot power)
HCPM (Power envelope)
Unwanted Emissions (Adjacent Channel Power Ratio)
Low Deviation (Inbound)
Frequency deviation for HCPM
Symbol Rate Accuracy
Low Deviation (Outbound)
Symbol Rate Accuracy
High Deviation (Inbound and Outbound)
Symbol Rate Accuracy
Other
(User created test pattern)
Can be used for measurements such as RF Output Power, Operating Frequency
Accuracy, Modulation Fidelity, and ACPR
xxx
Analysis of HCPM Bursty Data
It important to take into account the following information when analyzing HCPM bursty data.
It is mandatory that at least one complete on slot and off slot region (including the ramp up and
ramp down portion) have to be included in the analysis window for HCPM measurement results
to be analyzed.
If HCPM is the chosen standard in Standards Presets, then a minimum length of 94 ms is set for the
analysis window. This is to ensure that a full on slot and off slot region is available irrespective of
the selected analysis offset.
Do not use the High Deviation or Low Deviation test patterns for bursty signals. Test patterns are
selected in the P25 Settings control panel on the Test Patterns tab. If selected, analysis would look
for a bursty pattern. High Deviation and Low Deviation test patterns are not bursty and therefore do
not have the above analysis length restriction.
If you try to set the analysis length to less than 94 ms, the following status message will display:
P25:HCPM:Minimum Analysis Length should be ≥ 94 ms.
Most measurements that are required to be done on on slot regions are done centered at the on slot
region of HCPM bursty data.
262
SignalVu-PC Printable Help
APCO P25 Analysis
P25 Constellation Display
When HCPM bursty data is analyzed, the following status message will appear on all relevant displays:
P25:HCPM modulation analysis is done only on on slot regions.
P25 Constellation Display
The P25 Constellation Display shows the P25 signal modulation amplitude. For the HCPM and HDQPSK
standards, you can view this display as frequency deviation or as I and Q. For the C4FM standard, only the
frequency deviation applies.
To show the P25 Constellation display you can select Presets > Standards > P25 or do the following:
1. If you are analyzing a stored data file, recall the data file now. Otherwise, go to the next step.
2. Press the Displays button or select Setup > Displays.
3. In the Select Displays dialog, select P25 Analysis in the Measurements box.
4. In the Available displays box, double-click the P25 Constellation icon or select the icon and click
Add. The P25 Constellation icon will appear in the Selected displays box and will no longer appear
under Available displays.
5. Click OK to show the P25 Constellation display.
6. Select Setup > Settings to display the control panel.
7. Select the Modulation Params tab. Set the Standard, Modulation Type, and Measurement and
Reference filters as appropriate for the input signal.
8. For Phase 2 signals, select the Trace tab and set the Trace Type to Freq Dev or IQ.
9. Select the Test Patterns tab and select the desired test pattern as appropriate for the input signal.
10. If you are analyzing a data file, press the Replay button to take measurements on the recalled
acquisition data file.
Elements of the Display
The following image shows the P25 Constellation display set to IQ for a HDQPSK signal.
SignalVu-PC Printable Help
263
APCO P25 Analysis
P25 Constellation Display
The following image shows the same signal as the previous image, but with the display set to Frequency
Deviation.
264
SignalVu-PC Printable Help
APCO P25 Analysis
P25 Constellation Settings
Item
Display element
Description
1
Marker Readout
Located to the left of the constellation plot or below it, depending on the
size of the window. If markers are enabled, the marker readout will show
frequency deviation results or IQ results (time, mag, phase, symbol marker
and symbol value) of the point with the selected marker.
2
Measurement results readout
These readouts are located to the left or below of the Constellation plot,
depending on the window size. The readout shows Modulation Fidelity (%)
and Frequency Error (Hz).
The second readout can either be Freq Error where the result is followed
by Auto or it could be Freq Offset where the result is followed by Manual.
This choice between Freq Error and Freq Offset is made from the Analysis
Params tab in the Settings control panel.
3
Plot
Shown as either I vs Q or as Frequency Deviation. The trace type is controlled
from the Settings > Trace tab.
xxx
P25 Constellation Settings
Application Toolbar:
The P25 Constellation Settings control panel provides access to settings that control parameters of the
Constellation Display.
Settings tab
Description
Modulation Params (see
page 280)
Specifies the input signal standard and additional user-settable signal parameters.
Analysis Params (see
page 283)
Specifies parameters used by the instrument to analyze the input signal.
Analysis Time (see page 283)
Specifies parameters that define the portion of the acquisition record that is used for
analysis. Also allows you to specify the Units (Symbols or Seconds) and Time Zero
Reference (Trigger or Acquisition Start) for P25 Analysis displays.
Test Patterns (see page 285)
Specifies the type of test pattern being used. Some analysis differs based on the
selected test pattern. Available test patterns vary depending on the selected standard
and modulation type.
Trace (see page 286)
Specifies the trace type (Vectors, Points, and Lines), the number of points per symbol
when chosen to view as Vectors or Lines, and to control the view as Freq Dev or IQ.
Prefs (see page 289)
Specifies the radix of the marker readout and whether elements of the graphs are
displayed.
Trig Meas (see page 288)
Enables you to select from several different trigger measurements.
xxx
P25 Eye Diagram Display
The P25 Eye Diagram display shows a digitally modulated signal overlapped on itself to reveal variations
in the signal.
SignalVu-PC Printable Help
265
APCO P25 Analysis
P25 Eye Diagram Display
To show the P25 Eye Diagram display:
1. If you are analyzing a stored data file, recall the data file now. Otherwise, go to the next step.
2. Press the Displays button or select Setup > Displays.
3. From the Measurements box, select P25 Analysis.
4. Double-click the P25 Eye Diagram icon in the Available Displays box. This adds the P25 Eye
Diagram icon to the Selected displays box.
5. Click OK button. This displays the P25 Eye Diagram view.
6. Select Setup > Settings to display the control panel.
7. Select the Modulation Params tab. Set the Standard, Modulation Type, and Measurement and
Reference filters as appropriate for the input signal.
8. For Phase 2 signals, select the Trace tab and set the Trace Type to Freq Dev or IQ.
9. Select the Test Patterns tab and choose a test pattern appropriate for the input signal.
10. If you are analyzing a data file, press the Replay button to take measurements on the recalled
acquisition data file.
Elements of the Display
The following image shows the P25 Eye display with Trace Type set to IQ.
The following image shows the P25 Eye display with Trace Type set to Freq Dev.
266
SignalVu-PC Printable Help
APCO P25 Analysis
P25 Eye Diagram Settings
Item
Display element
Description
1
Top of graph
The vertical scale is normalized with no units (for IQ) and with Hz (for Freq
dev).
2
Position
Specifies the value shown at the center of the graph display.
3
Bottom Readout
Displays the value indicated by the bottom of graph.
4
Autoscale
Adjusts the vertical and horizontal settings to provide the best display.
5
Position
Displays the horizontal position of the trace on the graph display.
6
Scale
Adjusts the span of the graph in symbols.
7
Freq Error
Displays the difference between the maximum and minimum measured
values of the signal frequency during the Measurement Time. The readout
can either be Freq Error where the result is followed by Auto or it could be
Freq Offset where the result is followed by Manual. This choice between
Freq Error and Freq Offset is made from the Analysis Params tab in the
Settings control panel.
xxx
P25 Eye Diagram Settings
Application Toolbar:
The settings for the P25 Eye Diagram display are shown in the following table.
SignalVu-PC Printable Help
267
APCO P25 Analysis
P25 Power vs Time Display
Settings tab
Description
Modulation Params (see
page 280)
Specifies the input signal standard and additional user-settable signal parameters.
Analysis Params (see
page 283)
Specifies parameters used by the instrument to analyze the input signal.
Analysis Time (see page 283)
Specifies parameters that define the portion of the acquisition record that is used for
analysis. Also allows you to specify the Units (Symbols or Seconds) for P25 Analysis
displays.
Trig Meas (see page 288)
Enables you to select from various trigger measurements. The trigger selections vary
by signal type.
Test Patterns (see page 285)
Specifies the type of test pattern being used. Some analysis differs based on the
selected test pattern. Available test patterns vary depending on the selected standard
and modulation type.
Trace (see page 286)
Specifies the trace type (Vectors, Points, and Lines), the number of points per symbol
when chosen to view as Vectors or Lines, and to control the view as Freq Dev or IQ.
Scale (see page 286)
Defines the vertical and horizontal axes.
Prefs (see page 289)
Specifies the radix of the marker readout and whether elements of the graphs are
displayed.
xxx
P25 Power vs Time Display
The P25 Power vs Time display shows the signal power amplitude versus time.
To show the P25 Power vs Time display:
1. If you are analyzing a stored data file, recall the data file now. Otherwise, go to the next step.
2. Press the Displays button or select Setup > Displays.
3. In the Select Displays dialog, select P25 Analysis in the Measurements box.
4. In the Available displays box, double-click the P25 Power vs Time icon or select the icon and click
Add. The P25 Power vs Time icon will appear in the Selected displays box and will no longer
appear under Available displays.
5. Click OK to show the P25 Power vs Time display.
6. Select Setup > Settings to display the control panel.
7. Select the Modulation Params tab. Set the Standard, Modulation Type, and Measurement and
Reference filters as appropriate for the input signal.
8. Select the Test Patterns tab and choose a test pattern appropriate for the input signal.
9. If you are analyzing a data file, press the Replay button to take measurements on the recalled
acquisition data file.
268
SignalVu-PC Printable Help
APCO P25 Analysis
P25 Power vs Time Settings
Elements of the Display
Item
Display element
Description
1
Top of graph, first settting
Sets the Power level that appears at the top of the graph, in dBm. This is only
a visual control for panning the graph.
2
Top of graph, second setting
Sets the vertical Scale of the graphs, in dB/div. This is only a visual control
for panning the graph.
3
View
(Only available for bursty
HCPM data.)
Selects the specific view of the packet burst within the display:
Full Burst displays the entire packet, with vertical lines indicating Power ramp
up, On Slot, Power ramp down, and Off slot regions.
Ramp Up zooms the display into the interval around the packet rising edge.
Ramp Down zooms the display into the interval around the packet falling
edge.
4
Bottom of graph readout
Shows the Power level at the bottom of the graph in dBm.
5
Autoscale
Adjusts the vertical and horizontal settings to provide the best display.
6
Bottom of graph, left side
Sets the starting time of the graph in seconds
7
Bottom of graph, right side
Sets the scale (width) of the graph in seconds
8
Table below graph
This table shows the following results.
For non-bursty signals: RF output power
For bursty signals: Power Info (Offslot Power and Power Envelope
results) and Time Info.
xxx
P25 Power vs Time Settings
Application Toolbar:
The settings for the P25 Power vs Time display are shown in the following table.
SignalVu-PC Printable Help
269
APCO P25 Analysis
P25 Summary Display
Settings tab
Description
Modulation Params (see
page 280)
Specifies the input signal standard and additional user-settable signal parameters.
Analysis Params (see
page 283)
Specifies parameters used by the instrument to analyze the input signal.
Analysis Time (see page 283)
Specifies parameters that define the portion of the acquisition record that is used for
analysis. Also allows you to specify the Units (Symbols or Seconds) for P25 Analysis
displays.
Trig Meas (see page 288)
Enables you to select from various trigger measurements. The trigger selections vary
by signal type.
Test Patterns (see page 285)
Specifies the type of test pattern being used. Some analysis differs based on the
selected test pattern. Available test patterns vary depending on the selected standard
and modulation type.
Scale (see page 286)
Defines the vertical and horizontal axes.
Prefs (see page 289)
Specifies the radix of the marker readout and whether elements of the graphs are
displayed.
xxx
P25 Summary Display
The P25 Summary display shows a summary of all the scalar measurements done on the acquired test
pattern. The summary display and contents will vary according to the selected standard.
Pass/Fail information is also provided in this display for all enabled scalar measurements. You can set
limits and choose which measurement to compare for Pass/Fail from the Limits tab in the P25 Summary
Settings control panel. The default limits come from the performance recommendation limits given by
the Standard document. The default limits can be reloaded by selecting the P25 Standards Preset option
or by loading the default limits table.
To show the P25 Summary display you can select Presets > Standards > P25 or do the following:
1. If you are analyzing a stored data file, recall the data file now. Otherwise, go to the next step.
2. Press the Displays button or select Setup > Displays.
3. In the Select Displays dialog, select P25 Analysis in the Measurements box.
4. In the Available displays box, double-click the P25 Summary icon or select the icon and click Add.
The P25 Summary icon will appear in the Selected displays box and will no longer appear under
Available displays.
5. Click OK to show the P25 Summary display.
6. Select Setup > Settings to display the control panel.
7. Select the Modulation Params tab. Set the Standard, Modulation Type, and Measurement and
Reference filters as appropriate for the input signal.
270
SignalVu-PC Printable Help
APCO P25 Analysis
P25 Summary Display
8. Select the Test Patterns tab and select a test pattern. The available test patterns in the drop down list
depend of the standard and modulation type you have selected.
9. If you are analyzing a data file, press the Replay button to take measurements on the recalled
acquisition data file.
P25 Summary Display
The Modulation Measurements, Power Measurements, and Trigger Measurements components of this
display vary depending on which modulation type is selected.
The following image shows an example of the display for a Phase 1 C4FM signal.
The following image shows an example of the display for a Phase 1 C4FM High Deviation signal.
The following image shows an example of the display for a Phase 2 HCPM (Inbound) signal.
SignalVu-PC Printable Help
271
APCO P25 Analysis
P25 Summary Display
The following image shows an example of the display for a Phase 2 HDQPSK (Outbound) signal.
For more information about specific measurement results, see the P25 Measurements section here (see
page 252).
272
SignalVu-PC Printable Help
APCO P25 Analysis
P25 Summary Settings
Elements of the Display
Element
Description
Standard
Display of the standard selected on the Setup > Settings > Modulation Params tab.
Bandwidth
Display of the channel bandwidth which is set based on the standard and modulation type.
Modulation Type
Display of the modulation type selected on Setup > Settings > Modulation Parameters tab.
Clear
Click button to reset measurement. Clears all values.
Modulation Measurements
Shows the modulation measurements associated with the signal.
Power Measurements
Shows the power measurements associated with the signal.
Trigger Measurements
Shows the trigger measurements associated with the signal.
xxx
P25 Summary Settings
Application Toolbar:
The settings for the P25 Summary display are shown in the following table.
Settings tab
Description
Modulation Params (see
page 280)
Specifies the input signal standard and additional user-settable signal parameters.
Analysis Params (see
page 283)
Specifies parameters used by the instrument to analyze the input signal.
Analysis Time (see page 283)
Specifies parameters that define the portion of the acquisition record that is used for
analysis. Also allows you to specify the Units (Symbols or Seconds) for P25 Analysis
displays.
Trig Meas (see page 288)
Enables you to select from various trigger measurements. The trigger selections vary
by signal type.
Test Patterns (see page 285)
Specifies the type of test pattern being used. Some analysis differs based on the
selected test pattern. Available test patterns vary depending on the selected standard
and modulation type.
Limits (see page 290)
Load and define P25 measurement limits for Pass/Fail comparison. You can save
defined limits as a .csv file and also load previously saved .csv files.
xxx
P25 Symbol Table Display
The P25 Symbol Table display shows decoded data values for each data symbol in the analyzed signal
packet.
To show the P25 Symbol Table display:
1. If you are analyzing a stored data file, recall the data file now. Otherwise, go to the next step.
2. Press the Displays button or select Setup > Displays.
3. In the Select Displays dialog, select P25 Analysis in the Measurements box.
SignalVu-PC Printable Help
273
APCO P25 Analysis
P25 Symbol Table Display
4. In the Available displays box, double-click the P25 Symbol Table icon or select the icon and click
Add. The P25 Symbol icon will appear in the Selected displays box and will no longer appear
under Available displays.
5. Click OK to show the P25 Symbol Table display.
6. Select Setup > Settings to display the control panel.
7. Select the Modulation Params tab. Set the Standard, Modulation Type, and Measurement and
Reference filters as appropriate for the input signal.
8. Select the Test Patterns tab and select a test pattern. The available test patterns in the drop down list
depend on the standard and modulation type you have selected.
9. If you are analyzing a data file, press the Replay button to take measurements on the recalled
acquisition data file.
P25 Symbol Table
The following image shows the P25 Symbol Table for HCPM (bursty) signals. For this signal type, the
symbols are arranged as Bursts vs Symbols. The analysis is done only on the on slot regions of the bursty
HCPM data and 160 symbols (centered at the middle of the burst) are reported on the symbol table for
every on slot region. You can read more about specific measurements here (see page 252).
The following image shows the P25 Symbol Table for C4FM (non-bursty) signals. For this signal type and
for HDQPSK, there is no grouping into bursts and all symbols that are analyzed are shown.
274
SignalVu-PC Printable Help
APCO P25 Analysis
P25 Symbol Table Settings
Elements of the Display
Element
Description
Marker
Displays the selected marker label.
Time
Displays the time in ms or in Symbols based on the Units chosen in the Analysis Time
tab of the Settings Control panel.
Symbol
The value shown here reflects the symbol you have selected (highlighted) in the display.
Value
Displays the value of the selected symbol.
xxx
P25 Symbol Table Settings
Application Toolbar:
The settings for the P25 Symbol Table display are shown in the following table.
SignalVu-PC Printable Help
275
APCO P25 Analysis
P25 Frequency Dev Vs Time Display
Settings tab
Description
Modulation Params (see
page 280)
Specifies the input signal standard and additional user-settable signal parameters.
Analysis Params (see
page 283)
Specifies parameters used by the instrument to analyze the input signal.
Analysis Time (see page 283)
Specifies parameters that define the portion of the acquisition record that is used for
analysis. Also allows you to specify the Units (Symbols or Seconds) for P25 Analysis
displays.
Trig Meas (see page 288)
Enables you to select from various trigger measurements. The trigger selections vary
by signal type.
Test Patterns (see page 285)
Specifies the type of test pattern being used. Some analysis differs based on the
selected test pattern. Available test patterns vary depending on the selected standard
and modulation type.
Prefs (see page 289)
Specifies the radix of the marker readout.
xxx
P25 Frequency Dev Vs Time Display
The P25 Frequency Devisation vs. Time Display shows how the signal frequency varies with time.
To display the P25 Frequency Dev vs. Time Display:
1. If you are analyzing a stored data file, recall the data file now. Otherwise, go to the next step.
2. Select the Displays button or Setup > Displays.
3. In the Select Displays dialog, select P25 Analysis in the Measurements box.
4. In the Available displays box, double-click the P25 Frequency Dev vs. Time icon or select the icon
and click Add. The P25 Frequency Dev vs. Time icon will appear in the Selected displays box and
will no longer appear under Available displays.
5. Click OK to display the Freq Dev vs. Time display.
6. Select the Modulation Params tab. Set the Standard, Modulation Type, and Measurement and
Reference filters as appropriate for the input signal.
7. Select the Test Patterns tab and select a test pattern. The available test patterns in the drop down list
depend of the standard and modulation type you have selected.
Elements of the Display
The following image shows the P25 Freq Dev vs Time display for Phase 1 C4FM (non-bursty) High
Deviation signals.
276
SignalVu-PC Printable Help
APCO P25 Analysis
P25 Frequency Dev Vs Time Display
The following image shows the P25 Freq Dev vs Time display for Phase 2 HCPM (bursty) signals.
SignalVu-PC Printable Help
277
APCO P25 Analysis
P25 Frequency Dev Vs Time Settings
NOTE. For bursty HCPM signals, frequency deviation analysis is done only on 160 symbols centered
at every on slot region in the chosen analysis window and not on off slot regions. That is why there
is no information shown during off slot regions. You can read more specific information about P25
measurements here (see page 252).
Elements of the Display
Item
Display element
Description
1
Top of graph adjustment
Adjust the frequency range displayed on the vertical axis.
2
Position (center)
Adjust the frequency shown at the center of the display.
3
Autoscale button
Adjusts the offset and range for both vertical and horizontal to provide the
best display.
4
Position
Displays the horizontal position of the trace on the graph display.
5
Scale
Adjust the horizontal scale (time).
xxx
Changing Frequency vs Time Display Settings (see page 278)
P25 Frequency Dev Vs Time Settings
Menu Bar: Setup > Settings
Application Toolbar:
The Setup settings for P25 Frequency Dev vs. Time are shown in the following table.
278
SignalVu-PC Printable Help
APCO P25 Analysis
P25 Analysis Shared Measurement Settings
Settings tab
Description
Modulation Params (see
page 280)
Specifies the input signal standard and additional user-settable signal parameters.
Analysis Params (see
page 283)
Specifies parameters used by the instrument to analyze the input signal.
Analysis Time (see page 283)
Specifies parameters that define the portion of the acquisition record that is used for
analysis. Also allows you to specify the Units (Symbols or Seconds) for P25 Analysis
displays.
Trig Meas (see page 288)
Enables you to select from various trigger measurements. The trigger selections vary
by signal type.
Test Patterns (see page 285)
Specifies the type of test pattern being used. Some analysis differs based on the
selected test pattern. Available test patterns vary depending on the selected standard
and modulation type.
Trace (see page 286)
Specifies the trace type (Vectors, Points, and Lines), the number of points per symbol
when chosen to view as Vectors or Lines, and to control the view as Freq Dev or IQ.
Scale (see page 286)
Defines the vertical and horizontal axes.
Prefs (see page 289)
Specifies the radix of the marker readout and whether elements of the graphs are
displayed.
xxx
P25 Analysis Shared Measurement Settings
Application Toolbar:
The control panel tabs in this section are shared between the displays in P25 Analysis (Setup > Displays).
Some tabs are shared by all the displays, some tabs are shared by only a subset of displays. The settings
available on some tabs change depending on the selected display.
SignalVu-PC Printable Help
279
APCO P25 Analysis
Modulation Params Tab - P25
Common controls for P25 analysis displays
Settings tab
Description
Modulation Params (see
page 280)
Specifies the input signal standard and additional user-settable signal parameters.
Analysis Params (see
page 283)
Specifies parameters used by the application to analyze the input signal.
Analysis Time (see page 283)
Specifies parameters that define the portion of the acquisition record that is used for
analysis. Also allows you to specify the Units (Symbols or Seconds) for P25 Analysis
displays.
Trace (see page 286)
Specifies the trace type (Vectors, Points, and Lines), the number of points per symbol
when chosen to view as Vectors or Lines, and to control the view as Freq Dev or IQ.
Scale (see page 286)
Defines the vertical and horizontal axes.
Test Patterns (see page 285)
Enables you to select from eight different test patterns.
Trig Meas (see page 288)
Enables you to select from various trigger measurements. The trigger selections vary
by signal type.
Prefs (see page 289)
Specifies the radix of the marker readout and whether elements of the graphs are
displayed.
xxx
Modulation Params Tab - P25
The Modulation Params tab specifies the type of modulation used by the input signal and other parameters
that define the signal format.
280
SignalVu-PC Printable Help
APCO P25 Analysis
Modulation Params Tab - P25
Settings
Description
Standard
Specifies the standard used for the input signal: Phase 1, Phase 2.
Channel Bandwidth
This readout shows the nominal channel bandwidth based on the standard.
Modulation Type
Specifies the modulation type of the input signal. Choices vary depending on
the selected standard. Modulation types for Phase 2 are HCPM (Inbound)
and HDQPSK (Outbound). Phase 1 has only C4FM as the modulation type
selection.
Measurement Filter
Specifies the filter used as a measurement.
Reference Filter
Specifies the filter used as a reference.
Filter Parameter
Enter a value used for defining the Reference Filter. (Not present for some
filter types)
Symbol Rate
This is a readout that shows the symbol rate for demodulating digitally
modulated signals based on the standard. This rate is always 4.8 kHz for Phase
1 signals and 6 kHz for Phase 2 signals.
xxx
Symbol Rate
Specifies the symbol rate for demodulating digitally modulated signals based on the standard. The symbol
rate and the bit rate are related as follows:
(Symbol rate) = (Bit rate)/(Number of bits per symbol)
The bit rate used for Phase 1 (C4FM) is 9600 bps. For Phase 2 (HCPM and HDQPSK) it is 12000 bps.
There are two bits per symbol for all above mentioned modulation types. Therefore, the symbol rate is
4800 Hz for Phase 1 and 6000 Hz for Phase 2.
Measurement and Reference Filters
The available measurement and reference filters depend on the selected modulation type. The following
table shows the recommended filters for the specified modulation types.
CAUTION. Although there are other filter types listed in the drop down menu, if you select any filter other
than that which is recommended, the measurement results may not be accurate.
Modulation type
Measurement filters
Reference filters
HDQPSK
HDQPSK-P25
None
HPCM
None
None
C4FM
C4FM-P25
RaisedCosine (Filter parameter 0.2)
xxx
The measurement filter is applied before the demodulation bit is detected and the ideal reference is
calculated.
The reference filter is applied to the internally generated ideal reference signal before the modulation
fidelity is calculated.
SignalVu-PC Printable Help
281
APCO P25 Analysis
Modulation Params Tab - P25
How to Select Filters
In a signal transmitter/receiver system, the baseband signal might be filtered for bandwidth limiting or for
another kind of necessary shaping that needs to be applied. Normally, a filter in the transmitter (Ft) and a
filter in the receiver (Fr) are applied.
The Measurement Filter setting in the analyzer corresponds to the baseband filter in the receiver (Fr): This
setting tells the analyzer what filter your receiver uses. When the analyzer is set to the same filter used by
the receiver, the analyzer sees the signal as your receiver would. The Measurement Filter setting should be
the same as the filter used in the receiver under normal operation (as opposed to testing).
The Reference Filter setting in the analyzer corresponds to the baseband filter in the transmitter-receiver
combination (Fr * Ft). The baseband filter for the transmitter-receiver combination is often referred to as
the System Filter. This filter is called the reference filter because it is used to recreate a reference signal
that is compared to the received signal. This recreated reference signal is the ideal signal with Fr * Ft
applied; differences between this ideal signal and the received signal enables the determination of signal
quality, such as modulation fidelity measurements.
Filter Parameter (C4FM only)
The filter parameter specifies the alpha for the Raised Cosine filter when selected as the Reference filter.
Some filter types have a fixed parameter value that is specified by industry standard, while other filter types
by definition have no filter parameter. For filter types with no filter parameter, there is no filter parameter
control present in the control panel. The recommended Reference filter for C4FM is Raised Cosine and the
corresponding filter parameter for C4FM is 0.2.
282
SignalVu-PC Printable Help
APCO P25 Analysis
Analysis Params Tab - P25
Analysis Params Tab - P25
The Analysis Params tab contains parameters that control the analysis of the input signal.
Settings
Description
Frequency Error
When the Auto box is checked, the analysis determines the Frequency Error
and the measured Frequency Error is displayed. When the Auto box is
unchecked, the entered value is used by the analysis as a fixed frequency
offset. This is useful when the exact frequency offset of the signal is known.
Measurement BW
Specifies the bandwidth about the center frequency at which measurements
are made. Select Manual, Auto, or Link to Span.
PTX
Specifies the RF Output Power as recommended for transmitters. This is only
used in the computation of off slot power in HCPM modulated signals.
xxx
Analysis Time Tab - P25
The Analysis Time tab contains parameters that define how the signal is analyzed in the P25 Analysis
displays.
SignalVu-PC Printable Help
283
APCO P25 Analysis
Analysis Time Tab - P25
Settings
Description
Analysis Offset
Specifies the location of the first time sample to use in measurements.
Auto
Analysis Length
When enabled, causes the instrument to set the Analysis Offset value based on the
requirements of the selected display.
Specifies the length of the analysis period to use in measurements. Length is specified in
either symbols or seconds, depending on the Units setting.
Auto
When enabled, causes the instrument to set the Analysis Length value based on the
requirements of the selected display.
Actual
This is a displayed value, not a setting. It is the Analysis Length (time or symbols)
being used by the analyzer, this value may not match the Analysis Length requested
(in manual mode).
Time Zero Reference
Specifies the zero point for the analysis time.
Units
Specifies the units of the Analysis Length to either Symbols or Seconds.
xxx
Analysis Offset
Use analysis offset to specify where measurements begin. Be aware that you cannot set the Analysis
Offset outside the range of time covered by the current acquisition data. (all time values are relative
to the Time Zero Reference).
You can set the Analysis Length so that the requested analysis period falls partly or entirely outside the
current range of acquisition data settings. When the next acquisition is taken, its Acquisition Length will
be increased to cover the new Analysis Length, as long as the Sampling controls are set to Auto. If the
Sampling parameters are set to manual, or if the instrument is analyzing saved data, the actual analysis
length will be constrained by the available data length, but in most cases, measurements are able to be
made anyway. The instrument will display a notification when measurement results are computed from
less data than requested. Range: 0 to [(end of acquisition) - Analysis Length)]. Resolution: 1 effective
sample (or symbol).
Analysis Length
Use the analysis length to specify how long a period of time is analyzed. As you adjust this value, the
actual amount of time for Analysis Length, in Symbol or Seconds units, is shown below the control in the
"Actual" readout. This setting is not available when Auto is checked. Range: minimum value depends on
modulation type. Resolution: 1 symbol.
Time Zero Reference
All time values are measured from this point (such as marker position or horizontal position (in Y vs Time
displays). Choices are: Acquisition Start or Trigger. When a trigger measurement is chosen from the Trig
Meas tab of the Settings control panel, Time Zero Reference is forced to Trigger.
Parameter
Description
Acquisition Start
Time zero starts from the point at which acquisition begins.
Trigger
Time zero starts from the trigger point.
xxx
284
SignalVu-PC Printable Help
APCO P25 Analysis
Test Patterns Tab - P25
Test Patterns Tab - P25
Test patterns allow the software to compare the measurement result to the standards limit. The list of
available test patterns varies depending on which standard and modulation type is selected.
Settings
Description
Test Patterns
Use this drop-down list to select an appropriate test pattern. The list varies depending on
which standard and modulation type is selected.
xxx
You can read more about test patterns here (see page 260).
SignalVu-PC Printable Help
285
APCO P25 Analysis
Trace Tab - P25
Trace Tab - P25
The Trace tab allows you to set the trace display characteristics of the P25 trace display. The selections
vary depending on the selected display.
The following image shows the tab for the Constellation and Eye Diagram displays. For the other trace
displays, the Trace Type setting is not available.
Setting
Description
Trace
(P25 Constellation and P25
Eye Diagram displays only)
Select the trace to display.
P25 Constellation display only: Select the trace that is hidden or displayed based on
whether or not Show is selected.
Show
(P25 Constellation and P25
Eye Diagram displays only)
Specifies whether the trace selected by Trace is displayed or hidden.
Freeze
(P25 Constellation display
only)
Halts updates to the trace selected by the Trace setting. Present for the Constellation
display only.
Points/Symbol
Select how many points to use between symbols when connecting the dots. Values:
1, 2, 4, 8.
Content
(P25 Constellation and P25
Freq Dev & Time displays
only)
Select whether to display the trace as vectors (points connected by lines), points
(symbols only without lines), or lines (lines drawn between symbols, but no symbols are
displayed). The choices available depend on the display.
Trace Type
(P25 Constellation and P25
Eye Digram displays only)
Select to specify whether the plots in the Constellation and Eye Diagram displays are
shown as I vs Q or as Frequency Deviation.
xxx
Scale Tab - P25
The Scale tab allows you to change the scale settings that control how the trace appears on the display
but does not change control settings such as Measurement Frequency. There are three versions of the
Scale tab for P25 displays.
286
SignalVu-PC Printable Help
APCO P25 Analysis
Scale Tab - P25
Scale tab for the P25 Eye Diagram display
Scale tab for the P25 Power vs Time display
Scale tab for the P25 Freq Dev vs Time display
Settings
Description
Vertical
Controls the vertical position and scale of the trace display.
Scale
Changes the vertical scale of the graph.
Position
Adjusts the reference level away from top of the graph.
Autoscale
Resets the scale of the vertical axis to contain the complete trace.
Horizontal
Horizontal Full Burst
Controls the span of the trace display and position of the trace.
Scale
Allows you to, in effect, change the span.
Position
Allows you to pan a zoomed trace without changing the Measurement Frequency.
Autoscale
Resets the scale of the horizontal axis to contain the complete trace.
Auto
When Auto is checked, the scale and position values for the Symbols graph are
automatically adjusted to maintain the optimal display.
Reset
Resets the vertical and horizontal settings.
xxx
SignalVu-PC Printable Help
287
APCO P25 Analysis
Trig MeasTab - P25
NOTE. The Units used for the horizontal scale can be either Seconds or Symbols. To set the units for
the horizontal scale, display the Analysis Time tab. On the tab, select the appropriate units from the
Units drop-down list.
Trig MeasTab - P25
The Trig Meas tab enables you to chose a trigger measurement. The available measurements in the
drop-down menu depend on the standard and modulation type selected in the Modulation Params tab. The
Trig Meas tab is not available for Phase 2 HDQPSK (Outbound) signals. You can read more about P25
trigger related measurements here (see page 255).
The following image shows the tab for Phase 1 (C4FM) signals.
The following image shows the tab for Phase 1 (HCPM Inbound) signals.
Settings
Description
Trigger Measurements
Select the trigger measurement test.
xxx
288
SignalVu-PC Printable Help
APCO P25 Analysis
Prefs Tab - P25
Prefs Tab - P25
The Prefs tab enables you to change appearance characteristics of the P25 Analysis displays. Not all
settings on the Prefs tab shown below appear for every P25 display. The Summary display does not
have a Prefs tab.
Setting
Description
Show graticule
Shows or hides the graticule.
Show Marker readout in graph
(selected marker)
Shows or hides the readout for the selected marker in the graph area.
Radix
Specifies how symbols are displayed in the Symbol Table display and in the Marker
readout in the display. There are three choices for Radix: Binary (00,01,10,11),
Quaternary (0,1,2,3), and Modulation Symbols (+1,+3,-1,-3).
xxx
SignalVu-PC Printable Help
289
APCO P25 Analysis
Limits Tab - P25
Limits Tab - P25
The Limits tab is only available for the P25 Summary display. It enables you to load an existing limits
table, save a limits table, or edit limits values.
Setting
Description
Load
Click to load a saved Limits table from a .csv file.
Save
Click to save the current Limits table to a .csv file.
xxx
Edit Limits
To directly edit measurement limits in the table, click on the value in the Limit column that you want
to change.
The following table describes the parameters that are set in the Limits Table.
Limits Table Settings
Setting
Description
On
Click on the cell in the On column next to the measurement to specify whether ofrnot
measurements are selected for limit comparison to indicate Pass or Fail.. A check mark
means the measurement will be taken. An empty box means it will not be taken.
Measurement Name
Specifies the name of the measurement related to the limit. (Not editable.)
Limit
Specifies the value of the limit to the related measurement. When the cell is selected,
the value is shown along with the units.
xxx
290
SignalVu-PC Printable Help
Audio Analysis
Overview
Overview
Audio Analysis measures basic time- and frequency-domain parameters of analog audio signals modulated
on a carrier (AM, FM and PM modulation) or unmodulated (non-carrier) audio signals (Direct).
For modulated signals, the measurement analysis first demodulates the signal to provide the Audio signal
waveform. Direct input signals bypass the demodulation step. For FM and PM demodulation, the carrier
frequency error is estimated during demodulation.
The Audio signal waveform excursions are then measured to determine the Peak and RMS waveform
parameters. Next, the analysis detects the highest-amplitude frequency component within the audio
bandwidth, and makes a high-accuracy frequency measurement of the frequency component. This value is
called the Audio Frequency.
A spectral analysis of the Audio signal waveform is performed to determine the presence and level of
harmonically- and/or non-harmonically-related narrowband spurs and wideband noise. The Audio
signal, harmonic and non-harmonic spurs, and noise level data are combined to produce signal summary
parameters including SINAD, Modulation Distortion, Signal-to-Noise, Total Harmonic Distortion, and
Total Non-Harmonic Distortion.
Controls are provided to allow the user to select audio filters of Low Pass, High Pass, FM De-emphassis,
or Standard-defined response, as well as completely user-definable filter response. Filtering can be applied
as needed to modify the audio spectrum result before measurement to remove unwanted spurs or noise.
Flexible control parameters are provided to allow setting the Audio Bandwidth for analysis, the Resolution
Bandwidth (RBW) and RBW filter type of the spectral analysis, and number and level qualifications for
Harmonic and Non-harmonic spur detection. Multiple-spectrum averaging can be enabled to provide a
smoothed spectrum for results with less variability than single-spectrum results.
The Audio Spectrum display shows the frequency spectrum waveform with detected harmonic and
non-harmonic components identified by markers, and a corresponding table of frequency and level values
for the spur components. The markers and table provide easy visualization of the significant spurs and
their relation to the fundamental Audio frequency signal.
Audio Demod Tab
Menu Bar: Setup > Audio
Application Toolbar:
Selecting Audio displays the Audio control panel.
The Audio control panel is only available when SignalVu-PC is connected to an RSA306.
NOTE. Audio Demodulation is available only in real-time acquisition mode (not swept acquisition), and
the Trigger mode must be set to Free Run (not Triggered).
SignalVu-PC Printable Help
291
Audio Analysis
Audio Spectrum Display
Setting
Description
Demodulation
Sets both the demodulation type and bandwidth.
Run
Starts and stops the live audio demodulation process.
Volume
Adjusts the volume of the demodulated audio signal
played out through the PC speakers.
Mute
Inhibits the audio from playing out through the PC
speakers
Stream to File
These controls allow you to stream the demodulated
audio file directly to disc.
The audio file is saved as a .WAV file.
File:
Displays the current location where the audio file is saved.
Browse:
Use the Browse... button to navigate to a location to save
the audio file.
Activate
This enables the Stream to File function. When
checked, anytime the Run button is pressed, the audio
stream-to-file begins.
xxx
Audio Spectrum Display
The Audio Spectrum display shows audio modulation characteristics. You can choose to show just the
spectrum of the audio signal or show the audio spectrum of the signal and the results of distortion
measurements. The Audio Spectrum display can show a table listing the frequency of a Harmonic
Distortion (HD) and Non-Harmonic Distortion (NHD) and its level. The Spectrum graph indicates these
harmonics and non-harmonics with special markers.
To display the Audio Spectrum display:
1. Recall an appropriate acquisition data file.
2. Press the Displays button or select Setup > Displays. This shows the Select Displays dialog box.
3. From the Measurements box, select Audio Analysis.
4. Double-click the Audio Spectrum icon in the Available Displays box. This adds the Audio Spectrum
icon to the Selected displays box.
5. Click the OK button. This shows the Audio Spectrum display.
6. Press the Replay button to take measurements on the recalled acquisition data file.
292
SignalVu-PC Printable Help
Audio Analysis
Audio Spectrum Settings
Elements of the Audio Spectrum Display
Item
Display element
Description
1
Vertical position
Sets the top of graph value.
2
dB/div
Sets the vertical scale value. The maximum value is 20.00 dB/division.
3
Audio BW
Specifies the measurement bandwidth of the Audio Spectrum display, which
in turn can influence the acquisition bandwidth.
4
Table
Displays a table that shows the distortion measurement results and displays
indicators on the graph that highlight the location of the harmonics on the
trace.
5
Bottom of graph readout
Displays the bottom of graph value.
6
Non-harmonic threshold
indicator
Displays the threshold for detecting non-harmonic components.
7
Analysis results
Display of the audio analysis results.
xxx
Audio Spectrum Settings
Menu Bar: Setup > Settings
Application Toolbar:
The measurement settings for the Audio Spectrum display are shown in the following table.
SignalVu-PC Printable Help
293
Audio Analysis
Audio Summary Display
Settings tab
Description
Params1 Tab (see page 296)
Specifies signal type, Audio Bandwidth, RBW, RBW filter, and Ref Audio Frequency.
Params2 Tab (see page 299)
Specifies Harmonics and Non-Harmonics measurement parameters.
Audio Filters Tab (see
page 299)
Specifies the audio filter characteristics.
Scale Tab (see page 302)
Sets vertical and horizontal scale and position parameters.
Prefs Tab (see page 305)
Specifies vertical units, and whether on not some features are displayed in the graph.
xxx
Audio Summary Display
To display the Audio Summary display:
1. Press the Displays button or select Setup > Displays. This shows the Select Displays dialog box.
2. From the Measurements box, select Audio Analysis.
3. Double-click the Audio Summary icon in the Available Displays box. This adds the Audio Summary
icon to the Selected displays box.
4. Click the OK button. This shows the Audio Summary display.
The Audio Summary Display
Audio Summary Displayed Measurements
Table 5: Audio Summary Measurements
294
Signal type
Item
Description
AM, FM, PM
Carrier Power
Average power of the carrier signal with
modulation removed.
Direct
Signal Power
Average power of the input signal
FM, PM
Carr Freq Err
Carrier frequency error
AM, FM, PM. Direct
Audio Freq
Fundamental audio frequency
SignalVu-PC Printable Help
Audio Analysis
Audio Summary Settings
Table 5: Audio Summary Measurements (cont.)
Signal type
Item
Description
+Peak
+Peak modulation excursion (where the
modulation excursion readout depends on the
signal type) 1
-Peak
-Peak modulation excursion (where the
modulation excursion readout depends on the
signal type) 1
Peak-Peak/2
Half peak-peak modulation excursion (where the
modulation excursion readout depends on the
signal type) 1
RMS
RMS modulation excursion (where the modulation
excursion readout depends on the signal type) 1
SINAD
Signal to noise and distortion
Mod Distor
Modulation distortion
S/N
An estimate of the Signal level to Noise (only)
level, with the HD and NHD components removed
THD
Total harmonic distortion
TNHD
Total non-harmonic distortion
Ref
Ref is the RMS modulation value stored when
the Capture Reference button is pressed.
(Displayed only when Hum & Noise is enabled.)
Diff
Diff is the difference between the current RMS
mod value and the Ref value captured previously.
(Displayed only when Hum & Noise is enabled.)
xxx
1
For AM signal types, modulation excursion is "% Modulation Depth". For FM signal types, modulation excursion is "Frequency Deviation". For PM
signal types, modulation excursion is "Phase Deviation". For Direct, there is no modulation excursion, it is actually "signal excursion".
Audio Summary Settings
Application Toolbar:
The measurement settings for the Audio Summary display are shown in the following table.
Settings tab
Description
Params1 Tab (see page 296)
Specifies signal type, Audio Bandwidth, RBW, RBW filter, and Ref Audio Frequency.
Params2 Tab (see page 299)
Specifies Harmonics and Non-Harmonics measurement parameters.
Audio Filters Tab (see
page 299)
Specifies the audio filter characteristics.
Hum Noise Tab (see page 304)
Specifies whether or not Hum & Noise is measured and enables the capture of a signal
to be used as a reference of the Hum & Noise measurement.
xxx
SignalVu-PC Printable Help
295
Audio Analysis
Audio Analysis Measurement Settings
Audio Analysis Measurement Settings
The control panel tabs in this section are shared by the displays in the Audio Analysis folder (Setup >
Displays).
Common controls for Audio Analysis displays
Settings tab
Description
Params1 Tab (see page 296)
Specifies characteristics about the audio signal and how measurements are made.
Params2 Tab (see page 299)
Specifies parameters that control how measurements are made on harmonics.
Audio Filters Tab (see
page 299)
Specifies characteristics of filters applied to the signal before measurements are taken.
Scale Tab (see page 302)
Sets vertical and horizontal scale and position parameters.
Prefs Tab for Audio Analysis
(see page 305)
The Prefs tab enables you to change appearance characteristics of the Audio Analysis
displays.
xxx
Params1 Tab
The Params1 tab is used to specify characteristics of the audio signal to be measured and how the signal
will be measured.
Params1 tab for AM signal types
296
SignalVu-PC Printable Help
Audio Analysis
Params1 Tab
Setting
Description
Signal Type
Specifies the type of signal to be analyzed. The available choices are AM, FM, PM,
and Direct.
Audio BW
Specifies the bandwidth used for audio analysis.
Ref Audio Freq
A measured value when Auto is selected. If you want to specify the reference audio
frequency, uncheck Auto and enter a value manually. If Ref Audio Freq is set manually,
be aware that the automated detection is still performed, but it is limited to a frequency
range of ±1% of the Audio BW centered around the manually specified value.
Carrier Freq Error / Carrier
Freq Offset
(FM and PM only) A measured value, when Auto is selected. If Auto is unchecked, you
can specify the Carrier Frequency Offset.
RBW
Displays the Resolution Bandwidth for Audio measurements. This value is automatically
set by default to 1/500 of the measurement bandwidth. To manually specify the
RBW, uncheck Auto. The minimum RBW value is limited to the larger of 1 Hz or
AudioBW/10000. The maximum is limited to AudioBW/100.
RBW Filter
Specifies the windowing method used for the transform.
xxx
Setting Frequency for Direct Signal Types
Direct (unmodulated) signal analysis is only possible with the instrument Frequency control set to 0 Hz.
You will receive a warning to set Frequency to 0 Hz when Direct signal type is selected, if you haven’t
already done so. Modulated signal types may be selected with Frequency set to 0 Hz, but results are not
meaningful in that case. For modulated signals, Frequency should always be set to a value ≥ Audio
Bandwidth to avoid self-interference of the signal due to spectral folding.
Setting Audio Bandwidth
For AM, FM and PM, the Audio Bandwidth control sets not only the demodulated signal bandwidth, but
also determines the pre-demodulation bandwidth. Set it to a value at least half the pre-demodulation
signal bandwidth, as in this equation:
Audio BW ≥ Signal Bandwidth / 2
NOTE. When performing audio analysis, you should allow the Audio BW control to automatically set the
acquisition bandwidth, rather than manually adjusting the Acq BW control on the Sampling Parameters
tab of the Acquire control panel. The audio measurement will cause the Acq BW setting to be ≥ Audio
BW (Direct) or ≥ 2 × Audio BW (AM, FM, PM).
For Direct signals, set Audio Bandwidth large enough to include any significant harmonics/non-harmonics
or other signal component of interest. For example, to measure up to the 10th harmonic of a signal with a 5
kHz fundamental component, set Audio Bandwidth to 10 x 5 kHz = 50 kHz.
For modulated signals, Audio Bandwidth must be set wide enough to include all significant signal
modulation components in addition to the desired audio analysis bandwidth. For AM this is similar to
Direct. For example, to measure up to the 10th harmonic of an AM signal with 3 kHz fundamental
component, set Audio Bandwidth to 10 x 3 kHz = 30 kHz. This ensures that the bandwidth of the data
provided by the system to the measurement will be at least of 60 kHz (2 x 30 kHz) which is sufficient for
this signal and analysis requirement.
SignalVu-PC Printable Help
297
Audio Analysis
Params1 Tab
FM and PM are more complex. For FM, the analysis bandwidth needs to be at least twice as wide as the
the sum of peak Frequency Deviation and the Fundamental Frequency (Carsons rule). This is a parallel
condition along with setting Audio Bandwidth large enough for the maximum audio bandwidth to analyze.
Therefore, for FM, Audio Bandwidth should be:
AudioBW (FM) = MAX( MaxAudioAnalysisFreq, FreqDeviation+FundamentalFreq )
where MaxAudioAnalysisFreq is the highest audio frequency desired in the analysis. For example, for
an FM signal with fundamental signal of 5 kHz and peak frequency deviation (one-sided) of 10 kHz,
Acquisition Bandwidth should be at least (2*(10k+5k)) = 30 kHz, or an Audio Bandwidth of 15 kHz. Also
if the analysis should extend to the 8th harmonic, then the Audio Bandwidth needs to be at least 8*5 kHz =
40 kHz. So Audio Bandwidth should be set to 40 kHz. Using the equation:
AudioBW(FM) = MAX( 8x5kHz, (10+5)kHz ) = MAX( 40 kHz, 15kHz) = 40 kHz
The formula for PM is:
AudioBW (PM) = MAX (MaxAudioAnalysisFreq, PMFreqDeviation+FundamentalFreq)
where
PMFreqDeviation = PMPhaseDeviationInRadians x FundamentalFreq
RBW Filter Shape
Select Kaiser in most cases for best measurement performance. Select Flattop only if you want to use
standard markers to measure signal amplitude with highest accuracy.
298
SignalVu-PC Printable Help
Audio Analysis
Params2 Tab
Params2 Tab
The Params2 tab is used to specify how the signal harmonics are measured and to control spectrum
averaging.
Setting
Description
No. of Harmonics
Specifies the number of harmonics to detect. The detected harmonics are tagged with a
number on the spectrum trace. The available range is 1–20.
No. of Non-Harmonics
Specifies the number of non-harmonics to detect. The detected non-harmonics are
tagged with a number on the spectrum trace. The available range is 0–20.
Averaging
Specifies the number of averages used to compute the results. Range: 2–100.
Ignore region
Specifies the region about the signal frequency where the instrument will ignore
non-harmonics.
Non-Harmonic Threshold
Specifies the level which a spectrum peak must exceed to be declared a non-harmonic
signal component.
Non-Harmonic Excursion
Specifies the difference in level between a spectrum peak and the average noise level
that must be exceeded for the peak to be declared a non-harmonic signal component.
xxx
About Averaging In Audio Analysis Displays
Analysis averaging is implemented using a “block” method. This means that the entire record required for
multiple spectrum computations is acquired and analyzed within one analysis cycle. The result of each
analysis update is a complete, independent result from a set of N spectrums averaged together, where N is
the Averaging control value.. Since each update is a fully averaged result, no partially averaged results
are output before a final result is available, so each output is fully valid. However, with large Averaging
values, acquisition record sizes and measurement times may become large, so care should be taken to
select the minimum amount of averaging needed.
Audio Filters Tab
The Audio Filters tab is used to specify filters to be applied to the acquired audio signal before
measurements are taken. You can select from pre-defined filters or use a filter you define in a text file.
You can also specify the de-emphasis time constant applied to the audio signal and the telecom weighting
filters used to measure noise.
SignalVu-PC Printable Help
299
Audio Analysis
Audio Filters Tab
Pre-defined Filters
You can specify low-pass filter (LPF) and high-pass filter (HPF) settings, a de-emphasis time constant
and/or a telecom weighting filter to match the response of your receiver. Alternatively, you can create a
text file to specify the frequency response points.
To use pre-defined filters:
1. Select the Pre-defined Filters option button.
2. Select the LPF, HPF, De-emphasis and Standard check boxes as appropriate.
3. Select the desired filter parameter from the drop-down list for each of the enabled filters or select User
from the list if you wish to use a custom value. For LPF and HPF, the listed frequencies represent the
3dB cutoff point of the filter.
4. If you select User from the drop-down list, enter a value in the text entry box that appears.
To disable all filtering:
1. Select the Pre-defined Filters option button.
2. Deselect all four filter check boxes.
Table 6: Predefined audio filters
Filter type
Available settings
LPF (Low Pass Filter)
(5th-order Butterworth response)
300 Hz
3 kHz
15 kHz
30 kHz
80 kHz
300 kHz
User 1
HPF (High Pass Filter)
(5th-order Butterworth response)
20 Hz
50 Hz
300 Hz
400 Hz
User 1
300
SignalVu-PC Printable Help
Audio Analysis
Audio Filters Tab
Table 6: Predefined audio filters (cont.)
Filter type
Available settings
De-emphasis (FM only)
25 μs
50 μs
75 μs
750 μs
User. Range: 25 μs to 10 ms
Standard
CCITT
C-message
xxx
1
User-entered values are restricted to maximum of 0.9 * Audio BW, and will automatically adjust downward to meet this limit (if required) when
AudioBW is decreased.
Standard. Use this setting to specify the telecom weighting filter. The characteristics of these filters are
described in ITU-T Recommendation O.41, Psophometer for Use on Telephone-type Circuits.
Using Custom Audio Filters
If you want to use audio filters that have a different response shape than the pre-defined filters, you can
create a custom audio filter using a text or CSV file to specify the desired filter frequency response.
To use a custom audio filter:
1. Verify that Audio Spectrum or Audio Summary is the selected display.
2. Click the Settings icon or select Setup > Settings.
3. Select the Audio Filters tab.
4. Click the File button.
5. Click the ... button and navigate to the location of the custom audio filter file you wish to use. Select
the file you want to use and click Open.
6. Acquire a new trace or replay a saved file to see the effect of the custom filter.
Creating a Custom Audio Filter. A custom audio filter file is either a plain text file or a CSV format file.
The file contains frequency (in Hz) and amplitude (in dB) value pairs which specify the filter frequency
response shape. Each pair must be on a separate line. The filter response between the points is interpolated
using a cubic spline fit.
The following table shows the first few lines of a custom audio filter text file.
0,
-100
16.66,
-85
50,
-63
100,
-41
200,
-21
300,
-10.6
SignalVu-PC Printable Help
301
Audio Analysis
Scale Tab
400,
-6.3
500,
-3.6
600,
-2
700,
-0.9
800,
...
0
...
xxx
Format and rule-checking on custom audio filter files is performed as follows:
The maximum number of frequency and amplitude pairs is 1000.
Column 1 (frequency values in Hertz).
Non-negative values only (zero is allowed).
Strictly increasing order of frequencies (frequency value on each line > frequency value on
previous line).
There is no upper limit on the frequency value.
Column 2 (amplitude values in dB units, where gain is a positive value and attenuation is a negative
value).
Values are restricted to the range -200 to +20 dB.
Scale Tab
The Scale tab allows you to change the vertical and horizontal scale settings. Changing the scale settings
changes how the trace appears on the display but does not change acquisition control settings. In effect,
these controls operate like pan and zoom controls.
302
SignalVu-PC Printable Help
Audio Analysis
Setting
Scale Tab
Description
Vertical
Scale
Changes the range shown between the top and bottom of the graph.
Position
Adjusts the level shown at the top of the graph for linear units or the top of the graph
for log units (for example, dBm).
Autoscale
Resets the Position so that the highest trace points are in the graph. For linear units
(Volts, Watts), the Autoscale also adjusts Scale.
Horizontal
Left
Changes the frequency shown at the left side of the graph.
Right
Changes the frequency shown at the right side of the graph.
Autoscale
Resets the Left and Right settings to show the entire trace.
Log
Sets the graph horizontal axis to a logarithmic scale.
Reset Scale
Resets the Vertical and Horizontal settings to their default values.
xxx
SignalVu-PC Printable Help
303
Audio Analysis
Hum & Noise Tab
Hum & Noise Tab
Hum & Noise (available only when the Audio Summary display is the active display) is useful for
comparing residual power or modulation if the Ref value is captured when the Signal is On (Direct) or
modulated (AM/FM/PM). When the signal is turned off (Direct) or modulation turned off (AM/FM/PM),
Diff indicates how much residual Hum and Noise are still present in the measurement value.
To display Hum & Noise measurement:
1. Select Setup > Displays.
2. In the Select Displays window, select the Audio Analysis folder.
3. Double-click the Audio Summary icon so that it appears in the Selected displays box.
4. Click OK
5. With the Audio Summary display selected, select Setup > Settings.
6. Select the Hum & Noise tab. Click on the Measure Hum & Noise checkbox so that it is checked.
The Hum & Noise values appear at the bottom list of measurements in the Audio Summary display.
7. Acquire an appropriate signal.
8. While the analyzer is analyzing a signal you want to use as a reference, click the Capture reference
now button to save a reference value.
The Hum & Noise measurement compares the value of a specific signal quantity captured by the Capture
reference now button with the current measured value of that quantity. For Direct signal types (set on the
Params1 tab), the Signal Level is captured and compared. The Diff measurement is:
SignalLevel(current) – SignalLevel(Ref)
in dB.
For AM, FM, and PM signal types, the RMS modulation value (related to Modulation Depth, Frequency
Deviation or Phase Deviation) is captured and compared. The Diff measurement is:
20 x log10 (RMS(current)/RMS(Ref))
in dB.
304
SignalVu-PC Printable Help
Audio Analysis
Prefs Tab
Prefs Tab
The Prefs tab enables you to change appearance characteristics of the Audio Spectrum display.
Setting
Description
Units:
Specifies the vertical scale units. The units available depend on the signal type selected.
Show graticule
Select to display or hide the graticule.
Trace points
Sets the number of trace points used for marker measurements and for results export.
Show Marker readout in graph
(selected marker)
Shows or hides the readout for the selected marker in the graph area.
Show Non-Harm Threshold
Shows or hides the non-harmonic threshold line.
xxx
SignalVu-PC Printable Help
305
Audio Analysis
306
Prefs Tab
SignalVu-PC Printable Help
GP Digital Modulation
Overview
Overview
The displays in General Purpose (GP) Digital Modulation (Displays > Measurements > GP Digital
Modulation) are:
Constellation
Demod I & Q vs Time
EVM vs Time
Eye Diagram
Frequency Deviation vs Time
Magnitude Error vs Time
Phase Error vs Time
Signal Quality
Symbol Table
Trellis Diagram
The General Purpose Digital Modulation Analysis (Option 21) provides vector signal analyzer
functionality. A wide variety of modulation types are supported, allowing you to view your signals in
Constellation, Eye and Trellis diagrams, measure the quality of the modulation, display time-domain
waveforms for demodulated I & Q signals, EVM, Phase Error, Magnitude Error, and more.
Modulation Measurements
NOTE. A maximum of approximately 80,000 samples can be analyzed by the General Purpose Digital
Modulation measurements (the actual value varies with modulation type).
SignalVu-PC Printable Help
307
GP Digital Modulation
Constellation Display
Measurement
Description
EVM
The normalized RMS value of the error vector between the measured signal and the ideal
reference signal over the analysis length. The EVM is generally measured on symbol or
chip instants and can be reported in units of percent or dB. EVM is usually measured after
best-fit estimates of the frequency error and a fixed phase offset have been removed.
Phase Error
The RMS phase difference between the measured signal and the ideal reference signal.
Magnitude Error
The RMS magnitude difference between the measured signal and the ideal reference
signal.
IQ Origin Offset
The magnitude of the DC offset of the signal measured at the symbol times. It indicates
the magnitude of the carrier feed-through signal.
Gain Imbalance
The gain difference between the I and Q channels in the signal generation path.
Constellations with gain imbalance show a pattern with a width that is different from
height.
Rho ρ
The normalized correlated power of the measured signal and the ideal reference signal.
Like EVM, Rho is a measure of modulation quality. The value of Rho is less than 1 in all
practical cases and is equal to 1 for a perfect signal measured in a perfect receiver.
Frequency Error
The frequency difference between the measured carrier frequency of the signal and the
user-selected center frequency of the analyzer.
Quadrature Error
The orthogonal error between the I and Q channels. The error shows the phase
difference between I and Q channels away from the ideal 90 degrees expected from the
perfect I/Q modulation. Constellations with quadrature error will show some leakage of
I into Q and vice versa.
xxx
Constellation Display
The Constellation Display shows a digitally-modulated signal in constellation form.
To show the Constellation Display:
1. Recall an appropriate acquisition data file.
2. Select the Displays button or select Setup > Displays. This shows the Select Displays dialog box.
3. From the Measurements box, select GP Digital Modulation.
4. Double-click the Constellation icon in the Available Displays box. This adds the Constellation icon
to the Selected displays box.
5. Click the OK button. This shows the Constellation display.
6. Press the Replay button to take measurements on the recalled acquisition data file.
308
SignalVu-PC Printable Help
GP Digital Modulation
Constellation Settings
Elements of the Constellation Display
Item
Display element
Description
1
Check mark indicator
The check mark indicator in the upper, left-hand corner of the display shows
when the Constellation display is the optimized display.
NOTE. When Best for multiple windows is selected in the Amplitude control
panel's RF & IF Optimization control, none of the measurement displays
shows a checkmark, as there is not a single optimized measurement.
2
Marker Readout
Located to the left of the constellation plot or below it, depending on the size of
the window. If markers are enabled, the marker readout shows the time, mag,
phase, symbol marker and symbol value of the point with the selected marker.
3
EVM Readouts
The EVM readouts are located below the Constellation plot. The readout
shows EVM Peak (%) and location, RMS (%).
4
Plot
Constellation graph.
xxx
Changing Constellation Settings (see page 309)
Constellation Settings
Menu Bar: Setup > Settings
Application Toolbar:
The settings for the Constellation view are shown in the following table.
SignalVu-PC Printable Help
309
GP Digital Modulation
Demod I & Q vs Time Display
NOTE. You might be able to save time configuring the Constellation display by pressing the Standard
Settings button from the Settings control panel. This allows you to select a preset optimized for a standard
from the Select Standard dialog box. See Standard Settings Button. (see page 334)
Settings tab
Description
Modulation Params (see
page 335)
Specifies the type of modulation, symbol rate, and filters to be used in demodulating
the input signal.
Freq & BW (see page 339)
Sets values for frequency error/offset, measurement bandwidth, and frequency deviation
(not every control is present for every modulation type).
Equalizer Tab (see page 340)
Enable the Equalizer and adjust its parameters.
Advanced Params (see
page 342)
Specifies additional parameters that are less frequently used.
Find (see page 346)
Used to set parameters for finding a burst within the data record and for entering a
Synch word.
Analysis Time (see page 346)
Contains parameters that define the portion of the acquisition record that is used for
analysis. Also allows you to specify the Units (Seconds or Symbols) for the GP Digital
Modulation displays.
Trace (see page 348)
Allows you to set the trace display characteristics.
Prefs (see page 350)
Enables you to set characteristics of the measurement display.
xxx
Demod I & Q vs Time Display
The Demod I & Q vs Time displays demodulated I and Q vs. Time. You can choose to display I only,
Q only, or both.
Elements of the Display
To show the Demod I & Q vs Time display:
1. Recall an appropriate acquisition data file.
2. Select the Displays button or select Setup > Displays. This shows the Select Displays dialog box.
3. From the Measurements box, select GP Digital Modulation.
4. Double-click the Demod I&Q vs Time icon in the Available Displays box. This adds the Demod
I&Q vs Time icon to the Selected displays box.
5. Click the OK button. This shows the Demod I&Q vs Time display.
6. Press the Replay button to take measurements on the recalled acquisition data file.
310
SignalVu-PC Printable Help
GP Digital Modulation
Demod I & Q vs Time Display
Item
Element
Description
1
Check mark indicator
The check mark indicator in the upper, left-hand corner of the display shows
when the Demod I & Q vs Time display is the optimized display.
NOTE. When Best for multiple windows is selected in the Amplitude control
panel's RF & IF Optimization control, none of the measurement displays
shows a checkmark, as there is not a single optimized measurement.
2
Top of Graph
Sets the I and Q amplitude value indicated at the top of the graph. Changing
the top value affects the bottom of graph readout. Also, note that the top of
graph setting interacts with the internal vertical scale setting (which is not
user settable) such that the range between the top and bottom of the graph
increases or decreases automatically.
3
Position
Specifies the I and Q amplitude value shown at the center of the graph display.
4
Bottom Readout
Displays the I and Q amplitude value shown at the bottom of graph.
5
Autoscale
Adjusts the vertical and horizontal settings to provide the best display.
6
Position
Specifies the horizontal position of the trace on the graph display.
7
Scale
Adjusts the span of the graph. By decreasing the scale (time per division), the
graph essentially becomes a window that you can move over the acquisition
record by adjusting the offset.
8
Freq Error
This readout can show Freq Error or Freq Offset. When it displays Freq
Error, it shows the difference between the instrument Frequency setting and
the measured value of the signal's carrier frequency. When it displays Freq
Offset, it shows the frequency offset specified on the Settings > Freq & BW
(see page 339) tab. If Freq Error is displayed, it also indicates that the Carrier
frequency detection setting is Auto. If Freq Offset is displayed, it indicates
that the Carrier frequency detection setting is manual.
xxx
SignalVu-PC Printable Help
311
GP Digital Modulation
Demod I & Q vs Time Settings
Changing Demod I&Q Settings. (see page 312)
Demod I & Q vs Time Settings
Menu Bar: Setup > Settings
Application Toolbar:
The settings for the Demod I & Q vs Time display are shown in the following table.
NOTE. You might be able to save time configuring the Demod I & Q display by pressing the Standard
Settings button from the Settings control panel. This allows you to select a preset optimized for a standard
from the Select Standard dialog box. See Standard Settings Button. (see page 334)
Settings tab
Description
Modulation Params (see
page 335)
Specifies the type of modulation used for the input signal and other parameters.
Freq & BW (see page 339)
Specifies settings for frequency error, measurement BW and Frequency Deviation. Each
of these settings is set internally when set to Auto. Alternatively, you can specify values
appropriate for specific measurement needs.
Equalizer Tab (see page 340)
Enable the Equalizer and adjust its parameters.
Advanced Params (see
page 342)
Specifies additional parameters.
Find (see page 346)
Used to set parameters for finding a burst within the data record and for entering a
Synch word.
Analysis Time (see page 346)
Contains parameters that define the portion of the acquisition record that is used for
analysis. Also allows you to specify the Units (Seconds or Symbols) for the GP Digital
Modulation displays.
Trace (see page 348)
Allows you to set the trace display characteristics.
Scale (see page 350)
Specifies the horizontal and vertical scale settings.
Prefs (see page 350)
Enables you to set characteristics of the measurement display.
xxx
EVM vs Time Display
The EVM vs. Time Display shows the Error Vector Magnitude plotted over Time.
NOTE. A maximum of approximately 80,000 samples can be analyzed by the General Purpose Digital
Modulation measurements (the actual value varies with modulation type).
To show an EVM vs. Time display:
312
SignalVu-PC Printable Help
GP Digital Modulation
EVM vs Time Settings
1. Recall an appropriate acquisition data file.
2. Press the Displays button or select Setup > Displays. This shows the Select Displays dialog box.
3. From the Measurements box, select GP Digital Modulation.
4. Double-click the EVM vs. Time icon in the Available Displays box. This adds the EVM vs. Time
icon to the Selected displays box.
5. Click the OK button. This displays the EVM vs. Time view.
6. Press the Replay button to take measurements on the recalled acquisition data file.
Elements of the EVM vs Time Display
Item
Display element
Description
1
Top of graph adjustment
Use the knob to adjust the vertical scale.
2
Position
Adjusts the vertical position.
3
Autoscale
Adjusts the Horizontal and Vertical scale to show the entire trace.
4
Peak and RMS value readout
Shows the maximum result, the time it occurred, and the RMS of the result
over the entire analysis length.
5
Scale
Sets the length of time shown in the graph.
xxx
Changing the EVM vs Time Display Settings (see page 313)
EVM vs Time Settings
Menu Bar: Setup > Settings
Application Toolbar:
SignalVu-PC Printable Help
313
GP Digital Modulation
Eye Diagram Display
The settings for the EVM vs. Time display are shown in the following table.
NOTE. You might be able to save time configuring the EVM vs. Time display by pressing the Standard
Settings button from the Settings control panel. This allows you to select a preset optimized for a standard
from the Select Standard dialog box. See Standard Settings Button. (see page 334)
Settings tab
Description
Modulation Params (see
page 335)
Specifies the type of modulation used in the input signal and other parameters that
controls the demodulation of the input signal.
Freq & BW (see page 339)
Specifies settings for frequency error, measurement BW and Frequency Deviation. Each
of these settings is set internally when set to Auto. Alternatively, you can specify values
appropriate for specific measurement needs.
Equalizer Tab (see page 340)
Enable the Equalizer and adjust its parameters.
Advanced Params (see
page 342)
Specifies Freq Offset, Magnitude normalization parameters, and enables swapping
I and Q.
Find (see page 346)
The Find tab is used to set parameters for finding bursts within the data record.
Analysis Time (see page 346)
The Analysis Time tab contains parameters that define how the signal is analyzed in the
general purpose digital modulation displays.
Trace (see page 348)
Specifies the display characteristics of the displayed trace.
Scale (see page 350)
Specifies the horizontal and vertical scale settings.
Prefs (see page 350)
Specifies whether certain display elements are visible.
xxx
Eye Diagram Display
The Eye Diagram Display shows a digitally modulated signal overlapped on itself to reveal variations in
the signal.
To show an Eye Diagram display:
1. Recall an appropriate acquisition data file.
2. Press the Displays button or select Setup > Displays. This shows the Select Displays dialog box.
3. From the Measurements box, select GP Digital Modulation.
4. Double-click the Eye Diagram icon in the Available Displays box. This adds the Eye Diagram icon
to the Selected displays box.
5. Click the OK button. This displays the Eye Diagram view.
6. Press the Replay button to take measurements on the recalled acquisition data file.
314
SignalVu-PC Printable Help
GP Digital Modulation
Eye Diagram Display
Elements of the Display
Item
Element
Description
1
Check mark indicator
The check mark indicator in the upper, left-hand corner of the display shows
when the Frequency Deviation vs Time display is the optimized display.
NOTE. When Best for multiple windows is selected in the Amplitude control
panel's RF & IF Optimization control, none of the measurement displays
shows a checkmark, as there is not a single optimized measurement.
2
Top of Graph
The vertical scale is normalized with no units (except for nFSK and C4FM
modulation types where the vertical units are Hz).
3
Position
Specifies the value shown at the center of the graph display.
4
Bottom Readout
Displays the value indicated by the bottom of graph.
5
Autoscale
Adjusts the vertical and horizontal settings to provide the best display.
6
Position
Displays the horizontal position of the trace on the graph display.
7
Scale
Adjusts the span of the graph in symbols.
8
Freq Error
Displays the difference between the maximum and minimum measured
values of the signal frequency during the Measurement Time. The displayed
frequency error is followed by either Auto or Manual. This indicates the
selected carrier frequency detection method (see Settings > Freq & BW).
xxx
SignalVu-PC Printable Help
315
GP Digital Modulation
Eye Diagram Settings
Changing Eye Diagram Settings (see page 316)
Eye Diagram Settings
Menu Bar: Setup > Settings
Application Toolbar:
The settings for the Eye Diagram display are shown in the following table.
NOTE. You might be able to save time configuring the Eye Diagram display by pressing the Standard
Settings button from the Settings control panel. This allows you to select a preset optimized for a standard
from the Select Standard dialog box. See Standard Settings Button. (see page 334)
Settings tab
Description
Modulation Params (see
page 335)
Specifies the type of modulation used for the input signal and other parameters.
Freq & BW (see page 339)
Specifies settings for frequency error, measurement BW and Frequency Deviation. Each
of these settings is set internally when set to Auto. Alternatively, you can specify values
appropriate for specific measurement needs.
Advanced Params (see
page 342)
Specifies additional parameters.
Find (see page 346)
Used to set parameters for finding a burst within the data record and for entering a
Synch word.
Analysis Time (see page 346)
Contains parameters that define the portion of the acquisition record that is used for
analysis. Also allows you to specify the Units (Seconds or Symbols) for the GP Digital
Modulation displays.
Trace (see page 348)
Allows you to set the trace display characteristics.
Scale (see page 350)
Specifies the horizontal and vertical scale settings.
Prefs (see page 350)
Enables you to set characteristics of the measurement display.
xxx
Frequency Deviation vs Time Display
To show a Frequency Deviation vs Time display:
1. Recall an appropriate acquisition data file.
2. Press the Displays button or select Setup > Displays. This shows the Select Displays dialog box.
3. From the Measurements box, select Frequency Deviation vs Time.
4. Double-click the Frequency Deviation vs Time icon in the Available Displays box. This adds the
Frequency Deviation vs Time icon to the Selected displays box.
316
SignalVu-PC Printable Help
GP Digital Modulation
Frequency Deviation vs Time Display
5. Click the OK button. This displays the Frequency Deviation vs Time view.
6. Press the Replay button to take measurements on the recalled acquisition data file.
Elements of the Display
SignalVu-PC Printable Help
317
GP Digital Modulation
Frequency Deviation vs Time Settings
Item
Element
Description
1
Check mark indicator
The check mark indicator in the upper, left-hand corner of the display shows
when the Frequency Deviation vs Time display is the optimized display.
NOTE. When Best for multiple windows is selected in the Amplitude control
panel's RF & IF Optimization control, none of the measurement displays
shows a checkmark, as there is not a single optimized measurement.
2
Top of Graph
Sets the frequency deviation value indicated at the top of the graph. Changing
the top value affects the bottom of graph readout. Also, note that the top of
graph setting interacts with the internal vertical scale setting (which is not
user settable) such that the range between the top and bottom of the graph
increases or decreases automatically.
3
Position
Specifies the frequency deviation value shown at the center of the graph
display.
4
Bottom Readout
Displays the value of the frequency deviation value shown at the bottom
of graph.
5
Autoscale
Adjusts the vertical and horizontal settings to provide the best display.
6
Position
Specifies the horizontal position of the trace on the graph display.
7
Scale
Adjusts the span of the graph. By decreasing the scale (time per division), the
graph essentially becomes a window that you can move over the acquisition
record by adjusting the offset.
8
Freq Error
Displays the difference between the maximum and minimum measured
values of the signal frequency during the Measurement Time. The displayed
frequency error is followed by either Auto or Manual. This indicates the
selected carrier frequency detection method (see Settings > Freq & BW).
xxx
Changing Frequency Deviation vs Time Settings (see page 318)
Frequency Deviation vs Time Settings
Menu Bar: Setup > Settings
Application Toolbar:
The Setup settings for Frequency Deviation vs. Time are shown in the following table.
NOTE. You might be able to save time configuring the Frequency vs. Time display by pressing the Standard
Settings button from the Settings control panel. This allows you to select a preset optimized for a standard
from the Select Standard dialog box. See Standard Settings Button. (see page 334)
318
SignalVu-PC Printable Help
GP Digital Modulation
Magnitude Error vs Time Display
Settings tab
Description
Modulation Params (see
page 335)
Specifies the type of modulation used for the input signal and other parameters.
Freq & BW (see page 339)
Specifies settings for frequency error, measurement BW and Frequency Deviation. Each
of these settings is set internally when set to Auto. Alternatively, you can specify values
appropriate for specific measurement needs.
Equalizer Tab (see page 340)
Enable the Equalizer and adjust its parameters.
Advanced Params (see
page 342)
Specifies additional parameters.
Find (see page 346)
Used to set parameters for finding a burst within the data record and for entering a
Synch word.
Analysis Time (see page 346)
Contains parameters that define the portion of the acquisition record that is used for
analysis. Also allows you to specify the Units (Seconds or Symbols) for the GP Digital
Modulation displays.
Trace (see page 348)
Allows you to set the trace display characteristics.
Scale (see page 350)
Specifies the horizontal and vertical scale settings.
Prefs (see page 350)
Enables you to set characteristics of the measurement display.
xxx
Magnitude Error vs Time Display
The Magnitude Error displays the magnitude of the symbol error. The amplitude appears on the vertical
axis while time is plotted along the horizontal axis.
NOTE. A maximum of approximately 80,000 samples can be analyzed by the General Purpose Digital
Modulation measurements (the actual value varies with modulation type).
To display Magnitude Error vs. Time:
1. Recall an appropriate acquisition data file.
2. Select the Displays button or Setup > Displays. This displays the Select Displays dialog box.
3. Select GP Digital Modulation in the Measurements box.
4. Double-click the Mag Error vs. Time icon or select the icon and click Add. The icon will appear in
the Selected displays box and will no longer appear under Available displays.
5. Click OK.
6. Press the Replay button to take measurements on the recalled acquisition data file.
SignalVu-PC Printable Help
319
GP Digital Modulation
Magnitude Error vs Time Settings
Elements of the Display
Item
Display element
Description
1
Top of graph adjustment
Use the knob to adjust the value of the vertical scale.
2
Position
Adjusts the level shown at the bottom of the display.
3
Autoscale button
Adjusts the vertical and horizontal settings to provide the best display.
4
Horizontal Position
Adjusts the horizontal position of the signal. Units can be either Symbols or
Seconds (Settings > Analysis Time tab > Units).
5
Peak and RMS value readout
Displays the Peak value of the magnitude error, the RMS value of the
magnitude error, and the time at which it occurs within the acquisition. Units
can be either Symbols or Seconds (Settings > Analysis Time tab > Units).
6
Horizontal Scale
Sets the time spanned by the graph. Units can be either Symbols or Seconds
(Settings > Analysis Time tab > Units).
7
Freq Error
Freq Error is the difference between the Center Frequency and the measured
frequency of the signal being tested. This readout will be Freq Offset if the
Freq Offset parameter on the Settings > Advanced Params (see page 342)
tab is set to Manual.
xxx
Changing Magnitude Error vs Time Display Settings (see page 320)
Magnitude Error vs Time Settings
Menu Bar: Setup > Settings
Application Toolbar:
320
SignalVu-PC Printable Help
GP Digital Modulation
Phase Error vs Time Display
The Setup settings for Magnitude Errors vs. Time are shown in the following table.
NOTE. You might be able to save time configuring the Magnitude vs. Time display by pressing the Standard
Settings button from the Settings control panel. This allows you to select a preset optimized for a standard
from the Select Standard dialog box. See Standard Settings Button. (see page 334)
Settings tab
Description
Modulation Params (see
page 335)
Specifies the type of modulation used for the input signal and other parameters.
Freq & BW (see page 339)
Specifies settings for frequency error, measurement BW and Frequency Deviation. Each
of these settings is set internally when set to Auto. Alternatively, you can specify values
appropriate for specific measurement needs.
Equalizer Tab (see page 340)
Enable the Equalizer and adjust its parameters.
Advanced Params (see
page 342)
Specifies additional parameters.
Find (see page 346)
Used to set parameters for finding a burst within the data record and for entering a
Synch word.
Analysis Time (see page 346)
Contains parameters that define the portion of the acquisition record that is used for
analysis. Also allows you to specify the Units (Seconds or Symbols) for the GP Digital
Modulation displays.
Trace (see page 348)
Allows you to set the trace display characteristics.
Scale (see page 350)
Specifies the horizontal and vertical scale settings.
Prefs (see page 350)
Enables you to set characteristics of the measurement display.
xxx
Phase Error vs Time Display
The Phase Error vs. Time display shows the phase angle of the symbol error over time. The phase is
plotted along the vertical axis while time is plotted along the horizontal axis.
NOTE. A maximum of approximately 80,000 samples can be analyzed by the General Purpose Digital
Modulation measurements (the actual value varies with modulation type).
To show the Phase Error display:
1. Recall an appropriate acquisition data file.
2. Press the Displays button or select Setup > Displays.
3. In the Select Displays dialog, select GP Digital Modulation in the Measurements box.
4. In the Available displays box, double-click the Phase Error icon or select the icon and click Add.
The Phase Error icon will appear in the Selected displays box and will no longer appear under
Available displays.
SignalVu-PC Printable Help
321
GP Digital Modulation
Phase Error vs. Time Settings
5. Click OK to display the Phase Error.
6. Press the Replay button to take measurements on the recalled acquisition data file.
Elements of the Phase Error vs Time Display
Item
Display element
Description
1
Freq Error
Freq Error is the difference between the Center Frequency and the measured
frequency of the signal being tested. This readout will be Freq Offset if the
Freq Offset parameter on the Settings > Advanced Params (see page 342)
tab is set to Manual.
2
Top of graph adjustment
Adjusts the phase angle shown at the top of the graph.
3
Position
Adjusts the vertical offset.
4
Autoscale
Adjusts the vertical and horizontal settings so that the entire trace fits in the
graph.
5
Offset
Adjusts the horizontal offset.
6
Peak and RMS readouts
Displays the Peak value of the phase error and the time at which it occurred.
Also displays the RMS value over the analysis length.
7
Scale
Sets the time spanned by the graph.
xxx
Changing the Phase Error vs Time Display Settings (see page 322)
Phase Error vs. Time Settings
Menu Bar: Setup > Settings
Application Toolbar:
322
SignalVu-PC Printable Help
GP Digital Modulation
Signal Quality Display
The settings for the Phase Error vs. Time display are shown in the following table.
NOTE. You might be able to save time configuring the Phase Error vs. Time display by pressing the
Standard Settings button from the Settings control panel. This allows you to select a preset optimized for a
standard from the Select Standard dialog box. See Standard Settings Button. (see page 334)
Settings tab
Description
Modulation Params (see
page 335)
Specifies the type of modulation used for the input signal and other parameters.
Freq & BW (see page 339)
Specifies settings for frequency error, measurement BW and Frequency Deviation. Each
of these settings is set internally when set to Auto. Alternatively, you can specify values
appropriate for specific measurement needs.
Equalizer Tab (see page 340)
Enable the Equalizer and adjust its parameters.
Advanced Params (see
page 342)
Specifies additional parameters.
Find (see page 346)
Used to set parameters for finding a burst within the data record and for entering a
Synch word.
Analysis Time (see page 346)
Contains parameters that define the portion of the acquisition record that is used for
analysis. Also allows you to specify the Units (Seconds or Symbols) for the GP Digital
Modulation displays.
Trace (see page 348)
Allows you to set the trace display characteristics.
Scale (see page 350)
Specifies the horizontal and vertical scale settings.
Prefs (see page 350)
Enables you to set characteristics of the measurement display.
xxx
Signal Quality Display
The Signal Quality display shows several measurements of signal quality. The measurements displayed
depend on the modulation type. There is a set of measurements displayed for all modulation types except
nFSK and C4FM. There is a second set of measurements displayed for nFSK and C4FM modulation types.
SignalVu-PC Printable Help
323
GP Digital Modulation
Signal Quality Display
Signal Quality display for all modulation types except nFSK, C4FM, OQPSK, and SOQPSK
Signal Quality display for OQPSK and SOQPSK modulation types
324
SignalVu-PC Printable Help
GP Digital Modulation
Signal Quality Display
Signal Quality display for nFSK modulation type
Signal Quality display for C4FM modulation type
SignalVu-PC Printable Help
325
GP Digital Modulation
Signal Quality Display
Elements of the Display
Measurements for all modulation types except nFSK, C4FM, OQPSK and SOQPSK
Measurement
Description
EVM
The normalized RMS value of the error vector between the measured signal and the ideal
reference signal over the analysis length. The EVM is generally measured on symbol or
chip instants and is reported in units of percent and dB. EVM is usually measured after
best-fit estimates of the frequency error and a fixed phase offset have been removed.
These estimates are made over the analysis length. Displays RMS and Peak values with
location of Peak value.
Phase Error
The RMS phase difference between the measured signal and the ideal reference signal.
Displays RMS and Peak values with location of Peak value.
Mag Error
The RMS magnitude difference between the measured signal and the reference signal
magnitude. Displays RMS and Peak values with location of Peak value.
MER (RMS)
The MER is defined as the ratio of I/Q signal power to I/Q noise power; the result is
indicated in dB.
IQ Origin Offset
The magnitude of the DC offset of the signal measured at the symbol times. It indicates
the magnitude of the carrier feed-through signal.
Frequency Error
The frequency difference between the measured carrier frequency of the signal and the
user-selected center frequency of the instrument.
Gain Imbalance
The gain difference between the I and Q channels in the signal generation path.
Constellations with gain imbalance show a pattern with a width that is different form
height.
Quadrature Error
The orthogonal error between the I and Q channels. The error shows the phase
difference between I and Q channels away from the ideal 90 degrees expected from the
perfect I/Q modulation. Not valid for BPSK modulation type.
Rho
The normalized correlated power of the measured signal and the ideal reference signal.
Like EVM, Rho is a measure of modulation quality. The value of Rho is less than 1 in all
practical cases and is equal to 1 for a perfect signal measured in a perfect receiver.
xxx
326
SignalVu-PC Printable Help
GP Digital Modulation
Signal Quality Display
Measurements for OQPSK and SOQPSK modulation types
Measurement
Description
EVM
The normalized RMS value of the error vector between the measured signal and the ideal
reference signal over the analysis length. The EVM is generally measured on symbol or
chip instants and is reported in units of percent and dB. EVM is usually measured after
best-fit estimates of the frequency error and a fixed phase offset have been removed.
These estimates are made over the analysis length. Displays RMS and Peak values with
location of Peak value.
Offset EVM
Offset EVM is like EVM except for a difference in the time alignment of the I and Q
samples. For EVM, I and Q samples are collected at the same time, for every symbol
decision point (twice the symbol rate for offset modulations). For Offset EVM, the I and Q
symbol decision points are time-aligned before collecting the I and Q samples. In this
case, one I and one Q sample is collected for each symbol (half as many samples as the
same number of symbols for (non-offset) EVM.
Phase Error
The RMS phase difference between the measured signal and the ideal reference signal.
Displays RMS and Peak values with location of Peak value.
Mag Error
The RMS magnitude difference between the measured signal and the reference signal
magnitude. Displays RMS and Peak values with location of Peak value.
MER (RMS)
The MER is defined as the ratio of I/Q signal power to I/Q noise power; the result is
indicated in dB.
IQ Origin Offset
The magnitude of the DC offset of the signal measured at the symbol times. It indicates
the magnitude of the carrier feed-through signal.
Frequency Error
The frequency difference between the measured carrier frequency of the signal and the
user-selected center frequency of the instrument.
Gain Imbalance
The gain difference between the I and Q channels in the signal generation path.
Constellations with gain imbalance show a pattern with a width that is different form
height.
Quadrature Error
The orthogonal error between the I and Q channels. The error shows the phase
difference between I and Q channels away from the ideal 90 degrees expected from the
perfect I/Q modulation. Not valid for BPSK modulation type.
Rho
The normalized correlated power of the measured signal and the ideal reference signal.
Like EVM, Rho is a measure of modulation quality. The value of Rho is less than 1 in all
practical cases and is equal to 1 for a perfect signal measured in a perfect receiver.
xxx
SignalVu-PC Printable Help
327
GP Digital Modulation
Signal Quality Settings
Measurements for nFSK modulation types
Measurement
Description
Peak FSK err
Peak value of the frequency deviation error at the symbol point.
RMS FSK Err
RMS value of the frequency deviation error at the symbol point.
Peak Mag Err
The Peak magnitude difference between the measured signal and the reference signal
magnitude.
RMS Mag Err
The RMS magnitude difference between the measured signal and the reference signal
magnitude.
Freq Error
The frequency difference between the measured carrier frequency of the signal and the
user-selected center frequency of the instrument.
Freq Deviation
Frequency distance from the center frequency at the symbol point.
Symbol Rate Error
This compares the user-entered symbol rate to the instrument calculated symbol rate of
the analyzed signal.
Symbol Rate
When in Auto-symbol rate, the instrument calculates the symbol rate of the signal and
the instrument calculates the error between the user entered value and the instrument
calculated value.
xxx
Measurements for C4FM modulation type
Measurement
Description
RMS Error Magnitude
RMS value of the frequency deviation error at the symbol point.
Carrier Frequency Error
Frequency difference between averaged signal frequency and the center frequency.
Deviation
Frequency distance from the center frequency at the symbol point.
Length
Number of symbols in the analysis area.
xxx
Changing the Signal Quality Display Settings (see page 328)
Signal Quality Settings
Menu Bar: Setup > Settings
Application Toolbar:
The Setup settings for Signal Quality are accessible only when the Signal Quality display is selected.
NOTE. You might be able to save time configuring the Signal Quality display by pressing the Standard
Settings button from the Settings control panel. This allows you to select a preset optimized for a standard
from the Select Standard dialog box. See Standard Settings Button. (see page 334)
328
SignalVu-PC Printable Help
GP Digital Modulation
Symbol Table Display
Settings tab
Description
Modulation Params (see
page 335)
The Modulation tab specifies the type of modulation used for the input signal and other
parameters.
Freq & BW (see page 339)
Specifies settings for frequency error, measurement BW and Frequency Deviation. Each
of these settings is set internally when set to Auto. Alternatively, you can specify values
appropriate for specific measurement needs.
Equalizer Tab (see page 340)
Enable the Equalizer and adjust its parameters.
Advanced Params (see
page 342)
The Advanced Params tab specifies frequency offset, magnitude normalization method
and allows you to swap the I and Q signals.
Find (see page 346)
Find tab is used to set parameters for finding bursts within the data record.
Analysis Time (see page 346)
The Analysis Time tab contains parameters that define the portion of the acquisition
record that is used for analysis.
Prefs (see page 350)
The Prefs tab enables you to set characteristics of the measurement display.
xxx
Symbol Table Display
The Symbol Table Display is like the Constellation Display except that a text table is used to display data
bits at a symbol rather than a graph. The Synch Word characters, if used, are in bold font.
To display the Symbol Table:
1. Recall an appropriate acquisition data file.
2. Select the Displays button or select Setup > Displays. This displays the Select Displays dialog box.
3. From the Measurements box, select GP Digital Modulation.
4. Double-click the Symbol Table icon in the Available Displays box. This adds the Symbol Table icon
to the Selected displays box.
5. Click the OK button. This displays the Symbol Table view.
6. Press the Replay button to take measurements on the recalled acquisition data file.
SignalVu-PC Printable Help
329
GP Digital Modulation
Symbol Table Settings
Using Markers
Markers are indicators in the display that you can position on a trace to measure values such as frequency,
power, and time. A Marker always displays its position and, if the Delta readout is enabled, will display
the difference between its position and that of the Marker Reference. Within the Symbol Table, colored
cells indicate the location of markers. The selected Marker is highlighted with a light green background.
All other markers are highlighted with a light gray background. In the Symbol Table, the marker readout
below the table shows the marker location in time, symbol numbers and symbol value.
Changing the Symbol Table Display Settings (see page 330)
Symbol Table Settings
Menu Bar: Setup > Settings
Application Toolbar:
The Setup settings for the Symbol Table view are shown in the following table.
NOTE. You might be able to save time configuring the Symbol Table display by pressing the Standard
Settings button from the Settings control panel. This allows you to select a preset optimized for a standard
from the Select Standard dialog box. See Standard Settings Button. (see page 334)
330
SignalVu-PC Printable Help
GP Digital Modulation
Trellis Diagram Display
Settings tab
Description
Modulation Params (see
page 335)
The Modulation tab specifies the type of modulation used for the input signal and other
parameters.
Freq & BW (see page 339)
Specifies settings for frequency error, measurement BW and Frequency Deviation. Each
of these settings is set internally when set to Auto. Alternatively, you can specify values
appropriate for specific measurement needs.
Equalizer Tab (see page 340)
Enable the Equalizer and adjust its parameters.
Advanced Params (see
page 342)
The Advanced Params tab specifies additional parameters.
Find (see page 346)
Find tab is used to set parameters for finding bursts within the data record.
Analysis Time (see page 346)
The Analysis Time tab contains parameters that define the portion of the acquisition
record that is used for analysis.
Prefs (see page 350)
The Prefs tab enables you to set characteristics of the measurement display.
xxx
Trellis Diagram Display
To show an Trellis Diagram display:
1. Recall an appropriate acquisition data file.
2. Press the Displays button or select Setup > Displays. This shows the Select Displays dialog box.
3. From the Measurements box, select GP Digital Modulation.
4. Double-click the Trellis Diagram icon in the Available Displays box. This adds the Trellis Diagram
icon to the Selected displays box.
5. Click the OK button. This displays the Trellis Diagram view.
6. Press the Replay button to take measurements on the recalled acquisition data file.
SignalVu-PC Printable Help
331
GP Digital Modulation
Trellis Diagram Display
Elements of the Display
Item
Element
Description
1
Check mark indicator
The check mark indicator in the upper, left-hand corner of the display shows
when the Frequency Deviation vs Time display is the optimized display.
NOTE. When Best for multiple windows is selected in the Amplitude control
panel's RF & IF Optimization control, none of the measurement displays
shows a checkmark, as there is not a single optimized measurement.
2
Top of Graph
Sets the phase value indicated at the top of the graph. Changing the top value
affects the bottom of graph readout. Also, note that the top of graph setting
interacts with the internal vertical scale setting (which is not user settable)
such that the range between the top and bottom of the graph increases or
decreases automatically.
3
Position
Specifies the phase value shown at the center of the graph display.
4
Bottom Readout
Displays the value of the phase value shown at the bottom of graph.
5
Autoscale
Adjusts the vertical and horizontal settings to provide the best display.
6
Position
Displays the horizontal position of the trace on the graph display.
7
Scale
Adjusts the span of the graph in symbols.
8
Freq Error
Displays the difference between the maximum and minimum measured
values of the signal frequency during the Measurement Time. The displayed
frequency error is followed by either Auto or Manual. This indicates the
selected carrier frequency detection method (see Settings > Freq & BW).
xxx
332
SignalVu-PC Printable Help
GP Digital Modulation
Trellis Diagram Settings
Changing the Trellis Diagram Settings (see page 333)
Trellis Diagram Settings
Menu Bar: Setup > Settings
Application Toolbar:
The settings for the Trellis Diagram display are shown in the following table.
NOTE. You might be able to save time configuring the Trellis Diagram display by pressing the Standard
Settings button from the Settings control panel. This allows you to select a preset optimized for a standard
from the Select Standard dialog box. See Standard Settings Button. (see page 334)
Settings tab
Description
Modulation Params (see
page 335)
Specifies the type of modulation used for the input signal and other parameters.
Freq & BW (see page 339)
Specifies settings for frequency error, measurement BW and Frequency Deviation. Each
of these settings is set internally when set to Auto. Alternatively, you can specify values
appropriate for specific measurement needs.
Equalizer Tab (see page 340)
Enable the Equalizer and adjust its parameters.
Advanced Params (see
page 342)
Specifies additional parameters.
Find (see page 346)
Used to set parameters for finding a burst within the data record and for entering a
Synch word.
Analysis Time (see page 346)
Contains parameters that define the portion of the acquisition record that is used for
analysis. Also allows you to specify the Units (Seconds or Symbols) for the GP Digital
Modulation displays.
Trace (see page 348)
Allows you to set the trace display characteristics.
Scale (see page 350)
Specifies the horizontal and vertical scale settings.
Prefs (see page 350)
Enables you to set characteristics of the measurement display.
xxx
GP Digital Modulation Shared Measurement Settings
The displays in the GP Digital Modulation folder (Setup > Displays) are each a different format for
presenting the results of a single underlying analysis. For this reason, all controls that affect the analysis
parameters are shared by all the displays in the GP Digital Modulation folder.
Changing a setting on one tab changes that setting for all the GP Digital Modulation displays. For
example, if you change the Modulation Type for the Constellation Display, it also changes the Modulation
type setting for the Signal Quality display. There are some controls that affect only the way an individual
display presents its results, such as graph scaling.
SignalVu-PC Printable Help
333
GP Digital Modulation
Standard Settings Button
Common controls for GP digital modulation displays
Settings tab
Description
Modulation Params (see
page 335)
Specifies the type of modulation, symbol rate, and filters to be used in demodulating
the input signal.
Freq & BW (see page 339)
Sets values for frequency error/offset, measurement bandwidth, and frequency deviation
(not every control is present for every modulation type).
Equalizer Tab (see page 340)
Enable the Equalizer and adjust its parameters.
Advanced Params (see
page 342)
Specifies additional parameters that are less frequently used.
Find (see page 346)
Used to set parameters for finding a burst within the data record and for entering a Synch
word.
Analysis Time (see page 346)
Contains parameters that define the portion of the acquisition record that is used for
analysis. Also allows you to specify the Units (Seconds or Symbols) for the GP Digital
Modulation displays.
Trace (see page 348)
Allows you to set the trace display characteristics.
Prefs (see page 350)
Enables you to set characteristics of the measurement display.
xxx
Standard Settings Button
On every GP Digital Modulation control panel there is a button labeled Standard Settings. This button is
used to recall settings optimized for analyzing the selected standard. See the following table for a list of
the standards for which standard settings are available. Choosing a standard from the dialog box changes
only settings for GP Digital Modulation displays.
All of the presets in the Standard Settings Dialog make the following settings:
Analysis Length: Auto
Points per Symbol: 4
Data Differential: No
Burst Mode: Off
Burst Detection Threshold: -10 dBc
334
SignalVu-PC Printable Help
GP Digital Modulation
Modulation Params Tab
Parameter values set by presets in the standard settings dialog
Standard
Modulation
Symbol
Rate
Meas.
Filter
Reference
Filter
Filter
Parameter
802.15.4
OQPSK
1e6
None
Half sine
NA
SBPSK-MIL
SBPSK
2.4e3
None
SBPSKMIL
NA
SOQPSK-MIL
SOQPSK
2.4e3
None
SOQPSKMIL
NA
CPM-MIL
CPM
19.2e3
None
None
NA
SOQPSK-ARTM Tier 1
SOQPSK
2.5e6
None
SOQPSKARTM
NA
Project25 Phase 1
C4FM
4.8e3
C4FM-P25
RC
0.2
CDMA2000–Base
QPSK
1.2288e6
IS-95 TXEQ_MEA
IS-95 REF
NA
W-CDMA
QPSK
3.84e6
RRC
RC
0.22
Other
1
1
xxx
1
Center Symbol Position, Half Shift Removed
Modulation Params Tab
Menu bar: Setup > Settings > Modulation Params
The Modulation Params tab specifies the type of modulation on the input signal and other parameters
that control the demodulation of the input signal.
Parameter
Description
Modulation type
Specifies the type of modulation on the input signal.
Symbol Rate
Specifies the symbol rate in Hertz.
Measurement Filter
Specifies the filter used for measurements.
Reference Filter
Specifies the filter used as a reference.
Filter Parameter
Enter a value used for defining the Reference Filter. (Not present for some filter types)
Modulation index
(Present only for CPM modulation type)
xxx
Modulation Type
The modulation types that can be demodulated and analyzed are:
SignalVu-PC Printable Help
335
GP Digital Modulation
Modulation Params Tab
Modulation type
Description
QPSK
Quadrature Phase Shift Keying
8PSK
8-Phase Shift Keying
D8PSK
Differential Eight Phase Shift Keying
D16PSK
Differential Sixteen Phase Shift Keying
PI/2DBPSK
Pi/2 Differential Binary Phase Shift Keying
DQPSK
Differential Quadrature Phase Shift Keying
PI/4DQPSK
Pi/4 Differential Quadrature Phase Shift Keying
BPSK
Binary Phase Shift Keying
OQPSK
Offset Quadrature Phase Shift Keying
16QAM
16-state Quadrature Amplitude Modulation
32QAM
32-state Quadrature Amplitude Modulation
64QAM
64-state Quadrature Amplitude Modulation
128QAM
128-state Quadrature Amplitude Modulation
256QAM
256-state Quadrature Amplitude Modulation
MSK
Minimum Shift Keying
2FSK
2-Frequency Shift Keying
4FSK
4-Frequency Shift Keying
8FSK
8-Frequency Shift Keying
16FSK
16-Frequency Shift Keying
CPM
Continuous Phase Modulation
SOQPSK
Shaped Offset Quadrature Phase Shift Keying
SBPSK
Shaped Binary Phase Shift Keying
C4FM
Constant Envelope 4-Level Frequency Modulation
xxx
Symbol Rate
Specifies the symbol rate for demodulating digitally modulated signals. The symbol rate and the bit rate
are related as follows:
(Symbol rate) = (Bit rate)/(Number of bits per symbol)
For example, the number of bits per symbol is 3 for 8PSK.
Measurement and Reference Filters
The available measurement and reference filters depend on the selected modulation type. If a particular
filter is not practical for a selected modulation type, it is not presented as an available filter. To determine
which filters are available, make certain that your desired modulation type is selected. See the following
table.
336
SignalVu-PC Printable Help
GP Digital Modulation
Modulation Params Tab
Modulation type
Measurement filters
Reference filters
BPSK
None
RootRaisedCosine
RaisedCosine
Gaussian
User
Rectangular (freq)
IS-95TX_MEA
IS-95TXEQ_MEA
None
RaisedCosine
Gaussian
User
Rectangular (freq)
IS-95REF
MSK
None
Root Raised Cosine
RaisedCosine
Gaussian
User
Rectangular (freq)
None
Gaussian
User
OQPSK
None
RootRaisedCosine
User
IS-95TX_MEA
IS-95TXEQ_MEA
None
Half sine
RaisedCosine
User
IS-95REF
HDQPSK
HDQPSK-P25
None
RaisedCosine
Gaussian
User
Rectangular (freq)
SOQPSK
None
User
SOQPSK-MIL
SOQPSK-ARTM
User
CPM
None
User
None
User
2FSK
None
Gaussian
RootRaisedCosine
RaisedCosine
Rectangular (freq)
User
None
Gaussian
RaisedCosine
User
PI/2DBPSK
8PSK
D8PSK
DQPSK
PI/4DQPSK
16QAM
32QAM
64QAM
128QAM
256QAM
QPSK
4FSK
8FSK
16FSK
SignalVu-PC Printable Help
337
GP Digital Modulation
Modulation Params Tab
Modulation type
Measurement filters
Reference filters
C4FM
C4FM-P25
RaisedCosine
User
SBPSK
None
User
SBPSK-MIL
User
xxx
The measurement filter is applied before the demodulation bit is detected and the ideal reference is
calculated.
The reference filter is applied to the internally generated ideal reference signal before the EVM is
calculated.
How to Select Filters
In a signal transmitter/receiver system, the baseband signal might be filtered for bandwidth limiting or for
another kind of necessary shaping that needs to be applied. Normally, a filter in the transmitter (Ft) and a
filter in the receiver (Fr) are applied.
The Measurement Filter setting in the analyzer corresponds to the baseband filter in the receiver (Fr): This
setting tells the analyzer what filter your receiver uses. When the analyzer is set to the same filter used by
the receiver, the analyzer sees the signal as your receiver would. The Measurement Filter setting should be
the same as the filter used in the receiver under normal operation (as opposed to testing).
The Reference Filter setting in the analyzer corresponds to the baseband filter in the transmitter-receiver
combination (Fr * Ft). The baseband filter for the transmitter-receiver combination is often referred to as
the System Filter. This filter is called the reference filter because it is used to recreate a reference signal
that is compared to the received signal. This recreated reference signal is the ideal signal with Fr * Ft
applied; differences between this ideal signal and the received signal enables the determination of signal
quality, such as EVM measurements.
The following is an example of a hypothetical signal that is transmitted into a vector signal analyzer
for analysis:
Assume that a signal is transmitted using a baseband filter (Ft). It then travels through a transmission
medium (air/cable/etc) where it may affected by the communication channel (Fc). The signal is received
and filtered by the receiver’s filter (Fr). At this point, the signal has passed through Ft and Fr, and in
addition, the communication channel might have affected it (so: Ft * Fr * Fc). This double-filtered
signal is demodulated as it was received to determine the symbols/bits in it. The obtained bits are used
to regenerate a baseband ideal signal that can be compared against the received signal to determine
signal quality. However, to determine the effect of the environment on the signal quality, the ideal
signal must be filtered by the REFERENCE FILTER (Ft * Fr), so that the ideal signal and the filtered
signal differ only by the effect of the environment. So, the received signal is the ideal signal filtered by
Ft * Fr * Fc and the reference signal is the ideal signal filtered by Ft * Fr, since they only differ
by the effect of Fc, the comparison will show the effect of the communication channel on the signal.
The communication channel can also include the hardware path the signal follows after (Tx) or before
(Rx) digitizing; this would account for Tx/Rx hardware linear and non-linear distortion.
Common examples of how these filters are used are shown below:
338
SignalVu-PC Printable Help
GP Digital Modulation
Freq & BW Tab
For Transmit Filter = Root Raised Cosine (RRC), Measurement Filter = RRC, the Reference Filter
= RRC ^2 = Raised Cosine
For Transmit Filter = Raised Cosine (RC), Measurement Filter = None, the Reference Filter = Raised
Cosine (When the Measurement Filter = None, the Reference Filter = Transmit Filter)
For Transmit Filter = Gaussian, Measurement Filter = None, the Reference Filter = Gaussian
Filter Parameter
The filter parameter specifies the alpha for the Root Raised Cosine or Raised Cosine filter, or the
bandwidth-time product (BT) for the Gaussian filter, when selected as the Reference filter. Some filter
types have a fixed parameter value that is specified by industry standard, while other filter types by
definition have no filter parameter. For filter types with no filter parameter, there is no filter parameter
control present in the control panel.
Freq & BW Tab
The Freq & BW tab specifies a group of settings that affect how measurements are made.
Freq & BW tab with nFSK or C4FM modulation type selected and Frequency Error readout enabled (Auto selected)
Freq & BW tab with SOQPSK modulation type selected and Frequency Offset enabled (Auto deselected)
SignalVu-PC Printable Help
339
GP Digital Modulation
Equalizer Tab
Setting
Description
Frequency Error / Frequency
Offset
When Auto is enabled, this readout displays frequency error and the measurement
is made at the calculated frequency. When Auto is disabled, this setting changes to
Frequency Offset. When set to Frequency Offset, this setting is used to demodulate a
signal that is not at the center frequency. The measurement is made at the user-entered
offset. The Measurement Filter (if any, specified on the Modulation Params tab) is applied
about the offset frequency whether set automatically or manually.
Measurement BW
This setting allows you to override the automatic bandwidth calculation and directly enter
a bandwidth value. If you enter a value for the measurement bandwidth, be aware that
the actual bandwidth of data provided to the measurement will be at least as wide as
the value you request and may be as much as two times wider than requested. This
override of the selected measurement bandwidth is done so that the instrument uses
sufficient bandwidth relative to the chosen symbol rate to ensure good signal quality
measurements.
Frequency Deviation
For nFSK modulation types, this setting specifies the frequency deviation. Select Auto to
make the instrument do this automatically. Deselect Auto to enter a value manually.
This setting is present for only nFSK and C4FM modulation types.
xxx
Equalizer Tab
The Equalizer tab enables you to apply an adaptive equalizer to a digitally modulated signal to compensate
for linear distortions in the signal. The Equalizer is available only for displays in the GP Digital
Modulation folder (Select Displays window). The analyzer implements a decision directed, feed-forward
FIR filter to correct linear distortion in the input signal.
340
SignalVu-PC Printable Help
GP Digital Modulation
Equalizer Tab
Parameter
Description
Enable Equalization
This setting turns the Equalizer on and off.
Reset Equalization
Initializes the equalizer filter for training.
Enable EQ Export
Exports a text file with equalizer taps in I/Q pairs.
Mode
Specifies whether the equalizer is in learning (Train) mode or analysis (Hold) mode.
Convergence
Specifies the update rate. Maximum value: 0.002. Default value: 0.0005
Taps/Symbol
The number of filter coefficients per symbol used by the filter. Available choices are
1, 2, 4, and 8.
Taps
The number of filter coefficients. Range: 3 to 100 (you can set a higher number, but
100 is the practical limit).
Length
Specifies the number of symbols analyzed (or filter length).
xxx
Selecting the Mode
When enabled, the Equalizer is in either Train mode or Hold mode. When the equalizer is in Train mode, it
will update internal filter parameters whenever you adjust the Convergence, Taps/Symbol, Taps, or Length
values. When it is in Hold mode, the Equalizer uses the parameter values (both internal and the values
accessible on the Equalizer tab) in effect when it was placed into Hold mode.
NOTE. The Equalizer does not need to be retrained if the modulation type is changed. You can train the
Equalizer by using a simpler modulation type (such as QPSK), place the Equalizer into Hold mode and
can then measure more complex modulation types such as QAM.
Training the Equalizer
To obtain the desired results using the Equalizer, you must first train the Equalizer. This is an iterative
process where you adjust some filter parameters (and the analyzer adjusts internal parameters) to achieve
the lowest error possible on the acquired signal.
To configure the Equalizer:
1. Press the Displays button or select Setup > Displays.
2. In the Select Displays window, select GP Digital Modulation from Measurements.
3. Add Signal Quality to the Selected Displays and select OK.
4. With the Signal Quality display selected, select Setup > Settings.
5. Select the Modulation Params tab set the parameters as necessary for the signal.
6. Select the Equalizer tab.
7. Set the Convergence value to 0.0005.
8. Set Taps/Symbol to 2.
9.
Click the Reset Equalization button to reset the equalizer.
10. Set the Mode to Train.
SignalVu-PC Printable Help
341
GP Digital Modulation
Advanced Params Tab
11. Click Enable Equalization so it is checked.
12. On the Signal Quality display, examine the value for EVM.
13. Change the Convergence, Taps/Symbol, and Taps values iteratively to achieve a minimum EVM value.
NOTE. Changing the Taps/symbol or Taps values resets the equalizer.
Using the Equalizer
To use the equalizer:
1. Select and configure a GP Digital Modulation display.
2. Select Setup > Settings.
3. Select the Equalizer tab.
4. Select Enable Equalization so it is checked.
5. Verify that Mode is set to Hold if you have previously trained the Equalizer. If you have not previously
trained the Equalizer, train the Equalizer (see page 341) and then set the Mode to Hold.
Exporting EQ Files
If the Enable EQ Export box is checked, the following outputs files are automatically generated to these
locations after each measurement update cycle if the EQ coefficients change: c:\temp\EqTaps.txt and
c:\temp\EqTapsHdr.txt. These files have EQ taps in I/Q pairs (one pair per row).
The Hdr version file has a five line header before the EQ tap data. Each line in the five line header of the
Hdr version file has two data values, with the second one always being "0":
<line1>Number_of_Header_Lines 0
<line2>EQ_Sample_Rate_Hz 0
<line3>Demod_Symbol_Rate_Sps 0
<line4>EQ_Samples_per_Symbol 0
<line5>Number_of_EQ_Taps_Following 0
Advanced Params Tab
The Advanced Params tab specifies additional parameters that control the demodulation of the signal.
342
SignalVu-PC Printable Help
GP Digital Modulation
Advanced Params Tab
Advanced Params tab for all modulation types except nFSK and C4FM
Advanced Params tab for modulation type nFSK
Advanced Params tab for modulation type C4FM
Parameter
Description
Mag Normalize
(not present for nFSK or C4FM
modulation types)
Select RMS Symbol Magnitude or Max Symbol Magnitude. This setting applies to Mag
Error and EVM.
Swap I and Q
When enabled, the I and Q data are exchanged before demodulating.
Symbol rate search
(Present only for nFSK
modulation types)
Determines whether to automatically detect or manually set the symbol rate. When
selected, automatically detects the symbol rate to perform analysis. The calculated
symbol rate is displayed in the Signal Quality display. The Symbol Rate Error is also
calculated and displayed when Symbol rate search is enabled.
User Symbol Map (per
Modulation Type)
Enables the use of custom symbol maps. This enables you to specify the location of
symbols in the display. This control can be set independently for each of the modulation
types.
xxx
Mag Normalize
Specifies whether Magnitude Normalization uses the RMS Symbol Magnitude or the Maximum Symbol
Magnitude as the basis for normalization. Use RMS Symbol Magnitude on QPSK modulations (equal
SignalVu-PC Printable Help
343
GP Digital Modulation
Advanced Params Tab
magnitude symbol locations), and use Maximum Symbol Magnitude for signals that have a large difference
in magnitude among the symbol locations (such as 128QAM). It prevents the instrument from using the
very low magnitude center symbols when normalizing the constellation. The outer symbols are a better
normalization reference than the center in this case.
Swap I and Q
Use the Swap I and Q control to correct a signal sourced by a downconverter that inverts the frequency
of the signal under test.
User Symbol Map
A User Symbol Map is a text file that specifies the location of symbols in the display. The symbol map
is unique for each modulation type. The easiest way to create a custom symbol map is to start with the
default symbol map and modify it. The default symbol map file is located at C:\SignalVu-PC Files.
The default symbol map file is named DefaultSymbolMaps.txt. See Symbol Maps (see page 351) for
illustrations of the default symbol mapping.
To specify a user symbol map:
1. Click the ... button.
2. Navigate to the directory containing the user symbol text file you want to use.
3. Select the desired file in the Open window and click Open.
4. Select User Symbol Map to enable the user symbol map.
Editing the User Symbol Map. The symbol map is a plain text file and can be edited with any plain text
editor.
CAUTION. Whenever you reinstall the program software, the existing DefaultSymbolMaps.txt file will be
overwritten. To create a custom symbol map, you should make a copy of the default symbol map file, edit
the copy to suit your needs, and save it with a new name. Guidance on how to edit the symbol map file
is contained within the default symbol map file.
The following excerpt from the default symbol map file explains the structure of the file and how to edit it.
## Symbol Mapping Definitions
## Version 1.2
##
##
##
##
##
##
##
##
##
344
This file defines the mapping of modulation states to symbol values.
File Format :
------------1. Comments begin with '##' and may appear after the last field in a line
2. A symbol map begins and ends with a line containing the name of the
modulation type. These names must exactly match the name of one of the
modulation types in the RSA software
3. Empty cells may be included to preserve the constellation shape.
SignalVu-PC Printable Help
GP Digital Modulation
##
##
##
##
##
##
##
Advanced Params Tab
4. Blank lines are ignored.
5. A modulation type which does not match the name of an existing
type will be ignored.
Usage :
------1. The file is intended to be edited with Notepad or similar text editor
The following text is an example of a symbol map.
## Symbol Map for 32 QAM
## (Resembles the shape of the constellation)
32QAM
00011 00010 00001 00000
01001 01000 00111 00110 00101 00100
01111 01110 01101 01100 01011 01010
10101 10100 10011 10010 10001 10000
11011 11010 11001 11000 10111 10110
11111 11110 11101 11100
32QAM
SignalVu-PC Printable Help
345
GP Digital Modulation
Find Tab
Find Tab
The Find tab is used to set parameters for finding bursts within the data record. This is a post-acquisition
operation. Synch Word search controls are also on this tab.
Setting
Description
Burst Detection: Mode
Select whether to analyze bursts
- Auto: If a burst is found, analyze just that burst period. If a burst is not found, analyze
the whole analysis length.
- On: If a burst is found, analyze just that burst period. If a burst is not found, display
an error message.
- Off: Analyze the whole analysis length.
If the signal isn't adequate for demodulation, an error message is shown.
Burst Detection: Threshold
Sets the level required for the signal to qualify as a burst. Enter a value in dBc down
from top of the signal.
Use Synch Word
When enabled, specifies the string of symbols to look for. Enter the search string with
external keyboard or the on-screen keyboard.
Clear
Blanks the search string field.
xxx
Analysis Time Tab
The Analysis Time tab contains parameters that define how the signal is analyzed in the general purpose
digital modulation displays.
The settings values on this tab are the same as those on the main Analysis control panel for the instrument
with the only difference being that Analysis Length can be set in either Seconds or Symbols in this location.
346
SignalVu-PC Printable Help
GP Digital Modulation
Analysis Time Tab
Setting
Description
Analysis Offset
Specifies the location of the first time sample to use in measurements.
Auto
When enabled, causes the instrument to set the Analysis Offset value based on the
requirements of the selected display.
Analysis Length
Specifies the length of the analysis period to use in measurements. Length is specified in
either seconds or symbols, depending on the Units setting. For most modulation types,
the Analysis Length set when Auto is enabled is 128 symbols. For some modulation
types, a longer length is used.
Auto
When enabled, causes the instrument to set the Analysis Length value based on the
requirements of the selected display.
Time Zero Reference
Specifies the zero point for the analysis time.
Actual
This is a displayed value, not a setting. It is the Analysis Length (time or symbols)
being used by the analyzer; this value may not match the Analysis Length requested
(in manual mode).
Units
Sets the units of the Analysis Length to either Symbols or Seconds.
xxx
Analysis Offset
Use analysis offset to specify where measurements begin. Be aware that you cannot set the Analysis
Offset outside the range of time covered by the current acquisition data. (all time values are relative
to the Time Zero Reference).
You can set the Analysis Length so that the requested analysis period falls partly or entirely outside the
current range of acquisition data settings. When the next acquisition is taken, its Acquisition Length will
be increased to cover the new Analysis Length, as long as the Sampling controls are set to Auto. If the
Sampling parameters are set to manual, or if the instrument is analyzing saved data, the actual analysis
length will be constrained by the available data length, but in most cases, measurements are able to be
made anyway. The instrument will display a notification when measurement results are computed from
less data than requested. Range: 0 to [(end of acquisition) - Analysis Length)]. Resolution: 1 effective
sample (or symbol).
Analysis Length
Use the analysis length to specify how long a period of time is analyzed by a measurement. As you adjust
this value, the actual amount of time for Analysis Length, in Symbol or Seconds units, is shown below the
control in the "Actual" readout. This setting is not available when Auto is checked. Range: minimum
value depends on modulation type. Resolution: 1 symbol. A maximum of approximately 80,000 samples
can be analyzed (the actual value varies with modulation type).
Time Zero Reference
All time values are measured from this point (such as marker position or horizontal position (in Y vs Time
displays). Choices are: Acquisition Start or Trigger.
SignalVu-PC Printable Help
347
GP Digital Modulation
Trace Tab
Parameter
Description
Acquisition Start
Offset is measured from the point at which acquisition begins.
Trigger
Offset is measured from the trigger point.
xxx
Trace Tab
Menu Bar: Setup > Settings > Trace
The Trace tab allows you to set the trace display characteristics of the selected display.
Example traces tab for constellation display set to SOQPSK modulation type
Note that some settings are not present for all modulation types and some settings are not present for
all displays.
Example trace tab for constellation display set to CPM modulation type
Example trace tab for Demod I&Q display
348
SignalVu-PC Printable Help
GP Digital Modulation
Trace Tab
Setting
Description
Trace
Selects the trace that is hidden or displayed based on whether or not Show is selected.
Show
Specifies whether the trace selected by Trace is displayed or hidden.
Freeze
Halts updates to the trace selected by the Trace setting. Present for the Constellation
display only.
Content
Selects whether to display the trace as vectors (points connected by lines), points
(symbols only without lines), or lines (lines drawn between symbols, but no symbols are
displayed). The choices available depend on the display.
Q Offset
For traces with offset modulation (OQPSK and SOQPSK), this setting enables the trace
to be displayed with Q offset or without Q offset. Choices available are Remove Q
offset, Include Q Offset, and Use Shared Pref. Selecting Use Shared Pref causes the
analyzer to add or remove Q offset according to the Remove Q Offset setting located on
the Prefs tab. Setting the Q Offset on the Traces tab changes the Q offset only for the
Constellation display. If other GP Digital Modulation displays are shown, they will use the
use the Remove Q Offset setting on the Prefs tab regardless of the Q Offset setting on
the traces tab for the Constellation display. The Q Offset setting is available only when
the modulation type is set to OQPSK or SOQPSK.
Points/symbol
Select how many points to use between symbols when connecting the dots. Values:
1, 2, 4, 8.
Symbol point location
Selects whether to evaluate the symbol value at the center or the end of the eye opening.
This control is only present for some of the supported modulation types.
Phase Multiplier
Sets the multiplication constant for the phase multiplication display: ×1 (default), ×2, ×4,
×8, ×16, or ×32. The phase multiplication display facilitates observation of noisy CPM
signals by multiplying measurement signal phase by the constant to reduce the number
of phase states and expand the phase difference between adjacent symbols.
xxx
Comparing Two Traces in the Constellation Display
When the Constellation display is the selected display, you can use the Traces tab to enable the display
of a second trace. The second trace is a version of the current acquisition. You can choose to freeze a
trace in order to display the current live trace to an earlier version of itself, you can display the trace
as a second trace with or without Q Offset, or you can choose to display both traces frozen in order
to compare the trace to itself at different times.
To display a second trace in the Constellation display:
1. If more than one display is present, select the Constellation display to ensure it is the selected display.
2. Click the settings icon or select Setup > Settings from the menu bar.
3. Select the Traces tab.
4. Select Trace 2 from the Trace drop-down list.
5. Click the Show checkbox so that it is checked.
6. Specify the Content as desired. Trace 2 lines appear in blue to aid in distinguishing Trace 2 from
Trace 1.
SignalVu-PC Printable Help
349
GP Digital Modulation
Scale Tab
Scale Tab
The Scale tab allows you to change the vertical and horizontal scale settings. Changing the scale settings
changes how the trace appears on the display but does not change control settings such as Measurement
Frequency.
Setting
Description
Vertical
Controls the vertical position and scale of the trace display.
Scale
Changes the vertical scale units.
Position
Position adjusts the reference level away from top of the graph.
Autoscale
Resets the scale of the vertical axis to contain the complete trace.
Horizontal
Controls the span of the trace display and position of the trace.
Scale
Allows you to, in effect, change the span.
Position
Allows you to pan a zoomed trace without changing the Measurement Frequency.
Position is only enabled when the span, as specified by Freq/div, is less than the
acquisition bandwidth.
Autoscale
Resets the scale of the horizontal axis to contain the complete trace.
Auto
xxx
A Note About Units
The Units used for the horizontal scale can be either Seconds or Symbols. To set the units for the horizontal
scale, display the Analysis Time tab. On the tab, select the appropriate units from the Units drop-down list.
Prefs Tab
The Prefs tab enables you to change appearance characteristics of the GP Digital Modulation displays.
350
SignalVu-PC Printable Help
GP Digital Modulation
Symbol Maps
Setting
Description
Show graticule
Shows or hides the graticule.
Show Marker readout in graph
(selected marker)
Shows or hides the readout for the selected marker in the graph area.
Radix
Specifies how symbols are displayed in the Symbol Table display and in the Marker
readout in the Constellation display.
Remove Q offset
The I and Q data traces are displayed with an offset of half a symbol when the modulation
type is set to SOQPSK or OQPSK. You can remove this offset by selecting Remove Q
offset. (Which is only present when the modulation type is set to OQPSK or SOQPSK.)
Show EVM and Offset EVM
results
Adds EVM results in the display when enabled (Offset EVM is always displayed). Present
only in Signal Quality display and with SOQPSK and OQPSK modulation types only
xxx
Symbol Maps
This topic shows the symbol mapping for each digital modulation technique.
SignalVu-PC Printable Help
351
GP Digital Modulation
Symbol Maps
D8PSK
Phase shift
(radians)
Symbol value
(binary)
0
000
π/4
001
π/2
011
3π/4
π
010
5π/4
111
3π/2
101
7π/4
100
110
xxx
Pi/2 DBPSK
Phase shift
(radians)
Symbol value
(binary)
+π/2
0
–π/2
1
xxx
DQPSK
Phase shift
(radians)
Symbol value
(binary)
0
00
π/2
π
01
3π/2
10
11
xxx
Pi/4 DQPSK
Phase shift
(radians)
Symbol value
(binary)
+π/4
00
+3π/4
01
–π/4
10
-3π/4
11
xxx
352
SignalVu-PC Printable Help
GP Digital Modulation
Symbol Maps
MSK
Phase shift
direction
–
Symbol value
(binary)
+
1
0
xxx
SignalVu-PC Printable Help
353
GP Digital Modulation
354
Symbol Maps
SignalVu-PC Printable Help
GP Digital Modulation
SignalVu-PC Printable Help
Symbol Maps
355
GP Digital Modulation
Overview: User Defined Measurement and Reference Filters
CPM
Phase shift
(h = modulation index)
Symbol value
(binary)
–3h
11
–h
10
+h
01
+3h
00
xxx
Overview: User Defined Measurement and Reference Filters
The Modulation Parameters control tab for GP Digital Modulation displays enables you to load custom
measurement and reference filters. If the existing filters do not meet your requirements, you can create
your own filters for use in the measurement and reference settings. This section describes the structure of
user filters and provides two examples of customized filters. See User Filter File Format (see page 357).
Loading a User Measurement Filter
To load a your own measurement filter:
1. From the Modulation Params control tab (Settings > Modulation Params), click on the drop-down
list for Measurement Filter.
2. Select one of the filter names that starts with User. This displays the Manage user filters window.
3. Enter a name for the filter in one of the Name (editable) boxes. This name will appear in the
drop-down list on the Modulation Params tab, prefaced with User. The maximum number of
characters for the filter name is 20.
356
SignalVu-PC Printable Help
GP Digital Modulation
User Filter File Format
4. Click the Browse button and navigate to the directory containing the filter you want to load. Select
the filter and click Open. If you wish to use a filter that is not in the list, select User other and
locate and open the file you wish to use.
5. Click OK to load the filter and return to the Modulation Params page.
User Filter File Format
The filter file is selected on the Modulation Params control panel tab used by the GP Digital Modulation
displays (Option 21 only). It stores the user-defined measurement or reference filter coefficient data in
CSV format. The following figure shows the file structure.
User filter file structure
A filter file is a plain text file, in comma-separated-variable format. The file extension must be CSV.
The filter file contains the following variables:
Rate. Specifies the oversampling rate (the number of samples per symbol). The filter coefficient data will
be interpolated by the specified rate.
FilterI,FilterQ. Specifies IQ pairs (1 to 1024) of the filter coefficient in time domain.
Rules for Creating a Filter File
A line beginning with “#” is a comment line.
Enter a positive value for the oversampling rate.
A decimal number can be expressed by fixed point or floating point. For example, 0.01 and 1.0E-2 are
both valid.
“0” (zero) and “,0” (comma zero) can be omitted. For example, “1.5,0”, “1.5,”, and “1.5” are
equivalent.
Lines with only a comma and blank lines are skipped.
SignalVu-PC Printable Help
357
GP Digital Modulation
User Filter File Format
Example filters. For your reference, two example filters, Raised Cosine and Gaussian, are shown here.
Both filters contain 65 data points with an oversampling rate of 8.
Raised Cosine (α = 0.3)
(Row 1 to 18)
(Row 19 to 36)
(Row 37 to 54)
(Row 55 to 68)
# Rate
0.0383599,0
0.973215,0
0.0743803,0
8
0,0
0.895591,0
0.0720253,0
# FilterI,FilterQ
-0.047715,0
0.774975,0
0.0594205,0
0,0
-0.0984502,0
0.623332,0
0.0405144,0
-0.0062255,0
-0.143898,0
0.455249,0
0.0194761,0
-0.0136498,0
-0.174718,0
0.286147,0
0,0
-0.0209294,0
-0.181776,0
0.130455,0
-0.0151973,0
-0.0263419,0
-0.157502,0
0,0
-0.0246357,0
-0.0280807,0
-0.0971877,0
-0.0971877,0
-0.0280807,0
-0.0246357,0
0,0
-0.157502,0
-0.0263419,0
-0.0151973,0
0.130455,0
-0.181776,0
-0.0209294,0
0,0
0.286147,0
-0.174718,0
-0.0136498,0
0.0194761,0
0.455249,0
-0.143898,0
-0.0062255,0
0.0405144,0
0.623332,0
-0.0984502,0
0,0
0.0594205,0
0.774975,0
-0.047715,0
0.0720253,0
0.895591,0
0,0
0.0743803,0
0.973215,0
0.0383599,0
0.063548,0
1,0
0.063548,0
xxx
358
SignalVu-PC Printable Help
GP Digital Modulation
User Filter File Format
Gaussian (BT = 0.5)
(Row 1 to 18)
(Row 19 to 36)
(Row 37 to 54)
(Row 55 to 68)
# Rate
0.00191127,0
0.978572,0
0.000401796,0
8
0.00390625,0
0.917004,0
0.000172633,0
# FilterI,FilterQ
0.00764509,0
0.822878,0
7.10E--05,0
2.33E-10,0
0.0143282,0
0.707107,0
2.80E-05,0
9.11E-10,0
0.0257149,0
0.581862,0
1.06E-05,0
3.42E-09,0
0.0441942,0
0.458502,0
3.81E-06,0
1.23E- 08,0
0.0727328,0
0.345977,0
1.32E-06,0
4.21E-08,0
0.114626,0
0.25,0
4.37E-07,0
1.39E-07,0
0.172989,0
0.172989,0
1.39E-07,0
4.37E-07,0
0.25,0
0.114626,0
4.21E-08,0
1.32E-06,0
0.345977,0
0.0727328,0
1.23E-08,0
3.81E-06,0
0.458502,0
0.0441942,0
3.42E-09,0
1.06E-05,0
0.581862,0
0.0257149,0
9.11E-10,0
2.80E-05,0
0.707107,0
0.0143282,0
2.33E-10,0
7.10E-05,0
0.822878,0
0.00764509,0
0.000172633,0
0.917004,0
0.00390625,0
0.000401796,0
0.978572,0
0.00191127,0
0.000895512,0
1,0
0.000895512,0
xxx
SignalVu-PC Printable Help
359
GP Digital Modulation
360
User Filter File Format
SignalVu-PC Printable Help
Marker Measurements
Using Markers
Using Markers
Markers are indicators in the display that you can position on a trace to measure values for the X and Y
axes, such as frequency, power, and time. A Marker always displays its position and, if enabled, will
display the difference between its position and that of the Marker Reference (MR).
You can display up to five markers including the reference marker. Markers can all be placed on the same
trace or they can be placed on different traces. There are three types of Markers: Reference, Delta, and
Power Markers. The Marker Reference (labeled MR in the graph) makes absolute measurements and is
also used for calculating differences when Delta or Power readouts are enabled. The Delta Markers
(labeled M1 to M4 in the graph) are used to measure other points on the trace or the difference between the
Marker Reference and the Delta marker. The Power Markers (labeled M1 to M4 in the graph) function the
same way as the Delta Markers, except they show power density and integrated power density (dBm/Hz)
instead of power level (dBm).
The following two tables show the appearance of the four types of marker readouts.
Marker Reference
Readout
Absolute Marker
Readout
Power Marker Readout
Delta Marker Readout
xxx
The following table shows the appearance of the marker indicators as they appear on the trace. Whichever
marker is active will appear as a solid diamond.
Marker Reference
Absolute, Delta, and Power Marker
xxx
Controlling Markers with the Right-Click Actions Menu
In addition to controlling the marker actions from the menu controls, you can use the right-click actions
menu to move markers or add and delete markers. Some items are not available for certain displays.
SignalVu-PC Printable Help
361
Marker Measurements
Controlling Markers with the Right-Click Actions Menu
You display the Right-click Action menu by clicking the right mouse button.
Menu item
Description
Marker to peak
Moves the selected marker to the highest peak. If no marker is turned on, this control
automatically adds a marker.
Next Peak
Moves the selected marker to the next peak. Choices are Next left, Next right, Next
lower (absolute), and Next higher (absolute).
Add marker
Defines a new marker located at the horizontal center of the graph.
Delete marker
Removes the last added marker.
All markers off
Removes all markers.
xxx
Markers Context Menu
The Markers context menu appears when you right-click (or touch and hold) on a marker. The Markers
context menu enables you to assign a marker to a different trace and pan the trace to place the marker at
the measurement frequency.
362
SignalVu-PC Printable Help
Marker Measurements
Measuring Frequency and Power in the Spectrum Display
Measuring Frequency and Power in the Spectrum Display
To measure the frequency and power at a point on a Spectrum trace:
1. Select Markers > Define Markers.
2. Select the Marker Properties tab.
3. Click Add. This displays a drop-down list under MR (Marker Reference), found inside the Reference
box. The first marker defined is always designated the Marker Reference. Subsequently defined
markers are Delta Markers for which readouts can be selected for Delta, Power, or Absolute. You can
also select and adjust markers by clicking on an existing marker on a trace.
4. From the drop-down list, select the trace to which you want to assign the marker.
5. Click the close control panel button to remove the Define Markers control panel.
6. Click on the marker on the trace to activate that marker.
7. Drag the marker in the graph using a mouse to move the marker to the desired location on the trace.
You can also click on the marker location text box in the Markers toolbar at the bottom of the screen
and adjust it with your mouse wheel. The Peak button in the Markers toolbar and the arrow buttons to
the right of it control marker peak searching on the trace.
8. Read the frequency and power level of the marker position on the display.
9. Read the signal density, frequency, and power level of the marker position on the display.
10. If Power markers are selected, read the point power density and the integrated power density.
SignalVu-PC Printable Help
363
Marker Measurements
Marker Action Controls
Marker Action Controls
Controls for enabling and moving markers and for initiating marker peak searches are found in several
locations. There are buttons for a few of the most common marker activities on the front panel of
the instrument, used along with the knob for adjusting marker positions. The Markers menu contains
selections for peak searches and the Marker toolbar also has buttons for peak searches. All graphs that
support the markers offer a pop-up menu for marker actions.
Peak
Selecting Peak from the Markers menu moves the selected marker to the highest level peak within the
acquisition record.
Next Peak
Selecting Next Peak displays a submenu that enables you to move the selected marker to the next peak.
Setting
Description
Next Left
Moves the selected marker to the next peak to the left of the current marker position.
Next Right
Moves the selected marker to the next peak to the right of the current marker position.
Next Lower (absolute)
Moves the selected marker to the lower level peak (in absolute terms) on the trace.
Next Higher (absolute)
Moves the selected marker to the higher level peak (in absolute terms) on the trace.
xxx
Marker to Center Frequency
Changes the center frequency to match the frequency of the selected marker.
Enabling Markers and Setting Marker Properties
The Define Markers Control Panel is used to enable markers and set their properties. You can set up to five
markers including the marker reference. Markers are shown in most displays.
Markers have three types of on-screen readouts: Absolute, Delta, and Power. When Readouts is set to
Absolute, each readout displays only the marker's position on the trace. In Frequency displays, this means
the marker readout shows the frequency and power of the trace at the marker position. When Readouts
is set to Delta, each delta marker (M1-M4) readout displays both the marker's position on the trace and
the difference between its position and the position of the Reference Marker (MR). When Readouts
364
SignalVu-PC Printable Help
Marker Measurements
Enabling Markers and Setting Marker Properties
is set to Power, each delta marker (M1-M4) readout displays the marker's position on the trace, the
difference between its position and the position of the Reference Marker (MR), the point power density,
and the integrated power density.
Defining Markers
1. Select Markers > Define Markers to display the Define Markers control panel.
2. Select Add to turn on the next marker. A drop-down list under the marker label allows you to assign
the marker to a trace.
NOTE. The first marker defined will always be MR. The MR marker is the reference for delta marker
readouts.
3. Select the trace to which the marker should be attached from the drop-down list.
4. Click Add to add additional markers.
5. Click on the Readouts drop down menu to select the readout to view. If you select Delta from the drop
down menu, you can check the dBc/Hz box to measure noise in dBc/Hz and show that for the delta
value. Checking this box if other readouts are selected will force the readout to Delta. You can read
more about dBc/Hz mode here (see page 367).
6. Click the close button to remove the Define Markers control panel.
Defining Peaks
You can specify two amplitude values that define peaks. For the DPX display, you can also define peaks
based on signal density characteristics.
SignalVu-PC Printable Help
365
Marker Measurements
Using the Markers Toolbar
NOTE. The settings shown in the DPX Signal Density section of the Define Peaks tab are not used
by SignalVu-PC.
Amplitude
Peak Threshold
Peak Threshold specifies the level that the signal must exceed to be considered a peak.
Minimum Excursion
Minimum Excursion specifies how much the signal must decrease and then increase
before another peak can be declared.
DPX Signal Density
Density Threshold
Density Threshold specifies the signal density (number of hits per displayed pixel) that
the DPX bitmap must exceed to be considered a trigger event.
Minimum Excursion
Minimum Excursion specifies how much the signal density must decrease and increase
again before another peak can be declared.
Smoothing (pixels squared)
Smoothing specifies the number of pixels around the marker that are averaged together
to reduce "noise" in the readout of signal density. The value of this control is the number
of pixels on each side of the square area used for averaging. With Smoothing = 1, no
averaging is done and the marker z-axis readout is the hit count (density) of a single
pixel. Use this control to characterize how wide or narrow a range of pixels should be
averaged to determine the signal density.
xxx
1. Select Markers > Define Markers to display the Define Markers control panel.
2. Select the Define Peaks tab.
3. To define the level for Peak Threshold, enter a value in the Peak Threshold number entry box.
4. To define the amount the trace must dip, enter a value in the Peak Excursion number entry box.
5. Click the close button to remove the Define Markers control panel.
Using the Markers Toolbar
Application toolbar:
Menu bar: View > Marker Toolbar
Select Marker Toolbar to display or hide the Marker Toolbar in the application window. The Marker
Toolbar enables you to operate existing markers or define new markers.
Enabling a marker or adjusting the position of a marker automatically opens the Markers toolbar.
366
SignalVu-PC Printable Help
Marker Measurements
Icon / Readout
Measuring Noise Using Delta Markers in the Spectrum Display
Description
Opens the Define Markers control panel.
Selected marker readout. This readout shows which marker is selected. The pop-up
menu allows you to choose the selected marker, add markers, and turn all markers off.
Marker position controls. For frequency displays, this readout shows the marker position
in Hertz. For time displays, this readout shows the marker position in seconds. The
position of the selected marker can be changed by selecting the numeric readout and
using the knob to adjust the value.
Changes the analyzer's Center Frequency to the frequency of the selected marker.
Not selectable for time markers.
Moves the marker to the highest peak on the signal. On displays that scale about zero
on the vertical axis (for example, Magnitude Error, EVM, and Frequency vs. Time), the
highest peak selected by the Peak button is an "absolute value", therefore, negative
peaks are included in the search for the highest peak.
Moves the selected marker to the next peak to the left of the current position.
Moves the selected marker to the next peak to the right of the current position.
Moves the selected marker to the next lower peak value. The peak value here refers to
the numeric value of the peak amplitude. Thus, when repeatedly moving the marker, it
can move to the right or left depending on the location of the next lower value.
Moves the selected marker to the next higher peak value. The peak value here refers to
the numeric value of the peak amplitude. Thus, when repeatedly moving the marker, it
can move to the right or left depending on the location of the next higher value.
Displays/hides the marker table from the display.
Removes the Marker Toolbar from the display.
xxx
Measuring Noise Using Delta Markers in the Spectrum Display
In the Spectrum display, you can set Markers to dBc/Hz to measure noise on the trace. Markers in this
mode operate just as they do in normal mode, but the readouts for the markers are in dBm/Hz and dBc/Hz.
dBm/Hz is the power in milliwatts referenced to a 1 Hz bandwidth. To make this measurement, the
analyzer assumes that the measured signal is random noise. It then converts the measured power (made at
any RBW) to the power that would be measured had a 1 Hz filter been applied for the measurement.
dBc/Hz represents dBm/Hz referenced to a carrier. Here, it is assumed that the carrier is a CW signal,
and its signal level does not change when the RBW is changed, so the Reference Marker measurement
on the carrier is unchanged from any other marker measurement. However, the delta marker values
are converted to dBm/Hz, and then a difference value, in dBc/Hz, is calculated between each delta
measurement and the reference.
Measuring Noise
To measure noise on a Spectrum trace:
SignalVu-PC Printable Help
367
Marker Measurements
Measuring Noise Using Delta Markers in the Spectrum Display
1. Select Markers > Define to display the Markers control panel.
2. Click Add. The first marker defined is always designated the Marker Reference. Subsequently defined
markers are Delta Markers for which readouts can be selected for Delta, Power, or Absolute. You can
also select and adjust markers by clicking on an existing marker on a trace.
3. Click Add again so that there are at least two markers defined.
4. Check that Readouts is set to Delta and check the dBc/Hz box.
5. If you have more than one trace defined, use the drop-down list for each marker to set it to the trace
on which you want to measure noise.
6. Notice that Detection is set to Average for the trace you are using for this measurement.
7. Check that the Amplitude units are set to dBm (that is the default). If they are not, click the
(Analysis) icon, select the Units tab, and select dBm.
8. Click the Close button to remove the control panel.
9. Move the markers to the desired locations on the trace.
10. Read the frequency and power level for the selected marker in the upper corners of the display. To
display the delta measurement in dBc/Hz, select the delta marker (M1, M2, M3 or M4) by clicking on
it or by selecting it in the drop-down marker list in the Markers toolbar.
The following image shows the Spectrum display with a Delta Marker.
The following image shows the Spectrum display with Power Markers.
368
SignalVu-PC Printable Help
Marker Measurements
SignalVu-PC Printable Help
Measuring Noise Using Delta Markers in the Spectrum Display
369
Marker Measurements
370
Measuring Noise Using Delta Markers in the Spectrum Display
SignalVu-PC Printable Help
Mask Testing
The Mask Test Tool
The Mask Test Tool
You can specify pass/fail and mask parameter conditions for the Spectrum, Spurious, Noise Figure, Gain,
Frequency Settling Time and Phase Settling Time displays. When these conditions are met, the instrument
can perform actions such as stopping acquisitions or saving data.
Mask Test Settings
Menu Bar: Tools > Mask Test
Selecting Mask Test displays the Mask Test control panel. These settings define test parameters and
specify actions to be performed when the test conditions are met. Checking the Enable Test box sets the
application to perform the test once the conditions are defined.
Setting
Description
Enable Test
Select to perform a test, then set the test conditions.
Define (see page 371)
Specifies which result to test and what to test for.
Actions (see page 376)
Specifies the action to take when the test condition is met.
xxx
Define Tab (Mask Test)
The Define tab sets the parameters for tests. From this tab, you specify which result to test and what
kind of violation to test for.
The following image shows the Define tab with is great than selected. After you select that test, you will
enter the desired signal level. The procedure is the same if you select is less than.
SignalVu-PC Printable Help
371
Mask Testing
Define Tab (Mask Test)
The following image shows the Define tab with is outside mask selected. After you select that test, you
need to click the Edit limits button and set the desired test limits. The procedure is the same if you
select is inside mask.
Setting
Description
Search in
Specifies which result to test.
Test for
Specifies what to test for. You can specify a test based on a signal level (“is greater than”,
“is less than”) or a mask (“is outside mask”, “is inside mask”). Options for Spurious and
Settling Time are Pass and Fail.
xxx
Search In
The possible choices for Search in include traces from Spectrum, DPX, Noise Figure, Spurious, and
Setting Time displays. The available choices are Trace 1, Trace 2, Trace 3, Math , Spectrogram Trace,
Spurious, and Settling Time. The available choices include only results from displays that are currently
open.
NOTE. If you select a result that is not the selected trace or result in the target display, you will not see the
results of the test. To see the results, select the trace from the drop-down menu in the target measurement
display and check the Show box:
Test For
The Test for setting has selections that vary based on which display's results you are testing.
Pass/Fail Tests for Spurious and Settling Time
The Frequency Settling Time, Phase Settling Time measurements, and Spurious measurements test
functions provide pass/fail results.
Greater Than/Less Than Tests for Spectrum
If you select a greater than/less than test, you also specify the level that defines a violation. When you
select either is greater than or is less than, a text entry box appears to the right of the drop-down list.
Use the text entry box to specify the signal level you wish to test for. While not as flexible as mask
testing, this type of test is quicker to set up.
The following figure shows the results of an is greater than test. The vertical red bar highlights results
that match the test definition.
372
SignalVu-PC Printable Help
Mask Testing
Define Tab (Mask Test)
Outside/Inside Mask Tests
If you specify a mask-based test, then you need to edit the mask to specify the levels that define a violation.
When you select is outside mask or is inside mask, an Edit limits button is displayed. Click the Edit
limits button to display the Mask Test Editor window.
To set up and save mask test limits for a test. Perform the following procedure to set up a test using
the mask limits.
SignalVu-PC Printable Help
373
Mask Testing
Define Tab (Mask Test)
1. After choosing the desired Search in and Test for items, click Edit limits to display the Mask Test
Editor window.
2. Click the New button to create a table. This clears the existing points and loads the default table. You
can also click Open to open an existing table.
3. To edit values, add points, or delete points in a table:
a. To edit an existing value, double-click on the cell you want to edit and enter the desired value. The
active point shows as a red point on the plot.
b. To add a new point, check the box next to the target mask (located below the Auto draw button).
c. Select Add points located below the Open button.
d. Select the target mask (Upper Mask Table or Lower Mask Table) from the drop-down menu.
e. Click in the desired location on the plot to add the point.
f.
374
To use the auto draw feature to automatically place points on the chosen mask, enable the desired
mask from the drop-down menu and then click the Auto draw button.
SignalVu-PC Printable Help
Mask Testing
Define Tab (Mask Test)
NOTE. Units may be changed for measurements other than Noise Figure in Setup > Analysis > Units.
4. To delete a point from the table, select the point to be removed, and click the X button.
5. To save the mask to a file for later recall, click Save As.
6. From the Save As dialog, name the file and save it in the desired location.
NOTE. Masks are saved in XML format with a .msk extension.
7. To dismiss the Mask Test Editor window, click Done.
Mask Test Result Example
The following figure shows the results of a Spectrum is outside mask test with Upper Mask enabled. The
vertical red bar highlights results that have exceeded the test limits. The shaded region shows the mask area.
SignalVu-PC Printable Help
375
Mask Testing
Actions Tab
Actions Tab
The Actions tab allows you to trigger the application when a signal in the frequency domain violates
the mask.
Setting
Description
During Run or Replay
Actions specified here will occur in either Run mode or Replay mode.
(Run actions not available in SignalVu-PC.)
Beep
The analyzer beeps when the test condition is met.
Stop
The analyzer stops when the test condition is met.
During Run Only
Actions specified here are taken only during Run mode (while acquiring live data).
Save acquisition data
Saves acquisition data to a file when the test condition is met. Use the drop-down list
to specify the format of the saved data. The available file formats are: TIQ, CSV, and
MAT (see page 403).
Save trace
Saves Trace data to a file when the test condition is met.
Save picture
Saves a screen capture to a file when the test condition is met. Use the drop-down list to
specify the format of the saved picture. The available file formats are: PNG, JPG, and
BMP (see page 403). Note that no trace will be saved if the tested trace isn't a saveable
trace type. For example, a Spurious trace is not saveable.
Max files
Specifies the number of times a test action stores a file. After this limit is reached, no
more files are saved. The instrument will continue to run, but no additional files are
saved when test conditions are met.
Keep in mind when setting this number that picture files are counted as part of the
total number of files. For example, if you set Max files to 100, the instrument will save
100 acquisitions if only acquisitions are saved or only pictures are saved. But, if both
acquisitions and pictures are saved, then 50 acquisitions and 50 pictures will be saved.
xxx
AutoSave File Naming
When one of the AutoSave actions is enabled, the name of the saved file is automatically incremented
even if the Automatically generate filenames option (Tools > Options > Save and Export) is not enabled.
When the file is saved, it will be saved to C:\<instrument name>Files\.
376
SignalVu-PC Printable Help
Analyzing Data
Analysis Settings
Analysis Settings
Menu Bar: Setup > Analysis
Application Toolbar:
The Analysis control panel provides access to settings that are used by all displays. These settings affect
only post processing and they do not control hardware settings.
Setting
Description
Analysis Time (see page 377)
Specifies the length of time to use in measurements.
Spectrum Time (see page 379)
Specifies whether the Spectrum Analysis display uses the same Analysis Time
parameters as all the other displays or if it uses a different Offset and Length.
Frequency (see page 379)
Specifies the measurement frequency (center frequency).
Units (see page 382)
Specifies the Power units for all displays.
xxx
Analysis Time Tab
The Analysis Time tab contains parameters that define the portion of the acquisition record that is used
for analysis.
SignalVu-PC Printable Help
377
Analyzing Data
Analysis Time Tab
Setting
Description
Analysis Offset
Specifies the location of the first time sample to use in measurements.
Auto
When enabled, causes the instrument to set the Analysis Offset value based on the
requirements of the selected display.
Analysis Length
Specifies the length of time to use in measurements.
Auto
When enabled, causes the instrument to set the Analysis Length value based on the
requirements of the selected display.
Time Zero Reference
Specifies the zero point for the analysis time.
Actual
This is a displayed value, not a setting. It is the Analysis Length (time) being used by the
analyzer; this value may not match the Analysis Length requested (in manual mode).
xxx
Analysis Offset
Use analysis offset to specify where measurements begin. Range: 0 to [(end of acquisition) - Analysis
Length)]. Resolution: 1 effective sample (or symbol).
Analysis Length
Use the analysis length to specify how long a period of time is analyzed by a measurement. After you
enter a value, this box changes to show the actual value in use, which is constrained by Acquisition Time.
This setting is not available when Auto is checked. Range: minimum value depends on modulation type
to Acquisition Length. Resolution: 1 effective sample (or symbol).
Time Zero Reference
The analysis offset is measured from this point. Choices are: Acquisition Start or Trigger Point.
Parameter
Description
Acquisition Start
Offset is measured from the point at which acquisition begins.
Trigger Point
Offset is measured from the trigger point.
xxx
378
SignalVu-PC Printable Help
Analyzing Data
Spectrum Time Tab
Spectrum Time Tab
This tab controls whether the Spectrum display uses the same Analysis Time parameters as all the other
views or uses a different Offset and Length.
Settings
Description
Spectrum Time Mode
Independent
Causes the spectrum analysis views to use the settings unique to those displays.
Use Analysis Time settings
Causes the spectrum analysis views to use the settings on the Analysis Time tab.
Spectrum Time (only available when Independent is selected)
Spectrum Offset
Sets the beginning of Spectrum Time with respect to the selected time reference point
(selectable in the Analysis Time tab as either Acquisition Start or Trigger).
Spectrum Length
The amount of data, in terms of time, from which spectrum traces are computed.
Auto
When enabled, causes the instrument to set the Spectrum Length value based on the
RBW setting.
Actual
This is a displayed value, not a setting. It is the Spectrum Length (time) being used
by the analyzer; this value may not match the Spectrum Length requested (in manual
mode). The actual spectrum length is always an integer multiple of the time needed to
support the RBW value.
xxx
Frequency Tab
The Frequency tab specifies two frequency values: the Measurement Frequency and the Spectrum Center
Frequency. The Measurement Frequency is the frequency at which most displays take measurements. The
Spectrum Center Frequency is the center frequency used by the Spectrum, DPX Spectrum, Spectrogram
and Time Overview displays.
SignalVu-PC Printable Help
379
Analyzing Data
Frequency Tab
The following screen capture shows a display with both the Measurement Frequency and the Spectrum
Center Frequency locked together.
Normally, the Measurement Frequency and the Spectrum Center Frequency are locked together so
that both have the same setting. But in some situations, for example, where a signal contains a set of
channels, it is useful to unlock the Measurement Frequency from the Spectrum Center Frequency.
When the Spectrum Center Frequency is unlocked from the Measurement Frequency, you can adjust the
Measurement Frequency so that measurements can be taken at different frequencies without resetting the
center frequency. The following screen capture shows the magenta-colored measurement frequency
indicator still located at the center frequency.
380
SignalVu-PC Printable Help
Analyzing Data
Frequency Tab
The following screen capture shows the measurement frequency indicator located at 2.0402 GHz while the
Spectrum Center Frequency is still located at 2.0000 GHz.
You can drag the Measurement Frequency indicator on the screen to set the measurement frequency. Note
the base of the Measurement Frequency indicator. The width of the box indicates the widest measurement
bandwidth in use among the open displays. You can see how the width of this box changes with the
measurement bandwidth by, in this example, adjusting the Measurement BW setting for the Constellation
SignalVu-PC Printable Help
381
Analyzing Data
Units Tab
display (Settings > Freq & BW tab). As you adjust the setting, you will see how the width of the box at the
base of the Measurement Frequency Indicator changes.
The Measurement Frequency indicator is useful for interpreting system behavior when MeasFreq is
unlocked. If a measurement has a wide bandwidth relative to the spectrum span, and the Measurement
Frequency is far from spectrum center, the measurement is likely to fail because its required frequency
range exceeds the frequency range of the available data. In such a case, the navigation control will show
that the measurement bandwidth extends outside the Spectrum's span.
There are interactions between frequency unlocking and RF & IF Optimization (see the Amplitude control
panel (see page 389)). When Best for multiple displays is the selected optimization, the instrument is
allowed to use its full bandwidth to meet the needs of all open displays. This is the most user-friendly
optimization because it decreases the number of Acq BW too small errors, but it can increase noise and
slightly decrease measurement accuracies. For all other optimization types, the instrument optimizes the
acquisition bandwidth for the selected display, improving measurement quality somewhat, but reducing
concurrent measurement capability.
There are also interactions with trigger settings. When the Spectrum Center Frequency is unlocked from
Measurement Frequency, the RF triggers (Trigger Source = RF Input) can tune to either Spectrum Center
Frequency or Measurement Frequency. When a spectrum display is selected, the trigger frequency is the
same as the Spectrum Center Frequency. When one of the other displays that uses Measurement Frequency
is selected, the trigger is tuned to the Measurement Frequency also. This allows you to trigger on the
signal you are measuring. But, there is an exception: when the selected RF & IF Optimization is Best for
multiple displays, the trigger is always tuned to the Spectrum Center Frequency.
The reason the trigger frequency is affected by Measurement Frequency and RF & IF Optimization, is
that these functions control how the acquisition is tuned. The optimization Best for multiple displays
keeps the acquisition centered about the Spectrum Center Frequency at all times. To accommodate
off-center Measurement Frequencies, it just widens the acquisition bandwidth. Other optimizations
tune the acquisition frequency to match that of whichever display is currently selected. The RF trigger
module receives the same acquisition data as all the measurements, tuned to the center of the current
acquisition bandwidth.
Units Tab
The Units tab specifies the global Amplitude units for all the views in the analysis window.
382
SignalVu-PC Printable Help
Analyzing Data
Replay Overview
Replay Overview
The Replay function enables you to reanalyze data with different settings and even different measurements.
You can replay all the acquisitions in memory, a single acquisition, a single frame within an acquisition
(if Fast Frame was enabled when the waveform file was saved), or any contiguous set of data records
from acquisition history.
Displaying the Replay Control Panel
To display the Replay control panel:
From the menu bar, select Replay > Select data records from history.
Selecting the Data Type to Replay
You can choose to replay either acquisition data or DPX spectra (providing DPX Spectra were saved in the
waveform file). Choose Acq Data to replay any acquisitions except DPXogram acquisitions. Choose
DPX Spectra to replay a DPXogram acquisition.
Select Data Records Tab
The Select data records tab is used to select which data records to replay. A data record is the smallest unit
that can be replayed. Note that what constitutes a data record can vary. If FastFrame is not enabled, a
data record consists of a single acquisition. If FastFrame is enabled, each acquisition can contain multiple
frames, and a data record consists of a single frame.
Without FastFrame enabled
SignalVu-PC Printable Help
383
Analyzing Data
Replay Overview
With FastFrame enabled
Date and Time Stamps. The line that appears above each Start box (one for acquisitions and one for frames
when FastFrame is enabled) is a date stamp that displays the date and time the first record in the current
acquisition was acquired. The line that appears below each Stop box is a date stamp that displays the date
and time the last record in the current acquisition was acquired.
The line that appears to the right of each Start box displays the date and time the selected acquisition or
frame was acquired. The line that appears to the right of each Stop box displays the date and time the
selected record or frame in the current acquisition was acquired.
Select All button. Selecting Select All resets the Start and Stop values. The Start value is reset to the first
acquisition or frame of the current acquisition. The Stop value is reset to the last acquisition or frame in
the current acquisition.
Select DPX Spectra Tab
The Select DPX Spectra tab is used to select which DPXogram spectra to replay. A spectra is the smallest
DPXogram unit that can be replayed. It is equivalent to one line in the DPXogram display.
Date and Time Stamps. The line that appears above the Start box is a date stamp that displays the date and
time the first DPX spectra in the current acquisition was acquired. The line that appears below the Stop box
is a date stamp that displays the date and time the last DPX Spectra in the current acquisition was acquired.
The line that appears to the right of each Start box displays the date and time the selected DPX Spectra was
acquired. The line that appears to the right of each Stop box displays the date and time the selected DPX
Spectra in the current acquisition was acquired.
Select All button. Selecting Select All resets the Start and Stop values. The Start value is reset to the first
DPX Spectra of the current acquisition. The Stop value is reset to the last DPX Spectra in the current
acquisition.
384
SignalVu-PC Printable Help
Analyzing Data
Replay Menu
Acquisition Info Tab
Displays information about acquisition settings and sets the number of decimal places used for displaying
the time stamp.
Replay Speed Tab
Sets the speed at which data records are replayed.
Replay Menu
The Replay menu provides controls that let you choose how to replay acquisitions. The replay function
enables you to, in effect, “rerun” an analysis while applying different measurements to the same set of
acquisition data.
Menu item
Description
Acq Data
Select Acq Data to replay acquisitions.
DPX Spectra
Select DPX Spectra to replay a DPXogram display.
Replay all selected records
Replays the sequence of records specified by Start and Stop on the Select data records
tab.
Loop overall selected records
Replays the sequence of records specified by Start and Stop on the Select data records
tab continuously.
Replay current record
Replays the currently selected acquisition (or frame).
Replay from selected
Displays a submenu that you use to specify which records are to be replayed.
First record
Replays the first record within the selected set.
Previous
Replays the previous record within the selected set.
Next
Replays the next record within the selected set.
SignalVu-PC Printable Help
385
Analyzing Data
Menu item
Last record
Acq Data
Description
Replays the last record within the selected set.
Pause
Suspends replay of the data records as soon as the current record's replay action is
completed. Press Pause again to begin replay with the next record in the sequence.
Stop
Halts the replay of acquisitions. If replay is started after Stop has been selected, replay
starts from the first acquisition.
Select all
Selects all acquisitions for replay.
Select records from history
Displays the Select data records tab of the Replay control panel. Use the Select data
records tab to specify which acquisitions and frames you would like to replay.
Replay toolbar
Displays or hides the Replay toolbar.
xxx
Acq Data
Selecting Acq Data selects acquisition data as the source for replay. Selecting Acq Data does not start
replay, it only selects the type of acquisition data that will be replayed.
DPX Spectra
Selecting DPX Spectra selects DPX spectra as the source for replay. Selecting DPX Spectra does not start
replay, it only selects the type of acquisition data that will be replayed.
Replay All Selected Records
Selecting Replay all selected records replays all the selected data records. The set of selected records
may comprise a single record, all records in acquisition history, or a subset of the records in history.
Replay Current Record
Selecting Replay current record replays the current data record. You can identify the current acquisition
record by looking at the Replay toolbar. The first number to the right of the Select button identifies the
current data record. For example, if the number is 2:10, it means the current record is the tenth frame of
the second acquisition in history.
386
SignalVu-PC Printable Help
Analyzing Data
Replay from Selected
Replay from Selected
Select Replay from selected to replay records as selected from the submenu. The records replayed can
be from the acquisition memory (history) or from a saved acquisition data file that has already been
recalled as the current acquisition data.
Pause
Select Pause to suspend playback. Selecting Pause again restarts the replay at the point it was paused.
Stop
Select Stop to halt the replay of data. Selecting any Replay action restarts replay of records from the
beginning.
Select All
Select Select all to select all data records for replay.
Select Records from History
Selecting Select records from history displays the Select data records tab of the Replay control panel.
The Select data records tab allows you to specify which records in the acquisition history will be used
when the Replay button is selected.
Replay Toolbar
Displays or hides the Replay toolbar that appears below the main tool bar.
Replay toolbar
SignalVu-PC Printable Help
387
Analyzing Data
Replay Toolbar
Item
Description
Replay
Selects data type to be replayed. Select DPX Spectra to replay a DPXogram. Select Acq
Data for all other types of replay.
Replays the first record in the selected set.
Replays the previous record in the selected set.
Replays the current record in the selected set.
Replays the next record in the selected set.
Replays the last record in the selected set.
Replays all records in the selected set.
Replays all records in the selected set continuously until stopped.
Pauses replay. Pressing pause suspends replay with the current record. Selecting pause
again starts Replay with the next record.
Stops replay. Starting any replay action after pressing stop starts a new Replay action
rather than continuing from the record at which the previous replay action was stopped.
Pressing Select all selects all records in history for replay. Selecting Select all resets the
Start and Stop values on the Select data records tab of the Replay control panel.
Pressing Select displays the Select data records tab of the Replay control panel. The
Select data records tab allows you to select records from acquisition history for replay.
This readout shows information about the data record being replayed. The information
displayed shows the acquisition and frame number and time stamp for the current data
record.
The Info button displays the Acquisition Info tab of the Replay control panel. The
Acquisition Info tab displays information about the acquisition data such as acquisition
bandwidth, sampling rate and acquisition length. All data records in the acquisition
history were acquired with identical parameters. When any of these parameters are
changed, all records in history are deleted as soon as the first record acquired under the
new parameter values is received.
xxx
388
SignalVu-PC Printable Help
Amplitude Corrections
Amplitude Settings
Amplitude Settings
Menu Bar: Setup > Amplitude
Application Toolbar:
The Amplitude control panel provides access to power-related settings that are used by all displays within
the SignalVu-PC application.
Setting
Description
External Gain/Loss Correction
(see page 389)
Specifies whether a correction is applied to the signal to compensate for the use of
external equipment.
xxx
External Gain/Loss Correction Tab
External Gain Value
Use the External Gain Value setting to apply a flat gain/loss correction to the signal. Positive values
represent a gain and negative values represent a loss. The range is –50 to +30 dB. Resolution is 0.1 dB.
NOTE. Selecting Preset clears the check box, but it does not change the value.
External Loss Tables
Use an External Loss Table to apply a frequency dependent gain/loss correction to the signal. When an
External Loss Table is selected, the analyzer adjusts the signal according to the values in the table. An
external loss table allows you to compensate the signal level for variations in cable loss, antenna frequency
response or preamp frequency response.
You can create external loss tables from the analyzer application and save them as files. External loss tables
are saved as plain text files in CSV (Comma Separated Value) format. The tables have a CSV file extension.
You can change the title for each table. However, note that the title is only a label. It is not tied to the file
name of any table you may have loaded or saved.
SignalVu-PC Printable Help
389
Amplitude Corrections
External Gain/Loss Correction Tab
NOTE. If you are using an External Loss Table for antenna corrections, be sure to set the Amplitude units
(Setup > Analysis > Units) to dBuA/m or dBuV/m.
Creating an External Loss Table
You can create an external loss table with the analyzer application. No external application is required.
To create an external loss table:
1. Click Edit. to display the Table Editor.
2. Click New Table to create a table. This clears all entries in the existing table and loads the default table.
3. To edit values in the table:
a. To edit an existing value, double-click on the cell you want to edit.
b. To add a new point to the table, click on Add Point. Edit the values as required.
c. Click Apply if you want to test your table without closing the editor (the table must be enabled
with the check box in the control panel and measurements must already be running).
To specify a frequency multiplier, you can type K, M, or G.
4. To delete a point from the table, select the point to be removed, and click Delete.
5. Select the Frequency Interpolation method:
Select Linear when the frequency scale of the spectrum or spurious measurements are linear.
Select Log when the frequency scale of the spectrum is logarithmic.
6. When you have entered all the necessary values, click Save As (to save the table in a file) or click OK.
7. From the Save As dialog, name the file and save it in the desired location.
390
SignalVu-PC Printable Help
Amplitude Corrections
External Gain/Loss Correction Tab
External loss tables are saved in CSV (Comma Separated Value) format.
Loading an External Loss Table
To load an external loss table file:
1. Click Edit to display the Table Editor.
2. Click Load to display the Open dialog box.
3. Navigate to the location of the desired file, select it and click Open.
4. Click OK.
SignalVu-PC Printable Help
391
Amplitude Corrections
392
External Gain/Loss Correction Tab
SignalVu-PC Printable Help
Controlling the Acquisition of Data
Acquire
Acquire
Menu Bar: Setup > Acquire
Application Toolbar:
Selecting Acquire displays the Acquire control panel.
The Acquire control panel changes based on whether you are connected to an RSA306 or not.
Acquire (RSA306 not connected)
The Acquire control panel contains the Acquisition Data tab. This is an information only tab that displays
the sample rate and record length of the recalled acquisition data file.
Signal Input. The Signal Input control is not used by SignalVu-PC.
Setting
Description
Acquisition Data (see
page 394)
Displays the sample rate and record length reported by the oscilloscope.
xxx
Acquire (RSA306 connected)
Selecting Acquire displays the Acquire control panel. These settings control the hardware acquisition
parameters for the RSA306 signal analyzer.
SignalVu-PC Printable Help
393
Controlling the Acquisition of Data
Acquisition Data
Tab
Description
IQ Sampling Parameters (see
page 395)
Sets the controls for real-time acquisition.
Frequency Reference (see
page 396)
Specifies the source of the reference frequency.
Record (see page 396)
Records the acquisition data directly to a file.
xxx
Run
Run mode specifies whether the analyzer will stop acquiring data after it completes a measurement
sequence.
Continuous - In Continuous mode, once the analyzer completes a measurement sequence, it begins
another.
Single - In Single mode, once the analyzer completes a measurement sequence, it stops.
NOTE. A measurement sequence can require more than one acquisition. If the analyzer is configured to
average 100 traces together, the measurement sequence will not be completed until 100 traces have
been acquired and averaged.
Acquisition Data
The Acquisition Data tab lists the Sample Rate and Record length of the recalled acquisition data file.
394
SignalVu-PC Printable Help
Controlling the Acquisition of Data
IQ Sampling Parameters
IQ Sampling Parameters
The IQ Sampling Parameters tab enables you to set the controls for real-time acquisition. Normally, the
best results are achieved by leaving the Adjust control set to the recommended setting of All Auto. This
allows the settings to be automatically adjusted for selected measurements.
Depending on the setting chosen for Adjust, two additional parameters can be set.
Adjust
User Sets
All Auto
N /A
N /A
All values based on the
selected measurement
Acq BW / Acq Samples
Acq BW
Acq Samples
Acq Length
Acq BW / Acq Length
Acq BW
Acquisition Length
Acq Samples
Analyzer Calculates
xxx
Acquisition Memory Usage
The center portion of the tab shows how the acquisition memory is used.
Readout
Description
Samples/s, sec/Sample
Readout of the acquisition sample rate and sample period.
Capacity
The maximum period of time and number of samples that can be acquired with the
current sampling parameters.
Using
The total amount of acquisition memory that will be used based on the current settings.
xxx
SignalVu-PC Printable Help
395
Controlling the Acquisition of Data
Frequency Reference
Frequency Reference
Specifies the source of the reference frequency . You can select between an Internal (10 MHz) source
and an external source.
Setting
Internal
Uses the internal 10 MHz clock of the RSA306 as the reference frequency.
External (10 MHz)
Uses a 10 MHz clock signal applied to the Ref In connector of the RSA306 as
the reference frequency.
xxx
Record
Record lets you record the acquisition data directly to a file to be read by an application of your choice,
such as MATLAB.
NOTE. Do not change any SignalVu-PC settings while recording is active.
396
SignalVu-PC Printable Help
Controlling the Acquisition of Data
Triggering
Setting
Record to disk:
Record now
Data recording starts immediately when the Start button is pressed. Data is
continuously recorded until either stopped by the Start (Stop) button or the
File Length condition is met.
If File Length is disabled, recording continues until the Stop button is pressed
(or the specified save location runs out of space).
Record on trigger
Data recording starts when an appropriate trigger signal is received (when
Triggering is set to Triggered).
Start
The Start button is enabled when the Record to disk is set to Record now.
Pressing Start begins the data recording. The button changes to Stop and
recording continues until pressed.
File Length:
File Length is enabled by default. This determines how much data (time in
milliseconds, seconds, or minutes) is recorded when recording starts.
File Length uses the Max saved files per run: setting to determine how many
data files are captured per each recording session.
Disabling File Length allows the recording to continue until the Stop button is
pressed (or the specified save location runs out of space).
Location:
Sets the location for the recorded file(s).
Base file name:
Enter a base name that will be used for all recorded files. This base name is
appended with additional information, creating unique file names.
Max saved files per run:
This determines how many times a record is created, of the specified File
Length setting.
If the File Length is not enabled, this setting is ignored.
Data structure:
Choose the output data file structure.
Refer to the RSA306 API programming manual for information about the data
files created with the Record feature.
Formatted
Formatted files are created, ending with a .r3f suffix.
Raw
Unformatted files are created.
Two files are created for each recording, a header file (.r3h) and the data file
(.r3a).
xxx
Triggering
Triggering is available in SignalVu-PC when connected to an RSA306 Spectrum Analyzer. The RSA306
analyzer has two triggering modes: Free Run and Triggered.
Free Run
In Free Run mode, the RSA306 initiates acquisitions without considering any trigger conditions. It is a
fast and easy way to see the signals. Free Run is usually adequate for the Spectrum display unless you
need to specify a particular time at which to collect the data record.
SignalVu-PC Printable Help
397
Controlling the Acquisition of Data
Triggering
Triggered
In the Triggered mode, the instrument initiates an acquisition when a trigger event is recognized. The
conditions that define a trigger event depend on the selected trigger source. If the RF input is the selected
trigger source, Power is the trigger type and you can select the slope and level of the trigger point. If
External is selected as the trigger source, you can select the slope as the trigger point.
You can define the following event parameters by selecting the respective tab in the Trigger control panel:
Event source and event type.
Advanced parameters define where a trigger occurs within the acquired memory or trigger each
segment in the swept acquisition mode.
Actions set parameters for the Save on trigger function.
Save on Trigger
An additional feature of the triggering capability is to save acquisition data when a trigger event occurs.
When the analyzer is run in Triggered mode, you can configure the instrument to save acquisition data to a
file. You can also set the instrument to save a picture of the screen when the trigger event occurs. See
Action Tab (Triggering) (see page 402) for details on configuring Save on trigger.
Setting Up Triggering
To set up triggering, use the Trigger control panel. To display the Trigger control panel:
Click Trig in the Application toolbar or select Setup > Trigger.
Using Free Run
To set Triggering to Free Run:
Click the Free Run option button.
The signal analyzer will acquire a signal without regard to any triggering conditions.
Using Power Trigger
To trigger acquisitions based on the power of the signal:
398
SignalVu-PC Printable Help
Controlling the Acquisition of Data
Trigger Settings
1. Click the Triggered option button.
2. Select RF Input from the Source drop-down list.
3. Select Power from the Type drop-down list.
4. For further information on setting the power level parameters, see Event Tab (Triggering). (see
page 400)
Trigger Settings
Menu Bar: Setup > Trigger
Application Toolbar:
The Trigger control panel allows you to set the parameters that define trigger events and how the
instrument responds to them.
Trigger Modes
There are two trigger modes: Free Run and Triggered.
Mode
Description
Free Run
Acquires and displays the signal without triggering.
Triggered
Acquires a data record after the defined trigger event is recognized.
xxx
Trigger Tabs
Use the Trigger tabs to access controls for setting the different trigger parameters.
Tab
Description
Event (see page 400)
Sets parameters that control triggering on the selected trigger source.
Advanced (see page 401)
Sets controls for triggering in swept acquisitions.
Actions (see page 402)
Sets parameters for Save on trigger function.
xxx
SignalVu-PC Printable Help
399
Controlling the Acquisition of Data
Event Tab
Event Tab
The Event tab is used to set the parameters that define trigger events. The parameters that appear on the
Event tab change depending on the selected Trigger source and type.
Source
Source specifies the source of the signal to be monitored for a trigger event. The choices available are RF
Input and External. The Source drop-down list is always visible on the Event tab.
Type
Type defines the trigger type. Power is the only selection available. With Power as the trigger type, the
trigger event is determined by the transition through an adjustable level. The Type selection is only
present when Source is set to RF Input.
For the Power setting, if the RF input signal crosses the specified level (in the direction set by Slope), a
trigger event occurs. A trigger event does not occur if the power level of the signal simply exceeds the
level setting, there must be a power level transient that crosses the specified level.
400
SignalVu-PC Printable Help
Controlling the Acquisition of Data
Advanced Tab (Triggering)
Advanced Tab (Triggering)
Menu Bar: Setup > Trigger > Advanced
Application Toolbar: Trig > Advanced
Allows you to set parameters for trigger position and holdoff settings.
Setting
Description
Trigger Position
Sets the point along the acquisition record the trigger event should occur.
Auto
Trigger each segment of
Swept acquisitions
Enables the instrument to set the position of the trigger event. To manually specify the
position of the trigger event, unselect Auto.
Sets the analyzer to wait for a trigger for each acquisition in a swept spectrum or other
measurement requiring multiple acquisitions worth of span.
xxx
SignalVu-PC Printable Help
401
Controlling the Acquisition of Data
Actions Tab (Triggering)
Actions Tab (Triggering)
The Actions tab sets parameters for the Save on trigger function. The Save on trigger function allows you
to save an acquisition data file and/or a screen capture when a trigger event occurs.
Trigger events are defined on the Event tab.
Action tab settings
Setting
Description
Save acq data on Trigger
Enables the Save on Trigger function. The list box to the right of the Save acq
data on Trigger check box specifies the format of the saved file. Acquisition
data files can be saved in TIQ (native) format, CSV format, and MAT (MATLAB)
format. For descriptions of these file formats, see Data, Settings and Picture
File Formats (see page 410).
When TIQ is the selected file type, a file is saved after a complete acquisition,
which can include multiple frames. When CSV or MAT is the selected file type, a
separate file is saved for each frame.
Files are saved in the last location a file was saved. The default location is
C:\SignalVu-PC Files.
Save picture on Trigger
Enables saving a picture of the display when a trigger event occurs. Files can be
saved in PNG, JPG, and BMP format. For descriptions of these file formats, see
Data, Settings, and Picture File Formats (see page 410).
Max total files saved per Run
Specifies the number of times a Save on Trigger action stores a file. After this
limit is reached, no more files are saved. The instrument will continue to run, but
no additional files are saved when a trigger event occurs.
Keep in mind when setting this number that picture files are counted as part of the
total number of files. For example, if you set Max total files to 100, the instrument
will save 100 acquisitions if only acquisitions are saved or only pictures are
saved. But, if both acquisitions and pictures are saved, then 50 acquisitions
and 50 pictures will be saved.
xxx
402
SignalVu-PC Printable Help
Managing Data, Settings, and Pictures
Saving and Recalling Data, Settings, and Pictures
Saving and Recalling Data, Settings, and Pictures
You can save different types of data for later recall and analysis.
Data type
Description
Save as type
Setup files
Saves all of the setup information for
all displays, except those settings that
are not part of Preset.
Setup (.Setup)
Picture of Selected Display
(PNG/JPG/BMP)
Saves a capture of the screen in the
specified format. This option is useful
for including the graphic in reports or
other applications. Marker readouts
and other information are included.
Picture (.BMP, .PNG, .JPG)
Results Export files
Saves the trace and numeric data for
the selected display. The trace and
numeric data are saved as CSV files.
Results export (various)
Measurement Settings
Saves a list of settings relevant to the
selected measurement to a text file.
This option is useful for including the
measurement settings in reports.
Measurement settings export (TXT)
Trace
Saves a trace for later recall into the
display from which it was saved.
Selected trace (various)
Data
Saves data for reanalysis later or as
data to use with external software
(either CSV (comma-separated
value) or MAT (MATLAB format).
Acquisition data with setup (TIQ); or
Acquisition data export (CSV or MAT)
xxx
Saving Files
Saving files follows the same procedure regardless of the type of data being saved. To save setups
(including application presets), pictures, results, or acquisition data:
1. Select Save As from the File menu to open the Save As dialog box.
2. Navigate to the folder where you want to save the setups, or use the default location.
To save setups so that they appear in the Application Presets window, save your setup in the folder
C:\SignalVu-PC Files\User Presets. The saved setup will appear in the Application Presets
window with the name you give the file.
3. Enter a file name.
4. Select the type of file to save from the Save as type drop-down list.
5. Click Save.
SignalVu-PC Printable Help
403
Managing Data, Settings, and Pictures
Saving and Recalling Data, Settings, and Pictures
Recalling Files
You can recall three types of files: Setup files, Selected Trace, and Acquisition data with setup. Recalling
data follows the same procedure regardless of the type of data being recalled.
1. Select Recall from the File menu to open the Open dialog box.
2. Navigate to the folder containing the file you want to recall.
3. Select the type of file to recall from the Files of type drop-down list. This selection determines the
files that appear in the Open dialog box.
4. Select the file to recall.
5. Click Open.
Recalling Waveforms with SignalVu-PC
SignalVu-PC can recall waveform files saved by Tektronix oscilloscopes and spectrum analyzers. It can
also read files saved in MATLAB Level 5 format. Waveform files can be recalled two ways: as Data and
setup, and as Data only. When recalled as Data and setup, only the .tiq file format opens with all settings
and measurements recalled. Because only the .tiq file is recalled with all settings and measurements, you
should save any non-tiq file as a .tiq file once you have recalled the file with SignalVu-PC.
The following tables lists the supported file formats and includes notes about using the files.
Table 7: RSA5000/RSA6000/SPECMON file formats supported by SignalVu-PC
Generated by
RSA5000/RSA6000/SPECMON
File type
.tiq
.mat
File
description
Contains corrected I and Q
time-domain data, all settings
and measurement setup
Contains I and Q
time-domain data,
center frequency,
sample rate
This is the native format for
SignalVu-PC. It contains all
information needed to open and
analyze all displays available
Recommend saving as
.tiq file after opening
What
SignalVu-PC
can do with
this format
Open
with
settings
Automatically
Sets Span, Center
Frequency
Open as
data only
Notes
All Settings and
Measurements are
Recalled
Uses settings from
SignalVu-PC when
opened
xxx
404
SignalVu-PC Printable Help
Managing Data, Settings, and Pictures
Saving and Recalling Data, Settings, and Pictures
Table 8: RSA3000 and WCA200 file formats supported by SignalVu-PC
Generated by
RSA3000, WCA200
File type
.iqt
.mat
File
description
Contains I and Q time-domain
data, center frequency, sample
rate, amplitude and phase
corrections
Contains I and Q
time-domain data, center
frequency, sample rate
Recommend saving as .tiq file
after opening
Recommend saving as
.tiq file after opening
What
SignalVu-PC
can do with
this format
Open
with
settings
All Settings and
Measurements are
Recalled
Automatically
Sets Span, Center
Frequency
Open as
data only
Uses settings from
SignalVu-PC when
opened
Notes
xxx
Table 9: WCA300 file formats supported by SignalVu-PC
Generated by
WCA300
File type
.iqt
File description
Contains I and Q time-domain data,
center frequency, sample rate, amplitude
and phase corrections
What SignalVu-PC
can do with this
format
Open with
settings
All Settings and
Measurements are Recalled
Automatically Sets Span,
Center Frequency
Open as data
only
Uses settings from
SignalVu-PC when opened
Notes
Recommend saving as .tiq file after
opening
xxx
Table 10: SignalVu on oscilloscopes file formats supported by SignalVu-PC
Generated by
SignalVu on oscilloscopes
File type
.tiq
.mat
File
description
.tiq format as used by SignalVu,
all versions, includes I and Q
time domain data, all settings
and measurement setup
Contains I and Q
time-domain data,
center frequency,
sample rate
SignalVu-PC Printable Help
405
Managing Data, Settings, and Pictures
Saving and Recalling Data, Settings, and Pictures
Table 10: SignalVu on oscilloscopes file formats supported by SignalVu-PC (cont.)
What
SignalVu-PC
can do with
this format
Open
with
settings
All Settings and
Measurements are
Recalled
Automatically
Sets Span, Center
Frequency
Open as
data only
Uses settings from
SignalVu-PC when
opened
Notes
This is the native format for
SignalVu-PC. It contains all
information needed to open
and analyze all displays
available
Recommend saving as
.tiq file after opening
xxx
Table 11: Performance Oscilloscope (without SignalVu) file formats supported by SignalVu-PC
Generated by
MSO/DPO/DSA5000/7000/70000
File type
.wfm
File description
Amplitude vs. Time, includes sample
rate information
What SignalVu-PC
can do with this
format
Open with
settings
All Settings and
Measurements are Recalled
Automatically Sets Span,
Center Frequency
Open as data
only
Uses settings from
SignalVu-PC when opened
Notes
Prior to opening: Preset SignalVu-PC.
Set span and center frequency. After
opening, save as .tiq file. Reopen
the .tiq file for further changes to the
measurement settings and opening
additional displays
xxx
Table 12: Bench Oscilloscope file formats supported by SignalVu-PC
406
Generated by
MSO/DPO 2000, 3000, 4000
File type
.isf
File description
Amplitude vs. Time, includes sample
rate information
SignalVu-PC Printable Help
Managing Data, Settings, and Pictures
Saving and Recalling Data, Settings, and Pictures
Table 12: Bench Oscilloscope file formats supported by SignalVu-PC (cont.)
What SignalVu-PC
can do with this
format
Open with
settings
All Settings and
Measurements are Recalled
Automatically Sets Span,
Center Frequency
Open as data
only
Uses settings from
SignalVu-PC when opened
Notes
Prior to opening: Preset SignalVu-PC.
Set span and center frequency. After
opening, save as .tiq file. Reopen
the .tiq file for further changes to the
measurement settings and opening
additional displays
xxx
Table 13: MDO4000 mixed domain oscilloscope file formats supported by SignalVu-PC
Generated by
MDO4000, RF channel
File type
.tiq
File description
Contains I and Q time domain data.
Opens with spectrum analyzer and time
overview.
What SignalVu-PC
can do with this
format
Open with
settings
All Settings and
Measurements are Recalled
Automatically Sets Span,
Center Frequency
Open as data
only
Uses settings from
SignalVu-PC when opened
Notes
Native format for SignalVu-PC. Opens
with Time Overview and Spectrum
Display active
xxx
Table 14: RF Hawk file formats supported by SignalVu-PC
Generated by
RF Hawk
File type
.iqt
.mat
File
description
Contains I and Q
time-domain data, center
frequency, sample rate
Contains I and Q time-domain
data, center frequency,
sample rate
SignalVu-PC Printable Help
407
Managing Data, Settings, and Pictures
Saving and Recalling Data, Settings, and Pictures
Table 14: RF Hawk file formats supported by SignalVu-PC (cont.)
What
SignalVu-PC
can do with
this format
Open with
settings
All Settings and
Measurements are
Recalled
Automatically
Sets Span, Center
Frequency
Open as
data only
Uses settings from
SignalVu-PC when
opened
Notes
Recommend saving as .tiq
file after opening
Recommend saving as .tiq
file after opening
xxx
Table 15: User generated (including Agilent 89601 software) file formats supported by SignalVu-PC
Generated by
User generated (including Agilent 89601
software)
File type
.mat
File description
MATLAB Level 5 format, must contain
at least InputCenter, InputZoom, Xdelta,
and Y
What SignalVu-PC
can do with this
format
Open with
settings
All Settings and
Measurements are Recalled
Automatically Sets Span,
Center Frequency
Open as data
only
Notes
Uses settings from
SignalVu-PC when opened
Recommend saving as .tiq file after
opening
xxx
To recall a acquisition data file, see Recalling Files (see page 404) above.
Opening .tiq files saved by RSA3000 and WCA300 analyzers. To open an .iqt file:
1. Select File > Preset (Main).
2. Select File> Recall and select Acq Data with Settings (IQT) (*.iqt) in the Open dialog. Select
the desired file and click OK to open the file.
3. Save the file by selecting File > Save As and set the file type to Acq data with setup (TIQ) (*.tiq).
Save the file by clicking OK.
Saving the file in .tiq format preserves all of the settings in the analyzer and associates them with the
data set. After saving the file in .tiq format, recall the saved .tiq file and add measurements and
change settings.
The .iqt file format contains I and Q waveforms plus instrument amplitude/phase correction data,
analysis bandwidth and center frequency. When SignalVu-PC opens an .iqt file, the amplitude and phase
408
SignalVu-PC Printable Help
Managing Data, Settings, and Pictures
Saving and Recalling Data, Settings, and Pictures
corrections are applied to the IQ data to produce a corrected data set. The span and center frequency
information present in the .iqt file are used to set the SignalVu-PC span and center frequency. However, no
information about analysis length, offset or type is preserved in the .iqt file.
Opening .mat files saved by RSA5000/6000/SPECMON series and third party waveforms. To open a .mat
file from these instruments:
1.
Select File > Preset (Main).
2. Select File> Recall and select Acq Data with Setup (MAT) (*.mat) in the Open dialog. Select
the desired file and click OK to open the file
3. Save the file by selecting File > Save As and set the file type to Acq data with setup (TIQ) (*.tiq)
and click OK. Saving the file in .tiq format preserves all of the settings in the analyzer and associates
them with the data set.
4. Recall the saved .tiq file and add measurements and change settings.
If you choose to save the file in .mat format, SignalVu-PC automatically adds all of the SignalVu-PC
settings needed for your analysis into the stored .mat file.
Opening files saved with oscilloscopes. Oscilloscopes acquire and store data in an amplitude vs. time
format that must be converted by SignalVu-PC into an IQ format for further processing. Sample-rate and
amplitude information is available in these files, but no other information is available to SignalVu-PC.
To open files stored in either .ISF or .WFM format saved by Tektronix oscilloscopes, use the following
procedure:
1. Preset SignalVu-PC. This resets the analysis so that only the spectrum analyzer display is present, with
a center frequency of 250 MHz and a span of 200 MHz.
2. Set the Span of SignalVu-PC to 0.2 × Sample Rate of the acquisition.
How to determine the maximum available span for your .ISF or .WFM file: The maximum span is
calculated to be 0.4 × Sample Rate. For example, a waveform sampled at 1 GSample/second will have
a maximum span of 0.4 × (109) = 400 MHz. This represents the Nyquist bandwidth of the sampling
system plus an allowance for filter bandwidth. Note that this span may exceed the bandwidth of the
oscilloscope used, and results at frequencies higher than the oscilloscope bandwidth will be attenuated.
When processing the waveform, SignalVu-PC automatically sets the bandwidth to twice the entered
span to allow for increasing the span in later analysis. Set the span of the spectrum analyzer to ½ the
calculated maximum span. In the case of the example of above, this is ½ × 400 MHz, or 200 MHz.
3. Set the center frequency to ½ of the span. This puts the analysis frequency within the first Nyquist
zone to prevent aliasing of the signal.
4. Open the .ISF or .WFM file with the settings above.
5. Set the span to the calculated maximum (in the example above, 0.4 × Sample Rate = 400 MHz) and
reanalyze.
6. Save the results as a .TIQ file. This preserves all of the settings in the analyzer and associates them
with the data set.
SignalVu-PC Printable Help
409
Managing Data, Settings, and Pictures
Data, Settings, and Picture File Formats
Setup Files
You can set up the instrument as desired and then save the settings in a setup file. This enables you to
quickly setup the instrument by recalling previously saved setups.
Exporting Results
Save for further analysis of results in other programs, such as MATLAB or Excel.
Pictures of the Selected Display
You can save pictures of the instrument display for documentation purposes. When saving pictures of
the display, you can select from three file types: BMP, JPG, or PNG.
Measurement Settings
You can save a list of settings relevant to the selected display to a file for documentation purposes. The
exported file uses tab characters to separate values. The settings included in the file depend on the selected
display. The contents of the file are the same as a Results export except it does not include the results.
Saving Acquisition Data with Setup
Save for later analysis with the analyzer. The setup is saved as part of the acquisition data file so you can
choose when recalling data whether or not to also recall the associated acquisition and analysis parameters.
Saving Acquisition Data Export in CSV Format
Save for examining results in other programs, such as MATLAB or Excel.
Data, Settings, and Picture File Formats
You can save different types of data for later recall and analysis.
410
SignalVu-PC Printable Help
Managing Data, Settings, and Pictures
Data, Settings, and Picture File Formats
Saved File Types
File type
File extension
Description
Setup files
.setup
Setup files enable you to save instrument settings for later recall. Using
these files saves setup time and ensures consistent measurements.
Picture
.png/.jpg/.bmp
Screen capture of SignalVu-PC application window. They are useful for
documenting results in test reports.
Results Export
.csv
Results files contain the trace points and numeric values that were
produced by the selected measurement. The header of a Results file
includes key acquisition and analysis settings to aid in the interpretation
of the data. The file is saved as a plain text file, but the contents are
formatted as CSV (comma-separated values). Results files can be
opened from applications such as Microsoft Excel and MATLAB.
Measurement
Settings
.txt
Measurement settings files contain a list of settings that describe how
the instrument is set up for the selected measurement. The list contains
measurement settings (for example, Span), trace settings (for example,
whether or not a trace is selected) and global settings (for example,
Frequency and Reference Level). The list of settings contained in the
file varies depending on which display is selected.
Selected Trace
varies with display
Trace files contain the trace results data in binary format. These files
are only readable by the SignalVu-PC application. Several of the
instrument's measurements allow you to recall a Trace file for visually
comparing a saved trace to a live trace.
Acquisition Data
with Setup
.tiq
These files contain the acquisition data record and complete instrument
setup (in binary format). Use these files to save data for later recall and
analysis. When you save an Acquisition Data file, the current Setup
is always saved with the file. At the time of recall, you will be asked
whether you want to restore only the acquisition data or both data and
setup. If the instrument is already set up for a specific measurement,
you will probably want to recall only the acquisition data. Recalling
both data and setup returns the instrument to the same state it was
in at the time you saved the file.
Acquisition Data
.csv
These files contain IQ sample data before it has been processed by
a measurement. The acquisition data points are saved as IQ pairs.
Use this format to import the acquisition data into Microsoft Excel for
further analysis.
Acquisition Data
.mat
These files contain IQ sample data before it has been processed by
a measurement. The acquisition data points are saved as IQ pairs.
Use this format to import the acquisition data into MATLAB for further
analysis.
Range file
.csv
These files contain a list of settings that describe how the instrument is
set up for the Spurious measurement. The file contains the number of
ranges enabled, the start and stop frequencies for each enabled range,
the limits for each enabled range, the mask type and more.
xxx
SignalVu-PC Printable Help
411
Managing Data, Settings, and Pictures
Data, Settings, and Picture File Formats
Results Export File Format
The Results Export format contains trace points and/or scalar results produced by the measurement. The
file contains general information about the measurement settings at the top of the file and the results data in
the second part of the file. Groups of settings or results are headed with [text], as described below.
At the top of the file is the measurement name and the date and time data was acquired.
The first group of settings is [Global Parameters]. These settings include the Measurement Frequency,
Acquisition Data, Reference Level and others.
The second group of settings is [Parameters]. These settings are specific parameters which vary depending
on the measurement.
The next group is [Trace Parameters], which may not be present, depending on the measurement. Within
this group, there are parameters specific to a trace. There will be a Trace Parameters group for each
trace shown on the display.
The next group is [Results]. These are scalar results for the measurement.
Next is [Traces]. The Traces group consists of one or more [Trace] groups. There is one Trace group for
each trace. Each [Trace] group contains background information about the trace (units, number of points, x
scaling, and others depending on the measurement) at the top of the group, followed by the trace points.
Acquisition Data with Setup File (.tiq) Format
The file consists of two parts - the header that is in XML and the data that is in binary format.
Header. The header consists entirely of the DataFile element. This element is broken down into
sub-elements.
1. DataSetsCollection
2. Setup
DataSetsCollection. The DataSetsCollection contains a DataDescription element, a DataSet element,
and a ProductSpecific element.
Binary data. Binary data is a sequence of Int32 values, which are IQ pairs (I,Q,I,Q, ...) in binary Little
Endian format.
To convert these values to volts, multiply the individual values by the Scaling value in the DataDescription.
The binary data starts at an offset into the file == the "offset" attribute in the DataFile element. This
offset number will always start at the 19th character into the file (starting with 1), and will always be 9
characters long.
NOTE. You should not casually modify the XML header, because this will change the offset to the start of
the binary data.
412
SignalVu-PC Printable Help
Managing Data, Settings, and Pictures
Data, Settings, and Picture File Formats
Acquisition Data Files (.csv)
The acquisition data files have two sections. At the top of the file is the following information:
SamplingFrequency - The sampling frequency in Hertz.
NumberSamples - The number of IQ samples in the file.
DateTime - When the data was acquired.
Frequency - The center frequency in Hertz.
AcquisitionBandwidth - The acquisition bandwidth Hz.
Following the AcquisitionBandwidth are the data. The data are IQ pairs, in volts.
Groups of settings or results are headed with [some text].
The first thing in the file is the measurement name and the date/time when the acquisition was taken.
The first group [Parameters] are global parameters. Measurement Bandwidth in this group is the
measurement bandwidth used by the General Signal Viewing measurements (Spectrum, Amplitude vs.
Time, etc). It also includes some source settings, like Acq BW, Dither, Preamp, and RF Attenuation.
The second group [Parameters] are measurement-specific parameters.
Another group which can occur is [Trace Parameters]. Within this group, there will be a set of parameters,
one for each trace that is currently shown.
Another group is [Results]. These are scalar results for the measurement.
Another group is [Traces]. It has [Trace] groups under it, one for each trace. Each [Trace] group has
some background information about the trace (units, number of points, x scaling, etc), and the trace
points themselves.
Acquisition Data Files (.mat)
The acquisition data files saved in MATLAB format contain the following MATLAB variables:
InputCenter - The center frequency in Hertz.
XDelta - The sample period in seconds.
Y - A complex array containing IQ pairs.
InputZoom - The acquisition bandwidth in Hertz.
The MATLAB format used to save acquisition data has the following properties and limitations:
Files are stored in MATLAB Level 5 format.
MATLAB Level 5 file size is limited to 2 GB.
SignalVu-PC Printable Help
413
Managing Data, Settings, and Pictures
Printing Screen Shots
The instrument acquisition memory limit is 1 GB (1.024 Gigabytes). Because of the way acquisition
data is processed, 1 GB of acquisition memory requires 2 GB of memory to store. When header
information (instrument settings) is added to the acquisition data, the resulting file size is >2 GB.
If acquisition memory is filled (1 GB), exporting the data to MATLAB format will result in a file that
exceeds 2 GB in MATLAB level 5 format. A PC with sufficient memory is required to open the file. If
memory is not sufficient, MATLAB will warn the user. To check how much acquisition memory is
filled, select Setup > Acquire > Sampling Parameters. When the instrument is stopped, or you are
analyzing a recalled data file, you can find the acquisition length under File > Acquisition Data Info.
Printing Screen Shots
You can print screen shots (screen captures) two ways: use File > Print or save a picture file and print the
file using a separate graphics program. Printing a screen capture is the same as printing with any windows
program. For details on the available file formats for saving a screen capture, refer to Data, Settings, and
Picture File Formats (see page 410). For details on saving a picture to a file, see Saving and Recalling
Data, Settings, and Pictures (see page 403).
To print a screen shot:
1. Select File > Print.
2. Select File > Print Preview if you wish to review the screen shot before sending it to the printer.
3. Select File > Print to print the file to a printer.
414
SignalVu-PC Printable Help
Reference
Online Help
Online Help
Menu Bar: Help > User Manual
This menu item displays this help. The help is a standard Windows help system. The Online Help menu
item is the only method available to display the help; there are no other links to the help within the software.
About the Vector Signal Analysis Software
This window displays information about the SignalVu-PC software.
Version
At the top of the window is a line that displays the version of the SignalVu-PC software.
Installed Options
This text box lists the software options installed.
Hardware Information
This text box lists the serial number of the software and information about connected instruments.
SignalVu-PC Printable Help
415
Reference
Mapping Measurements
Copy Info
The Copy Info button copies the information to the Windows clipboard, which you can then paste into a
document. This information may be useful if you need to contact Tektronix about the software.
Mapping Measurements
The RSA Map software lets you record measurements on a geo-referenced map or a bitmap map for
documentation purposes. If an external GPS receiver is connected to the analyzer, measurements can be
mapped at the GPS coordinates where the measurement was taken. Using an external GPS receiver, RSA
Map can perform repeat measurements using either time or distance to initiate measurements. RSA Map
software can also save results for future reference or analysis.
To map measurements:
Select Tools > RSA Map. This launches the RSAMap software in a separate window.
Full documentation on how to use RSA Map is provided in the RSA Map Help. In RSA Map, select
Help > User Manual.
Menu Overview
The main menus are:
416
Menu
Description
File (see page 417)
Select measurements, open and save files, print documents, and preset.
View (see page 422)
Change display size, display the Marker toolbar and Status bar.
SignalVu-PC Printable Help
Reference
File Menu
Menu
Description
Replay (see page 385)
Replay measurements; select which record(s) to play, Replay/Stop/Pause, or enable
continuous loop.
Markers (see page 424)
Define markers and search for signal peaks.
Setup (see page 424)
Change settings for acquisition, analysis, and measurements.
Presets (see page 13)
Load and configure presets.
Tools (see page 425)
Perform searches and configure user preferences.
Window (see page 426)
Controls the size and layout of displays within the SignalVu-PC application.
xxx
File Menu
Command
Description
Recall (see page 417)
The Recall dialog enables you to recall saved data, setups and traces.
Save (see page 418)
Saves a file without asking for a file parameters (based on most recent settings).
Save As (see page 418)
Displays the Save dialog enabling you to specify the parameters of the save operation.
Save on trigger (see page 402)
Displays the Actions tab of the Trigger control panel which allows you to configure the
Save on Trigger function.
Acquisition save options (see
page 19)
Displays the Save and Export tab of the Options control panel which allows you to specify
how much data is saved in acquisition files.
Acquisition data info (see
page 385)
Displays the Acquisition Info tab (see page 385) of the Replay control panel. The info
on this tab describes such acquisition parameters as acquisition bandwidth, sampling
rate, RF attenuation, and acquisition length.
Measurement Data Info (see
page 420)
Displays the characteristics of the most recently analyzed record in the display.
Print (see page 421)
Prints the selected display.
Print Preview (see page 421)
Displays a preview of the print output.
Exit
Closes the SignalVu-PC application.
xxx
Recall
Menu Bar: File > Recall
Application Toolbar:
Use the Recall command to load previously saved acquisition data, setups or trace data.
To Recall Data or Setups
1. Select File > Recall. This displays the Open dialog box.
SignalVu-PC Printable Help
417
Reference
Save / Save As
2. Select the file type to be recalled and click Open.
Save / Save As
Menu Bar: File > Save / Save As
Use Save / Save As to store acquisition data, setups, and traces. Save is also used to export traces, results
and pictures of the display for use in other programs.
Difference Between Save and Save As
Use Save As to specify what kind of data you want to save and where the data should be saved. Use Save
to quickly save the same data as you saved the last time you executed a Save, without having to specify the
data type and location.
For example, suppose you want to save a picture of a spectrum trace each time you adjust a circuit to
document how the adjustments affect the output of the circuit. The first time you want to save a picture of
the display, you will need to select Save As. From the Save As dialog box, you specify the type of data you
want to save (Picture of Selected Display) and specify the location of the saved file. As long as the Save
and Export option is set to automatically name saved files, the next time you want to save a picture of
the display, you can just press Save on the front panel and a picture of the selected display will be saved
without requiring you to type a file name or the location of the file to be saved.
418
SignalVu-PC Printable Help
Reference
Save / Save As
What Data Types Can Be Saved
Data type
Description
Acquisition Data
Acquisition data previously recalled can be exported with different settings. Data is saved
in a format readable only by SignalVu-PC, oscilloscopes running SignalVu software, or
RSA6100/RSA5100/SPECMON Series instruments.
Setup
Configuration information detailing instrument settings. Data can be saved in a
format readable only by SignalVu-PC, oscilloscopes running SignalVu software, or
RSA6100/RSA5100/SPECMON Series instruments.
Selected Trace
Saves the selected trace for later analysis by the analyzer. Data is saved in a
format readable only by SignalVu-PC, oscilloscopes running SignalVu software, or
RSA6100/RSA5100/SPECMON Series instruments.
Exported Traces and Numeric
Results
Save traces and results in a file format that can be used by other programs.
Pictures of the Display
Save screen images in graphic image file formats that can be used in other programs.
Exported Acquisition Data
Save acquisition data records in a file format that can be used by other programs.
Acquisition data can be saved in either comma-separated-variable format or MATLAB
format.
xxx
Data, Settings, and Picture File Formats (see page 410).
Options for Saving Pictures of the Display
Option
Setting
Description
Image
Format
PNG
Saves exported screen captures in Portable Network Graphics format.
JPG
Saves exported screen captures in Joint Photographic Experts Group (JPEG)
format.
BMP
Saves exported screen captures in Windows bitmap format.
xxx
SignalVu-PC Printable Help
419
Reference
Measurement Data Info
Measurement Data Info
The Measurement Data Info command in the File menu displays a listing of acquisition-related information
about the last data analyzed by the selected measurement. The last data can be from the current acquisition
or it could be from a recalled data file.
Acquisition Data
The Acquisition Data tab displays the sample rate and record length of the data received from the
oscilloscope or from a recalled oscilloscope waveform file.
420
SignalVu-PC Printable Help
Reference
Print
Print
Menu Bar: File > Print
Print displays the Windows Print dialog box for printing a screen capture of the display. To save ink when
printing, use the Colors tab to set the color scheme. See Options Settings .
Print Preview
Menu Bar: File > Print Preview
Print Preview shows how a print out will appear when it is printed.
SignalVu-PC Printable Help
421
Reference
View Menu
View Menu
The View menu enables you to control the display of items in the application window.
Command
Description
Full Screen (see page 422)
Toggles all views between full-screen size and user-selected size.
Replay Toolbar (see page 387)
Shows or hides the Replay toolbar.
Marker Toolbar (see page 366)
Shows or hides the Marker toolbar. Enables you to define Markers and perform Peak
searches.
Status Bar (see page 423)
Shows or hides the Status bar.
Navigator View
Selecting Navigator View adds the Time Overview display to the existing measurement
displays to provide a better perspective of the signal.
When the Navigator View is enabled, the Time Overview display is always located above
any other measurement displays and uses the maximum horizontal resolution of the
display area, regardless of the Window Tile setting.
Numeric Keypad
When selected, any time you place the cursor within a control or setting that takes an
numeric value, you are presented with a dialog box to easily enter a value.
For instance, placing the cursor in the Frequency setting, displays the following dialog
screen.
Use the arrow buttons to change the value.
Press the calculator icon to display a keypad that allows you to enter values and suffixes.
xxx
Full Screen
Menu Bar: View > Full Screen
When unchecked, clicking Full Screen resizes the application window to fill the screen. Full Screen mode
maximizes the application window, and turns off the application title bar.
When checked, clicking Full Screen restores the application window to its previous size. The application
title bar is restored.
422
SignalVu-PC Printable Help
Reference
Status Bar
Status Bar
The Status Bar displays information on specific instrument settings. It contains only status information; it
does not display any error information. The Status bar has no controls. It can be hidden.
Elements of the Status Bar
Run Status Indicators
Indicator
Description
Replaying
SignalVu-PC is analyzing recalled waveform or acquisition records.
Stopped
If Stopped is displayed, no analysis being performed. This can occur because the Stop
button has been pressed (when Replay is set to Loop) or because the software has just
been launched and no analysis has been performed yet.
xxx
Showing or Hiding the Status Bar
Select View > Status Bar to toggle the display of the Status bar.
Run Menu
(The Run menu is available only when connected to an RSA306 Spectrum Analyzer or an MDO4000B
instrument.)
The Run menu provides access to commands that control the signal acquisition.
SignalVu-PC Printable Help
423
Reference
Replay Menu
Command
Description
Run Single
Sets the acquisition mode to Single and runs one measurement/acquisition cycle.
If acquisition mode is already Single, selecting Run Single begins a new
measurement/acquisition cycle. If acquisition mode is Continuous, selecting Run Single
halts the current measurement/acquisition cycle after it completes.
Run Continuous
Sets the acquisition mode to Continuous and starts the measurement/acquisition cycle.
If acquisition mode is already Continuous, selecting Run Continuous toggles the
measurement/acquisition cycle between Run and Stop.
Resume
Restarts data acquisition, but does not reset accumulated results, such as Average
or MaxHold. This allows you to stop acquisitions temporarily, then continue. If the
accumulation is already complete, for example, 10 acquisitions or 10 averages have
already been completed, each subsequent Resume command will cause one more
acquisition to be taken, and its results added to the accumulation. Resume is not
available if instrument settings have been changed.
Abort
Immediately halts the current measurement/acquisition cycle.
xxx
Replay Menu
The Replay Menu (see page 385) allows you to run measurements using the data in a recalled acquisition
data file. You can use this to compute new results for old data after you change settings or measurements.
Markers Menu
The Markers menu provides to settings that define and control the location of markers.
Setting
Description
Peak (see page 364)
Moves the selected marker to the highest peak on the trace.
Next Peak >
Moves the selected marker to next peak depending on the setting chosen.
Marker to Center Frequency
Sets center frequency to the frequency of the selected marker.
Define Markers (see page 364)
Displays the Define Marker control panel.
xxx
Setup Menu
The Setup menu provides access to control panels that specify parameters for numerous signal analyzer
functions.
424
SignalVu-PC Printable Help
Reference
Presets Menu
Command
Description
Displays (see page 27)
Displays the Displays control panel.
Settings (see page 438)
Displays the Settings control panel for the selected display.
Trigger (see page 399)
(Available when connected to
an RSA306)
Displays the Trigger control panel.
Acquire (see page 393)
Displays the Acquire control panel.
Analysis (see page 377)
Displays the Analysis control panel.
Amplitude (see page 389)
Displays the Amplitude control panel.
Audio (see page 291)
(Available when connected to
an RSA306)
Displays the Audio demodulation panel.
xxx
Presets Menu
The Presets menu provides you access to instrument presets and preset options.
Command
Description
Main (see page 13)
Resets the instrument to factory defaults. Acquisition data and settings that have not
been saved will be lost.
DPX
Recalls the DPX presets.
Standards Presets
Recalls the Standards presets.
Application (see page 15)
Recalls the Application presets.
User (see page 15)
Recalls the User presets.
Preset Options (see page 13)
Displays a control panel where you can configure options for Presets.
xxx
Tools Menu
Provides access to several utilities for controlling instrument functions.
Command
Description
Mask Test (see page 371)
Enables you to locate and highlight specified signal levels in specified displays.
Activate License
Used to activate SignalVu-PC.
Manage Licenses
Used to activate a demo license or deactivate a license (used to move the license
between PCs).
Options
Displays the Options control panel.
xxx
Live Link Menu
Live Link allows you to connect your PC (with SignalVu-PC installed) to the following instruments:
SignalVu-PC Printable Help
425
Reference
Window Menu
MDO4000B Series instrument using USB, wireless, or LAN (SignalVu-PC with option CON required)
RSA306 using USB
By connecting to one of these instruments, you are able to view and analyze waveforms in real time
using the SignalVu-PC software.
You can find instructions for connecting to an instrument here (see page 20).
Elements of the Live Link Menu
Menu item
Description
Search for instruments
When attempting to connect to an MDO4000B instrument, use this menu to activate
TekVISA to search for MDO4000B instruments that are connected by USB or
through a LAN network.
An RSA306 connected via USB is automatically recognized by the software, so you
do not need to search for the instrument.
Connect to instrument
Select to view a list of currently connected instruments or to manually look for an
instrument.
Manually look for LAN
instrument
(Available with option CON.) Select to open a dialog window that allows you to enter
the IP address of an instrument to connect to.
Disconnect from instrument
Select to disconnect from the currently connected instrument. This is only available
when you are connected to an instrument.
xxx
Window Menu
Use the Window menu to arrange how windows are displayed. Displays can be set to appear full screen
(one display at a time) or with all (selected) displays visible at once. When all displays are visible at
once, you can rearrange the displays by dragging the title bar of a window (deselect Window > Lock
Windows to move displays around).
Command
Description
Close View
Closes the selected view.
Cascade
Positions windows in a cascade view (not available when Lock Windows is selected).
Tile Horizontally
Positions widows in a horizontal orientation (top to bottom).
Tile Vertically
Positions widows in a vertical orientation (side by side).
Lock Windows
Locks the windows into their current position, preventing them from being moved. If the
windows are locked, the Cascade arrangement is not selectable.
(List of windows)
A numbered list of open windows.
xxx
Help Menu
The Help menu provides access to the help and version information about SignalVu-PC.
426
SignalVu-PC Printable Help
Reference
Error and Information Messages
Command
Description
User Manual On-line
Displays the help.
User Manual (PDF)
Displays a PDF version of the help.
Application Reference (PDF)
Displays a PDF version of the RSA Application Manual.
Quick Start Manual (PDF)
Displays a PDF version of the SignalVu-PC Read This First manual.
About Tektronix Real Time
Signal Analyzer Software
Displays information about the SignalVu-PC software and installed options.
xxx
Error and Information Messages
The following list describes some of the common error and information messages that might appear
during instrument operation. Messages that apply specifically to one or more measurements appear in the
displays. Messages that pertain globally, such as those about hardware status, are shown in the Status Bar
at the bottom of the analyzer application window.
Acq BW too small for current setup
The display needs a wider acquisition bandwidth than what the current data record contains. This can be
due to any of the following reasons:
The sampling parameters are being manually controlled.
In the Acquire control panel > Sampling Parameters tab, set the Adjust control to All Auto to allow the
software to pick the sample rate and record length that it needs.
A display other than the one you intended has been selected. The selected display has requested
a smaller acquisition bandwidth to achieve a better accuracy or dynamic range for its particular
measurement.
Select the display that contains the message. Click Run if the instrument is not already acquiring data.
Acquisitions are not running and the measurement now requests a wider bandwidth than the last
acquisition.
Click Run to perform a new acquisition with a wider bandwidth.
The data is from a recalled TIQ file.
There is no way to increase the acquisition bandwidth for saved IQ data. You must adjust the
measurement settings so that less bandwidth is required.
Analysis failure: <description of error>
The instrument is unable to complete a measurement due to difficulty in characterizing the signal. For
example, due to either the signal or settings, the instrument may not be able to recognize a pulse so it
can compute the pulse measurements.
Try changing settings to improve analysis. For example, when Pulse Trace is displayed, try changing
the settings on the Settings > Params.
Analysis failure: Carrier detection failed
SignalVu-PC Printable Help
427
Reference
Error and Information Messages
The instrument was unable to locate a carrier signal. Try adjusting the Carrier Threshold or Integration
BW values, if the measurement has these controls.
Analysis Length was limited
This message appears if the "Results Length", the time over which the measurement computed its results,
is less than the Actual Analysis Length reported in the Analysis Time control panel tab and the Time
Overview display. The Results Length is indicated by the magenta line below the Time Overview graph.
This can occur because the acquisition contained more data samples than a measurement can process (for
example, digital demodulation is limited to 80,000 samples) or the measurement had to use some of the
first and last samples for pre-measurement processes.
Analysis length too small for current setup
Increase the Analysis Length or decrease the RBW (Spectrum, ACPR, MCPR).
Avg Tx not available in Volts units
The Average Transmitted Power measurement is not defined for Volts.
Can't get acquisition data record
No acquisition record currently exists in memory (run an acquisition or recall a file), or an error has
occurred. Repeat the acquisition.
Can't replay data from swept acq
The measurement could not produce results because it is a real-time only measurement but was asked to
reanalyze (Replay) an acquisition taken in swept mode.
Can't replay. Live data needed for swept settings
The measurement could not produce results because it was asked to reanalyze (Replay) the acquisition but
it is in Swept acquisition mode. Swept-mode measurements cannot analyze recalled data.
CISPR accuracy limited by acq memory. Adjust RBW or freq range
The CISPR function was applied, but the available data did not represent a long enough time to satisfy
CISPR requirements. Increasing RBW reduces the amount of time needed for analysis. Reducing
frequency range (for example, by reducing Span), decreases sample rate, allowing the available memory
to cover a longer time period.
If this data is from a saved file, the error cannot be cleared.
If this data is from a saved file, this error cannot be cleared.
This data was acquired when the input signal contained peaks greater than 6 dB above the Reference
Level setting.
If the data is from a file, this error cannot be cleared.
Data from unaligned instrument
The acquisition data was captured when the instrument was not aligned. This message refers to the
acquisition data currently being analyzed, but not necessarily to the current status of the instrument.
Measurements made on this data might not be accurate.
Disabled: data is from swept acquisition
428
SignalVu-PC Printable Help
Reference
Error and Information Messages
The display needs to run in real-time mode. The display associated with this message cannot run now
because it is not the selected display, and the selected display is performing multiple acquisitions (it is
in swept mode).
Change the settings of the selected display so it is performing real-time acquisitions.
Select the associated display to make it the selected display. When it is selected, it will force the
acquisition parameters to change to meet its own needs.
Frequency exceeds preamp range
This is a warning that signals below the minimum preamp operating frequency are likely to be severely
attenuated (this is 100 kHz for option 51, 1 MHz for option 50).
Needs swept acq or larger AcqBW - Acquire data while display is selected
The display is not running because it needs to perform multiple acquisitions (it must be in swept mode) but
it is not the selected display. Only the selected display can perform multiple acquisitions.
Select the display showing this message to give it control of acquisitions parameters.
Sometimes, only one display can work and the others will be blank and show errors. This happens when
different displays have conflicting demands on the acquisition data record.
Export failure: file not saved
An error occurred while exporting Results. The file was not created.
Export the results again.
Export failure: unable to open results file for export. File not saved.
The Export Results file could not be opened for writing, so the export of results was not completed.
Verify that there is sufficient free space on hard disk.
Insufficient data for CISPR. Acquire while display is selected
This message appears when a measurement is not the selected measurement and CISPR filters are selected.
Set the measurement to be the selected measurement and reacquire the signal.
IQ Processing Error: 8012
This message occurs in GP Digital Modulation displays. The most likely cause for this message is that
there are not enough symbols to analyze. This can happen if:
The Analysis Length is set too short. Increase the Analysis Length on the Analysis Time tab.
The Analysis Offset has pushed the Analysis Time so far out that the actual Analysis Length is too
short, even though the user-requested Analysis Length would have been long enough without the
excessive offset. Decrease the Analysis Offset on the Analysis Time tab.
The input signal is bursted, and the burst does not contain enough symbols.
Needs swept acq or larger Acq BW - Acquire data while display is selected
The display has one of two problems: It is not the selected display, which prevents it from controlling
the hardware acquisition parameters, and setting the acquisition mode to Swept; or its settings require a
wider data bandwidth.
SignalVu-PC Printable Help
429
Reference
Error and Information Messages
Select the display that you are interested in and it will change the acquisition to meet its own needs.
Increase the acquisition bandwidth manually or by changing the selected display's settings to cause
the wider bandwidth.
No Math trace: unmatched trace lengths
A math trace could not produced because the traces selected to generate the math trace do not have
the same number of points. This can easily happen if both traces are recalled, but were saved under
different “Points” settings. This can also occur if one of the selected traces is a live trace and the other
trace is a recalled trace.
In a Spectrum display, as long as one trace is live, you can change the “Points” setting (Setup >
Settings > Freq & Span tab) to match the recalled trace.
If you are using two recalled traces to generate the Math trace. You must recreate at least one of
the traces.
No burst detected
The Burst Detection Mode (see page 346) is On, but no burst was detected in the signal.
Check that the Threshold setting is properly set.
Not enough samples for current setup
The measurement was not able to run because the combination of analysis length, offset, and measurement
bandwidth relative to acquisition bandwidth, were such that not enough samples were available for the
measurement to analyze. This can occur when two or more displays are shown and one display requires
a wide acquisition bandwidth and another display requires a much narrower bandwidth. The display
requiring the much narrower bandwidth must decimate and filter the acquisition record which can result in
too few samples left for the measurement.
Increase the Analysis Length to provide more samples.
Close any displays you don't currently need.
Not enough samples – try increasing MeasBW
The measurement was not able to run because there are not enough samples available for the measurement
to analyze. The Settling Time measurement requires at least 256 samples. This can occur when two or
more displays are shown and one display requires a wide acquisition bandwidth and another display
requires a much narrower bandwidth. The display requiring the much narrower bandwidth must decimate
and filter the acquisition record which can result in too few samples left for the measurement.
Increase the Analysis Length to provide more samples.
Close any displays you don't currently need.
No FFT (not all pulses have results)
If a pulse cannot be measured (because its shape is too indistinct or it does not meet the parameters that
define a pulse (see page 238)), its results will be “- -" for every measurement on that pulse. The instrument
cannot compute an FFT.
No pulses found
430
SignalVu-PC Printable Help
Reference
Error and Information Messages
The instrument was unable to find any complete pulses in the signal.
Make sure the analysis length (see page 377) includes at least one complete pulse cycle, from before
one rising edge until after the next rising edge.
Pulse Detection Error
The instrument was unable to detect a pulse.
The pulse Measurement Filter (see page 238) needs to be smaller. Try reducing the bandwidth and/or
selecting the Gaussian filter.
Detection threshold is not set to the proper level for the signal. Adjust the Power threshold to detect
pulses (see page 238).
The pulse interval is too long for the current settings. Try decreasing the filter bandwidth (see
page 238), as this may reduce the number of data points to a manageable quantity.
RBW conflict. Increase Span or Analysis Length
The measurement is not running because the actual RBW used by the measurement is too large for the
current acquisition span. Typically, the analysis length is too short as well.
Either increase the span or increase the Analysis Length.
RBW decreased
The current span or acquisition bandwidth is too small to allow a wider RBW filter.
Increase the span or acquisition bandwidth if the decreased RBW is not acceptable.
RBW increased
The current Spectrum Length (or Analysis Length if Spectrum Length is not Independent) is too small
to allow the requested RBW.
Increase the Spectrum Length (or Analysis Length) if the increased RBW is not acceptable.
RBW limited by AcqBW to: XX Hz
The requested RBW is too close to the acquisition BW. Increase the frequency range of the measurement
(for example, Span).
RBW too small/large for current Acq BW
If the RBW is set manually, it is possible for the acquisition bandwidth to be incompatible with the
RBW setting.
Change the RBW setting.
Adjust the Acq BW setting, either directly (Setup > Acquire > Sampling Params: select on of the
manual modes) or by adjusting the measurement bandwidth of the selected display (Setup > Acquire >
Sampling Params: All Auto).
Recall error: Setup not completely restored
An error occurred while recalling a Setup file. Thus, the current setup may be a combination of settings
from the Setup file and the previous Setup.
SignalVu-PC Printable Help
431
Reference
Error and Information Messages
Recall the setup again.
Recall failure: problem with file or file contents
An error occurred while recalling a Setup, Trace or Data file. This can occur because of a problem opening
the file (operating system error) or because of a problem with the contents of the file.
Recall the file again.
Restoring acquisition data
This is a status message displayed while data is being restored from a file.
Save failure: file not saved
An error occurred while saving a Setup or Data file.
Save the file again.
Saving acquisition data
This is a status message displayed while data is being saved to a file.
Selected VBW does not use full Spectrum Length
This message can occur when the Spectrum Length is greater than required for the VBW filter. If you
look at the Time Overview display, the Magenta line for Results Length indicates the part of the Spectrum
Length that was actually used. The measurement results are correct, but don't include some of the data in
the selected Spectrum Length. To clear this message, you can set the Spectrum Length to Auto.
Setup error: <description of error>
When this message appears, it includes text that explains the problem. For example, the ACPR display
might show: “Setup error: channels can’t overlap”. Setup errors are the result of conflicts in instrument
settings. These types of errors occur when a user makes manual changes to settings. In the example
above, the channel settings in the Channel Power and ACPR display have been set so that the channels
overlap in frequency.
Adjust the instrument settings, or change a setting back to Auto, to eliminate the error.
Setup error: Integration BW exceeds Measurement BW
When this message appears, it includes text that explains the problem. Setup errors are the result of
conflicts in instrument settings. These types of errors occur when a user makes manual changes to settings.
Adjust the instrument settings, or change a setting back to Auto, to eliminate the error.
Setup error: Measurement time for Freq & Phase results
The Measurement time for Freq & Phase results (see page 240) specifies how far across the pulse top the
instrument should wait before measuring the Phase Difference and Frequency Difference for each pulse.
If this value is set too large for any of the pulses in the signal, the measurement point ends up on the
falling edge or during the pulse off time.
Decrease the Measurement time for Freq & Phase results setting (Settings > Define tab).
Unexpected software error. Please cycle power and try again. If the problem persists, contact
your Tektronix Service Center.
432
SignalVu-PC Printable Help
Reference
Displaying the Windows Event Viewer
An unrecoverable error has occurred, and the instrument application software will shut down.
Relaunch the SignalVu-PC application.
VBW not applied - Acq BW too small
Increase VBW or measurement bandwidth. Make sure Sampling Parameters are set to Auto.
VBW not applied - Spectrum Length too short
This message occurs when the requested VBW can't be produced because the Spectrum Length is too short.
To clear this problem, set the Spectrum Length to Auto or manually increase the Spectrum Length (see
Setup > Analysis > Spectrum Time tab). If Spectrum Length is coupled to Analysis Length, set Analysis
Length to Auto or manually increase it (see Setup > Analysis > Analysis Time tab).
Displaying the Windows Event Viewer
When the analyzer generates an error message, information about the error is logged to the Windows
Event Viewer.
To display the Windows Event Viewer:
1. Select Start > Control Panel.
2. Select Administrative Tools. (If your instrument displays control panels in Category View, select
System and Security, and then select Administrative Tools.)
3. Double-click Event Viewer.
4. From the Event Viewer window, select Windows Logs, then select Application. This displays a list of
all errors that have been reported to the operating system from applications.
SignalVu-PC Printable Help
433
Reference
How to Find Out if Software Upgrades are Available
Errors reported to the Event Viewer from the analyzer application appear under Source as TekRSA.
5. Double-click the last error reported for TekRSA to see details on the most recently reported error.
Please note that many items reported as “errors” are simply informational and do not mean that your
instrument is impaired. Contact the Tektronix Customer Support Center or Service Center if you
are concerned about an error shown in the Event Viewer. Do not send an instrument out for repair
based solely on these event reports.
How to Find Out if Software Upgrades are Available
Software upgrades might be available can be downloaded from the Tektronix Web site. To see if a
software upgrade is available for your product, use your browser to go to www.tektronix.com/software.
Search by the product model number.
To add additional software options or features, you will need an option key from Tektronix. In some
instances, you may need to upgrade the product software before adding the new option key. Follow the
installation instructions provided with your software option.
Activating SignalVu-PC options in evaluation mode
If you don’t have a license for one (or any) SignalVu-PC options, you can activate each option in
evaluation mode for a period of 30 days.
434
SignalVu-PC Printable Help
Reference
Activating SignalVu-PC Options
NOTE. Each option has its own evaluation period.
To activate an option in evaluation mode:
1. Launch SignalVu-PC.
2. Go to Tools > Manage Licenses..., displaying the License Management dialog.
3. Select the option you want to evaluate, the select Start 30-day evaluation.
The Current Status box will change to display the number of days remaining for evaluation. Repeat
this procedure for each of the SignalVu-PC options you wish to evaluate.
Activating SignalVu-PC Options
Activating SignalVu-PC options requires internet access. However, you can activate SignalVu-PC on a
PC that does not have internet access by using a second PC that does have internet access to contact the
license server and use it to download a license file. The license file can then be transferred to the PC on
which SignalVu-PC is to be activated.
NOTE. In order to use any options you have purchased for SignalVu-PC, you must activate each option
individually.
Activating with Internet Access
To activate an option:
SignalVu-PC Printable Help
435
Reference
Activating SignalVu-PC Options
1. Launch SignalVu-PC.
2. Go to Tools > Activate License..., displaying the License Activation dialog.
3. In the dialog, select Auto.
4. In the Enter Activation Key text box, enter the option activation key provided when you purchased
the option.
5. Click OK in the License Activation window.
SignalVu-PC will contact the license server and install a license file provided by the license server.
6. Repeat the steps above to activate each option, using the activation key specific to each option.
Activating without internet access
To activate SignalVu-PC options on a PC without internet access, you need use the Offline Activation
Tool. The tool is provided with SignalVu-PC as a separate installation file.
To activate SignalVu-PC using a second PC to access the Internet:
1. Launch SignalVu-PC.
2. In the License Activation window, select Manual.
436
SignalVu-PC Printable Help
Reference
Managing SignalVu-PC Licenses
3. Write down the Host ID shown. Click Cancel to close the License Activation window.
4. Install the Activation Assistant software on a PC that has internet access.
The Activation Assistant software is located at:
If you installed SignalVu-PC from a DVD or USB flash drive, navigate to the device, open the
Offline Activation Tool folder, and run the Setup file located there.
If you downloaded SignalVu-PC from the Web, navigate to the location you extracted the
installation files. Open the Offline Activation Tool folder and run the Setup file located there.
5. Launch the Activation Assistant application. Follow the instructions to generate a license file. Repeat
this step for each option that you have purchased. You will also need the option activation key you
received.
Activation keys are specific to each option, therefore you must acquire a license file for each option
purchased.
6. Copy the license file (or files) to the following location the PC on which SignalVu-PC is to be activated:
C:\ProgramData\Tektronix\RSA\SignalVu-PC\License
7. Restart SignalVu-PC.
This completes the activation process for SignalVu-PC options.
Managing SignalVu-PC Licenses
SignalVu-PC options are licensed for use on a single PC. However, you can move SignalVu-PC and its
options from one PC to another PC by deactivating each option on the current installation and reactivating
them on another PC.
SignalVu-PC Printable Help
437
Reference
Settings
NOTE. Each activated SignalVu-PC option needs to be deactivated.
To deactivate SignalVu-PC options:
1. Launch SignalVu-PC and select Tools > Manage Licenses from the menu bar.
2. Use to the drop-down list under Option to select one of the SignalVu-PC options that is activated on
the PC. For example: OFDM Measurements (SignalVu-PC SVO).
NOTE. If your SignalVu-PC installation has options installed, be sure to deactivate all options.
3. Starting with each installed option, click Deactivate License. Continue selecting options and clicking
Deactivate License until all the SignalVu-PC options have been deactivated.
SignalVu-PC options are now deactivated. You can now install SignalVu-PC on another PC and
activate the options in the new installation.
Settings
Menu Bar: Setup > Settings
The Settings menu item enables access to control panels that allow you to change settings for the selected
display. The control panel that appears when you select Settings depends on the selected display. The
Settings control panel for the Spectrum display is shown in the following figure.
The control panel for the CCDF display is shown in the following figure.
Settings Control Panels
ACPR Settings (see page 108)
438
SignalVu-PC Printable Help
Reference
Settings
Acquire (see page 393)
AM Settings (see page 82)
Amplitude vs Time Settings (see page 64)
Analysis Settings (see page 377)
Audio Spectrum Settings (see page 293)
Audio Summary Settings (see page 295)
CCDF Settings (see page 127)
Channel Power and ACPR Settings (see page 108)
OFDM Channel Response Settings (OFDM (see page 207)) (WLAN (see page 115))
Constellation Settings (see page 309)
DPX Spectrum Settings (see page 42)
EVM vs Time Settings (see page 313)
Eye Diagram Settings (see page 316)
FM Settings (see page 89)
Frequency Deviation vs Time Settings (see page 318)
Frequency vs Time Settings (see page 66)
Magnitude Error Settings (see page 320)
MCPR Settings (see page 115)
Occupied Bandwidth Settings (see page 124)
OFDM Constellation Settings (see page 265)
OFDM EVM Settings (see page 177)
OFDM Magnitude Error Settings (see page 212)
OFDM Phase Error Settings (see page 181)
OFDM Power Settings (see page 184)
OFDM Summary Settings (see page 273)
OFDM Symbol Table Settings (see page 194)
Phase Error vs Time Settings (see page 322)
Phase vs Time Settings (see page 68)
PM Settings (see page 97)
Pulse Statistics Settings (see page 237)
Pulse Table Settings (see page 232)
SignalVu-PC Printable Help
439
Reference
Settings
Pulse Trace Settings (see page 235)
RF I Q vs Time Settings (see page 70)
Mask Test Limits Settings (see page 371)
Settling Time Settings (see page 141)
Signal Quality Settings (see page 328)
Spectrogram Settings (see page 59)
Spectrum Settings (see page 55)
Symbol Table Settings (see page 330)
Time Overview Settings (see page 48)
Trellis Diagram Settings (see page 333)
440
SignalVu-PC Printable Help
Glossary
Accuracy
Accuracy
The closeness of the indicated value to the true value.
ACLR
Adjacent Channel Leakage power Ratio is the ratio of the RRC (Root Raised Cosine) filtered mean power
centered on the assigned channel frequency to the RRC filtered mean power centered on an adjacent
frequency (defined in 3GPP).
ACPR Measurement
Adjacent Channel Power Ratio (ACPR) is the ratio of the mean power centered on the assigned channel
frequency to the mean power centered on an adjacent channel frequency. In the 3GPP specification, it
is called ACLR (Adjacent Channel Level Ratio) and both the main channel and adjacent channels are
required to be filtered with RRC (Root Raised Cosine) filters.
Acquisition
A series of time-contiguous frames. This is also called a Block.
Analysis Length
The length of time in the Analysis Time.
Analysis Time
The portion of the acquisition record over which one or more measurements are calculated.
SignalVu-PC Printable Help
441
Glossary
ASK
ASK
Acronym for Amplitude Shift Keying. The process, or result of a process, in which the amplitude of the
carrier is varied in accordance with the state of a digital input signal.
Block
An integer number of time-contiguous frames. See also: Acquisition.
Calibrator
A signal generator producing a specified output used for calibration purposes.
Carrier
The RF signal upon which modulation resides.
Carrier Frequency
The frequency of the CW component of the carrier signal.
Carrier Signal
The electrical signal, typically a sine wave, upon which modulation is impressed.
Carrier-to-Noise Ratio (C/N)
The ratio of carrier signal power to average noise power in a given bandwidth surrounding the carrier;
usually expressed in decibels.
442
SignalVu-PC Printable Help
Glossary
CCDF - Complimentary Cumulative Distribution Function
CCDF - Complimentary Cumulative Distribution Function
The Complementary Cumulative Distribution Function (CCDF) represents the probability that the peak
power above average power of a measured signal exceeds a threshold.
CCDF is a plot of the percent of time that a signal's power value exceeds it average value versus the
amount by which it exceeds the average. The CCDF plot has a log of probability on the Y-axis (100% at
the top) and dB above average amplitude on the X-axis (0 at the left).
CDMA
Acronym for Code Division Multiple Access.
Center Frequency
The frequency corresponding to the center of a frequency span of the analyzer display.
Check Mark Indicator
The check mark indicator in the upper-left corner of the display indicates the display for which the
acquisition hardware is optimized. When you have more than one display open, the display with the
check mark indicator has control over the acquisition hardware. To give a display priority over any
others, click its title bar.
When Best for multiple windows is selected in the Amplitude control panel's RF & IF Optimization control,
none of the measurement displays shows a checkmark, as there is not a single optimized measurement.
CISPR
International special committee on radio interference. (Comité international spécial des perturbations
radioélectriques)
CW
Acronym for Continuous Wave.
SignalVu-PC Printable Help
443
Glossary
CW Signal
CW Signal
Continuous wave signal - a sine wave.
DANL
Acronym for Displayed Average Noise Level. See Sensitivity (see page 454).
dBfs
A unit to express power level in decibels referenced to full scale. Depending on the context, this is either
the full scale of the display screen or the full scale of the analog-to-digital converter (ADC).
dBm
A unit of expressed power level in decibels referenced to 1 milliwatt.
dBmV
A unit to express voltage levels in decibels referenced to 1 millivolt.
dBuV
A unit to express voltage levels in decibels referenced to 1 microvolt.
Decibel
Ten times the logarithm of the ratio of one electrical power to another.
444
SignalVu-PC Printable Help
Glossary
Detection
Detection
The process by which a long waveform is decimated (reduced) down to the desired number of trace points,
by dividing the waveform into intervals and choosing a single value to represent each interval in the trace.
Display Reference Level
A designated vertical position representing a specified input level. The level may be expressed in dBm,
volts, or any other units.
Distortion
Degradation of a signal, often a result of nonlinear operations, resulting in unwanted signal components.
Harmonic and intermodulation distortion are common types.
Dynamic Range
The maximum ratio of the levels of two signals simultaneously present at the input which can be measured
to a specified accuracy.
EVM
Acronym for Error Vector Magnitude.
Export
Save data to a file in a format other than application-native.
FastFrame
FastFrame segments the acquisition record into a series of frames and then captures acquisitions as single
frames. You can then view and measure each frame individually.
SignalVu-PC Printable Help
445
Glossary
FFT
FFT
Fast Fourier Transform - a mathematical process to calculate the frequency spectrum of a discrete number
of time domain sample points.
Filter
A circuit that separates electrical signals or signal components based on their frequencies.
FM
Acronym for Frequency Modulation.
Frame
A series of time-contiguous samples, long enough in duration and at a sufficient sample rate to produce
a spectrum view of a specified span and RBW.
Frequency
A series of time-contiguous samples, long enough in duration and at a sufficient sample rate to produce
a spectrum view of a specified span and RBW.
Frequency Band
The continuous range of frequencies extending between two limiting frequencies, expressed in hertz.
Frequency Domain View
The representation of the power of the spectral components of a signal as a function frequency; the
spectrum of the signal.
446
SignalVu-PC Printable Help
Glossary
Frequency Drift
Frequency Drift
Gradual shift or change in displayed frequency over the specified time due to internal changes in the
analyzer, where other conditions remain constant. Expressed in hertz per second.
Frequency Range
The range of frequencies over which the performance of the instrument is specified.
Frequency Span
A continuous range of frequencies extending between two frequency limits.
Frequency Settling Time
The time measured from a reference point to when the signal of interest settles to within user-defined
tolerance.
GPIB
Acronym for General Purpose Interface Bus, the common name for the communications interface system
defined in IEEE Std. 488.
Graticule
The calibrated grid overlaying the display screen of analyzers, oscilloscopes, and other test instruments.
Grayed Out
An on-screen control is “Grayed Out” if it is not adjustable.
SignalVu-PC Printable Help
447
Glossary
I/Q
I/Q
Acronym for In-phase / Quadrature.
IF
Acronym for Intermediate Frequency.
Import
Bring data into the application from a file of some format other than application-native.
Impulse Response
The Impulse Response trace display shows normalized power on the vertical axis and time on the
horizontal axis.
Input Impedance
The impedance at the desired input terminal. Usually expressed in terms of VSWR, return loss, or other
related terms for low impedance devices and resistance-capacitance parameters for high impedance
devices.
LISN
Acronym for Line Impedance Stabilization Network.
Local Oscillator (LO)
An oscillator which produces the internal signal that is mixed with an incoming signal to produce the IF
signal.
448
SignalVu-PC Printable Help
Glossary
Marker
Marker
A visually identifiable point on a waveform trace, used to extract a readout of domain and range values
represented by that point.
Max Hold
Digitally stored display mode which, at each frequency address, compares the incoming signal level to
the stored level and retains the greater level. In this mode, the display indicates the peak level at each
frequency after several successive acquisitions.
MCPR (Multiple Carrier Power Ratio)
The ratio of the signal power in the reference channel or group of channel to the power in adjacent channels.
Min Hold
Digitally stored display mode which, at each frequency address, compares the incoming signal level to
the stored level and retains the lower level. In this mode, the display indicates the minimum level at
each frequency after several successive sweeps.
Modulate
To regulate or vary a characteristic of a signal, typically in order to transmit information.
Modulating Signal
The signal which modulates a carrier. The signal which varies or regulates some characteristic of another
signal.
SignalVu-PC Printable Help
449
Glossary
Modulation
Modulation
The process of varying some characteristic of a signal with a second signal.
Noise
Unwanted random disturbances superimposed on a signal which tend to obscure it.
Noise Bandwidth (NBW)
The exact bandwidth of a filter that is used to calculate the absolute power in dBm/Hz.
Noise Floor
The noise intrinsic to a system that represents the minimum limit at which input signals can be observed;
ultimately limited by thermal noise (kTB). The analyzer noise floor appears as a “grassy” baseline in the
display, even when no signal is present.
Open (Recall)
Bring data into the application from a file of application-native format.
OQPSK
Acronym for Offset QPSK (Quadrature Phase Shift Keying).
Phase Settling Time
The time measured from a reference point to when the signal of interest settles to within user-defined
tolerance.
450
SignalVu-PC Printable Help
Glossary
PM
PM
Acronym for Phase Modulation.
Primary Marker
The marker displayed in the Single Marker mode whose frequency and/or position is changed when
tuning with the general purpose knob.
PSK
Acronym for Phase Shift Keying. The process, or result of a process, in which the carrier phase is varied
discretely in accordance with a digital code.
QAM
Acronym for Quadrature Amplitude Modulation. The process, or result of a process, in which the amplitude
and phase of the carrier are varied concurrently by synthesizing two orthogonal ASK waves (see ASK).
Real-Time Analysis
Measurement technique based on triggering on an RF signal, seamlessly capturing it into memory, and
analyzing it in the frequency, time, and modulation domains.
Real-Time Bandwidth
The frequency span over which real-time seamless capture can be performed, which is a function of the
digitizer and the IF bandwidth of a Real-Time Signal Analyzer.
SignalVu-PC Printable Help
451
Glossary
Real-Time Seamless Capture
Real-Time Seamless Capture
The ability to acquire and store an uninterrupted series of time domain samples that represent the behavior
of an RF signal over a long period of time.
Reference Level
The signal level represented by the uppermost graticule line of the analyzer display.
Residual FM (Incidental FM)
Short term displayed frequency instability or jitter due to instability in the analyzer local oscillators. Given
in terms of peak-to-peak frequency deviation and expressed in hertz or percent of the displayed frequency.
Residual Response
A spurious response in the absence of an input signal. (Noise and zero pip are excluded.)
RBW
The RBW determines how well the analyzer can resolve or separate two or more closely spaced signal
components.
Ripple
The Ripple measurement result is displayed in either Watts or Volts. The amplitude units selected on
the Setup > Analysis > Units tab determine whether the measurement is presented in Watts or Volts.
Volts are shown for linear units (for example, volts or amps); Watts are shown for non-linear units (for
example, watts or dBm).
452
SignalVu-PC Printable Help
Glossary
Secondary Marker
The Ripple measurement, in Watts, is calculated as follows:
Where:
DelPos = Delta Positive in Volts
RefPos = Reference Positive in Volts
DelNeg = Delta Negative in Volts (this is a positive value)
RefNeg = Reference Negative in Volts
The Ripple measurement, in Volts, is calculated as follows:
Where:
RatioPosV = DelPos/RefPos
RatioNegV = DelNeg/RefNeg
Secondary Marker
The “second” marker displayed only in the Delta Marker mode.
SignalVu-PC Printable Help
453
Glossary
Sensitivity
Sensitivity
Measure of a analyzer’s ability to display minimum level signals, usually expressed as displayed average
noise level (DANL (see page 444)).
Shape Factor (Skirt Selectivity)
The ratio of the frequency separation of the two (60 dB/3 dB) down points on the response curve to the
static resolution bandwidth.
Signal
As used in this help, the signal refers to the input signal before it is processed. The signal is an input.
Span
Span is the range of frequencies displayed in a spectrum window. Span, start frequency and stop frequency
are related by the following equation: Span = (stop frequency) - (start frequency). The settings for center,
start and stop frequencies are related to the setting for span; when one parameter is changed, the others are
changed automatically.
Span Per Division (Span/Div)
Frequency difference represented by each major horizontal division of the graticule.
Spectrogram
Frequency vs. time vs. amplitude display where the frequency is represented on the x-axis and time on the
y-axis. The power level is indicated by variations in color.
454
SignalVu-PC Printable Help
Glossary
Spectrum
Spectrum
The frequency domain representation of a signal showing the power distribution of its spectral component
versus frequency.
Spectrum Analysis
The technique or process of determining the frequency content of an RF signal.
Spectrum Analyzer
A device for determining the frequency components of a signal.
Spectrum Time
Analysis Time for spectrum analysis views. Spectrum time can be the same as Analysis Time, but it
can be different.
Spur
A spur is a signal peak that exceeds a user-definable threshold (See Spurious > Settings > Ranges) and
excursion setting. A spur that also exceeds a limit (either Absolute or Relative) specified on the Settings
> Limits tab is considered a violation.
Spurious Response
A response to a analyzer wherein the displayed frequency is not related to the input frequency.
Time Measurement
This is the time in seconds relative to the time reference point in the first acquisition record in the data set.
SignalVu-PC Printable Help
455
Glossary
Time Reference
Time Reference
The point in time during the acquisition record used as the zero point for counting time. The time reference
can be set to either the start of the acquisition record or the trigger point.
Trace
As used in this help, trace refers to the displayed signal. The displayed signal can be a processed version of
the input signal (for example, it may be averaged.) The trace is a result or output.
Vector Signal Analyzer
Like a spectrum analyzer, a device for determining the frequency components of a signal. However, unlike
a standard spectrum analyzer, the vector signal analyzer is optimized for analyzing digitally modulated
RF signals.
Vertical Scale Factor, Vertical Display Factor
The number of dB, volts, etc., represented by one vertical division of a spectrum analyzer display screen.
Violation
A violation is a spur that exceeds either an Absolute or Relative limit (depending on the selected mask)
specified on the Settings > Limits tab. A spur is a signal peak that exceeds a user-definable threshold (See
Spurious > Settings > Ranges) and excursion setting.
456
SignalVu-PC Printable Help
Index
Index
Symbols and Numbers
-6dB RBW (MIL) Filter shape
Spectrum display BW tab, 76
3-D Spectrogram display, 56
3-D Waterfall
Spectrogram/DPXogram, 61
Spectrogram/DPXogram
display, 45
A
About the Software, 415
accuracy, 441
ACLR, 441
ACLR measurement, 108
ACPR measurement, 441
Acq Data
Replay menu, 385
Acq Data/DPX Spectra, 383
Acquire control panel, 393
acquisition, 441
acquisition data
saving, 403
Acquisition data files, 19
Acquisition Data tab, 420
Acquisition Info tab, 384
acquisition memory usage, 395
Actions tab
Search, 376
Triggering, 402
activating SignalVu-PC, 435
adaptive equalizer, 340
Adjacent Channel Power
measurement, 108
Adjacent Channel Power
Ratio, 29
Advanced Params tab
OFDM Analysis
displays, 224
Advanced Params Tab
GP Digital Modulation
displays, 342
Advanced tab
Triggering, 401
SignalVu-PC Printable Help
+AM, 33
AM display, 33
-AM
AM display, 33
AM display, 81
AM measurements, 33
Ampl Scale tab
DPXOgram display, 45
Amplitude control panel, 389
Amplitude vs. Time display, 63
Amplitude vs. Time display
Settings, 64
Analysis control panel, 377
analysis length, 441
Analysis Params tab
P25 Analysis displays, 283
WLAN Analysis
displays, 196
analysis time, 441
Analysis Time tab
GP Digital Modulation
displays, 346
OFDM Analysis
displays, 225
Options control panel, 18
P25 Analysis displays, 283
WLAN Analysis
displays, 199
Analysis Time tab (Analysis
control panel), 377
APCO P25 measurements, 34
Application preset
modulation analysis, 15
pulse analysis, 16
spectrum analysis, 17
Time-Frequency analysis, 17
application presets
saving, 403
Application presets, 13
Apply ampl corrections, 241
APSK parameters, 344
arranging windows, 426
ASK, 442
Audio BW, 297
setting, 297
Audio Demod tab, 291
audio filters
custom, 301
Audio Filters tab
Audio Analysis displays, 299
Audio Freq
Audio Summary display, 294
Audio Spectrum display, 292
Audio Spectrum settings, 293
Audio Summary settings, 295
Auto trigger position, 401
automatically generate
filenames, 18
Automatically increment
filename/number, 19
Average Channel Power
measurement, 108
Average ON Power, 34
Average Transmitted Power, 34
Averaging
Audio Analysis displays, 299
Params2 tab, 299
B
black text
settling time
measurements, 136
Blackman-Harris 4B Filter Shape
Spectrum display BW tab, 76
Blizzard color scheme, 20
block, 442
Burst detect threshold, 91
BW Tab
Amplitude vs. Time
display, 65
DPXOgram display, 76
Spectrum display, 76
C
C4FM modulation type
measurements, 33
457
Index
C4FM signal quality
measurements, 328
calibrator, 442
Carr Freq Err
Audio Summary display, 294
carrier, 442
carrier frequency, 442
Carrier frequency detection, 98
Carrier Frequency Error, 33
Carrier Power
Audio Summary display, 294
carrier signal, 442
carrier-to-noise ratio (C/N), 442
CCDF, 29
CCDF - Complimentary
Cumulative Distribution
Function, 443
CCDF display, 126
CDMA, 443
center frequency, 443
Channel Power, 29
Channel Power and ACPR
(Adjacent Channel Power
Ratio) display, 105
Channel Power and ACPR
Settings control panel, 108
Channel Power measurement, 108
Channel Response
OFDM, 29
WLAN, 30
Channels tab
Channel Power & ACPR
display, 109
Channels tab (MCPR), 119
check mark indicator, 443
Check mark indicator, 9
CISPR, 443
CISPR Filter shape
Spectrum display BW tab, 76
Classic color scheme, 20
Color (DPXogram)
DPXogram display, 45
Connect to instruments
LAN, USB, 425
Connect to MDO
Live Link, 425
458
Connect to RSA306
Live Link, 425
Connection
to an MDO4000B, 21
to an RSA306, 20
Connectivity, 20
Live Link, 425
Constellation
OFDM, 29
P25, 34
WLAN, 30
Constellation display, 308
displaying a second trace, 349
Constellation display
settings, 309
Convergence
Equalizer tab, 341
correction tables, 389
Creating presets, 13
CW, 443
CW signal, 444
D
DANL, 444
Data file formats, 410
Data properties
File menu, 420
Data Range tab
OFDM Analysis
displays, 225
WLAN Analysis
displays, 198
dBfs, 444
dBm, 444
dBmV, 444
dBuV, 444
De-emphasis
Audio Filters tab, 300
deactivating SignalVu-PC, 437
decibel, 444
Default
P25 limits table, 270
default settings, restore, 13
Define Markers, 364
Define Peaks tab, 365
Define tab, 371
Pulsed RF displays, 240
Settling Time displays, 142
Delta Frequency, 36
Delta Markers, 364
Demod I&Q vs Time display
settings, 312
Demodulation
audio, 291
detect
AM display, 85
FM display, 92
General Signal Viewing
displays, 73
PM display, 100
Time Overview, 51
detection, 445
AM display, 85
FM display, 92
General Signal Viewing
displays, 73
PM display, 100
Time Overview, 51
Detection
DPX display, 43
detector
AM display, 85
FM display, 92
General Signal Viewing
displays, 73
PM display, 100
Time Overview, 51
Deviation, 33
Diff
Audio Summary display, 295
Digital Phosphor Spectrum, 37
Disconnect from instruments
Live Link, 425
display reference level, 445
Displays
arranging, 27
Frequency Settling Time, 133
interactions between, 27
OFDM Channel
Response, 205
OFDM Constellation, 208
OFDM EVM, 209
OFDM Mag Error, 213
OFDM Phase Error, 215
OFDM Power, 217
OFDM Spectral Flatness, 211
SignalVu-PC Printable Help
Index
OFDM Summary, 219
OFDM Symbol Table, 221
P25 Constellation, 263
P25 Eye Diagram, 265
P25 Power, 268
P25 Summary, 270
P25 Symbol Table, 273
Phase Settling Time, 133
selecting, 27
SEM (Spectrum Emission
Mask), 149
WLAN Channel
Response, 171
WLAN Constellation, 174
WLAN EVM, 176
WLAN Mag Error, 178
WLAN Phase Error, 181
WLAN Power, 182
WLAN Spectral Flatness, 185
WLAN Summary, 187
WLAN Symbol Table, 192
distortion, 445
documentation, 3
DPX display
DPXogram, 37
Frequency, 37
Phase, 37
Spectrum, 37
Zero Span, 37
DPX Spectra
Replay menu, 385
DPX Spectra/Acq Data, 383
DPX Spectrum settings, 42
DPXogram
DPX display, 37
Droop, 35
Droop dB, 35
Duty Factor (%) measurement, 34
Duty Factor (Ratio)
measurement, 34
dynamic range, 445
E
Elements of the display, 9
Enable EQ Export
Equalizer tab, 341
Enable Equalization
Equalizer tab, 341
SignalVu-PC Printable Help
Equalizer tab
GP Digital Modulation
displays, 340
error message
Windows Event Viewer, 433
Error messages, 427
Evaluation mode
for options, 434
Event tab (Triggering), 400
Event Viewer, 433
EVM, 31
OFDM, 29
WLAN, 30
EVM tab
WLAN Analysis
displays, 203
EVM vs. Time display, 312
EVM vs. Time Settings, 313
export, 445
External Gain value, 389
External Gain/Loss Correction
tab, 389
External Loss Tables, 389
Eye Diagram
P25, 34
Eye Diagram display settings, 316
F
Fall Time, 34
FastFrame, 445
FFT, 446
File formats, 410
file formats supported
waveform, 404
File Menu, 417
filter, 446
Filter Parameter
GP Digital Modulation
displays, 335
Filter Shape
Spectrum display BW tab, 76
Find tab
GP Digital Modulation
displays, 346
finding bursts in data
GP Digital Modulation
displays, 346
Flatness
OFDM, 29
WLAN, 30
FlatTop (CW ampl) Filter Shape
Spectrum display BW tab, 76
FM, 446
FM display, 87
FM measurements, 33
frame, 446
Freq & BW tab
RF I & Q vs Time display, 71
Freq & BW Tab
GP Digital Modulation
displays, 339
Freq & Span tab
General Signal Viewing
displays, 72
Freq Dev vs Time
P25, 34
Freq Deviation, 33
Freq Diff, Phase Diff setting, 242
Freq Error, 33
Freq Estimation tab
Pulsed RF displays, 245
Freq, Span & RBW tab
Channel Power & ACPR
display, MCPR
display, 117
RF Measurements
displays, 162
Freq-domain Linearity
setting, 240
frequency, 446
Frequency
DPX display, 37
frequency band, 446
Frequency Dev vs Time (P25)
display, 276
Frequency Dev vs. Time (P25)
Settings, 278
Frequency Deviation vs. Time
settings, 318
frequency domain view, 446
frequency drift, 447
Frequency Error, 326
GP Digital Modulation
displays, 339
459
Index
Frequency Offset
GP Digital Modulation
displays, 339
frequency range, 447
Frequency Reference , 396
frequency settling time, 447
measuring, 138
Frequency Settling Time
display, 133
Frequency Settling Time
settings, 141
frequency span, 447
Frequency tab, 379
Frequency vs. Time display, 65
Frequency vs. Time Settings, 66
Full Screen, 422
G
Gain Imbalance, 326
GPIB, 447
graticule, 447
Graticule On/Off
RF Measurements
displays, 167
grayed out, 447
H
Hanning Filter Shape
Spectrum display BW tab, 76
Help Menu, 426
Hide sensitive readouts, 18
Hide Sensitive readouts, 19
Histogram readout
Pulsed RF displays, 248
HPF
Audio Filters tab, 300
Hum & Noise
Audio Summary display, 304
I
I/Q, 448
IF, 448
Ignore Region
Params2 tab, 299
import, 448
Impulse Response Amplitude, 36
Impulse Response setting, 241
460
Impulse Response Time, 36
Information messages, 427
input impedance, 448
Installed options, 3
Internal attenuator (Internal
Settings tab), 389
IQ Origin Offset, 326
IQ Sampling Parameters tab, 395
IQ vs. time view, 69
is greater than (Test), 372
is greater than mask, 371
is inside mask, 371
is inside mask (Test), 373
is less than (Test), 372
is less than mask, 371
is outside mask, 371
is outside mask (Test), 373
K
Kaiser (RBW) Filter Shape
Spectrum display BW tab, 76
Keep-out time, 241
Keypad, 422
L
LAN connection
Live Link, 425
Length, 33
Equalizer tab, 341
Levels tab
Pulsed RF displays, 245
license
activating, 435
deactivating, 437
moving to another PC, 437
Limit lines, 371
Limits
P25 default, 270
Limits tab
P25 Analysis displays, 290
Link to Span, 71
LISN, 448
Live Link, 20
local oscillator (LO), 448
Lock Center Frequency of
Spectrum displays, 379
Lock Center Frequency of
Spectrum displays to
Measurement Frequency
Frequency tab, 380
Log
Audio Spectrum display, 303
Log (Horizontal)
Spectrum display, 56
Loop over all selected records
Replay menu, 385
LPF
Audio Filters tab, 300
M
Mag Error, 31
OFDM, 29
WLAN, 30
Magnitude Error vs. Time
display, 319
Magnitude Error vs. Time
settings, 320
Main
presets, 13
manuals, 3
marker, 449
Marker Noise mode, 367
Marker Properties tab, 364
Marker to Center Frequency, 364
Markers, 366
Marker Toolbar, 366
Using Markers, 361
Using Markers in Noise
Mode, 367
Markers menu, 424
Mask Editor, 371
Mask tab
Settling Time displays, 145
Mask Test, 371
mask testing
settling time
measurement, 129
MATLAB file format, 410
Max Freq Error, 35
max hold, 449
Max number of pulses
Pulse Table display, 238
Max Number of Pulses
Params tab, 239
SignalVu-PC Printable Help
Index
Max Phase Error, 35
Max total files saved per Run, 402
Max trace points, 67
Settling Time displays, 149
MCPR
P25, 34
MCPR (multiple carrier power
ratio), 449
MCPR display, 111
MCPR settings, 115
Meas BW
Frequency Settling Time, 142
Meas Frequency
Frequency Settling Time, 142
Measurement BW, no filter, 71
Measurement Filter
GP Digital Modulation
displays, 335
Params tab, 239
Measurement Frequency, 379
Frequency tab, 380
Measurement Length
Time Params tab, 144
Measurement Params tab
Channel Power & ACPR
display, MCPR
display, 117
Measurement point, 242
Measurement settings export, 403
Measurements, 29
Measurements tab, 233
measuring settling time, 138
Menus, 416
MER (RMS), 31
min hold, 449
Min Settled Duration
Time Params tab, 144
Mod Distor
Audio Summary display, 295
Mode
Equalizer tab, 341
modulate, 449
modulating signal, 449
modulation, 450
Modulation analysis
application presets, 15
modulation measurements, 307
Modulation measurements, 31
SignalVu-PC Printable Help
Modulation Params tab
GP Digital Modulation
displays, 335
OFDM Analysis
displays, 223
P25 Analysis displays, 280
WLAN Analysis
displays, 195
Modulation types supported, 335
moving windows, 426
Multi-Carrier Power Ratio, 29
Multiple Carrier Power Ratio, 115
N
Navigator View, 422
nFSK modulation type
measurements, 33
nFSK signal quality
measurements, 327
No. of Harmonics
Params2 tab, 299
No. of Non-Harmonics
Params2 tab, 299
noise, 450
noise bandwidth (NBW), 450
noise floor, 450
Noise markers, 367
Non-Harmonic Excursion
Params2 tab, 299
Non-Harmonic Threshold
Params2 tab, 299
Numeric keypad, 422
O
OBW Level Left/Right, 121
OBW Ref Power, 121
Occupied Bandwidth, 124
Occupied Bandwidth
settings, 124
Occupied BW display, 121
OFDM Channel Response
display, 205
settings, 205
OFDM Constellation
display, 208
settings, 209
OFDM EVM
display, 209
settings, 210
OFDM Mag Error
display, 213
settings, 214
OFDM Phase Error
display, 215
OFDM Power
display, 217
settings, 218
OFDM Spectral Flatness
display, 211
settings, 212
OFDM Summary
display, 219
settings, 220
OFDM Symbol Table
display, 221
settings, 222
Offset & Limits Table tab
SEM display, 157
Offset EVM, 327
online help, 415
Open (Recall), 450
Optimization
Channel Power & ACPR
display, MCPR
display, 117
Options
installed, 3
Options control panel, 18
OQPSK, 450
OQPSK and SOQPSK modulation
type measurements, 32
Overlap, 59
Overshoot, 35
Overshoot dB, 35
Overshoot settings, 243
P
P25
presets, 15
P25 Constellation
display, 263
settings, 265
P25 Eye Diagram
display, 265
461
Index
settings, 267
P25 limits, 270
P25 measurements, 34
P25 Power vs Time
display, 268
settings, 269
P25 Summary
display, 270
settings, 273
P25 Symbol Table
display, 273
settings, 275
Parameters tab
AM display, 83
CCDF display, 128
FM display, 91
Occupied BW display, 125
PM display, 98
SEM display, 153
Params tab
Pulsed RF displays, 238
Params1 tab
Audio Analysis displays, 296
Params2 tab
Audio Analysis displays, 299
Pass /Fail readout
SEM display, 151
Pass/Fail tests, 372
Pause
Replay menu, 386
+Peak
Audio Summary display, 295
-Peak
Audio Summary display, 295
Peak Excursion, 364
Peak FSK err, 33
Peak Mag Err, 33
Peak Power, 34
Peak Threshold, 364
Peak/Avg Ratio, 29
Peak-Peak/2
Audio Summary display, 295
Phase
DPX display, 37
Phase Deviation, 36
Phase Error, 31
OFDM, 29
462
WLAN, 30
Phase Error vs. Time display, 321
Phase Error vs. Time settings, 322
phase settling time, 450
measuring, 138
Phase Settling Time display, 133
Phase Settling Time settings, 141
Phase vs. Time display, 67
Phase vs. Time settings, 68
pictures
saving, 403
+Pk
FM display, 33
PM display, 34
-Pk
FM display, 33
PM display, 34
Pk-Pk
FM display, 33
PM display, 34
Pk-Pk/2
FM display, 33
PM, 451
PM measurements, 34
Power
OFDM, 29
Power Markers, 364
power measurements, 105
Power measurements, 29
Power Threshold to Detect Pulses
Params tab, 239
Power vs Time
P25, 34
WLAN, 30
Pre-defined Filters
Audio Filters tab, 300
Prefs tab
AM display, 87
FM display, 95
General Signal Viewing
Displays, 79
GP Digital Modulation
displays, 350
OFDM Analysis
displays, 229
Options control panel, 20
P25 Analysis displays, 289
PM display, 103
Pulsed RF displays, 248
RF Measurements
displays, 167
Settling Time displays, 149
WLAN Analysis
displays, 204
Presets, 13
Application, 13
Main, 13
P25, 15
recalling, 15
Standards, 13
User, 13
WLAN, 15
Presets tab
Options control panel, 18
primary marker, 451
Print, 421
Print Preview, 421
Processing tab
SEM display, 156
PSK, 451
Pulse analysis
application presets, 16
Pulse measurements, 231
Pulse Statistics display, 235
Pulse Statistics display
settings, 237
Pulse Table display, 231
Pulse Table settings, 232
Pulse Trace display, 233
Pulse Trace display settings, 235
Pulse Width, 34
Pulse-Pulse Freq Difference, 35
Pulse-Pulse Phase Difference, 35
pulses
how many can be
analyzed, 239
Q
QAM, 451
Quadrature Error, 31
R
Range file, 410
SignalVu-PC Printable Help
Index
RBW, 452
Channel Power & ACPR
display, MCPR
display, 117
real-time analysis, 451
real-time bandwidth, 451
real-time seamless capture, 452
recalling Presets, 15
Record, 396
red text
settling time
measurements, 136
Ref
Audio Summary display, 295
Ref Channel tab
SEM display, 157
Ref level (Internal Settings
tab), 389
Reference Filter
GP Digital Modulation
displays, 335
Reference Level, 452
Repetition Interval, 34
Repetition Rate, 34
Replay all selected records
Replay menu, 385
Replay control panel, 383
Replay current record
Replay menu, 385
Replay from selected
Replay menu, 385
Replay menu, 385
Replay Speed tab, 385
Replay toolbar, 387
Replay menu, 386
Reset Equalization
Equalizer tab, 341
residual FM (incidental FM), 452
residual response, 452
results
saving, 403
RF Channel Power
measurement, 107
RF I & Q vs. Time display, 69
RF I & Q vs. Time settings, 70
Rho, 326
Ripple, 35
Ripple dB, 35
SignalVu-PC Printable Help
Ripple measurement
calculation, 452
Ripple settings, 243
Rise Time, 34
RMS
Audio Summary display, 295
FM display, 33
PM display, 34
RMS Error Magnitude, 33
RMS FSK Err, 33
RMS Mag Err, 33
RMS Phase Error, 35
Run menu, 423
S
S/N
Audio Summary display, 295
Save acq data on Trigger, 402
Save and Export tab, 18
Options control panel, 19
Save on trigger, 402
Save picture on Trigger, 402
saved file types, 403
saving
acquisition data, 403
pictures, 403
results, 403
setups, 403
Saving
presets, 13
Saving and Recalling Data, 403
Scale tab
AM display, 86
Audio Analysis displays, 302
FM display, 94
General Signal Viewing
displays, 78
GP Digital Modulation
displays, 350
OFDM Analysis
displays, 227
P25 Analysis displays, 286
Phase Noise display, 102
Pulsed RF displays, 247
RF Measurements
displays, 166
SEM display, 160
Settling Time displays, 148
Spectrogram display, 61
Spectrum display, 56
WLAN Analysis
displays, 201
Search control panel, 376
Search for instruments
Live Link, 425
Search In, 372
secondary marker, 453
Security tab, 18
Options control panel, 19
Select all
Replay menu, 386
Select data records tab, 383
Select records from history
Replay menu, 386
SEM display, 149
sensitivity, 454
Set to max BW, 71
Settings, 438
AM display, 82
Audio Spectrum display, 293
Audio Summary display, 295
CCDF display, 127
Constellation display, 309
Demod I&Q vs Time
display, 312
DPX Spectrum, 42
EVM vs. Time display, 313
Eye Diagram display, 316
FM display, 89
Frequency Deviation vs.
Time, 318
Frequency Settling Time, 141
Frequency vs. Time, 66
Magnitude Error vs.
Time, 320
MCPR, 115
Occupied Bandwidth, 124
OFDM Channel
Response, 205
OFDM Constellation, 209
OFDM EVM, 210
OFDM Flatness, 212
OFDM Mag Error, 214
OFDM Phase Error, 216
OFDM Power, 218
OFDM Summary, 220
463
Index
OFDM Symbol Table, 222
Options control panel, 18
P25 Constellation, 265
P25 Eye Diagram, 267
P25 Frequency Dev vs.
Time, 278
P25 Power vs Time, 269
P25 Summary, 273
P25 Symbol Table, 275
Phase Error vs. Time, 322
Phase Settling Time, 137
Phase vs. Time, 68
Pulse Statistics display, 237
Pulse Table display, 232
Pulse Trace display, 235
restoring defaults, 13
RF I & Q vs. Time, 70
Signal Quality, 328
Spectrogram display, 59
Spectrum display, 55
Spectrum Emission
Mask, 153
Symbol Table display, 330
Time Overview display, 48
Trellis Diagram display, 333
Trigger, 399
WLAN Channel
Response, 171
WLAN Constellation, 175
WLAN EVM, 177
WLAN Mag Error, 179
WLAN Phase Error, 181
WLAN Power vs Time, 184
WLAN Spectral Flatness, 186
WLAN Summary, 191
WLAN Symbol Table, 194
Settled Frequency
definition, 129
Settled Phase
definition, 129
settling time
measuring, 138
Settling Time, 128
definition, 129
Settling Time decimal places
Settling Time displays, 149
settling time measurement
text color, 136
464
Setup Menu, 424
setups
saving, 403
shape factor (skirt
selectivity), 454
Show graticule
General Signal Viewing
Displays, 79
Pulsed RF displays, 248
Settling Time displays, 149
Show Marker Readout in Graph
General Signal Viewing
Displays, 79
Pulsed RF displays, 248
RF Measurements
displays, 167
Settling Time displays, 149
Show recalled trace, 73
AM display, 84
FM display, 92
PM display, 99
Time Overview display, 51
signal, 454
Signal Power
Audio Summary display, 294
Signal Quality display, 323
Signal quality measurements, 326
Signal Quality settings, 328
SINAD
Audio Summary display, 295
span, 454
span per division, 454
Span/RBW Ratio
Spectrum display BW tab, 76
spectrogram, 454
Spectrogram display, 56
Spectrogram display settings, 59
spectrum, 455
Spectrum
DPX display, 37
spectrum analysis, 455
Spectrum analysis
application presets, 17
spectrum analyzer, 455
Spectrum Center Frequency, 379
Frequency tab, 380
Spectrum display, 53
Spectrum display settings, 55
Spectrum Emission Mask
display, 149
settings, 153
Spectrum Monitor
Spectrogram, 62
spectrum time, 455
Spectrum Time tab, 379
Spectrums/line, 59
Split
DPX display, 37
spur, 455
spurious response, 455
Standard
Audio Filters tab, 300
Standard Settings button, 334
Standards
presets, 13
Standards presets
P25, 15
WLAN, 15
Status Bar, 423
Stop
Replay menu, 386
Summary
P25, 34
WLAN, 30
supported file formats
waveform, 404
symbol maps, 351
Symbol Rate, 33
Symbol Rate Error, 33
Symbol Table
P25, 34
WLAN, 30
Symbol Table display, 329
Symbol Table display
settings, 330
T
Taps
Equalizer tab, 341
Taps/Symbol
Equalizer tab, 341
Target Reference
Frequency Settling Time, 143
Test For, 372
Test Patterns tab
P25 Analysis displays, 285
SignalVu-PC Printable Help
Index
Test using a mask, 373
THD
Audio Summary display, 295
Thunderstorm color scheme, 20
Time, 36
Time & Freq Scale tab
Spectrogram display, 61
Time measurement, 455
Time Overview, 47
P25, 34
Time Overview display
settings, 48
Time Params tab
Settling Time displays, 144
time reference, 456
time scale status readout, 59
Time-Frequency analysis
application presets, 17
TIQ acquisition data files, 19
TIQ acquisition data files
parameters, 19
TNHD
Audio Summary display, 295
Tolerance (+/-)
Frequency Settling Time, 143
Tools Menu, 425
Total AM
AM display, 33
Touch-screen Actions, 7
trace, 456
Trace 2
Constellation display, 349
Trace tab
AM display, 84
FM display, 92
GP Digital Modulation
displays, 348
OFDM Analysis
displays, 227
P25 Analysis, 286
PM display, 99
Settling Time displays, 145
Time Overview display, 51
WLAN Analysis
displays, 200
Traces tab
DPX display, 42
SignalVu-PC Printable Help
General Signal Viewing
displays, 73
RF Measurements
display, 163
Spectrogram display, 60
WLAN Channel Response
display, 200
Traces tab - Math Trace
General Signal Viewing
displays, 76
Transform Window
Spectrum display BW tab, 76
Trellis Diagram display
settings, 333
Trig Meas tab
P25 Analysis displays, 288
Trigger position, 401
auto, 401
Trigger settings, 399
Advanced tab, 401
Event tab, 400
Triggering, 397
Tutorials
YouTube videos, 4
U
Uniform (None) Filter Shape
Spectrum display BW tab, 76
Units tab, 382
USB connection
Live Link, 425
User Filters
file format, 357
loading, 356
User presets, 13
User Symbol Map, 344
V
VBW, 121
RF Measurements
displays, 162
Spectrum display BW tab, 76
vector signal analyzer, 456
vertical scale factor, vertical
display factor, 456
Video tutorials, 4
View
Navigator View, 422
View Menu, 422
violation, 456
W
Waterfall
Spectrogram/DPXogram, 61
Spectrogram/DPXogram
display, 45
waveform file formats
supported, 404
Window menu, 426
Windows Event Viewer, 433
WLAN
presets, 13
video tutorials, 4
WLAN Channel Response
display, 171
settings, 171
WLAN Constellation
display, 174
settings, 175
WLAN EVM
display, 176
settings, 177
WLAN Mag Error
display, 178
settings, 179
WLAN Phase Error
display, 181
WLAN Power vs Time
display, 182
settings, 184
WLAN Spectral Flatness
display, 185
settings, 186
WLAN Summary
display, 187
settings, 191
WLAN Symbol Table
display, 192
settings, 194
X
x dB BW Ref Power, 121
x dB Level, 125
465
Index
Y
Z
YouTube
Tektronix channel, 4
Zero Span
DPX display, 37
466
SignalVu-PC Printable Help