1
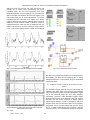
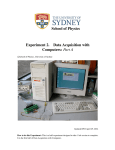
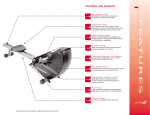
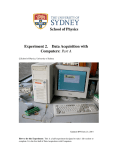
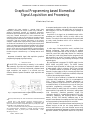
INTERNATIONAL JOURNAL OF CIRCUITS, SYSTEMS AND SIGNAL PROCESSING
Graphical Programming based Biomedical
Signal Acquisition and Processing
Mihaela Lascu, Dan Lascu
A computer based system consists of a few external hardware
components for isolation and amplification of the signals, a
data acquisition card and a software analysis package as
shown in Fig. 1.
Acquisition of the signal can be handled through built-in
procedures and LabVIEW’s ability to easily create a user
interface. The analysis of the received signal can be performed
by ready made procedures which can be obtained from
National Instruments.
Abstract—This paper describes a computer based signal
acquisition, processing and analysis system using LabVIEW, a
graphical programming language for engineering applications.
Biomedical signal acquisition has greatly advanced over the years,
using many different technologies. E series multifunction data
acquisition cards are used for the acquisition of biomedical signals
and the appropriate software NI-DAQ (National Instruments – Data
Acquisition). With the increasing performance of the personal
computer, computer based signal processing systems are becoming
an efficient and cost-effective way of acquiring and analyzing these
signals. The advanced analysis techniques available on the computer
are becoming invaluable to the practicing physician. The diagnostic
decision will be more accurate. Peak detection in electrocardiogram
(ECG) is one of the solved problems using LabVIEW and filtering
biomedical signals in different ways is a challenge that has to be
solved.
II. DATA ACQUISITION
Keywords—biomedical signal, data acquisition, graphical
programming language, signal processing.
I. INTRODUCTION
C
OMPUTERS are becoming a necessity in the medical
community. Physicians use computers for patient records
and information. It is obvious that personal computers based
signal acquisition and analysis is an efficient and cost
effective method of patient biomedical signal acquisition and
monitoring.
Fig. 1. Computer based biomedical signal acquisition and analysis
system.
Manuscript received April 11, 2007: Revised version received November 18,
2007.
Mihaela Lascu is with Politehnica University Timisoara, Faculty of
Electronics and Telecommunicatons, Department of Measurements and
Optical Electronics, Romania (corresponding author to provide phone: 0040256-275488; e-mail: mihaela.lascu@ etc.upt.ro).
Dan Lascu is with Politehnica University Timisoara, Faculty of Electronics
and Telecommunicatons, Department of Applied Electronics, Romania
(corresponding author to provide phone: 0040-256-275488;
e-mail:
dan.lascu@ etc.upt.ro).
Issue 4, Volume 1, 2007
317
A wide range of data acquisition cards is available from
National Instruments. These cards provide for multiple
channels of analog data input as well as output. In addition
LabVIEW comes with ready-made libraries for interfacing
with these DAQ cards. Using these libraries, programs for the
data acquisition are quickly and easily made for allowing
more time to be spent on the processing and analysis of the
acquired signals.
We used National Instruments PCI-6023E board from the
6023E, 6024E and 6025E family. The 6025E features
16 channels (eight differential) of analog input, two channels
of analog output, a 100-pin connector, and 32 lines of digital
I/O. The 6024E features 16 channels of analog input, two
channels of analog output, a 68-pin connector and eight lines
of digital I/O. The 6023E is identical to the 6024E, except that
it does not have analog output channels.
The NI-DAQ driver software is included with all National
Instruments DAQ hardware. NI-DAQ is not packaged with
SCXI (Signal Conditioning Extended Instruments) or
accessory products, except for the SCXI-1200. NI-DAQ has
an extensive library of functions that you can call from your
application programming environment. These functions
include routines for analog input (A/D conversion), buffered
data acquisition (high-speed A/D conversion), analog output
(D/A conversion), waveform generation (timed D/A
conversion), digital I/O, counter/timer operations, SCXI, selfcalibration, messaging, and acquiring data to extended
memory. NI-DAQ also internally addresses many of the
complex issues between the computer and the DAQ hardware
such as programming interrupts and DMA controllers.
NI-DAQ maintains a consistent software interface among its
different versions so that you can change platforms with
minimal modifications to your code. Whether we are using
conventional programming languages or National Instruments
application software, our application uses the NI-DAQ driver
INTERNATIONAL JOURNAL OF CIRCUITS, SYSTEMS AND SIGNAL PROCESSING
The boards have three different input modes—
nonreferenced single-ended (NRSE) input, referenced singleended (RSE) input, and differential (DIFF) input. The singleended input configurations provide up to 16 channels. The
DIFF input configuration provides up to eight channels. Input
modes are programmed on a per channel basis for multimode
scanning. It is possible to configure the circuitry to scan 12
channels - four differentially configured channels and eight
single-ended channels. Table 1 describes the three input
configurations. If conference, please contact your conference
editor concerning acceptable word processor formats for your
particular conference.
software, as illustrated in Fig.2.
Table I
Fig. 2. Relationship between the programming environment,
NI-DAQ and DAQ-Card.
After installing NI-DAQ device drivers we obtain on the
desktop of the computer an icon named MAX – Measurement
and Automation Explorer. This program is necessary for
identifying the presence of the DAQ-card and for settling the
channels that will be used.
Measurement and Automation Explorer (MAX) provides
access to our PCI-6023E DAQ acquisition card. MAX can
manage devices and interfaces, the installed National
Instruments software, virtual channels or tasks for the used
devices and as well it can create scales for the realised virtual
instrument, can configure the IVI – Interchangeable Virtual
Instrument drivers and import/export the device configuration
file.
An overview of the hardware functions of PCI-6023E board
is presented in Fig.3.
In our application we use the RSE – reference single ended
– configuration, for example between AICH1 (PIN 33) and
AIGND (PIN 32) for one channel. The boards have a bipolar
input range that changes with the programmed gain. Each
channel may be programmed with a unique gain of 0.5, 1.0,
10, or 100 to maximize the 12-bit analog-to-digital converter
Fig. 3. Typical block diagram of 6023E, 6024E and 6025E acquisition
cards.
Issue 4, Volume 1, 2007
318
Fig. 4. I/O connector pin assignment for the 6023E.
INTERNATIONAL JOURNAL OF CIRCUITS, SYSTEMS AND SIGNAL PROCESSING
(ADC) resolution. With the proper gain setting, you can use
the full resolution of the ADC to measure the input signal.
Because it was not possible to make an acquisition of a
biomedical signal in real time, we have studied at the
beginning the possibility for an electrocardiograph realisation,
that means the acquisition of a sinusoidal signal with an
amplitude of 1 mV and frequency of 1-2Hz from a function
generator. Then we have done the acquisition of an equivalent
signal for a biomedical signal that is specific for the heart
activity. Using the following block diagram from Fig.5, we
have an acquisition and a visualisation of the real signal and
the processed signal. Because there are a lot of imperfect
connexions from an electronic point of view, and there are a
lot of long linking wires in a polluted electromagnetic waves
environment and the input impedance is high the acquired
signal is noise disturbed. For filtering the disturbed signal it is
necessary to cascade two filters: the first filter is a low-pass
having a cutt-off frequency of 40Hz and the second filter is an
averaging Hanning filter [2].
When an ensemble of several realizations of an event is not
available, synchronized averaging will not be possible. We are
then forced to consider temporal averaging for noise removal,
with the assumption that the processes involved are ergodic
that is temporal statistics, may be used instead of ensemble
statistics. As temporal statistics are computed using a few
samples of the signal along the time axis and the temporal
window of samples is moved to obtain the output at various
points of time, such a filtering procedure is called a movingwindow averaging filter and is implemented in LabVIEW by
help of shift-registers. Such a filtering procedure is called a
moving-window averaging filter in general; the term movingaverage (MA) filter is commonly used.
The general form of an MA filter is:
y (n ) =
above block diagram communicates with the data acquisition
system and makes the acquisition of an external signal. We
use an analog channel with following characteristics: the name
of the channel Ecg1; the channel is programmed for signal
input Reference Single Ended (unipolar signal); the input
range is [ − 5 mV , + 5 mV ] ; the number of samples inside one
acquisition is 100; the sampling frequency is 200 Hz .
Fig. 5. Part of electrocardiogram acquisition and processing.
N
∑ bk x(n − k ) ,
The first three characteristics are appointed by MAX, that is
capable to communicate to any National Instruments data
acquisition card. The last two properties are introduced with
LabVIEW, that means the values and the name of the channel
are selected from the controls belonging to the front panel; the
terminal sources from the diagram block take these new
values and channel name and actualize the acquisition.
After running the above program we can indicate the three
graphs that meet the necessity to publish the input signal, the
low-pass filtered signal and the averaging with the Hanning
filter. The signals that have been acquisitioned and processed
as in the above presented theory are visualised in following
figures Fig.6. and Fig.7. Two acquisitions, for two different
electrocardiograms are done with the PCI-6023E card. The
easiest way to acquire a single waveform from a single
channel is to use the AI Acquire Waveform virtual instrument
[1].
Using this virtual instrument it is necessary to specify a
device and/or channel, the number of samples to acquire from
the channel and the sample rate measured in samples per
second. It is also possible to set programmatically the gain by
(1)
k =0
where x and y are the input and output of the filter,
respectively. The bk values are the filter coefficients or tap
weights, k = 0, 1, 2,..., N, where N is the order of the filter.
The effect of division by the number of samples used (N+1) is
included in the values of the filter coefficients. Applying the
z-transform, we get the transfer function H(z) of the filter as:
H (z ) =
Y (z) N
= ∑bk z −k = b0 + b1z −1 + ...+bN z −N
X (z) k =0
(2)
where X(z) and Y(z) are the z-transforms of x(n) and y(n),
respectively. A simple MA filter for filtering noise is the von
Hann or Hanning filter [2], given by
y (n ) =
1
[x(n ) + 2 x(n − 1) + x(n − 2)].
4
(3)
The Analog Input Multipoint Block that was used in the
Issue 4, Volume 1, 2007
319
INTERNATIONAL JOURNAL OF CIRCUITS, SYSTEMS AND SIGNAL PROCESSING
setting the high limit and the low limit. Using only the
minimal set of inputs makes programming the virtual
instrument easier, but the virtual instrument lacks more
advanced capabilities, such as triggering. Also, it is possible to
acquire more than one waveform at a time with another of the
Easy Analog Input VIs, AI Acquire Waveforms. This virtual
instrument has also a minimal set of inputs, but it allows
inputs of more than one channel to read and return an array of
waveforms from all channels it reads. To access or control an
individual waveform, index the array of waveforms with the
Index Array function or use input indexing on a For or While
Loop. A two channel data acquisition system can be realized
Fig. 6. Electrocardiogram and low pass filtered electrocardiogram.
Fig. 8. Two channel data acquisition system..
We have in this program the possibility to choose the channel,
the frequency, the device and the sampling rate. To acquire
multiple waveforms it is also possible using the Intermediate
virtual instruments.
III. SIGNAL PROCESSING COMPUTER BASED ANALYSIS AND
DISPLAY
The biomedical signals acquired from the human body are
frequently very small, often in the millivolt range, and each
has its own processing needs. Electroencephalography signals
are in the microvolt range and have many frequency
components. Obviously these biomedical signals require
processing before they can be analyzed. LabVIEW contains
the tools, from fast Fourier transforms to digital filters to
realize complex analysis. In order to do frequency analysis, a
complex signal must first be broken down into its frequency
components. One of the most common way to do this is with
an FFT. In order to facilitate this type of analysis, LabVIEW
comes with built in FFTs that make the process of component
Fig. 7. Electrocardiogram with 60Hz noise (first graph), filtered
electrocardiogram (second graph) and averaged electrocardiogram
Hanning filter .(third graph).
as in Fig.8.
Issue 4, Volume 1, 2007
320
INTERNATIONAL JOURNAL OF CIRCUITS, SYSTEMS AND SIGNAL PROCESSING
separation quick and easy. In addition biomedical signals
being very small are in danger to be overwhelmed by noise.
To combat this it is necessary to use a SCXI – card, that
means to run the acquired signal through a set of filters and
amplifiers [5]. However, after the signal reaches the computer,
it can still contain noise. Another way to solve the noise
problem is to use the digital filters provided with LabVIEW.
LabVIEW offers the choice of Butterworth, Bessel,
Chebyshev and digital filters. With a few adjustments these
filters can be configured for almost any design that is needed.
A dual channel spectral measurement with filter is presented
using the Express virtual instruments that have the
possibilities to choose different kind of parameters from their
internal implementation. The block diagram is represented in
Fig. 9. Following steps are implemented: simulation of the
biomedical signal using a generation of a DC signal with
uniform white noise, the second step is filtering the signal
with a bandpass filter; the third step consists of two parts:
updating the Waveform Graph cursors to represent the current
values of the upper and lower cut-off frequency models and
checking to see if the upper or lower cut-off frequency values
have changed since the last iteration, if so it is necessary to
reset the Dual Spectral Measurement averaging; the fourth
step performs a Dual Channel Spectral Measurement on the
prefiltered signal and the filtered signal to determine the
frequency response of the filter; the last step test determines
the calculated filter frequency response against preset
specifications and determine whether the filter meets the
requirements or not. In the simulation we have used the
uniform white noise because it represents the entire frequency
range. In this way the Dual Channel Spectral Measurement
screen is refreshed. The most common chart type for
biomedical signals, however, is the strip chart; strip charts
bring the new data in, on the right side of the screen, while the
old travels off the left. One of the greatest benefits of this type
of chart is the ability to view past data using a scrollbar
attached to the chart.
Analysis of the biomedical signals can also be easily done in
LabVIEW. The graphical nature of LabVIEW allows even the
beginning programmer to easily write programs to analyze
data without having to worry about the syntax problems
associated with most programming languages. In Fig.10 is
represented a peak detection in an electrocardiogram – Front
Panel and Block Diagram. Using LabVIEW and the virtual
Fig. 10. Peak detection in an electrocardiogram.
instrument named Peak Detector we can obtain the desired
diagnostic decision. These prebuilt modules are extremely
useful in complicated applications.
Fig. 9. A dual channel spectral biomedical signal measurement with
filter using Express VIs.
We have established the peaks for different kinds of
biomedical signals. Peak detection is the first step in event
detection [2], [4], [5]. Finally, we can say that event detection
is an important step that is acquired before attempting to
analyze the corresponding waves or wavelets. After a specific
wave of interest has been detected, isolated and extracted,
methods targeted to the expected characteristics of the event
may be applied for directed analysis of the corresponding
physiological or pathological event.
We can use this Peak Detection in an application like an
ECG Rhythm analysis. The output of the final smoothing filter
Express virtual instrument easily determine what frequencies
are being filtered out and by how much.
For the signal display, several signals can be displayed on
the same chart, or separate charts can be configured for each
signal. LabVIEW offers sweep, scope and strip charts; a
sweep chart sends a vertical line along with the signal from
left to right so that the new data is to the left of the line, while
the old is on the right, with a scope chart the signal travels
from left to right and when it reaches the right edge, the chart
Issue 4, Volume 1, 2007
321
INTERNATIONAL JOURNAL OF CIRCUITS, SYSTEMS AND SIGNAL PROCESSING
that passed the ECG signal could be subjected to a peaksearching algorithm to obtain a time marker for each QRS or
ECG beat. The intervals between two such consecutive
markers give the RR interval, which could be averaged over a
number of beats to obtain a good estimate of the inter-beat
interval. The heart rate may be computed in bpm as 60 divided
by the average RR interval in seconds. The heart rate may also
be obtained by counting the number of beats detected over a
certain period.
IV. LABVIEW FOR ECG MATERNAL AND FETAL SIGNAL
PROCESSING
Fig. 12. Digital filter design and advanced signal processing.
processing applications for both stages, including baseline
wandering removing, noise cancellation, QRS complexes
detection and fetal heart rate extraction.
Biomedical signal processing algorithms form an important
part of real-time systems for monitoring of patients who suffer
from a life-threatening condition. Such systems are usually
designed to detect changes in cardiac or neurological function
and to predict the outcome of a patient admitted to the
intensive care unit [1], [2]. Since such changes may be
reversible with early intervention, irreversible damage can
sometimes be prevented. Similar to therapeutic contexts, the
signal is processed during monitoring in an essentially
sequential fashion such that past samples constitute the main
basis for a decision, while just a few seconds of the future
samples may also be considered-a property which usually
stands in sharp contrast to signal processing for diagnostic
purposes, where the signal is acquired in its entirety prior to
analysis.
The fetal electrocardiogram can be derived from the
maternal abdominal ECG and can be used for the extraction of
fetal heart rate, which indicates the cardiac condition of the
fetus. The locations of leads for an 8-channel maternal ECG
acquisition system are shown in Figure 11. Maternal thorax
ECG signals are sampled from thorax leads while maternal
abdominal ECG signals are obtained from abdominal leads.
With LabVIEW and related toolkits, such as the Advanced
Signal Processing Toolkit (ASPT) and the Digital Filter
Design Toolkit (DFDT) are shown in Figure 12 and Express
VI Development Toolkit, it is conveniently to build signal
In Fig.13 an ECG signal recorded from the abdomen of a
pregnant woman is shown. Simultaneously is recorded an
ECG from the woman’s chest. Making a comparison between
the two signals, we observe that the abdominal ECG
demonstrates multiple peaks that mean QRS complexes
corresponding to the maternal ECG, occurring at the same
time instants as the QRS complexes in the chest lead, as well
as others at weaker levels and a higher repetition rate. The
Fig. 13. ECG signals of a pregnant woman from abdominal and chest
leads: a) chest leads ECG, and b) abdominal lead ECG.
non-maternal QRS complexes represent the ECG of the fetus.
The former presents the maternal ECG whereas the latter is
a
Fig. 11. Thorax leads and abdominal leads for maternal and abdominal
ECG acquisition.
Issue 4, Volume 1, 2007
322
combination of the maternal and fetal ECG signals. It is
necessary to observe that the QRS complex shapes of the
maternal ECG from the chest and abdominal leads have
different shapes due to the projection of the cardiac electrical
vector onto different axes. Considering that the two signals
being combined have almost the same bandwidth it is
necessary to separate them and obtain the fetal ECG.
Generally, the recorded ECG signal is often contaminated by
noise and artifacts that can be within the frequency band of
interest and manifest with similar characteristics as the ECG
signal itself. In order to extract useful information from the
noisy ECG signals, it is necessary to process the raw ECG
signals.
INTERNATIONAL JOURNAL OF CIRCUITS, SYSTEMS AND SIGNAL PROCESSING
ECG signal processing can be roughly divided into two
stages by functionality: preprocessing and feature extraction
(as shown in Fig. 14). The preprocessing stage removes or
Fig. 14. Preprocessing ECGs records and feature extraction.
Fig. 15.b. Front panel for designing and using a highpass filter to
remove baseline wandering with sampling frequency 1000Hz.
suppresses noise from the raw ECG signal and the feature
extraction stage extracts diagnostic information from the ECG
signal.
Preprocessing ECG signals is necessary to remove
contaminants from the ECG signals. Broadly speaking, ECG
contaminants can be classified into the following categories:
power line interference, electrode pop or contact noise,
patient–electrode motion artifacts, electromyography (EMG)
noise, and baseline wandering. The LabVIEW provides an
intuitive and interactive way to design and implement finite
impulse response (FIR) or infinite impulse response (IIR)
filters easily and effectively.
We used the Configure Classical Filter Design Express
VI to design a Kaiser Window FIR highpass filter to remove
the baseline wandering. The configuration is realized for a
Fig.16. Block diagram for designing and using a highpass filter to
remove baseline wandering.
sampling frequency of 200Hz and 1000Hz. Figure 15a and
15b shows an example of the specifications of the highpass
filter and the block diagram of a sample virtual instrument that
you can use to remove the baseline wandering.
Concerning the stability of the system the position of poles
is inside the circle and the zeroes are inside and outside. It is
possible to observe in fig.15.a that zeros are equidistant to the
unit circle for sampling frequency 200Hz and in fig.15.b for
sampling frequency 1000Hz. It is as well possible to change
the window. For example window Dolph-Chebyshev assures
as well equidistance between zeros and the unit circle and the
poles inside the circle. The stability is assured as well in this
situation.
ICA (Independent Component Analysis) is a method for
retrieving independent hidden signals from a multi-channel
observation. Assume that the observation X is a superposition
of the source signal S, it is possible to write:
X=AS where A denotes a mixing matrix.
The assumption of statistical independence of the signals S
allows you to estimate both unknowns, S and A, from the
Fig. 15.a. Front panel for designing and using a highpass filter to
remove baseline wandering with sampling frequency 200Hz.
Issue 4, Volume 1, 2007
323
INTERNATIONAL JOURNAL OF CIRCUITS, SYSTEMS AND SIGNAL PROCESSING
observation X. Here, the maternal ECG and the fetal ECG can
be treated as independent components i.e. they are parts of S,
while the 8-channel measured ECG records constitute X. By
performing ICA, you can obtain the estimation of S, which
means you can obtain both maternal ECG and fetal ECG. The
ASPT provides the TSA (Time Sample Analysis) Independent
Component Analysis VI with which you can easily build an
FHR (Fetal Heart Rate) extraction application as shown in
Fig. 17. In Fig. 17, 8-channel ECG signals (acquired by the 8channel system mentioned before) are the inputs of the ICA
function, and the fetal ECG signal can be obtained from the
output as one of the independent components. Fig. 18 shows
critical during long-term application of the cubic spline
function.
After removing the baseline wandering, the resulting ECG
signal is more stationary and explicit than the original signal.
However, some other types of noise might still affect feature
Fig.18. Abdominal ECG and fetal ECG.
extraction of the ECG signal. The noise may be complex
stochastic processes within a wideband, so you cannot
remove them by using traditional digital filters. To remove
the wideband noises, you can use the Wavelet Denoise
Express VI as in Figure 19 a, b.
Fig.17. ICA method for fetal heart rate extraction.
one maternal abdominal ECG and one fetal ECG extracted
from ICA, respectively. From the fetal ECG, you can see that
the maternal ECG has been suppressed effectively and the
FHR can be obtained accurately and conveniently.
ECG Baseline Remove. One common variety of exerciseinduced artifacts is baseline wander resulting from movement,
respiration, and poor electrode contact. Although filters can be
designed to remove much of this baseline variation, they will
distort the low-frequency components of the ECG complex,
such as the TP-segment, the PR-segment, and, most
problematically, the ST-segment. The ST-segment is the most
diagnostically relevant measure of the ECG taken during
exercise. While linear baseline interpolation and removal may
be adequate at lower heart rates, they also will introduce
significant distortions. This is particularly evident when
excessive nonlinear wander is present, as seen at higher heart
rates and respiration rates. Since the cubic spline is not a filter
and uses an a priori knowledge of the shape of the ECG
signal, it estimates the true baseline and avoids distortion
better. The more common implementations of this technique
use relatively short ECG recordings. With the advent of
increasing power in computerized ECG systems, the
implementation of the cubic spline algorithm for removing
baseline wander in continuous, longer-duration ECG records
and in real-time processing is being attempted. However, the
correct application of the cubic spline to continuous
recordings is not straightforward and involves a number of
previously unforeseen difficulties. The accuracy and
resolution of both floating point and integer operations is
Issue 4, Volume 1, 2007
Fig.19.a. ECG Wavelet Denoise Express Virtual Instrument.
This Express VI first decomposes the ECG signal into several
Fig.19.b. ECG Wavelet Denoise Express Virtual Instrument and
characteristic window for Wavelet Denoise.
subbands by applying the wavelet transform [3], [6] and then
modifies each wavelet coefficient by applying a threshold or
shrinkage function, and finally reconstructs the denoised
signal.
324
INTERNATIONAL JOURNAL OF CIRCUITS, SYSTEMS AND SIGNAL PROCESSING
noise variance. Selecting one indicates that the noise is white
with unit variance. Selecting multiple levels indicates that the
noise does not have to be white and that the virtual instrument
estimates the noise standard deviation at each level
independently. Option for approximation — specifies the
operation for the approximation coefficients from the wavelet
decomposition. The default is none, which indicates that the
virtual instrument keeps the approximation coefficients
unchanged. If you select threshold, the virtual instrument
applies the same thresholding operation to the approximation
coefficients. If you select detrend, the virtual instrument sets
the approximation coefficients to 0.
In the last few years [7], [8], wavelets have emerged as a
powerful tool for extracting signals from noisy data. For the
case of Gaussian white noise, the signal extraction problem
can be stated as follows: we determine the true values of a
signal Sz, given set noisy observations
The data source can be from terminal or from file. From
terminal specifies that the virtual instrument reads data from
the block diagram input. From file specifies that the virtual
instrument reads data from a file. The virtual instrument can
read data from waveform, WAV, or TXT files. The virtual
instrument processes the data from WAV files as a waveform
data type. The valid format of a TXT data file is a file that
contains only a 1D real array, a 2×m real matrix, or an m×2
real matrix. The virtual instrument processes the 1D real array
from TXT data files as a real data type. The virtual instrument
processes the 2×m real matrix or the m×2 real matrix from a
TXT data file as a complex data type. The virtual instrument
treats the first row or column as the real part of the data and
treats the second row or column as the imaginary part of the
data.
File Path Configuration contains the following options: File
path — Specifies and displays the full path to the file from
which we want to read data; Ask user to choose a file each
time this VI runs — Displays a dialog box that prompts users
to select a file each time the virtual instrument runs. This
Express Virtual Instrument displays the original signal and the
signal after denoising. The transform settings contain the
following options: Transform type — Specifies the use of the
discrete wavelet transform or undecimated wavelet transform
to denoise the signal. Wavelet — specifies the wavelet type to
use for the discrete wavelet analysis. The default is db02. The
options include two types: orthogonal (Haar, Daubechies
(dbxx), Coiflets (coifx), Symmlets (symx)) and biorthogonal
(FBI, Biorthogonal (biorx_x)), where x indicates the order of
the wavelet. The higher the order, the smoother the wavelet.
The orthogonal wavelets are not redundant and are suitable for
signal or image denoising and compression. The biorthogonal
wavelets usually have the linear phase property and are
suitable for signal or image feature extraction. Threshold
settings contain the following options: Soft threshold —
specifies to use the soft thresholding method. The default is to
use the soft thresholding method. If you remove the
checkmark from the Soft threshold checkbox, the virtual
instrument uses the hard thresholding method. Thresholding
rule —specifies the threshold selection rules. The default is
SURE, which indicates that the virtual instrument uses the
principle of Stein's Unbiased Risk Estimate (SURE) to
estimate the threshold. If you select Hybrid, the virtual
instrument finds a compromise between the SURE method
and the Universal Method. When the signal-to-noise ratio of
the noisy signal is very low, the virtual instrument uses the
Universal Method to estimate the threshold. If you select
Universal, the virtual instrument sets the threshold to sqrt
(2×log (Ls)), where Ls is the signal length. If you select
Minimax, the virtual instrument uses the Minimax Principle to
estimate the threshold. Rescaling method — Specifies the
method to use to estimate the noise variance at each level. The
default is single level, which indicates that the noise is white
and that the virtual instrument estimates the noise standard
deviation from the wavelet coefficients at the first level. The
virtual instrument uses the noise variance to rescale the
threshold. Therefore, you can update the thresholds with the
Issue 4, Volume 1, 2007
S iz = S i + σ ⋅ z i , i = 0, … , n − 1,
where S iz = S z (t i ) and
(4)
S i = S (t i ) at times t i = i n , σ is
the standard deviation of the noise, and z i are random
variables according to N (0, 1). In the wavelet domainψ , we
can rewrite:
( )
(
)
Wψ S iz = Wψ (S i + σS i ) = Wψ S i + σ Wψ zi .
(5)
V. CONCLUSION
As the performance to cost ratios for computers continues to
grow, there will be a great need for computer based
acquisition-analysis systems. These systems can be an
inexpensive replacement for the costly stand-alone, signal
specific, systems currently in use. The components necessary
for a LabVIEW based acquisition and analysis system are
inexpensive and readily available. The experience necessary
to program this type of system in LabVIEW is small and the
numbers of libraries available from National Instruments is
growing. These developments show that a computer based
system using LabVIEW can be an efficient alternative to stand
alone equipment and as the speed and reliability of the
computer increases, there will be more and more of these
systems available.
REFERENCES
[1]
[2]
[3]
[4]
[5]
325
J. Olansen, E. Rosow, Virtual Bio-Instrumentation, Biomedical, Clinical
and Healthcare applications in LabVIEW, Publishing House Prentice
Hall PTR, 2002.
R. M. Rangayyan, Biomedical Signal Analysis, Wiley-Intersciene, John
Wiley & SONS, INC., 2002.
A. Aldroubi, M. Unser, Wavelets in Medicine and Biology, Publishing
House CRC Press, 1996.
M. Unser, A. Aldroubi and M. Eden, “ On the asymptotic convergence
of B-spline wavelets to Gabor functions”, IEEE Trans. Inform. Theory
38 (2), 864-872, 1992.
C. Li, C. Zheng, C. Tai, “Detection of ECG characteristic points using
wavelet transforms” , IEEE Trans. on Biomed. Eng., pp: 21-28, 1995.
INTERNATIONAL JOURNAL OF CIRCUITS, SYSTEMS AND SIGNAL PROCESSING
[6]
[7]
[8]
M. Unser, A. Aldroubi and M. Eden, “ A family of polynomial spline
wavelet transforms. Signal Process., 30(2), 141-162, 1993.
***
National Instruments LabVIEW User Manual, NI Corporate
Headquarters, 2000.
***
National Instruments LabVIEW Measurements Manual, NI
Corporate Headquarters, 2000.
Dr. M. Lascu is a member of the Romanian Electronics Engineer Association
(AIE). and a member of the Romanian Association of Electromagnetic
Compatibility (ACER).
Mihaela Ruxandra Lascu was born in Timişoara,
Romania, on May 7, 1962. She received the degree
in electrical engineering from the Politehnica
University of Timişoara in 1986 and the Ph.D.
degree in electromagnetic compatibility and
measurement techniques in 1998. Since 1990 she
was appointed Assistant at the University of
Timişoara.
Her main interest is in numerical techniques applied in electromagnetic
compatibility, such as finite-element analysis and finite-difference timedomain methods, and their application to interference problems in steady-state
and time-domain applications.
As well her main interest is in virtual instrumentation, graphical
programming and biomedical signal processing. Now she is associate
professor at the University of Timişoara.
She published more than 60 papers and 2 books in the field of virtual
instrumentation and her current research is the field of
graphical
programming, biomedical signal processing and numerical techniques applied
in electromagnetic compatibility.
Issue 4, Volume 1, 2007
Dan Florentin Lascu was born in Timişoara,
Romania, on June 30, 1961. He received the
M.Sc. degree in electrical engineering and the
PhD. degree in electronics from Politehnica
University Timişoara, Romania, in 1986 and
1998 respectively. Since 1990 he has been with
the Politehnica University Timişoara, Applied
Electronics Department, and since 2007 is a Professor in the Power
Electronics Group.
He published more than 65 papers and 3 books in the field of power
electronics and his current research is the field of switching converter
synthesis, converter modelling, converter simulation, active power factor
correction and soft-switching techniques.
Dr. D. Lascu is a member of the Romanian Electronics Engineer
Association (AIE) and a member of the Romanian Association of
Electromagnetic Compatibility (ACER).
326