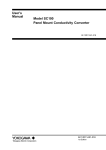
1
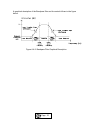
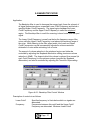
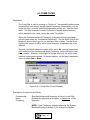
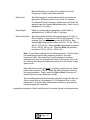
PicoDAC
PORTABLE AUTOMATIC VOICE FILTER
CONFIGURATION SOFTWARE
USER’S MANUAL
DIGITAL AUDIO CORPORATION
PicoDAC
PORTABLE AUTOMATIC VOICE FILTER
CONFIGURATION SOFTWARE
User’s Manual
February 6, 2000
DIGITAL AUDIO CORPORATION
A DRI Company
5121 Holly Ridge Drive
Raleigh, NC 27612
Phone:
877 5DACAUDIO
Fax:
877 5DACFAX
[email protected]
www.dacaudio.com
Copyright © 2000 by Digital Recorders, Inc.
All rights reserved.
Page 4
TABLE OF CONTENTS
1. 0 OVERVIEW...............................................................................................................9
1.1 Introduction ............................................................................................................9
1.2 Installation ............................................................................................................10
2. 0 PICODAC CONFIGURATION CONTROL ..............................................................11
2.1 PicoDAC Control Panel ........................................................................................11
2.2 Customizing Filter Sets ........................................................................................12
2.3 Automatic Gain Control Radio Buttons................................................................12
2.4 Bandwidth Radio Buttons .....................................................................................13
2.5 Programming the PicoDAC ..................................................................................13
3. 0 STORING FILTER CONFIGURATIONS .................................................................17
3.1 Save File Dialog Box ............................................................................................17
4. 0 RECALLING FILTER CONFIGURATIONS .............................................................19
4.1 Open File Dialog Box ...........................................................................................19
5. 0 TRANSFER CABLE ATTACHMENT ......................................................................21
5.1 Connecting the Transfer Cable to the PicoDAC ...................................................21
1. 0 ONE CHANNEL ADAPTIVE FILTER ......................................................................27
2. 0 LOWPASS FILTER.................................................................................................29
3. 0 HIGHPASS FILTER ................................................................................................31
4. 0 BANDPASS FILTER ...............................................................................................33
5. 0 BANDSTOP FILTER...............................................................................................37
6. 0 COMB FITLER........................................................................................................41
7. 0 NOTCH FILTER......................................................................................................45
8. 0 SLOT FILTER .........................................................................................................47
9. 0 20-BAND GRAPHIC EQUALIZER ..........................................................................49
10. 0 SPECTRAL GRAPHIC EQUALIZER ....................................................................51
11. 0 IMPORTED COEFFECIENT FILE ........................................................................57
Page 5
11.1 Coefficient File Format .......................................................................................58
12. 0 PASS THRU FILTER ............................................................................................61
Page 6
LIST OF FIGURES
Figure 2-1: PicoDAC Control Panel ...............................................................................11
Figure 2-2: AGC Radio Buttons .....................................................................................13
Figure 2-3: Bandwidth Selection Radio Buttons.............................................................13
Figure 2-4: A Typical Computer’s Serial Ports ...............................................................13
Figure 2-5: PicoDAC Transfer Window (Finding PicoDAC) ...........................................14
Figure 2-6: PicoDAC Transfer Window (Programming PicoDAC)..................................14
Figure 3-1: Save As Setup File Window ........................................................................17
Figure 4-1: Recall Setup File Window............................................................................19
Figure 5-1: PicoDAC Rear Panel Thumb Screws ..........................................................21
Figure 5-2: PicoDAC Rear Panel Removal ....................................................................21
Figure 5-3: PicoDAC Top Cover Removal .....................................................................22
Figure 5-4: Transfer Cable Serial Connector .................................................................22
Figure 5-5: Transfer Cable IDC Connector ....................................................................23
Figure 5-6: PicoDAC IDC Header ..................................................................................23
Figure 5-7: Attaching IDC Connector to PicoDAC..........................................................23
Figure 5-8: A Properly Connected Transfer Cable .........................................................24
Figure A-1-1: 1CH Adaptive Filter Control Window........................................................27
Figure A-2-1: Lowpass Filter Control Window................................................................29
Figure A-2-2: Lowpass Filter Graphical Description.......................................................30
Figure A-3-1: Highpass Filter Control Window ...............................................................31
Figure A-3-2: Highpass Filter Graphical Description ......................................................32
Figure A-4-1: Bandpass Filter Control Window ..............................................................34
Figure A-4-2: Bandpass Filter Graphical Description .....................................................35
Figure A-5-1: Bandstop Filter Control Window...............................................................37
Figure A-5-2: Bandstop Filter Graphical Description......................................................39
Figure A-6-1: Comb Filter Control Window ....................................................................41
Figure A-6-2: Comb Filter Graphical Description ...........................................................43
Figure A-7-1: Notch Filter Control Window ....................................................................45
Figure A-7-2: Notch Filter Graphical Description............................................................46
Figure A-8-1: Slot Filter Control Window........................................................................47
Figure A-8-2: Slot Filter Graphical Description...............................................................48
Figure A-9-1: 20-Band Graphic Equalizer Control Window............................................49
Figure A-10-1: Spectral Graphic Equalizer Window.......................................................51
Figure A-10-2: New Spectral Graphic Equalizer Display................................................52
Figure A-10-3: Spectral Graphic Draw in Progress ........................................................53
Figure A-10-4: Completed Spectral Graphic Draw.........................................................54
Figure A-10-5: Spectral Graphic Edit Window ...............................................................54
Figure A-10-6: Spectral Graphic Define Edit Region......................................................55
Figure A-10-7: Spectral Edit In Progress .......................................................................55
Figure A-10-8: Completed Spectral Graphic Edit ...........................................................56
Figure A-10-9: Normalized Spectral Graphic Equalizer .................................................56
Figure A-11-1: Open Imported Coefficient File Dialog Box ............................................57
Figure A-12-1: Pass Thru Filter Selection ......................................................................61
Page 7
Page 8
1.0 OVERVIEW
1.1 Introduction
The PicoDAC Configuration Software allows for complete setup and control of the
ten different filters on the PicoDAC, each consisting of two stages. The software
provides an easy to use, intuitive interface for configuring the filter settings and
transferring them to the PicoDAC.
The easy installation of the PicoDAC Configuration software provides:
•
•
•
•
•
•
Choice of two 256 tap stages within each filter
12 different filter types to choose from within each stage
Bandwidth selection for each filter of 3.4 kHz, 5.0 kHz, and 7.5 kHz
Selectable Automatic Gain Control for each filter
Filter set (10 filters) can be saved for later use
Auto COM Port detection for filter transfer to the PicoDAC
Each filter can select from one of three bandwidth settings of 3.4 kHz, 5.0 kHz, or
7.5 kHz as well as the four different Automatic Gain Control (AGC) settings of no
AGC, 10 dB of gain, 20 dB of gain, and 30 dB of gain. The two stages within each
filter can be independently selected from one of the following filter types:
•
•
•
•
•
•
•
•
•
•
•
One Channel Adaptive Filter
Lowpass Filter
Highpass Filter
Bandpass Filter
Bandstop Filter
Comb Filter
Notch Filter
Slot Filter
20 Band Graphic Equalizer
Spectral Graphic Equalizer
Pass Thru Filter
Floating-point formatted coefficient text files can be imported as well.
A description of each filter type, its application and a definition of the control
parameters can be found in Appendix A.
Page 9
1.2 Installation
To install the PicoDAC software, simply insert the PicoDAC Installation CD into your
CD-ROM drive. If the installation software does not automatically run after several
seconds you will need to manually start the installation as follows:
With the PicoDAC Installation CD in your CD-ROM drive click on the Start
menu and then the Run option. In the window that appears type:
X:\setup.exe
And click OK or hit the Enter key. Where “X” is the drive letter of your CDROM. The installation program will then start. Follow the directions given in
the installation program.
Often times after the installation is complete you will be told to reboot your system.
Once the system has rebooted you can run the PicoDAC software by clicking on the
Start Menu, then the PicoDAC menu and then clicking the PicoDAC icon.
If the personal computer (PC) on which you wish to install the software does not
have a CD-ROM contact Digital Audio Corporation to send you the software on
floppy disks.
Page 10
2.0 PICODAC CONFIGURATION CONTROL
2.1 PicoDAC Control Panel
Figure 2-1: PicoDAC Control Panel
At the top of the PicoDAC Control Panel is a Menu Bar. From the File menu item
you can choose to create a New filter set, Open a filter configuration file, Save a
filter file As a different or similar file name, Program the PicoDAC, select a COM
Port, or Exit the software. From the Help menu item you can view the Contents of
this help file, Search for Help On a topic in this help file, or read information About
the PicoDAC software.
Below the Menu Bar is the Toolbar. Each small icon allows a quick shortcut to some
of the Menu Bar items. Each icon represents the menu function of New, Open,
Save As and Program the PicoDAC respectively.
Page 11
The New menu option allows you to reset each filter to a Pass Thru Filter at 5.0 kHz
bandwidth with no AGC. This is a quick and easy way to configure a fresh filter
configuration.
2.2 Customizing Filter Sets
The PicoDAC Control Panel allows each of the ten filters to be configured. Each
filter can be selected by clicking on the "tab" labeled with its number. Each tab
corresponds to the number displayed on the rotary switch on the PicoDAC's front
panel. There are two Stages for each filter. Each Stage can be customized using
one of the following filter types:
•
•
•
•
•
•
•
•
•
•
•
•
One Channel Adaptive Filter
Lowpass Filter
Highpass Filter
Bandpass Filter
Bandstop Filter
Comb Filter
Notch Filter
Slot Filter
20 Band Graphic Equalizer
Spectral Graphic Equalizer
Imported Coefficient File
Pass Thru Filter
Once the filter type is selected, click on the Control button to bring up the control
window for the selected filter. This window allows you to customize the parameters
which define the filter performance. After selecting the values for each parameter,
click on the OK button.
Refer to Appendix A for more information on filter types and their parameters
2.3 Automatic Gain Control Radio Buttons
The AGC (Automatic Gain Control) radio buttons are shown below. Each filter can
have the AGC turned off via the No AGC option or have 10dB, 20dB, or 30dB of
AGC applied to the input signal. When the AGC is active it will boost the INPUT
signal by the amount specified to bring it up to an input level of -12 dB. This AGC
setting applies to both Stages within the Filter.
Page 12
Figure 2-2: AGC Radio Buttons
2.4 Bandwidth Radio Buttons
The Bandwidth radio buttons allow one of the three bandwidths (3.4 kHz, 5.0 kHz, or
7.5 kHz) to be selected for a Filter. This setting applies to both Stages.
Figure 2-3: Bandwidth Selection Radio Buttons
2.5 Programming the PicoDAC
The COM Port menu option allows you to select the COM Port that the software will
first search for the PicoDAC when programming the PicoDAC. If you are unsure
which COM Port your PicoDAC is connected to then leave the default option of COM
1. An example of a computers COM Port connections is shown in Figure 2-4.
Figure 2-4: A Typical Computer’s Serial Ports
Page 13
Make sure to follow the correct instructions detailed in Section 5.0, Transfer Cable
Attachment, to connect the PicoDAC Transfer Cable. For more information about
the PicoDAC itself, refer to the User's Manual
The Program PicoDAC button on the toolbar starts the process of searching for a
PicoDAC via the serial ports and transferring the filter settings to the PicoDAC. This
function can also be selected through the File option in the Menu Bar. After the
Program PicoDAC button is pressed you will see a window appear that asks you if
you are prepared to program all 10 filters. This is to remind you that you only need
to program the PicoDAC one time once you have all the filters set up the way you
want them. Next the following window will appear:
Figure 2-5: PicoDAC Transfer Window (Finding PicoDAC)
Several messages will appear in the transfer window informing you that the software
is using the Auto COM Port detection feature to find the PicoDAC and then
programming the PicoDAC. The COM port that is being searched for the PicoDAC
or that is being used to transfer the configuration file will appear in the lower right
corner of the Transferring Filters window. As the filter file is transferred the progress
bar will display how much of the total configuration file has been transferred. When
the transfer is complete the window will disappear and the Main Control Window will
become active.
Figure 2-6: PicoDAC Transfer Window (Programming PicoDAC)
The programming of the PicoDAC can be stopped at any time by pressing the
Cancel button. A message window will appear telling you that the download has
been aborted and that the filters stored in PicoDAC are no longer valid. Because the
download was stopped before it was completed the filter settings stored in the
Page 14
PicoDAC may no longer be usable. It is advised that the PicoDAC be reset by using
the Reset button located on the back panel and a valid configuration be transferred
to the PicoDAC by repeating the Program PicoDAC procedure mentioned above.
Page 15
Page 16
3.0 STORING FILTER CONFIGURATIONS
3.1 Save File Dialog Box
Application:
To save time configuring the PicoDAC control settings, complete setups may
easily be stored to disk setup files for future recall. These files are particularly
handy when making presentations which require multiple setups, or when it is
desired to precisely duplicate the enhancement procedure. Also, this feature
allows easy transfer of enhancement setups between PicoDAC systems
using floppy disks.
Store a setup to a disk file as follows:
1.
Click on File on the PicoDAC menu bar. When the pulldown menu
appears, click on Save As (or click on the "floppy disk" icon on the
toolbar). This will cause the following window to appear:
Figure 3-1: Save As Setup File Window
2.
If you desire to place the setup file into a different drive (such as a
floppy drive) or directory, use the Save in drop-down selection box. If
you select a drive that is not ready, an error message will be
generated.
3.
You will need to specify a filename for the setup. Click on the File
Name text box, then type the desired filename. All setup filenames
Page 17
must have the .PDC extension; thus, the .PDC extension is
automatically included in the text box.
4.
Click on OK to store the setup file with the selected filename to the
specified drive and directory. (The Open as read-only checkbox is
not applicable and is ignored.)
NOTE: The file "default.pdc" is the configuration file stored in the installation
directory that holds the shutdown information for the PicoDAC software. When the
PicoDAC software is closed whatever settings are configured in the PicoDAC
software are stored in this file. The next time the PicoDAC software is run its
settings are retrieved and you are able to pick up where you left off.
Page 18
4.0 RECALLING FILTER CONFIGURATIONS
4.1 Open File Dialog Box
Application:
To save time configuring control settings in the PicoDAC control settings,
complete setups previously stored may be recalled from disk files with a few
simple mouse clicks. This is particularly handy when making presentations
which require multiple setups, or when it is desired to precisely duplicate a
previous enhancement procedure. Also, this feature allows easy transfer of
enhancement setups between PicoDAC systems using floppy disks.
Open a setup from a disk file as follows:
1.
Click on File on the PicoDAC menu bar. When the pulldown
menu appears, click on Open (or click on the "open file folder" icon on
the toolbar). This will cause the following window to appear::
Figure 4-1: Recall Setup File Window
2.
If you desire to place the setup file into a different drive (such as
a floppy drive) or directory, use the Save in drop-down selection box.
If you select a drive that is not ready, an error message will be
generated.
Page 19
3.
Once the desired setup file name has been found, either
double-click it or click on OK to recall it. The file will be loaded.
NOTE: The file "default.pdc" is the configuration file stored in the installation
directory that holds the shutdown information for the PicoDAC software. When the
PicoDAC software is closed whatever settings are configured in the PicoDAC
software are stored in this file. The next time the PicoDAC software is run its
settings are retrieved and you are able to pick up where you left off.
Page 20
5.0 TRANSFER CABLE ATTACHMENT
5.1 Connecting the Transfer Cable to the PicoDAC
1. First turn OFF PicoDAC POWER switch and remove all INPUT and
OUTPUT cables. To remove the PicoDAC top cover remove the thumb
screws on the rear panel.
Be careful not to damage any of the components in the
PicoDAC by static electricity. Before opening the unit
be sure to touch a grounded metal object
Figure 5-1: PicoDAC Rear Panel Thumb Screws
2. Remove the rear panel and bezel
Figure 5-2: PicoDAC Rear Panel Removal
Page 21
3. While holding the base of the unit, gently pull the black top cover toward
the rear of the unit.
Figure 5-3: PicoDAC Top Cover Removal
4. The PicoDAC Transfer Cable has a serial connector for the computer and
an IDC connector for the PicoDAC. Attach the serial connector to the
serial port on the computer (where the PicoDAC software is running).
Often the mouse may be plugged into one serial port and the second will
have nothing attached. You may need to use a 25-pin to 9-pin serial
adapter to attach the cable to your computer’s serial port.
Figure 5-4: Transfer Cable Serial Connector
Page 22
5. Next take the IDC end of the PicoDAC Transfer Cable and attach it to the
appropriate connector on the PicoDAC. The correct header is located at
the front of the PicoDAC and is the set of 10 pins on the right. See Figure
5-6 for the correct location. Make sure that the cable is pointing away
from the battery.
Figure 5-5: Transfer Cable IDC Connector
Figure 5-6: PicoDAC IDC Header
Figure 5-7: Attaching IDC Connector to PicoDAC
Page 23
Figure 5-8: A Properly Connected Transfer Cable
6. Reattach the power cable and power the PicoDAC ON. Run the PicoDAC
Configuration Utility and load the new settings into the PicoDAC.
It is possible to leave the input and output cables attached when loading the
new filter settings into the PicoDAC. One good way to check if the filter
settings are correct for your application is to transfer the new configuration
while the PicoDAC is running and listen to the results. The important thing
to remember is to power the unit OFF and remove all cables when
reattaching the top cover and rear bezel.
7. After the new settings have been loaded into the PicoDAC, power the unit
OFF, remove the power cable, remove the transfer cable, and replace the
top cover.
Page 24
Appendix A
This section contains detailed information on each of the filters. This information can
be found in the software Help file as well.
Page 25
Page 26
1.0 ONE CHANNEL ADAPTIVE FILTER
Application:
The 1CH Adaptive filter is used to automatically cancel predictable and
convolutional noises from the input audio. Predictable noises include tones,
hum, buzz, engine/motor noise, and, to some degree, music. Convolutional
noises include echoes, reverberations, and room acoustics.
Figure A-1-1: 1CH Adaptive Filter Control Window
Description of controls is as follows:
Filter Size:
Used to set the number of FIR filter taps (filter order) in
the adaptive filter. Filter size is indicated both in taps and
in milliseconds. Minimum Filter Size is 4 taps, but can be
set to as high as 256 taps.
Small filters are most effective with simple noises such as
tones and music. Larger filters should be used with
complex noises such as severe reverberations and raspy
power hums. A nominal filter size of 256 taps is a good
overall general recommendation.
Adapt Rate:
Used to set the rate at which the adaptive filter adapts to
changing signal conditions (Mathematically known as
"Mu"). A Mu of 1 x 2^-14 provides very slow adaptation,
while a Mu of 256 x 2^-14 provides fastest adaptation.
Page 27
Larger adapt rates should be used with changing noises
such as music; whereas, smaller adapt rates are
acceptable for stable tones and reverberations. Larger
adapt rates sometimes affect voice quality, as the filter
may attack sustained vowel sounds.
Prediction Span:
Sets the number of samples in the prediction span delay
line. Prediction span is indicated both in samples and in
milliseconds, and can be adjusted from 1 to 64 samples.
Shorter prediction spans allow maximum noise removal,
while longer prediction spans preserve voice naturalness
and quality. A prediction span of 2 or 3 samples is
normally recommended.
Adapt Mode:
Selects Auto(matic) or Fixed adaptation rate. Auto is
recommended. When Fixed is selected, the specified
Adapt Rate Mu is applied to the filter at all times.
However, when Auto is selected, the specified Adapt Rate
is continuously rescaled depending upon the input signal
level. Overall convergence rate is faster with Auto.
Processor Output: Used to select the output of the filter. The normal setting
is residue as this is the processed audio. The Predict
output is the audio subtracted from the original source.
For example, if a 1CH Adaptive Filter was being used to
remove a tone the Processor Output choice of Predict
would output only the subtracted tone.
Page 28
2.0 LOWPASS FILTER
Application:
The Lowpass filter is used to decrease the energy level (lower the volume) of
all signal frequencies above a specified Cutoff Frequency, thus reducing highfrequency noises, such as tape hiss, from the input audio. The Lowpass filter
is sometimes called a "hiss filter."
The Cutoff Frequency is usually set above the voice frequency range so that
the voice signal will not be disturbed. While listening to the filter output audio,
the Cutoff Frequency can be incrementally lowered from its maximum
frequency until the quality of the voice just begins to be affected, achieving
maximum elimination of high-frequency noise.
The amount of volume reduction above the Cutoff Frequency can further be
controlled by adjusting the Stopband Attenuation setting (maximum volume
reduction is 60dB). The slope at which the volume is reduced from normal (at
the Cutoff Frequency) to the minimum volume (specified by Stopband
Attenuation) can also be controlled by adjusting the Transition Slope setting.
Figure A-2-1: Lowpass Filter Control Window
Description of controls is as follows:
Cutoff
Frequency:
Specifies frequency in Hertz above which all signals are
attenuated.
Frequencies below this cutoff are unaffected. Minimum
Cutoff Frequency is 100 Hz, while the maximum Cutoff
Frequency depends upon the System Bandwidth setting.
Cutoff Frequency can be adjusted in 1 Hz steps.
Page 29
Stopband
Attenuation:
Transition
Slope:
Specifies amount in dB by which frequencies above the
Cutoff
Frequency are ultimately attenuated. Stopband attenuation
is adjustable from 12dB to 60dB in 1 dB steps.
Specifies slope at which frequencies above the Cutoff
Frequency are
rolled off in dB per octave. Sharpest roll off occurs when
Transition Slope is set to maximum, while gentlest roll off
occurs when Transition Slope is set to minimum. Sharp
rolloffs may cause the voice to sound hollow but will allow
more precise removal of high frequency noises. Note that
the indicated value changes depending upon Cutoff
Frequency and System Bandwidth.
A graphical description of the lowpass filter and its controls is given below.
Figure A-2-2: Lowpass Filter Graphical Description
Page 30
3.0 HIGHPASS FILTER
Application:
The Highpass filter is used to decrease the energy level (lower the volume) of
all signal frequencies below a specified Cutoff Frequency, thus reducing lowfrequency noises, such as tape or acoustic room rumble, from the input audio
(The Highpass filter is sometimes called a "rumble filter").
The Cutoff Frequency is usually set below the voice frequency range
(somewhere below 300 Hz) so that the voice signal will not be disturbed.
While listening to the filter output audio, the Cutoff Frequency, initially set to
100 Hz, can be incrementally increased until the quality of the voice just
begins to be affected, achieving maximum elimination of low-frequency noise.
The amount of volume reduction below the Cutoff Frequency can further be
controlled by adjusting the Stopband Attenuation setting (maximum volume
reduction is 60dB). The slope at which the volume is reduced from normal (at
the Cutoff Frequency) to the minimum volume (specified by Stopband
Attenuation) can also be controlled by adjusting the Transition Slope setting.
Figure A-3-1: Highpass Filter Control Window
Description of controls is as follows:
Cutoff Frequency:
Specifies frequency in Hertz below which all signals are
attenuated. Frequencies above this cutoff are unaffected.
Minimum Cutoff Frequency is 100 Hz (no frequencies
attenuated), while the maximum Cutoff Frequency depends
upon the System Bandwidth setting. Cutoff Frequency can be
adjusted in 1 Hz steps.
Page 31
Stopband
Attenuation:
Specifies amount in dB by which frequencies below the
Cutoff Frequency are ultimately attenuated. Stopband
attenuation is adjustable from 12dB to 60dB in 1 dB steps.
Transition Slope:
Specifies slope at which frequencies below the Cutoff
Frequency are attenuated in dB per octave. Sharpest
attenuation occurs when Transition Slope is set to maximum,
while gentlest attenuation occurs when Transition Slope is set to
minimum. Note that the indicated value changes depending
upon Cutoff Frequency and System Bandwidth.
A graphical description of the highpass filter and its controls is shown below.
Figure A-3-2: Highpass Filter Graphical Description
Page 32
4.0 BANDPASS FILTER
Application:
The Bandpass filter is used to decrease the energy level (lower the volume)
of all signal frequencies below a specified Lower Cutoff Frequency and above
a specified Upper Cutoff Frequency, thus combining the functions of a
seriesed Lowpass and Highpass filter into a single filter. The signal region
between the Lower Cutoff Frequency and the Upper Cutoff Frequency is
called the passband region. The Bandpass filter is useful for simultaneously
reducing both low-frequency rumble and high-frequency hiss.
The Lower Cutoff Frequency is usually set below the voice frequency range
(somewhere below 300 Hz) so that the voice signal will not be disturbed.
While listening to the filter output audio, the Lower Cutoff Frequency,
minimum of 0 Hz, can be incrementally increased until the quality of the voice
just begins to be affected, achieving maximum elimination of low-frequency
noise.
The Upper Cutoff Frequency is usually set above the voice frequency range
(somewhere above 3000 Hz) so that the voice signal will not be disturbed.
While listening to the filter output audio, the Upper Cutoff Frequency,
minimum setting of 100Hz over the Lower Cutoff Frequency, can be
incrementally lowered until the quality of the voice just begins to be affected,
achieving maximum elimination of high-frequency noise.
The amount of volume reduction outside the passband region can further be
controlled by adjusting the Stopband Attenuation setting (maximum volume
reduction is 60dB). The slope at which the volume is reduced from normal (at
each Cutoff Frequency) to the minimum volume (specified by Stopband
Attenuation) can also be controlled by adjusting the Transition Slope setting.
Page 33
Figure A-4-1: Bandpass Filter Control Window
Description of controls is as follows:
Lower Cutoff
Frequency:
Specifies frequency in Hertz below which all signals are
attenuated. Frequencies between this cutoff and the Upper
Cutoff Frequency are unaffected. Minimum Lower Cutoff
Frequency is 0 Hz, while the maximum Lower Cutoff
Frequency is 100 Hz below the Upper Cutoff Frequency.
Lower Cutoff Frequency can be adjusted in 1 Hz steps.
NOTE: The Lower Cutoff Frequency can never be set
higher than 100 Hz below the Upper Cutoff Frequency.
Upper Cutoff
Frequency:
Specifies frequency in Hertz above which all signals are
attenuated. Frequencies between this cutoff and the Lower
Cutoff Frequency are unaffected. Minimum Upper Cutoff
Frequency is 100 Hz above the Lower Cutoff Frequency,
while the maximum Upper Cutoff Frequency depends upon
the System Bandwidth setting. Upper Cutoff Frequency can
be adjusted in 1 Hz steps.
NOTE: The Upper Cutoff Frequency can never be set lower
than 100 Hz above the Lower Cutoff Frequency.
Transition Slope:
Specifies slope at which frequencies below the Lower Cutoff
Frequency and above the Upper Cutoff Frequency are
attenuated in dB per octave. Sharpest attenuation occurs
when Transition Slope is set to maximum, while gentlest
attenuation occurs when Transition Slope is set to minimum.
Note that the indicated value changes depending upon
Cutoff Frequency and the System Bandwidth settings. Also,
note that the Lower and Upper Transition Slopes always
have different values; this is because the frequency width of
an octave is proportional to Cutoff Frequency.
Stopband
Specifies amount in dB by which frequencies below the
Lower Cutoff
Frequency and above the Upper Cutoff Frequency are
ultimately attenuated. Stopband Attenuation is adjustable
from 12dB to 60dB in 1 dB steps.
Attenuation:
Page 34
A graphical description of the Bandpass filter and its controls follows in the figure
below.
Figure A-4-2: Bandpass Filter Graphical Description
Page 35
Page 36
5.0 BANDSTOP FILTER
Application:
The Bandstop filter is used to decrease the energy level (lower the volume) of
all signal frequencies above a specified Lower Cutoff Frequency and below a
specified Upper Cutoff Frequency. The signal region between the Lower
Cutoff Frequency and the Upper Cutoff Frequency is called the stopband
region. The Bandstop filter is useful for removing in-band noise from the input
signal.
The Lower Cutoff Frequency is usually set below the frequency range of the
noise, while the Upper Cutoff Frequency is set above the frequency range of
the noise. While listening to the filter output audio, the Lower and Upper
Cutoff Frequencies can be incrementally adjusted to achieve maximum
elimination of noise while minimizing loss of voice.
The amount of volume reduction in the stopband region can further be
controlled by adjusting the Stopband Attenuation setting (maximum volume
reduction is 60dB). The slope at which the volume is reduced from normal (at
each Cutoff Frequency) to the minimum volume (specified by Stopband
Attenuation) can also be controlled by adjusting the Transition Slope setting.
Figure A-5-1: Bandstop Filter Control Window
Description of controls is as follows:
Lower Cutoff
Frequency:
Specifies frequency in Hertz below which no signals are
attenuated.
Frequencies between this cutoff and the Upper Cutoff
Frequency are attenuated. Minimum Lower Cutoff
Page 37
Frequency is 0 Hz, while the maximum Lower Cutoff
Frequency is 100 Hz below the Upper Cutoff Frequency.
Lower Cutoff Frequency can be adjusted in 1 Hz steps.
NOTE: The Lower Cutoff Frequency can never be set
higher than 100 Hz below the Upper Cutoff Frequency.
Upper Cutoff
Frequency:
Specifies frequency in Hertz above which no signals are
attenuated. Frequencies between this cutoff and the Lower
Cutoff Frequency are attenuated. Minimum Upper Cutoff
Frequency is 100 Hz above the Lower Cutoff Frequency,
while the maximum Upper Cutoff Frequency depends upon
the System Bandwidth setting. Upper Cutoff Frequency can
be adjusted in 1 Hz steps.
NOTE: The Upper Cutoff Frequency can never be set lower
than 100 Hz above the Lower Cutoff Frequency.
Transition
Slope:
Specifies slope at which frequencies above the Lower
Cutoff Frequency and below the Upper Cutoff Frequency are
attenuated in dB per octave. Sharpest attenuation occurs
when Transition Slope is set to maximum, while gentlest
attenuation occurs when Transition Slope is set to minimum.
Note that the indicated value changes depending upon
Cutoff Frequency, System Bandwidth, Configuration, and
Number DSP Stages settings. Also, note that the Lower and
Upper Transition Slopes always have different values; this is
because the frequency width of an octave is proportional to
Cutoff Frequency.
Stopband
Attenuation:
Specifies amount in dB by which frequencies above the
Lower Cutoff Frequency and below the Upper Cutoff
Frequency are attenuated. Stopband attenuation is
adjustable from 12dB to 60dB in 1 dB steps.
A graphical description of the Bandstop filter and its controls follows in the figure
below.
Page 38
Figure A-5-2: Bandstop Filter Graphical Description
Page 39
Page 40
6.0 COMB FILTER
Application:
The Comb filter is used to remove, or "notch out,” harmonically related noises
(noises which have exactly equally-spaced frequency components), such as
power-line hum, constant-speed motor/generator noises, etc., from the input
audio. The filter response consists of a series of equally-spaced notches
which resemble a hair comb, hence the name "Comb filter.”
Adjust the Fundamental Notch Frequency to the desired spacing between
notches (also known as "fundamental frequency"). Set the Notch Limit to the
frequency beyond which you do not want any more notches. Set the Notch
Depth to the amount in dB by which noise frequency components are to be
reduced.
Normally, the Notch Harmonics option will be set to All, causing frequencies
at all multiples of the Fundamental Notch Frequency (within the Notch Limit)
to be reduced. However, certain types of noises have only the odd or even
harmonic components present. In these situations, set the Notch Harmonics
option to either Odd or Even.
Figure A-6-1: Comb Filter Control Window
Description of controls is as follows:
Fundamental
Notch
Frequency
Specifies fundamental frequency in Hertz of comb filter.
Notches are generated at multiples, or harmonics, of this
frequency.
NOTE: Comb Frequency changes whenever the System
Bandwidth setting is altered; if you change the System
Page 41
Bandwidth setting, you will need to readjust the Comb
Frequency for any Comb Filters selected.
Notch Limit:
Specifies frequency in Hertz above which no notches are
generated. Minimum Notch Limit is 2 and 1/2 times the
Fundamental Notch Frequency, while maximum Notch Limit
depends upon the System Bandwidth setting. Notch Limit is
adjustable in 1 Hz steps.
Notch Depth:
Depth of notches that are generated. Notch Depth is
adjustable from 12 dB to 60 dB in 1 dB steps.
Notch Harmonics:
Specifies whether notches will be generated at All, Odd, or
Even multiples, or harmonics, of the Comb Frequency. If, for
example, the Comb Frequency is set to 60.000 Hz, then
selecting All will generate notches at 60 Hz, 120 Hz, 180 Hz,
240 Hz, 300 Hz, etc. Selecting Odd will generate notches at
60 Hz, 180 Hz, 300 Hz, etc. Selecting Even will generate
notches at 120 Hz, 240 Hz, 360 Hz etc.
Hint: A comb filter is adjusted in the following manner. Set the Notch
Limit and Notch Depth to their maximum positions; set notch
harmonics to All. Next adjust the Comb Frequency to achieve
maximum hum removal; normally this will be in the vicinity of 60 or 50
Hz. (Analog recordings will seldom be exactly 50 or 60 Hz due to tape
speed errors.
Next, adjust the Notch Limit down in frequency until the hum is barely
heard, then increase it 100 Hz. Adjust the Notch Depth up following
the same procedure. Finally, select the Odd or Even if they do not
increase the hum level; otherwise, use All.
This procedure minimizes the filtering to only that needed for the hum.
Since a comb filter is a reverberator, a 1CH Adaptive Filter is often
placed after it to reduce the reverberation and clean up any residual
noises escaping the comb filter.
A graphical description of the Comb filter and its controls follows in the figure below.
Page 42
Figure A-6-2: Comb Filter Graphical Description
Page 43
Page 44
7.0 NOTCH FILTER
Application:
The Notch filter is used to remove, or "notch out,” a narrow-band noise, such
as a tone or a whistle, from the input audio with minimal effect to the
remaining audio. The Notch filter works best with stable noise sources which
have constant frequency; if the frequency of the noise source varies, then the
1CH Adaptive filter is recommended.
To properly utilize the Notch filter, you will first need to identify the frequency
of the noise; this is best done using a Spectrum Analyze.
Initially set the Notch Depth to 60 dB and the Notch Width to the narrowest
possible value. Next, set the Notch Frequency to the noise frequency. Fine
adjustment of the Notch Frequency may be necessary to place the notch
precisely on top of the noise signal and achieve maximum reduction of the
noise. This is best done by adjusting the Notch Frequency up or down 1 Hz
at a time while listening to the Notch filter output on the headphones.
Often, the noise frequency will not remain absolutely constant but will vary
slightly due to modulation, recorder wow and flutter, and acoustic "beating."
Therefore, you may need to increase the Notch Width from its minimum
setting to keep the noise within the notch.
For maximum noise reduction, set the Notch Depth to 60dB. It is best to
adjust the Notch Depth up from 60 dB until the tone is observed, then
increase the depth 5 dB.
Figure A-7-1: Notch Filter Control Window
Description of controls is as follows:
Page 45
Notch Frequency:
Specifies frequency in Hertz which is to be removed from the
input audio. Minimum Notch Frequency is 0 Hz, while maximum
Notch Frequency depends upon the System Bandwidth setting.
Notch Frequency is adjustable in 1 Hz steps.
Notch Depth:
Depth of the notch that is generated. Notch Depth is adjustable
from 10 dB to 60 dB in 1 dB steps.
Notch Width:
Width of the generated notch in Hertz.
NOTE: Minimum Notch Width varies with the System
Bandwidth setting.
Hint: A notch filter is best for stable tones. It has a sharp bottom. If a flatter
bottom (stopband) is needed the bandstop filter may be preferred. Also, a
1CH Adaptive filter is useful in tracking varying tones.
A graphical description of the Notch filter and its controls follows in the figure below..
Figure A-7-2: Notch Filter Graphical Description
Page 46
8.0 SLOT FILTER
Application:
The Slot filter is used to isolate, or "slot,” a single-frequency signal, such as a
tone or a whistle, in the input audio, attenuating all other audio. This is the
exact opposite of the Notch filter function.
To properly utilize the Slot filter, you will first need to identify the frequency of
the signal to be isolated; this is best done using a Spectrum Analyzer.
Once the frequency of the signal has been identified, initially set Stopband
Attenuation to 60 dB and the Slot Width to the narrowest possible value.
Next, set the Slot Frequency to the signal frequency. Fine adjustment of the
Slot Frequency may be necessary to place the slot right on top of the signal.
This is best done by adjusting the Slot Frequency up or down 1 Hz at a time
while listening to the Slot filter output on the headphones.
Usually, the signal frequency will not remain constant but will vary slightly due
to modulation, recorder wow and flutter, and acoustic "beating.” Therefore,
you may need to increase the Slot Width from its minimum setting to avoid
having the signal move in and out of the slot.
Figure A-8-1: Slot Filter Control Window
To optimize background noise reduction for your application, set the
Stopband Attenuation to 60dB. If, however, you wish to leave a small amount
of the background noise mixed in with the isolated signal, adjust the Stopband
Attenuation to the desired value.
Description of controls is as follows:
Page 47
Slot Frequency:
Specifies frequency in Hertz which is to be enhanced in the
input audio. Minimum Slot Frequency is 30 Hz, while
maximum Slot Frequency depends upon the System
Bandwidth setting. Slot Frequency is adjustable in 1 Hz
steps.
Stopband
Specifies amount in dB by which frequencies other than the
Slot
Frequency are attenuated. Stopband attenuation is
adjustable from 10dB to 60dB in 1 dB steps.
Attenuation:
Slot Width:
Width of the generated slot in Hertz.
NOTE: Slot Width varies with the System Bandwidth setting.
A graphical description of the Slot filter and its controls follows in the figure below.
Note that the slot width is defined at its -6 dB points.
Figure A-8-2: Slot Filter Graphical Description
Page 48
9.0 20-BAND GRAPHIC EQUALIZER
Application:
The 20-band Graphic Equalizer is an easy-to-use linear-phase FIR digital
filter that is used to reshape the spectrum of the final output signal.
Reshaping is accomplished with twenty vertical scroll bars (also called "slider"
controls) which adjust the attenuation of each frequency band. These
controls are very similar to the slider controls found on analog graphic
equalizers found on many consumer stereo systems, and thus should be very
familiar to even the novice user.
However, unlike analog graphic equalizers, this digital equalizer has some
very powerful additional capabilities. For example, the Normalize button
allows the user to instantly move all slider controls up until the top slider is at
0dB. The Make All 0dB button instantly sets all the sliders to 0dB. The All
Down 1dB button instantly moves all sliders Down 1dB. None of these
functions is available in an analog graphic equalizer! Notice also that the 20
sliders are spread across the selected Bandwidth and that the frequency
spacing is optimized for voice processing.
Figure A-9-1: 20-Band Graphic Equalizer Control Window
Description of controls/indicators is as follows:
Slider controls:
The twenty vertical scroll bar "slider" controls are used to set
the frequency response of the equalizer. Each slider can set
the gain of its frequency band to any value between 0dB and
-40 dB in 1dB steps.
Center Frequency: Note that the Center Frequency of each band is labeled
underneath each slider, and that bands are more closely
spaced at low frequencies.
Page 49
Gain Indication:
Above each slider control, the gain for that frequency band is
given. The gain can also be visualized graphically by the
position of the slider control.
Normalize Button:
This button instantly shifts all slider controls up together until
the top slider is at 0dB. After normalization, the relative
positioning of the sliders remains the same. This allows the
digital equalizer to implement the desired equalization curve
with minimum signal loss.
Make All 0dB
Button:
This button instantly moves the slider controls for
all bands to 0dB, defeating the entire equalizer. This is a
useful feature when it is desired to reset all sliders from
scratch.
All Down 1dB
Button:
This button shifts all sliders down by 1dB from their
current position; no slider, however, will be allowed to go
below -40dB. This button allows the user to shift the entire
equalizer curve down so that there will be room to move one
or more sliders up relative to the others.
Page 50
10.0 SPECTRAL GRAPHIC EQUALIZER
Application:
In some applications, it may be necessary to precisely reshape the spectrum
of input audio prior to passing it through successive DSP filter stages. For
example, if the audio is from a microphone which has an unusual frequency
response curve (for example, a microphone acoustically modified as a result
of concealment), a compensation filter that reshapes the audio to a normal
spectral shape might be desirable.
The Spectral Graphic Equalizer is essentially a 115-band graphic equalizer;
however, instead of having 115 separate slider controls, it allows the user to
precisely draw the desired filter shape on the computer screen, using the
mouse, with as much or as little detail as desired. Once the filter shape has
been drawn, a linear-phase digital filter is constructed in the PC and
transferred to the external PCAP unit.
The Edit feature allows the user to make readjustments to the filter shape,
while the Normalize button allows the user to shift the entire filter curve up
until the highest point is at 0dB.
Figure A-10-1: Spectral Graphic Equalizer Window
Description of controls/indicators is as follows:
Filter Display:
Graphically displays the current shape of the filter. Also
used in conjunction with the mouse to draw a new filter
shape or to edit an existing one (see New, Edit, and
Normalize button descriptions). A grid is provided to assist
Page 51
the user in visually judging frequency and attenuation at any
point in the display.
Freq and Atten
Readouts:
Used to precisely readout the frequency in Hertz and
attenuation in
dB at any point in the filter curve. Hold the left Mouse button
down while editing the curve or drawing a new curve. These
readouts below the grid indicate precise frequencies and
attenuations. Releasing the button draws the segment.
The New, Edit, and Normalize buttons are used to graphically manipulate the
shape of the filter curve. Their functions are complex, and thus are best illustrated in
the following mini-tutorial:
1.
From the PicoDAC Filter Configuration Tabs, select the Spectral Graphic
Equalizer for Stage 1 of any filter. Set the System Bandwidth to 5 kHz
and AGC setting to No AGC.
2.
Click on the Control button for Stage 1 to bring up the Spectral Graphic
Equalizer control window. When used for the first time, the control window
will be the that of the previous figure.
3.
Click on the New button to draw a new filter. The screen will now appear
as follows:
Figure A-10-2: New Spectral Graphic Equalizer Display
Had you accidentally clicked the New button, you could click on Abort to
restore the previous filter.
Page 52
4.
You should now notice that all the buttons on the control window have
been replaced by a simple Abort button. Clicking on Abort at any time
prior to completing the curve draw restores the previous filter..
To draw the new filter curve, you will need to carefully click the mouse
cursor on points within the filter display area which correspond to the
desired attenuations at the desired frequencies.
While the mouse click button is held down, the Freq and Atten readouts
will be updated as the mouse is moved; you can use this feature to place
points in the filter curve at exact frequencies and attenuations. When the
mouse click button is released, a line segment will be drawn from the last
defined point on the curve to the current mouse cursor position.
For this example, placing points at precise frequencies and attenuations is
not required; draw the curve approximately as shown in the figure below
using mouse clicks.
Note that the very first click always sets the 0 Hz attenuation starting point.
Hint: To advance the frequency a single step move the cursor to the left
of the last frequency position and click to mouse. The curve will advanced
the smallest step at the specified attenuation.
Figure A-10-3: Spectral Graphic Draw in Progress
5.
Complete drawing the filter curve as shown below by drawing points all
the way to the right edge of the filter display area.
Page 53
Figure A-10-4: Completed Spectral Graphic Draw
When you have drawn the last point (must be at or beyond the right edge
of the filter display area), the Spectral Graphic control window will return
to normal appearance.
6.
Suppose you decide that you would like to remove the "dip" which occurs
in the filter curve at approximately 3000 Hz in the figure, above. Click on
Edit to bring up the following display:
Figure A-10-5: Spectral Graphic Edit Window
In this window, you can make the entire filter curve drop by a specified
amount prior to editing the curve. This can be used to create headroom
which can be used to increase the gain (decrease the attenuation) in one
portion of the curve relative to the rest of the curve. For now, select a
drop of 0dB (No Drop) and click on Proceed.
Page 54
7.
You should now notice that all the buttons on the control window have
been replaced with a single Abort button, which permits returning to the
pre-Edit filter.
To edit out the dip, you will first need to define the edit region by carefully
specifying the left and right edges of the portion of the filter curve that you
wish to modify. Click your mouse to the left and to the right of the dip to
produce the following display:
Figure A-10-6: Spectral Graphic Define Edit Region
8.
Now, draw in the new portion of the filter curve using mouse clicks as in
Step 4, above, roughly as shown below.
Figure A-10-7: Spectral Edit In Progress
9.
Complete drawing the new portion of the filter curve as shown below by
drawing points all the way to the right edge of the edit region:
Page 55
Figure A-10-8: Completed Spectral Graphic Edit
When you have drawn the last point (must be at or beyond the right edge
of the edit region), the mouse cursor will change to an "hourglass" shape
for a few seconds while the filter is being recalculated. When the
calculations are complete, the mouse cursor and the buttons in the
Spectral Graphic control window will return to normal appearance.
10.
Normalizing the filter places the highest point on the filter curve at 0 dB.
Doing so minimizes loss in the filter and preserves system dynamic range.
Now normalize the filter curve to 0dB by clicking the Normalize button.
You should see the mouse cursor change to the "hourglass" shape for a
few seconds; when the normalization calculations are complete, the filter
shape should appear as follows:
Figure A-10-9: Normalized Spectral Graphic Equalizer
This completes the Spectral Graphic Equalizer mini-tutorial.
Page 56
11.0 IMPORTED COEFFICIENT FILE
Application:
The Imported Coefficient file is available for inputting filters created via other
synthesis software. Several math software packages (such as Matlab) are
available from other vendors. These packages provide high level math
functions for computing complex filters. Once the filters have been calculated
the results can be stored in floating point format in a standard hex file. The
PicoDAC Configuration Software is able to import these files and convert
them into the format necessary for transfer into the PicoDAC.
Figure A-11-1: Open Imported Coefficient File Dialog Box
Description of controls are follows:
Open File Dialog:
Box
The only control available for this filter is the Open File
Dialog Box that appears when the Control button is
pressed. This window allows the user to select the filter file
from any location on the local computer or network. The
default file extension is ".txt.” If this is not the file extension
of the coefficient file then click on the Files of Type selection
box to choose "All Files (*.*)". This option will allow you to
see all files in the current directory. Once the appropriate file
is selected press OK. (The "Open as read-only" is not
applicable to the coefficient file and is to be ignored.)
Page 57
11.1 Coefficient File Format
The coefficient file format is restricted to only accept floating point numbers in the
range of +1.0 and -1.0. If a coefficient exceeds this limitation the software will clip
the coefficient to it's closest maximum. Each coefficient needs to be in standard
decimal notation or scientific notation. The following are some examples of floating
point coefficients in decimal format:
0.3455
0.0008975
Scientific notation is in the form:
mantissaE[+-]exponent
The following are some examples of floating point coefficients in scientific format:
3.25E-003
5.36E-2
1.25E-004
8.1234E2
=
=
=
=
0.003250
0.0536
0.000125
812.34
(clipped to +1.0 by the PicoDAC software)
Only one coefficient may be located on a line. The coefficients can be comma
separated, but must still be stored on to a line. The PicoDAC only uses 256
coefficients for each filter stage. If a file contains more than 256 coefficients those
remaining after the 256 are read are ignored. Conversely if a file contains less than
256 coefficients the remaining coefficients are set to zero. If the coefficient file is not
set in the correct format the PicoDAC software will not load the file and popup a
message box informing the user.
When the Imported Coefficient File is selected as the filter type for the stage it's
default coefficients are set up as a digital bypass. Once a valid coefficient file is
loaded it's data stored in the PicoDAC configuration can be stored in a settings file
for later retrieval without the need of the original coefficient file.
NOTE: Keep in mind that the sample frequency will affect the results of the filter.
The floating point filter coefficients are normally set up using a specific sampling
frequency. If the coefficients are used in a filter with a different sampling frequency
the filter will be skewed.
Below is an example coefficient file containing 53 filter coefficients:
4.387280E-003
1.262311E-002
7.795490E-003
-5.957981E-003
-1.444848E-002
Page 58
-7.919611E-003
7.957611E-003
1.674714E-002
8.028165E-003
-1.060535E-002
-1.978514E-002
-8.120655E-003
1.430844E-002
2.407519E-002
8.196839E-003
-1.991908E-002
-3.074622E-002
-8.256326E-003
2.956892E-002
4.286449E-002
8.298883E-003
-5.050633E-002
-7.269745E-002
-8.324551E-003
1.334762E-001
2.797442E-001
3.416667E-001
2.797442E-001
1.334762E-001
-8.324551E-003
-7.269745E-002
-5.050633E-002
8.298883E-003
4.286449E-002
2.956892E-002
-8.256326E-003
-3.074622E-002
-1.991908E-002
8.196839E-003
2.407519E-002
1.430844E-002
-8.120655E-003
-1.978514E-002
-1.060535E-002
8.028165E-003
1.674714E-002
7.957611E-003
-7.919611E-003
-1.444848E-002
-5.957981E-003
7.795490E-003
1.262311E-002
4.387280E-003
Page 59
Page 60
12.0 PASS THRU FILTER
Application:
The Pass Thru Filter is used to pass the audio through the PicoDAC
unaffected (except by the bandwidth limitations of the sampling frequency). It
is often used in conjunction with other filters when only one stage is a
PicoDAC filter is needed. An easy way to bandlimit the audio to one of the
PicoDACs bandwidth settings is to configure both stages in a filter to be Pass
Thru Filters. The AGC can be used in conjunction with the Pass Thru filters
for automatic level adjustment
Figure A-12-1: Pass Thru Filter Selection
There are no control options for a Pass Thru filter and the Control button is
deactivated when the Pass Thru filter is selected for a stage.
Page 61