1
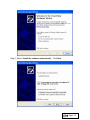
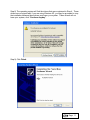
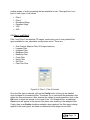
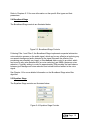
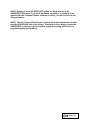
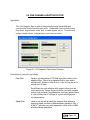
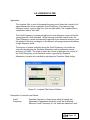
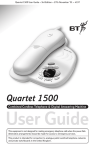
AUDIOPHILE
Front-End Audio Processing and
Voice Detection System
CONFIGURATION SOFTWARE USER’S MANUAL
Version 1.3
AUDIOPHILE
Front-End Audio Processing and
Voice Detection System
CONFIGURATION SOFTWARE USER’S MANUAL
Version 1.3
June 13, 2006
Document Number 060317ADT
Phone:
Fax:
919 572 6767
919 572 6786
[email protected]
www.dacaudio.com
Copyright © 2006 by Digital Audio Corporation
All rights reserved.
TABLE OF CONTENTS
1. 0 OVERVIEW .............................................................................................................. 6
1.1 Introduction............................................................................................................ 6
1.2 Installation ............................................................................................................. 7
2. 0 AUDIOPHILE CONFIGURATION CONTROL ........................................................ 13
2.1 AUDIOPHILE Command Center.......................................................................... 13
2.2 Customizing Filters .............................................................................................. 13
2.3 Filter 1 and Filter 2............................................................................................... 14
2.4 Broadband Stage................................................................................................. 15
2.5 Equalizer Stage ................................................................................................... 15
2.6 VOX ..................................................................................................................... 16
2.7 Automatic Gain Control........................................................................................ 17
2.8 Programming the AUDIOPHILE .......................................................................... 17
2.9 Synchronization Options...................................................................................... 19
3. 0 STORING FILTER CONFIGURATIONS ................................................................ 20
3.1 Save File Dialog Box ........................................................................................... 20
4. 0 RECALLING FILTER CONFIGURATIONS ............................................................ 22
4.1 Open File Dialog Box........................................................................................... 22
5. 0 ONE CHANNEL ADAPTIVE FILTER ..................................................................... 24
6. 0 LOWPASS FILTER ................................................................................................ 26
7. 0 HIGHPASS FILTER ............................................................................................... 28
8. 0 BANDPASS FILTER .............................................................................................. 30
9. 0 BANDSTOP FILTER .............................................................................................. 33
10. 0 COMB FITLER ..................................................................................................... 35
11. 0 NOTCH FILTER ................................................................................................... 38
12. 0 SLOT FILTER....................................................................................................... 40
13. 0 PASSTHROUGH FILTER .................................................................................... 42
Page 4
14. 0 BROADBAND STAGE ......................................................................................... 43
15. 0 20-BAND GRAPHIC EQUALIZER........................................................................ 44
16. 0 HI-RES GRAPHIC EQUALIZER........................................................................... 46
17. 0 ADAPTIVE SPECTRAL INVERSE FILTER.......................................................... 48
18. 0 VOX ALGORITHM ............................................................................................... 53
19. 0 AGC ALGORITHM ............................................................................................... 55
LIST OF FIGURES
Figure 2-1: AUDIOPHILE Command Center ................................................................. 13
Figure 2-2: Filter 1 / Filter 2 Controls............................................................................. 14
Figure 2-3: Broadband Stage Controls.......................................................................... 15
Figure 2-4: Equalizer Stage Controls ............................................................................ 15
Figure 2-5: VOX Controls .............................................................................................. 16
Figure 2-6: AGC Controls.............................................................................................. 17
Figure 2-7: AUDIOPHILE Front Panel USB Connector ................................................. 18
Figure 2-8: AUDIOPHILE Communications Error Message .......................................... 18
Figure 3-1: Save As Setup File Window........................................................................ 20
Figure 4-1: Open Settings File Window......................................................................... 22
Figure 5-1: 1CH Adaptive Filter Control Window........................................................... 24
Figure 6-1: Lowpass Filter Control Window................................................................... 26
Figure 6-2: Lowpass Filter Graphical Description.......................................................... 27
Figure 7-1: Highpass Filter Control Window.................................................................. 28
Figure 7-2: Highpass Filter Graphical Description ......................................................... 29
Figure 8-1: Bandpass Filter Control Window................................................................. 30
Figure 8-2: Bandpass Filter Graphical Description ........................................................ 32
Figure 9-1: Bandstop Filter Control Window.................................................................. 33
Figure 9-2: Bandstop Filter Graphical Description......................................................... 34
Figure 10-1: Comb Filter Control Window ..................................................................... 35
Figure 10-2: Comb Filter Graphical Description ............................................................ 37
Figure 11-1: Notch Filter Control Window ..................................................................... 38
Figure 11-2: Notch Filter Graphical Description ............................................................ 39
Figure 12-1: Slot Filter Control Window......................................................................... 40
Figure 12-2: Slot Filter Graphical Description................................................................ 41
Figure 13-1: Pass Thru Filter Selection ......................................................................... 42
Figure 15-1: 20-Band Graphic Equalizer Control Window............................................. 44
Figure 16-1: Spectral Graphic Equalizer Window.......................................................... 46
Figure 17-1: ASIF control window ................................................................................ 49
Figure 17-2: ASIF custom curve drawing window ......................................................... 51
Figure 18-1: VOX Algorithm Block Diagram .................................................................. 54
Page 5
1.0 OVERVIEW
1.1 Introduction
The AUDIOPHILE Configuration Software allows for complete setup and intuitive,
interactive control of all the audio processing on the AUDIOPHILE, via USB connection
between the AUDIOPHILE hardware and a Windows®-based PC. Once properly
configured for the application, all processing settings can be saved in the
AUDIOPHILE’s internal flash memory for stand-alone operation without the computer
connection.
The processing configuration can consist of any or all of the following options:
•
•
•
•
•
Two FIR stages (adaptive or fixed), up to 512 taps each
o Nine different filter types to choose from
Spectral subtraction broadband noise reduction filter
o User-controllable filter amount (0-100%)
Equalizer stage
o Three different types to choose from, including adaptive spectral inverse
Smart “VOX” speech activity detection algorithm
o Adjustable pre- and post- detection event parameters
Automatic Gain Control (AGC)
o 10, 20, or 30dB maximum gain settings
Each stage of processing can be enabled, disabled, and custom configured, even as
the AUDIOPHILE unit continues to operate on the incoming audio signal. Descriptions
of each filter type, its application, and a definition of the control parameters can be
found in Chapters 5-19.
Page 6
1.2 Installation
To install the AUDIOPHILE software, simply insert the AUDIOPHILE Installation CD into
your CD-ROM drive. If the installation software does not automatically run after several
seconds you will need to manually start the installation as follows:
With the AUDIOPHILE Installation CD in your CD-ROM drive click on the Start
menu and then the Run option. In the window that appears type:
X:\setup.exe
And click OK or hit the Enter key. Where “X” is the drive letter of your CD-ROM.
The installation program will then start.
Step 1) The InstallShield Wizard will open and inform you that it’s about to install
Audiophile Command Center on your computer. Click Next.
Step 2) The Audiophile Command Center software will be installed into your Program
Files directory. Click Install.
Page 7
Step 3) The software will copy itself into the appropriate directory. Click Finish when it
completes.
Page 8
Step 4) After Finish is clicked, you will see a command-line window pop up for a few
seconds and then disappear. This is normal. It is registering the drivers with the
operating system that will be used to communicate to the Audiophile hardware.
Step 5) At this point, you should see an Audiophile Command Center icon on your
desktop. Turn on your Audiophile hardware and connect it to the PC using the supplied
USB cable.
Step 6) When Windows is notified of the new hardware, you will see the “Found New
Hardware Wizard” appear. Select “No, not this time” to tell Windows not to try to
download a driver from the Windows Update Service. Click Next.
Page 9
Step 7) Select “Install the software automatically”. Click Next.
Page 10
Step 8) The operating system will find the drivers that were registered in Step 4. These
drivers are not signed and, if you are using Windows XP, you may be prompted to stop
the installation because these drivers may harm your system. These drivers will not
harm your system, click “Continue Anyway”.
Step 9) Click Finish.
Page 11
You can now run the Audiophile software by clicking on the Audiophile icon located on
your desktop or under your Start menu.
Page 12
2.0 AUDIOPHILE CONFIGURATION CONTROL
2.1 AUDIOPHILE Command Center
Figure 2-1: AUDIOPHILE Command Center
At the top of the AUDIOPHILE Command Center window is a Menu Bar. From the File
menu item you can choose to Open a filter settings file, Save filter settings to a
specified file name, or Exit the software. From the Hardware menu item you can
Program settings to the AUDIOPHILE internal flash memory, Connect or Disconnect
the USB communications with the unit and select an option to Synchronize To
Hardware On Connect. From the Help menu item, you can view the Contents of this
help file (not yet available in version 1.0), or read information About the AUDIOPHILE
software.
Below the Menu Bar is the Toolbar. Each small icon allows a quick shortcut to some of
the Menu Bar items. Each icon represents the menu function of Open, Save, and
Program the AUDIOPHILE, respectively.
2.2 Customizing Filters
The AUDIOPHILE Command Center allows all audio processing settings to be
configured using interactive software controls, while connected to the AUDIOPHILE
hardware via USB connection. One all settings configured as needed for the application,
they can be stored to the internal flash memory using the Program feature. There are
Page 13
multiple stages of audio processing that are available for use. The signal flow, from
input to final output, is as follows:
•
•
•
•
•
•
Filter 1
Filter 2
Broadband Stage
Equalizer Stage
VOX
AGC
2.3 Filter 1 and Filter 2
Filter 1 and Filter 2 are identical FIR stages, each having one of nine possible filter
types available for use, selectable via drop-down menu. These are:
•
•
•
•
•
•
•
•
•
One Channel Adaptive Filter (512 taps maximum)
Lowpass Filter
Highpass Filter
Bandpass Filter
Bandstop Filter
Comb Filter
Notch Filter
Slot Filter
Pass Thru Filter
Figure 2-2: Filter 1 / Filter 2 Controls
Once the filter type is selected, click on the Config button to bring up the detailed
control window for the selected filter. This allows you to customize the parameters that
define the filter performance. After selecting the values for each parameter, click on the
OK button to close the window. In the case of the 1-CH Adaptive filter, an additional
Clear button will appear on the screen; this allows user resetting of the adaptive filter.
Finally, there is an Enable checkbox available; when checked, the filter stage is being
applied to the audio signal, but when un-checked the filter stage has no effect.
Page 14
Refer to Chapters 5-13 for more information on the specific filter types and their
parameters.
2.4 Broadband Stage
The Broadband Stage controls are illustrated below:
Figure 2-3: Broadband Stage Controls
Following Filter 1 and Filter 2, the Broadband Stage implements a spectral subtraction
noise reduction process on the audio signal, which can be very effective at reducing any
non-speech background audio detected in the signal. Because the effects of the
processing are potentially very harsh, a filter Amount slider control is provided, which
can be set to any value between 0% (no noise reduction) and 100% (maximum noise
reduction). Typically setting to control to approximately 70% provides the best balance
between good background noise reduction and minimal induced artifact in the voice
signal.
See Chapter 14 for more detailed information on the Broadband Stage noise filter
algorithm.
2.5 Equalizer Stage
The Equalizer Stage controls are illustrated below:
Figure 2-4: Equalizer Stage Controls
Page 15
Following the Broadband Stage, the Equalizer Stage applies the specified equalization
method to the audio signal. Three different equalization methods are available for use.
These are:
•
•
•
20-Band Graphic Equalizer
Hi-Res Graphic Equalizer
Adaptive Spectral Inverse Filter (automatic equalizer)
Once the equalizer type is selected, click on the Config button to bring up the detailed
control window for the selected equalizer. This allows you to make adjustments as
desired for best sound and intelligibility. After adjusting, click on the OK button to close
the window. In the case of the Adaptive SIF, an additional Clear button will appear on
the screen; this allows the user to reset the algorithm and re-equalize from scratch.
Finally, there is an Enable checkbox available; when checked, the equalizer stage is
being applied to the audio signal, but when un-checked it has no effect.
Refer to Chapters 15-17 for more information on the specific equalizer types and their
parameters.
2.6 VOX
The VOX controls are illustrated below:
Figure 2-5: VOX Controls
Following the Equalizer Stage, the VOX implements a speech activity detection
algorithm on the audio signal, which, when enabled, allows subsequently connected
recording equipment to record only the portions of the audio signal that contain speech.
A “Speech Activity” LED indicator is provided; whenever voice is detected, this indicator
will illuminate GREEN. For each detection event, audio signal that occurs within the
Pre-event time prior to the event is considered to be speech, as is the audio signal that
Page 16
occurs within the Post-event time after the event. When the Enable checkbox is
checked, all non-speech sections of the output audio will be replaced with Silence or C
Tone, as specified by the radio buttons. The Detection Threshold allows the user to
select how far above the noise floor the signal needs to be before it is considered a
voice signal.
See Chapter 18 for more detailed information on the VOX algorithm.
2.7 Automatic Gain Control
The Automatic Gain Control (AGC) controls are illustrated below:
Figure 2-6: AGC Controls
Following the VOX, the AGC implements an audio level compression function that
automatically compensates for near/far party level differences, as well as low-level
audio signal remaining after the multiple noise reduction stages have been applied.
See Chapter 19 for more detailed information on the AGC.
2.8 Programming the AUDIOPHILE
The USB port on the AUDIOPHILE front panel provides the connection between the PC
and the AUDIOPHILE which allows software programming and operation of the unit.
Simply connect the supplied 5-pin “mini-B” cable between the AUDIOPHILE’s USB port
and any free USB port on your computer and/or USB hub, making sure the unit is
powered “on”, and the supplied software driver will provide the necessary connection.
Page 17
Figure 2-7: AUDIOPHILE Front Panel USB Connector
With the AUDIOPHILE unit properly connected to the PC, the Command Center
software will, when launched, automatically Connect to the hardware and establish
communication. If, for whatever reason, this communication cannot be established, the
following error message will appear:
Figure 2-8: AUDIOPHILE Communications Error Message
Once the communication has been established, the hardware will automatically
synchronize to the current state of the software, and full interactive software control will
commence. Any changes made to the processing settings in the Command Center
software will have instant audible effect in the AUDIOPHILE hardware, in a very similar
manner to more sophisticated DAC products such as the PCAP and CARDINAL.
However, please note that the software settings WILL NOT affect the parameters stored
in the AUDIOPHILE internal flash memory until the Program feature has been
activated. There are two ways to program the AUDIOPHILE flash memory:
1. Using the Menu Bar, click Hardware, then Program Settings, or
2. Click the
icon on the Toolbar.
As a failsafe feature, whenever you attempt to Exit the Command Center software
without having reprogrammed the flash memory, a “nag” message will appear to remind
you that this needs to be done.
Page 18
Should you choose not to reprogram the unit, please keep in mind that the
AUDIOPHILE hardware will revert to its previous flash memory settings after you have
exited the software.
NOTE: the AUDIOPHILE always uses its flash memory settings whenever it is not
connected with the Command Center software. Command Center software
settings ONLY become non-volatile when the Program feature is activated. The
hardware unit will always reset itself to the flash memory settings after being
disconnected from the software (this may have the unintended result of clearing
any adaptive filters that may be currently running).
2.9 Synchronization Options
Whenever the software connects to an Audiophile hardware unit, synchronization MUST
occur to maintain consistency between what is displayed in the interface and what is
currently running on the unit. The user has two choices; either the software will push
down to the hardware its current settings (and thereby changing what is currently
running on the unit) OR the software will retrieve the current settings directly from the
hardware and update its interface accordingly (and leave the hardware essentially
unchanged).
It is important to remember that, regardless of which option is selected, after the
synchronization occurs the PC software will now be in control and any changes made
will be sent down to the hardware unit.
This option can be accessed in the Hardware menu. If the user wishes for the software
to retrieve the settings from the hardware, the Synchronize To Hardware On Connect
should be checked. This setting will be remembered between software restarts.
NOTE: upon Disconnect the hardware will always perform a reset and reload
whatever is stored in its flash memory – even if no changes were made to the
configuration. This may have the unintended side effect of resetting any adaptive
filters.
Page 19
3.0 STORING FILTER CONFIGURATIONS
3.1 Save File Dialog Box
Application:
To save time configuring the AUDIOPHILE control settings, complete setups may
easily be stored to disk setup files for future recall.
Store a setup to a disk file as follows:
1. Click on File on the AUDIOPHILE menu bar. When the pull-down menu
appears, click on Save Settings. Alternatively, click on the
Toolbar). This will cause the following window to appear:
icon on the
Figure 3-1: Save As Setup File Window
2. You will need to specify a filename for the setup. Click on the File Name text
box, then type the desired filename. All setup filenames must have the .APS
extension; thus, if necessary, the .APS extension is automatically appended
to whatever name is typed into the text box.
Page 20
3. Click on Save to store the setup file with the selected filename to the
specified drive and directory.
NOTE: The file "default.aps" is the configuration file stored in the installation
directory that holds the initial startup information for the AUDIOPHILE software.
Each time the AUDIOPHILE software is run, these settings are loaded (unless the
“Synchronize To Hardware” option is selected). However, please also note that
the default.aps file is NOT automatically re-written when the software exits;
therefore, any changes made to the settings while the software is open will not be
retained unless explicitly saved to a file by the user.
Page 21
4.0 RECALLING FILTER CONFIGURATIONS
4.1 Open File Dialog Box
Application:
To save time configuring control settings in the AUDIOPHILE control settings,
complete setups previously stored may be recalled from disk files with a few
simple mouse clicks.
Open a setup from a disk file as follows:
1. Click on File on the AUDIOPHILE menu bar. When the pull-down menu appears,
click on Open Settings File. Alternatively, click on the
This will cause the following window to appear:
icon on the toolbar).
Figure 4-1: Open Settings File Window
2. Once the desired setup file name has been found, either double-click it or select
and click on Open to recall it. The file will be loaded into both the software and
the hardware.
Page 22
NOTE: Opening a setup file DOES NOT update the flash memory in the
AUDIOPHILE hardware. If you want the loaded parameters to continue to be
applied after the Command Center software is exited, you will need to use the
Program feature.
NOTE: The file "Factory Defaults.aps" contains the original parameters loaded
into the AUDIOPHILE unit at the factory. Therefore, you can always restore the
AUDIOPHILE to factory original condition simply by opening this file and reprogramming the flash memory
Page 23
5.0 ONE CHANNEL ADAPTIVE FILTER
Application:
The 1CH Adaptive filter is used to automatically cancel predictable and
convolutional noises from the input audio. Predictable noises include tones,
hum, buzz, engine/motor noise, and, to some degree, music. Convolutional
noises include echoes, reverberations, and room acoustics.
Figure 5-1: 1CH Adaptive Filter Control Window
Description of controls is as follows:
Filter Size:
Used to set the number of FIR filter taps (filter order) in the
adaptive filter. Filter size is indicated both in taps and in
milliseconds. Minimum Filter Size is 1 tap, but can be set to
as high as 512 taps.
Small filters are most effective with simple noises such as
tones and music. Larger filters should be used with complex
noises such as severe reverberations and raspy power hums.
A nominal filter size of 256 taps is a good overall general
recommendation.
Adapt Rate:
Used to set the rate at which the adaptive filter adapts to
changing signal conditions (Mathematically known as "Mu").
A Mu of 1 provides very slow adaptation, while a Mu of 5884
provides fastest adaptation.
Page 24
Larger adapt rates should be used with changing noises such
as music; whereas, smaller adapt rates are acceptable for
stable tones and reverberations. Larger adapt rates
sometimes affect voice quality, as the filter may attack
sustained vowel sounds.
Auto Normalize:
When selected, the specified Adapt Rate is continuously
rescaled depending upon the input signal level. This makes
the filter convergence rate consistent regardless of the audio
level being applied to the input. When not selected, the
specified Adapt Rate Mu is applied to the filter at all times.
Overall convergence rate tends to be faster, and more
consistent, when the Auto Normalize feature is selected.
Prediction Span:
Sets the number of samples in the prediction span delay line.
Prediction span is indicated both in samples and in
milliseconds, and can be adjusted from 1 to 64 samples.
Shorter prediction spans allow maximum noise removal, while
longer prediction spans preserve voice naturalness and
quality. A prediction span of 2 or 3 samples is normally
recommended.
Processor Output: Used to select the output of the filter. The Normal setting
allows the audio remaining after predictable noises have
been subtracted to be output. The Rejected setting allows the
predicted noises to be output, effectively allowing you to hear
what the filter is removing.
Clear Button:
Used to clear the adaptive filter coefficients and cause the
filter solution to rebuild from scratch.
Page 25
6.0 LOWPASS FILTER
Application:
The Lowpass filter is used to decrease the energy level (lower the volume) of all
signal frequencies above a specified Cutoff Frequency, thus reducing highfrequency noises, such as tape hiss, from the input audio. The Lowpass filter is
sometimes called a "hiss filter."
The Cutoff Frequency is usually set above the voice frequency range so that the
voice signal will not be disturbed. While listening to the filter output audio, the
Cutoff Frequency can be incrementally lowered from its maximum frequency until
the quality of the voice just begins to be affected, achieving maximum elimination
of high-frequency noise.
The amount of volume reduction above the Cutoff Frequency can further be
controlled by adjusting the Stopband Attenuation setting (maximum volume
reduction is 120dB). The slope at which the volume is reduced from normal (at
the Cutoff Frequency) to the minimum volume (specified by Stopband
Attenuation) can also be controlled by adjusting the Transition Slope setting.
Figure 6-1: Lowpass Filter Control Window
Description of controls is as follows:
Cutoff
Frequency:
Specifies frequency in Hertz above which all signals are
attenuated. Frequencies below this cutoff are unaffected.
Minimum Cutoff Frequency is 0 Hz, while the maximum Cutoff
Page 26
Frequency is 8800 Hz. Cutoff Frequency can be adjusted in 1
Hz steps.
Stopband
Attenuation:
Specifies amount in dB by which frequencies above the Cutoff
Frequency are ultimately attenuated. Stopband attenuation is
adjustable from 0dB to 120dB in 1 dB steps.
Transition
Slope:
Specifies slope at which frequencies above the Cutoff
Frequency are rolled off in dB per octave. Sharpest roll-off
occurs when Transition Slope is set to maximum, while gentlest
roll-off occurs when Transition Slope is set to minimum. Sharp
roll-offs may cause the voice to sound hollow but will allow more
precise removal of high frequency noises. Note that the
indicated value changes depending upon Cutoff Frequency.
A graphical description of the lowpass filter and its controls is given below.
Figure 6-2: Lowpass Filter Graphical Description
Page 27
7.0 HIGHPASS FILTER
Application:
The Highpass filter is used to decrease the energy level (lower the volume) of all
signal frequencies below a specified Cutoff Frequency, thus reducing lowfrequency noises, such as tape or acoustic room rumble, from the input audio
(The Highpass filter is sometimes called a "rumble filter").
The Cutoff Frequency is usually set below the voice frequency range
(somewhere below 300 Hz) so that the voice signal will not be disturbed. While
listening to the filter output audio, the Cutoff Frequency, initially set to 100 Hz,
can be incrementally increased until the quality of the voice just begins to be
affected, achieving maximum elimination of low-frequency noise.
The amount of volume reduction below the Cutoff Frequency can further be
controlled by adjusting the Stopband Attenuation setting (maximum volume
reduction is 120dB). The slope at which the volume is reduced from normal (at
the Cutoff Frequency) to the minimum volume (specified by Stopband
Attenuation) can also be controlled by adjusting the Transition Slope setting.
Figure 7-1: Highpass Filter Control Window
Description of controls is as follows:
Cutoff Frequency:
Specifies frequency in Hertz below which all signals are attenuated.
Frequencies above this cutoff are unaffected. Minimum Cutoff
Frequency is 0 Hz (no frequencies attenuated), while the maximum
Cutoff Frequency is 8800 Hz. Cutoff Frequency can be adjusted in
1 Hz steps.
Page 28
Stopband
Attenuation:
Specifies amount in dB by which frequencies below the
Cutoff Frequency are ultimately attenuated. Stopband attenuation
is adjustable from 0dB to 120dB in 1 dB steps.
Transition Slope:
Specifies slope at which frequencies below the Cutoff Frequency
are attenuated in dB per octave. Sharpest attenuation occurs when
Transition Slope is set to maximum, while gentlest attenuation
occurs when Transition Slope is set to minimum. Note that the
indicated value changes depending upon Cutoff Frequency.
A graphical description of the highpass filter and its controls is shown below.
Figure 7-2: Highpass Filter Graphical Description
Page 29
8.0 BANDPASS FILTER
Application:
The Bandpass filter is used to decrease the energy level (lower the volume) of all
signal frequencies below a specified Lower Cutoff Frequency and above a
specified Upper Cutoff Frequency, thus combining the functions of a seriesed
Lowpass and Highpass filter into a single filter. The signal region between the
Lower Cutoff Frequency and the Upper Cutoff Frequency is called the passband
region. The Bandpass filter is useful for simultaneously reducing both lowfrequency rumble and high-frequency hiss.
The Lower Cutoff Frequency is usually set below the voice frequency range
(somewhere below 300 Hz) so that the voice signal will not be disturbed. While
listening to the filter output audio, the Lower Cutoff Frequency, minimum of 0 Hz,
can be incrementally increased until the quality of the voice just begins to be
affected, achieving maximum elimination of low-frequency noise.
The Upper Cutoff Frequency is usually set above the voice frequency range
(somewhere above 3000 Hz) so that the voice signal will not be disturbed. While
listening to the filter output audio, the Upper Cutoff Frequency, minimum setting
of 100Hz over the Lower Cutoff Frequency, can be incrementally lowered until
the quality of the voice just begins to be affected, achieving maximum elimination
of high-frequency noise.
The amount of volume reduction outside the passband region can further be
controlled by adjusting the Stopband Attenuation setting (maximum volume
reduction is 120dB). The slope at which the volume is reduced from normal (at
each Cutoff Frequency) to the minimum volume (specified by Stopband
Attenuation) can also be controlled by adjusting the Transition Slope setting.
Figure 8-1: Bandpass Filter Control Window
Page 30
Description of controls is as follows:
Lower Cutoff
Frequency:
Specifies frequency in Hertz below which all signals are
attenuated. Frequencies between this cutoff and the Upper
Cutoff Frequency are unaffected. Minimum Lower Cutoff
Frequency is 0 Hz, while the maximum Lower Cutoff Frequency
is 10 Hz below the Upper Cutoff Frequency. Lower Cutoff
Frequency can be adjusted in 1 Hz steps.
NOTE: The Lower Cutoff Frequency can never be set
higher than 10 Hz below the Upper Cutoff Frequency.
Upper Cutoff
Frequency:
Specifies frequency in Hertz above which all signals are
attenuated. Frequencies between this cutoff and the Lower
Cutoff Frequency are unaffected. Minimum Upper Cutoff
Frequency is 10 Hz above the Lower Cutoff Frequency, while
the maximum Upper Cutoff Frequency is 8800 Hz. Upper Cutoff
Frequency can be adjusted in 1 Hz steps.
NOTE: The Upper Cutoff Frequency can never be set lower
than 10 Hz above the Lower Cutoff Frequency.
Transition Slope:
Specifies slope at which frequencies below the Lower Cutoff
Frequency and above the Upper Cutoff Frequency are
attenuated in dB per octave. Sharpest attenuation occurs when
Transition Slope is set to maximum, while gentlest attenuation
occurs when Transition Slope is set to minimum. Note that the
indicated value changes depending upon Cutoff Frequency.
Also, note that the Lower and Upper Transition Slopes always
have different values; this is because the frequency width of an
octave is proportional to Cutoff Frequency.
Stopband
Attenuation:
Specifies amount in dB by which frequencies below the Lower
Cutoff Frequency and above the Upper Cutoff Frequency are
ultimately attenuated. Stopband Attenuation is adjustable from
0dB to 120dB in 1 dB steps.
A graphical description of the Bandpass filter and its controls follows in the figure below.
Page 31
Figure 8-2: Bandpass Filter Graphical Description
Page 32
9.0 BANDSTOP FILTER
Application:
The Bandstop filter is used to decrease the energy level (lower the volume) of all
signal frequencies above a specified Lower Cutoff Frequency and below a
specified Upper Cutoff Frequency. The signal region between the Lower Cutoff
Frequency and the Upper Cutoff Frequency is called the stopband region. The
Bandstop filter is useful for removing in-band noise from the input signal.
The Lower Cutoff Frequency is usually set below the frequency range of the
noise, while the Upper Cutoff Frequency is set above the frequency range of the
noise. While listening to the filter output audio, the Lower and Upper Cutoff
Frequencies can be incrementally adjusted to achieve maximum elimination of
noise while minimizing loss of voice.
The amount of volume reduction in the stopband region can further be controlled
by adjusting the Stopband Attenuation setting (maximum volume reduction is
120dB). The slope at which the volume is reduced from normal (at each Cutoff
Frequency) to the minimum volume (specified by Stopband Attenuation) can also
be controlled by adjusting the Transition Slope setting.
Figure 9-1: Bandstop Filter Control Window
Description of controls is as follows:
Lower Cutoff
Frequency:
Specifies frequency in Hertz below which no signals are
attenuated. Frequencies between this cutoff and the Upper
Cutoff Frequency are attenuated. Minimum Lower Cutoff
Frequency is 0 Hz, while the maximum Lower Cutoff Frequency
Page 33
is 10 Hz below the Upper Cutoff Frequency. Lower Cutoff
Frequency can be adjusted in 1 Hz steps.
NOTE: The Lower Cutoff Frequency can never be set
higher than 10 Hz below the Upper Cutoff Frequency.
Upper Cutoff
Frequency:
Specifies frequency in Hertz above which no signals are
attenuated. Frequencies between this cutoff and the Lower
Cutoff Frequency are attenuated. Minimum Upper Cutoff
Frequency is 10 Hz above the Lower Cutoff Frequency, while
the maximum Upper Cutoff Frequency is 8800 Hz. Upper Cutoff
Frequency can be adjusted in 1 Hz steps.
NOTE: The Upper Cutoff Frequency can never be set lower
than 10 Hz above the Lower Cutoff Frequency.
Transition
Slope:
Specifies slope at which frequencies above the Lower
Cutoff Frequency and below the Upper Cutoff Frequency are
attenuated in dB per octave. Sharpest attenuation occurs when
Transition Slope is set to maximum, while gentlest attenuation
occurs when Transition Slope is set to minimum. Note that the
indicated value changes depending upon Cutoff Frequency and
Configuration. Also, note that the Lower and Upper Transition
Slopes always have different values; this is because the
frequency width of an octave is proportional to Cutoff
Frequency.
Stopband
Attenuation:
Specifies amount in dB by which frequencies above the
Lower Cutoff Frequency and below the Upper Cutoff Frequency
are attenuated. Stopband attenuation is adjustable from 0dB to
120dB in 1 dB steps.
A graphical description of the Bandstop filter and its controls follows in the figure below.
Figure 9-2: Bandstop Filter Graphical Description
Page 34
10.0 COMB FITLER
Application:
The Comb filter is used to remove, or "notch out", harmonically related noises
(noises which have exactly equally-spaced frequency components), such as
power-line hum, constant-speed motor/generator noises, etc., from the input
audio. The filter response consists of a series of equally-spaced notches which
resemble a hair comb, hence the name "Comb filter".
Adjust the Fundamental Notch Frequency to the desired spacing between
notches (also known as "fundamental frequency"). Set the Notch Limit to the
frequency beyond which you do not want any more notches. Set the Notch
Depth to the amount in dB by which noise frequency components are to be
reduced.
Normally, the Notch Harmonics option will be set to All, causing frequencies at
all multiples of the Fundamental Notch Frequency (within the Notch Limit) to be
reduced. However, certain types of noises have only the odd or even harmonic
components present. In these situations, set the Notch Harmonics option to
either Odd or Even.
Figure 10-1: Comb Filter Control Window
Description of controls is as follows:
Comb
Frequency
Specifies fundamental frequency in Hertz of comb filter.
Notches are generated at multiples, or harmonics, of this
frequency.
Page 35
Notch Limit:
Specifies frequency in Hertz above which no notches are
generated. Minimum Notch Limit is 2 times the Fundamental
Notch Frequency, while maximum Notch Limit is 8800 Hz.
Notch Limit is adjustable in 1 Hz steps.
Notch Depth:
Depth of notches that are generated. Notch Depth is adjustable
from 0 dB to 120 dB in 1 dB steps.
Harmonics:
Specifies whether notches will be generated at All, Odd, or Even
multiples, or harmonics, of the Comb Frequency. If, for
example, the Comb Frequency is set to 60.000 Hz, then
selecting All will generate notches at 60 Hz, 120 Hz, 180 Hz,
240 Hz, 300 Hz, etc. Selecting Odd will generate notches at 60
Hz, 180 Hz, 300 Hz, etc. Selecting Even will generate notches
at 120 Hz, 240 Hz, 360 Hz etc.
TIP: A comb filter is adjusted in the following manner. Set the Notch
Limit and Notch Depth to their maximum positions; set Harmonics to
All. Next adjust the Comb Frequency to achieve maximum hum
removal; normally this will be in the vicinity of 60 or 50 Hz. (Analog
recordings will seldom be exactly 50 or 60 Hz due to tape speed
errors.
Next, adjust the Notch Limit down in frequency until the hum is
barely heard, then increase it 100-200 Hz. Adjust the Notch Depth up
following the same procedure. Finally, select the Odd or Even if they
do not increase the hum level; otherwise, use All.
This procedure minimizes the filtering to only that needed for the
hum. Since a comb filter is a reverberator, a 1CH Adaptive Filter is
often placed after it to reduce the reverberation and clean up any
residual noises escaping the comb filter.
A graphical description of the Comb filter and its controls follows in the figure below.
Page 36
Figure 10-2: Comb Filter Graphical Description
Page 37
11.0 NOTCH FILTER
Application:
The Notch filter is used to remove, or "notch out", a narrow-band noise, such as
a tone or a whistle, from the input audio with minimal effect to the remaining
audio. The Notch filter works best with stable noise sources which have constant
frequency; if the frequency of the noise source varies,then the 1CH Adaptive filter
is recommended.
To properly utilize the Notch filter, you will first need to identify the frequency of
the noise; this is best done using a Spectrum Analyze.
Initially set the Notch Depth to 120 dB and the Notch Width to the narrowest
possible value. Next, set the Notch Frequency to the noise frequency. Fine
adjustment of the Notch Frequency may be necessary to place the notch
precisely on top of the noise signal and achieve maximum reduction of the noise.
This is best done by adjusting the Notch Frequency up or down 1 Hz at a time
while listening to the Notch filter output on the headphones.
Often, the noise frequency will not remain absolutely constant but will vary
slightly due to modulation, recorder wow and flutter, and acoustic "beating."
Therefore, you may need to increase the Notch Width from its minimum setting to
keep the noise within the notch.
For maximum noise reduction, set the Notch Depth to 120dB. It is best to adjust
the Notch Depth up from 120 dB until the tone is observed, then increase the
depth 5 dB.
Figure 11-1: Notch Filter Control Window
Page 38
Description of controls is as follows:
Notch Frequency:
Specifies frequency in Hertz which is to be removed from the input
audio. Minimum Notch Frequency is 0 Hz, while maximum Notch
Frequency is 8800 Hz. Notch Frequency is adjustable in 1 Hz
steps.
Notch Depth:
Depth of the notch that is generated. Notch Depth is adjustable
from 0 dB to 120 dB in 1 dB steps.
Notch Width:
Width of the generated notch in Hertz. Adjustment range is 58.2 Hz
to 6750.0 Hz.
TIP: A notch filter is best only for very stable tones. It has a sharp, or “V”,
bottom, meaning that maximum attenuation only occurs at a single
frequency. For less stable tones, e.g. those with wow-and-flutter due to
analog recording and playback, a flat, or “square”, bottom is needed.
Therefore the Bandstop filter may be preferred. Also, the 1CH Adaptive
filter is useful in tracking varying tones.
A graphical description of the Notch filter and its controls follows in the figure below.
Figure 11-2: Notch Filter Graphical Description
Page 39
12.0 SLOT FILTER
Application:
The Slot filter is used to isolate, or "slot", a single-frequency signal, such as a
tone or a whistle, in the input audio, attenuating all other audio. This is the exact
opposite of the Notch filter function.
To properly utilize the Slot filter, you will first need to identify the frequency of the
signal to be isolated; this is best done using a Spectrum Analyzer.
Once the frequency of the signal has been identified, initially set Stopband
Attenuation to 120 dB and the Slot Width to the narrowest possible value. Next,
set the Slot Frequency to the signal frequency. Fine adjustment of the Slot
Frequency may be necessary to place the slot right on top of the signal. This is
best done by adjusting the Slot Frequency up or down 1 Hz at a time while
listening to the Slot filter output on the headphones.
Usually, the signal frequency will not remain constant but will vary slightly due to
modulation, recorder wow and flutter, and acoustic "beating". Therefore, you
may need to increase the Slot Width from its minimum setting to avoid having the
signal move in and out of the slot.
Figure 12-1: Slot Filter Control Window
To optimize background noise reduction for your application, set the Stopband
Attenuation to 120dB. If, however, you wish to leave a small amount of the
background noise mixed in with the isolated signal, adjust the Stopband
Attenuation to the desired value.
Page 40
Description of controls is as follows:
Slot Frequency:
Specifies frequency in Hertz which is to be enhanced in the
input audio. Minimum Slot Frequency is 0 Hz, while maximum
Slot Frequency is 8800 Hz. Slot Frequency is adjustable in 1
Hz steps.
Stopband
Attenuation:
Specifies amount in dB by which frequencies other than the Slot
Frequency are attenuated. Stopband attenuation is adjustable
from 0dB to 120dB in 1 dB steps.
Slot Width:
Width of the generated slot in Hertz. Adjustment range is 33.1 Hz to
3845.2 Hz.
A graphical description of the Slot filter and its controls follows in the figure below. Note
that the slot width is defined at its -6 dB points.
Figure 12-2: Slot Filter Graphical Description
Page 41
13.0 PASSTHROUGH FILTER
Application:
The Passthrough Filter is used to pass the audio through the filter stage
unaffected. It is often used when one stage of the AUDIOPHILE filter is not
needed for whatever reason.
Figure 13-1: Pass Thru Filter Selection
There are no control options for a Passthrough filter. The Config button is deactivated
when the Passthrough filter is selected for a stage.
Page 42
14.0 BROADBAND STAGE
Application:
The Broadband Stage is a frequency-domain spectral-subtraction filter that
implements automatic noise reduction over 128 separate frequency bands. It
operates by continually measuring the spectrum of the input signal and attempting
to identify which portions of the signal are voice and which portions are non-voice
(or noise). All portions determined to be noise are used to continually update a
noise estimate calculation; this is used to calculate the equalization curve that
needs to be applied to the input signal to reduce each band’s energy by the amount
of noise energy calculated to be in that band.
The net result is an output signal that has all non-voice signals reduced in level as
much as possible, thereby “polishing” the enhanced voice signal as much as
possible prior to final equalization and AGC.
Operation of the Broadband Stage is governed by a single control: the Amount
slider control. Adjusting the Amount allows the user to precisely control how much
noise reduction is being applied; the greater the value, the more aggressive the
operation of the Broadband Stage.
Because large amounts of noise reduction invariably create audible “birdy noise”
artifacts in the output audio due to the nature of adaptive frequency-domain
processing, the user should always try to minimize the amount of noise reduction
being applied to achieve the best balance between maximal noise reduction and
minimal audible artifacts.
The controls for the Broadband Stage are described in Chapter 2.4.
Page 43
15.0 20-BAND GRAPHIC EQUALIZER
Application:
The 20-band Graphic Equalizer is an easy-to-use linear-phase FIR digital filter
that is used to reshape the spectrum of the final output signal. Reshaping is
accomplished with twenty vertical scroll bars (also called "slider" controls) which
adjust the attenuation of each frequency band. These controls are very similar to
the slider controls found on analog graphic equalizers found on many consumer
stereo systems, and thus should be very familiar to even the novice user.
However, unlike analog graphic equalizers, this digital equalizer has some very
powerful additional capabilities. For example, the Normalize button allows the
user to instantly move all slider controls up until the top slider is at 0dB. The Zero
All button instantly sets all the sliders to 0dB. The Reduce All 1dB button
instantly moves all sliders down by 1dB. The Maximize All button instantly sets
all sliders to maximum attenuation. None of these functions is available in an
analog graphic equalizer! Notice also that the 20 sliders are spread across the
available system bandwidth and that the frequency spacing is optimized for voice
processing, vs. general music EQ as on most commercially-available equalizers.
Figure 15-1: 20-Band Graphic Equalizer Control Window
Description of controls/indicators is as follows:
Slider controls:
The twenty vertical scroll bar "slider" controls are used to set the
frequency response of the equalizer. Each slider can set the
gain of its frequency band to any value between 0dB and -100
dB in 1dB steps.
Page 44
Center Frequency: Note that the Center Frequency of each band is labelled
underneath each slider, and that bands are more closely spaced
at low frequencies.
Gain Indication:
Above each slider control, the gain for that frequency band is
given. The gain can also be visualized graphically by the
position of the slider control.
Normalize Button:
This button instantly shifts all slider controls up together until the
top slider is at 0dB. After normalization, the relative positioning
of the sliders remains the same. This allows the digital
equalizer to implement the desired equalization curve with
minimum signal loss.
Zero All
Button:
This button instantly moves the slider controls for
all bands to 0dB, defeating the entire equalizer. This is a useful
feature when it is desired to reset all sliders from scratch.
Reduce All 1dB
Button:
This button shifts all sliders down by 1dB from their
current position; no slider, however, will be allowed to go below
-100dB. This button allows the user to shift the entire equalizer
curve down so that there will be room to move one or more
sliders up relative to the others.
Maximize All
Button:
This button instantly moves the slider controls for
all bands to -100dB, causing the equalizer to mute all output.
This is a useful feature when it is desired to start with no audio
output, then bring the slider controls up one at a time to hear
only what you wish to hear.
Page 45
16.0 HI-RES GRAPHIC EQUALIZER
Application:
In some applications, it may be necessary to precisely reshape the spectrum of
input audio prior to passing it through successive DSP filter stages. For
example, if the audio is from a microphone which has an unusual frequency
response curve (for example, a microphone acoustically modified as a result of
concealment), a compensation filter that reshapes the audio to a normal spectral
shape might be desirable.
The Hi-Res Graphic Equalizer is essentially a 115-band graphic equalizer;
however, instead of having 115 separate slider controls, it allows the user to
precisely draw the desired filter shape on the computer screen, using the mouse,
with as much or as little detail as desired. Simply click and drag the EQ points, or
“handles”, as desired. To eliminate an EQ handle, simply right-click it. As the filter
shape is drawn, a linear-phase digital FIR filter is constructed in the PC and
transferred to the AUDIOPHILE unit for implementation.
The Normalize button allows the user to shift the entire filter curve up until the
highest point is at 0dB.
Figure 16-1: Spectral Graphic Equalizer Window
Page 46
Description of controls/indicators is as follows:
Filter Display:
Graphically displays the current shape of the filter. Also used in
conjunction with the mouse to draw a new filter shape or to edit
an existing one. A grid is provided to assist the user in visually
judging frequency and attenuation at any point in the display.
Frequency and
Level Readouts:
Used to precisely readout the frequency in Hertz and
attenuation in dB at any point in the filter curve.
Page 47
17.0 ADAPTIVE SPECTRAL INVERSE FILTER
Application:
The Adaptive Spectral Inverse Filter (ASIF) is a fully-adaptive equalization filter that
automatically readjusts the spectrum to match an expected spectral shape. It is
especially useful when the target voice has been exposed to spectral coloration (i.e.
muffling, hollowness, or tinniness), and also when the signal has had substantial noise
reduction processing applied that may tend to reduce the naturalness of the voice.
The ASIF maintains an average of the signal’s spectrum and uses this information to
implement a high-resolution digital filter for correcting long-term spectral irregularities.
The goal of the filter is to reshape the overall spectral envelope of the audio, not to
respond to transient noises and characteristics.
Several user controls are available for refinement of ASIF operation. The user can
specify the desired output spectrum (Output Shape) so that the output audio is
reshaped to a flat, pink, voice-like, or custom curve. An adapt rate setting controls the
update rate for the spectral average, which in turn determines how quickly the filter
responds to changes in the input audio. Upper and Lower Voice Limit controls allow the
user to specify the range over which equalization is applied.
The amount of spectral correction (0-100%), as well as the amount of gain applied to
the final output, is adjustable using the Filter Output controls. The user can enable the
Auto Gain functionality to ensure that the output audio level is automatically maintained
at approximately the same as the input audio level. If the user disables the Auto Gain,
the output gain slider is available to manually boost the level of the output signal.
Page 48
Figure 17-1: ASIF control window
Description of controls/indicators is as follows:
Adaptation:
Used to specify the adaptation rate of the averager on which the
ASIF is based. Smaller values cause the averager, and hence the
filter, to update more slowly, whereas larger values allow faster
update. Use a value of 0.01 (approximately mid-scale) for most
applications.
Clear Button:
This button allows the user to re-initialize the ASIF response and
restart adaptation.
NOTE: After a Clear operation, there will be an adaptation
period while the filter adapts to the current input signal. The
length of this adaptation period depends on the Adapt Rate
control setting.
Adapt Rate
Control:
This control allows the user to select the rate of adaptation for the
spectral average on which the ASIF response is based. The
spectral averager uses an exponential average of the form Hi+1 =
(α)(Xi+1) + (1- α)(Hi). The value shown in the display box
corresponds to the averaging constant α in the exponential
average. The lower the adapt rate value, the slower the filter will
respond to changes in the input audio.
Note: “Fast response” sounds like a good thing, so it can be
tempting to set the adapt rate to a high value. However, the goal
Page 49
of the ASIF is not to remove transient noises, but rather to
reshape the long-term spectral envelope of the signal. If the
adapt rate is too fast, the filter will respond too quickly to transient
audio characteristics, which will produce artifacts in the output
audio and will prevent the filter from settling on a good average
solution. For this reason, most applications will work best with
adapt rates at the low end of the available range. If you hear
tonal artifacts that come and go in the output audio, or if the filter
trace display coefficients seem to be changing rapidly, you
probably need to reduce the adapt rate.
Output Shape:
In this block, the user can select the target spectral shape that the
filter attempts to achieve. The ASIF has an inherent spectral
flattening effect on the audio. The selected spectral shape is
applied to further reshape the audio spectrum. The following
output shapes are available:
•
•
•
•
Flat – no additional shaping after ASIF flattening
Pink -- 3 dB per octave rolloff above 100 Hz is applied in
addition to ASIF flattening
Voice – 6 dB/octave rolloff above and below 500 Hz in
addition to ASIF flattening
Custom – user draws custom curve to be applied in addition
to ASIF flattening
Note: Changing the output shape does not require an adaptation
period to arrive at a “good” solution. Because a full average
spectrum is maintained regardless of the output shape setting, the
new output shape takes effect instantaneously in both the output
audio and the display traces. However, since the auto gain adapts
based on the actual applied filter with the shaping curve taken into
account, there may be some adaptation time required to reach a
stable auto gain value after the shaping curve is changed.
Custom Curve:
To draw a custom curve, select Custom and then click the Edit
button beneath the Custom selection button; the ASIF Custom
Curve window will open. Click New to begin a new curve. To
draw the curve, use your mouse to make single clicks within the
axes; the curve is built piecewise by “connecting the dots” at the
click locations. For fine control of the click locations, use the
cursor coordinate information located at the bottom of the drawing
axes. The ASIF custom curve drawing window is identical to the
Hi-Res Graphic Filter drawing window described in Chapter 16.
Page 50
Figure 17-2: ASIF custom curve drawing window
Filter Output:
The controls in this block allow the user to make adjustments to
the filter output.
The filter amount setting controls the degree to which the ASIF
can affect the signal, with 0% corresponding to no filtering and
100% corresponding to full filtering. In general, it is best to use
the minimum Filter Amount setting that produces the desired
result.
Also, there are two options for adjusting the level of the final ASIF
output. When Auto Gain is enabled, the ASIF automatically
monitors the input and output levels and applies a gain value that
matches the output level to the input level. When Auto Gain is
disabled, the user can use the gain slider control to precisely
specify the amount of boost applied to the ASIF output.
The Auto Gain is an adaptive value whose rate of change
depends on the same Adapt Rate slider setting that controls filter
coefficient averaging. This means that when the filter response
changes rapidly and dramatically, the auto gain will take some
time to “catch up” to these changes. In particular, the output audio
may clip when user settings are changed in a ways that have a
boosting effect, such as switching from a pink to a flat shaping
curve, adjusting the filter amount, or adjusting the Voice Limit
settings so that some frequencies that had been heavily
Page 51
attenuated are now present. While the settings changes will take
effect immediately, the Auto Gain may take some time to adapt to
the change. For this reason, when the user expects to be making
many changes in the settings, it is often better to disable Auto
Gain and instead choose a manual gain setting that avoids
clipping.
Lower and Upper
Voice Limits:
The Lower and Upper Voice Limits allow the user to specify the
frequency range, or “ASIF region,” over which the ASIF is applied.
Two red markers, controlled by the sliders below the display
trace, indicate where the lower and upper voice limits are located.
The markers may also be adjusted by clicking and dragging within
the display trace. Viewing audio on the display trace while
manipulating the markers is an easy way to identify where your
ASIF region limits should fall.
Typically, the ASIF region is chosen to be the range over which
speech frequencies are found. Setting a Lower Voice Limit
above 300 Hz or an Upper Voice Limit below 3000 Hz is not
recommended, as intelligibility may suffer. All frequencies outside
the ASIF region are assumed to be non-speech and are therefore
attenuated.
Page 52
18.0 VOX ALGORITHM
The “smart VOX” algorithm, as implemented in the AUDIOPHILE, is functionally illustrated
in Figure 18-1.
The input audio is initially bandpass filtered to select the spectral segment which gives
preference to voice energy. This filter is centered at 200 Hz and has a 500 Hz bandwidth.
The average energy, E is then computed for each 32 msec segment of bandpassed audio.
The algorithm then compares the average energy, E, with two time-varying reference
levels. These levels are based on the smoothed minimum values of E. Each 512 msec,
the minimum value of E, which would be the smallest of the most recent 16 E values, is
computed. This minimum value, MIN, is then smoothed using a lowpass filter with a long
time constant, approximately 9 seconds.
The voice detect level, LD, consists of SM (the smoothed MIN values) plus the voice
Detection Threshold, THD (specified by the Command Center software). If E exceeds this
voice detect level, the algorithm considers this to be a speech event and the SPEECH
ACTIVITY LED (an indicator provided only in the Command Center software) will be
illuminated. When a speech event occurs, the logic assumes that the voice occurred
before and after the detection. Pre-event time and Post-event time values, as specified
by the Command Center software, are applied to each detection, thereby expanding it in
time in both directions.
During speech, the detections typically occur frequently enough for the overlaps to form a
continuous stream of detected speech, which is then passed to the control logic. When
speech is not detected, the VOX algorithm will output either Silence (no audio output) or
C-Tone as specified.
Controls for the VOX algorithm are described in Chapter 2.6.
NOTE: the Pre-event time control places a constant audio delay on the signal
flowing through the AUDIOPHILE, regardless of whether the VOX is enabled or
disabled. This means that whenever the filter controls are adjusted, you will have to
wait the specified Pre-event time value for the effect to become audible. Should you
wish to hear the effects of the filter controls instantly during initial filter setup, you
can temporarily set the Pre-event time to 0 while setting up the filtering, then
change it back to the desired value prior to programming the AUDIOPHILE.
Page 53
Figure 18-1: VOX Algorithm Block Diagram
Page 54
C-Tone
Generator
INPUT
Delay
Energy in a
32ms block
Silence
OUTPUT
Pre-event
time
Bandpass
Filter
E
+
MIN
_
LD
Voice
Detect
Comparitor
Smoothing
Filter
Pre-event
time
Post-event
time
Voice Detection Logic
Minimum E
of last 16
blocks
Detect
Threshold
SPEECH
ACTIVITY
LED
+
SM
19.0 AGC ALGORITHM
Application:
The Automatic Gain Control boosts low-level output signals to a peak reference
level (18dB below full-scale output, or -18dBFS) by gradually increasing output
signal gain until either the proper level or Maximum Gain has been reached. This
compensates for near party/far party conversations and for losses in signal level
which may have occurred during the enhancement process. If the output signal
levels are at or above the -18dBFS reference level, the AGC will have no effect.
Maximum Gain specifies how much gain the AGC can apply in its attempt to bring
the output signal up to the proper level. The greater the Maximum Gain, the lower
the output signal level that can be brought up to proper level. The Maximum Gain
options are 0dB (Bypass), 10dB, 20dB, and 30dB. For most near party/far party
applications, the 10dB setting is recommended. Maximum Gain settings greater
than 10dB may elevate background noise excessively during pauses in speech. A
“soft AGC” using 10dB is often useful even when large voice level differences are
not present.
For the AUDIOPHILE product, the AGC implementation incorporates a special
“look-ahead” feature, which allows the algorithm to anticipate large signal transients
and begin reducing the applied gain prior to their occurrence. This minimizes the
potential for short-term clipping distortion on the output whenever the audio
transitions from low signal level (and high gain applied) to high signal level (where a
low gain needs to be applied). The look-ahead feature also has benefit in the
opposite case – the gain is able to begin increasing prior to a transition from loud
audio (e.g., near party) to low-level audio (e.g., far party), allowing the initial portion
of the far-party audio to be more audible than it would ordinarily.
Controls for the AGC algorithm are described in Chapter 2.7.
Page 55
Page 56