1
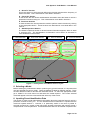
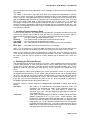
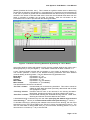
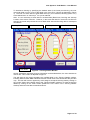
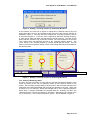
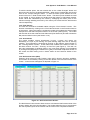
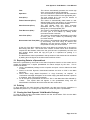
Irish Dynamic Yield Models
for Forest Management
User Manual
Irish Dynamic Yield Models – User Manual
Irish Dynamic Yield Models for Forest Management
User Manual
Table of Contents
1. Overview
2. Installing the Models on Your Computer
3. Opening the Yield Model Package
4. The Screen Layout
5. Selecting a Model
6. Inputting Forest Identification Data
7. Inputting Forest Inventory Data
8. Defining the Forecast Period
9. Growing the Forest to the Forecast Year
10. Simulating Thinning Operations
11. Defining a Second or Subsequent Forecast Period
12. Special Features:
12.1 Setting a thinning Frequency & Intensity
12.2 Viewing a Summary Sheet
12.3 Timber Prices
12.4 Final Harvest
12.5 Assortments
12.6 Net Present Value
13. Exporting Data to a Spreadsheet
14. Printing
15. Closing the Irish Dynamic Yield Models Package
Page
3
3
3
3
4
4
5
5
6
6
9
9
9
10
11
12
12
12
13
13
13
Page 2 of 13
Irish Dynamic Yield Models – User Manual
1. Overview
Dynamic yield models based on Irish research data and internationally accepted forest
modeling principles have been produced for a number of Irish forest tree species. These
models facilitate bespoke forest management planning and practice.
These models are currently operated using a user friendly computer interface. This manual
will assist users of the Irish Dynamic Yield Models in installing and operating the user
interface and in allowing them to become familiar and comfortable with the use of Irish
Dynamic Yield Models.
2. Installing the Models on Your Computer
The Irish Dynamic Yield Models come on a compact disc. Insert the disc in the CD drive on
your computer and close the drive. Follow the following procedure to install the models:
1. Right click on the Windows Start tab and select “explore” which will open Windows
Explorer.
2. Locate the CD Drive in Windows Explorer and highlight it. Double click on the file called
“Setup.exe”. This will commence the installation programme.
3. Follow the instructions in the installation programme but keep a note of the path to the
destination directory where the Dynamic Yield Model program files will be installed. The
default installation path will be "C:\Program Files\PC-INFORM\".
4. Return to Windows Explorer and locate the CD drive and select it.
5. In the CD drive will be a separate folder entitled “EXE_File” which should be opened by
double clicking on it.
6. A file called “INFORM_V1.exe” is located in this folder. Click on this file so that it is
selected and go to “Edit” on the main menu bar and select “Copy”.
7. Navigate on your disk to the destination directory where the Irish Dynamic Yield Models
program was installed, i.e "C:\Program Files\PC-INFORM\".
8. Go to “Edit” on the main menu bar and select “Paste”. When asked if you want to replace
the existing “INFORM_V1.exe” with the new “INFORM_V1.exe” select “Yes”.
9. When this is done, right click on the “INFORM_V1.exe” file and select “Create Shortcut”.
This will create a new file called “Shortcut to INFORM_V1.exe”.
10. Select “Shortcut to INFORM_V1.exe” by clicking on it and go to “Edit” on the main menu
bar and select “Cut”. Close Windows Explorer and right click anywhere on the PC
Desktop and select “Paste” from the menu that arises. A new icon will appear entitled
“Shortcut to INFORM_VI”.
11. Right click on this icon and select “Rename” from the menu that arises. This will make
the name of the icon editable. Type in “Irish Dynamic Yield Models” and then click
elsewhere on the PC desktop.
Registered users of Irish Dynamic Yield Models will receive updated models for different
species as they are produced.
3. Opening the Yield Model Package
Once the Irish Dynamic Yield Models have been installed and a desktop shortcut created as
described in Section 2, then they can be opened at any time by double clicking on the
shortcut icon on the computer desktop. Following this, an initial information window will
appear which informs the user of the currently active model and outlines some of the
parameters for its use. The user should click on the “OK” button and the Irish Dynamic Yield
Model user interface will open.
4. The Screen Layout
The Irish Dynamic Yield Models screen is laid out in six different sections as depicted in
Figure 1. The different sections are described as follows:
A. Main Menu Bar
The main menu bar is the bar across the top of the screen with File, Edit, Model and
Info options. The use of these options will be described later in the manual.
B. “Grow From” Section
This is the section into which forest inventory data are inputted by the user. Data
input is described in more detail in Section 7.
Page 3 of 13
Irish Dynamic Yield Models – User Manual
C. “Grow To” Section
This is the section in which the user defines the forecast period and the frequency of
interim forecasts. This is described in more detail in Section 8.
D. “Forest ID” Section
In this section the user enters administrative information about the forest for which a
production forecast is being run. This is described in more detail in Section 6.
E. Functions Sections
In these sections the user requests the model to perform certain functions by clicking
on the appropriate button. These functions are described in more detail later in the
manual.
F. Stand Projections Section
The Stand Projections Section is where forecast information appears, either in detail
or summary form. The interpretation of information in this section is discussed in
more detail later in the manual.
A. Main Menu Bar
B. Grow From Section
E. Functions Sections
C. Grow To Section
D. Forest ID Section
F. Stand Projections Section
Figure 1: Irish Dynamic Yield Model Screen Layout
5. Selecting a Model
Before entering any measurement data or producing any growth forecasts, it is important that
one has selected the correct model. There are different models for different species. There
are also different models for thinned and unthinned stands. To select the appropriate model,
go to “Model” in the main menu bar and select the model required. The current selected
model will appear in the blue coloured title bar at the top of the screen.
6. Inputting Forest Identification Data
This section is used to enter administrative information about the particular forest for which a
production forecast is being run. It is not essential that this information is inputted and the
model will operate without it. However, it is particularly useful in the case of printed or
archived records that a record is kept which links forecast information with specific forests /
compartments / sub-compartments. Forest Identification data can be entered in alphanumeric
Page 4 of 13
Irish Dynamic Yield Models – User Manual
format and users can use the tab button on the keyboard or the mouse to move between the
entry fields.
This section is also used to input the gross area of the forest sub-compartment in question
and the % of this area which is considered unproductive due to roads, ridelines, biodiversity
areas, check etc. The gross area should be entered in hectares and care should be taken
that the reduction (%) is entered as opposed to the percentage productive area. The final
field in this section, net area, is filled automatically by the model and if no reduction
percentage is entered the model assumes that the net area is equal to the gross area. The
field for net area is highlighted in yellow which indicates that it is not editable by the user. The
net area is subsequently used by the model in converting forecast timber volumes per hectare
into total timber volumes.
7. Inputting Forest Inventory Data
Forest inventory data from the particular sub-compartment in question must be input into the
“Grow From” Section of the model in order that there is information on its current state on
which to base a production forecast. The following data are required to be entered:
Age
The age of trees should be entered in years
Stocking
The current number of stems per hectare should be entered
Top Height
The Top Height should be entered in metres
Mean DBH
The mean Diameter at Breast Height should be entered in centimeters
or
Basal Area
The Basal Area should be entered in m2 per hectare
Note: It is not necessary to enter both DBH and Basal Area but in the event that both are
entered the model will use the Basal Area figure in subsequent calculations and not DBH.
When a crop is grown to a future age defined by the user in the “Grow To” Section, the “Grow
From” Section will update itself to contain the forecast data in that year. These data can then
be used to grow the crop on further to a newly defined age re-entered in the “Grow To”
Section.
8. Defining the Forecast Period
The forecast period is defined in the Grow To Section. After completing the inputting of forest
inventory data (Section 7), users must then enter the age to which they want to simulate the
growth of the forest in question. This age must be entered in the field entitled “Age”. Users
should be careful to enter the future crop age (e.g. 25) as opposed to the actual year (e.g.
2014).
Forecast data for interim years (between the current year and the “Grow To” year) can also
be obtained and the frequency of such interim years is defined by the user in the field entitled
“By (yrs)”. For example, if the user wishes to simulate growth of a crop from age 22 to 29 and
to see the forecast stand information for every 2 years in between, then they would enter “2”
in the “By (yrs)” field and information for years 22, 24, 26, 28 and 29 would be presented in
the Stand Projections Section when the model is run.
Below the “Grow To” Section are three un-editable fields (highlighted in yellow) which are as
follows:
Site Index
Site Index is an Internationally recognised productivity index and
expresses the expected top height of the particular stand at a
reference year in the future. For Sitka Spruce in Ireland, this
reference year is 30. The data required to generate Site Index are
Top Height and Age.
Yield Class
Yield Class can be defined as the Maximum Mean Annual Increment
(MMAI) (measured in m3/ ha.) of a crop. These Dynamic Yield
Models only calculate Yield Class retrospectively, i.e. once the final
harvest has been simulated, the model will report the achieved Yield
Class of the crop. In this regard it is presented here for comparative
purposes (with Site Index) only. If a crop is felled before the age of
MMAI then the Yield Class reported here will not be truly accurate but
will reflect the achieved productivity of the crop.
Page 5 of 13
Irish Dynamic Yield Models – User Manual
Volume After Thin
The model provides a volume (m3 / ha.) following thinning operations
which is further information to the user in deciding whether or not to
grow the crop on for a further period or not. If no thinning operations
have been simulated then this field will remain blank.
9. Growing the Forest to the Forecast Year
Once the current forest inventory data have been entered (Section 7) and the forecast period
defined (Section 8), then the user is ready to request the model to simulate the growth of the
particular forest sub-compartment over the defined period. This is done by simply clicking on
the “Grow” button in the Functions Section of the screen as indicated in Figure 2. The
forecast data will then appear in the Stand Projections Section of the screen.
Click on “Grow” Button to Simulate Growth
Figure 2: Completed Forest ID, “Grow From” and “Grow To” Sections, Ready to
Simulate Growth by Clicking on “Grow” Button
For no-thin models, the user simply needs to grow the stand to the projected harvest year as
there will be no removal of material from the stand between the current year and the final
harvest.
10. Simulating Thinning Operations
For forests where thinning is planned, the Irish Dynamic Yield Models allow the user to define
both the timing and intensity of such thinnings. The user must first complete the necessary
steps described in Sections 5 to 9 of this manual. Once the crop growth is simulated to a
user defined age (Section 9), the user can then choose to thin the crop.
Note: If the user wishes to thin the crop in the current year without simulating growth i.e. in
the same year as the inventory data were collected, simply enter the current age of the crop
in the “Grow To” Section i.e. the same age should be entered in both the “Grow From” and
“Grow To” Sections. A simulated thinning is then possible as described below.
In order to simulate a thinning of the crop, the user should click on the “Thin” button in the
Functions Section of the screen as indicated in Figure 3.
An information note will be displayed giving the threshold basal area for the forest in question.
This is referenced from Forestry Commission Booklet No. 34 - Forest Management Tables
Page 6 of 13
Irish Dynamic Yield Models – User Manual
(Metric) (Hamilton & Christie, 1971). This is meant as a guide to assist users in determining
the intensity of thinning to be carried out. In general terms, if the actual or forecast basal area
in the year in question is greater than the threshold basal area then thinning is recommended
whereas if the actual or forecast basal area is less than the threshold basal area then the
forest in question is probably not yet ready for thinning. Click the OK button on this
information note in order to proceed with the thinning simulation.
Click on “Thin“ Button to Commence Thinning Simulation
Figure 3: Commence Thinning Simulation by Clicking on “Thin” Button
At this point another window will appear in which the user is asked whether they wish to set a
thinning frequency or not (see Figure 7). This feature is dealt with in detail in Section 12.1.
A new “Thinning Details” window will now appear on your screen as depicted in Figure 4.
This window presents a matrix of five different thinning parameters and three different
columns relating to thinning status. The five different thinning parameters are:
Basal Area:
Expressed in m2 / ha.
Stocking:
Expressed in stems / ha.
Volume:
Expressed in m3 / ha.
Mean DBH:
Expressed in cm (not editable)
Mean Volume:
Expressed in m3 (not editable)
The three different columns are as follows:
“Pre Thin” Column: Presents data prior to the thinning simulation. This column cannot be
edited as these data have been previously determined and its fields
are highlighted in yellow.
“Thinning” Column: Presents data for trees to be removed in the thinning simulation.
Basal Area, Stocking and Volume can all be edited in this column.
“Post Thin” Column: Presents data following the simulated thinning exercise. Basal Area,
Stocking and Volume can all be edited in this column.
A simulated thinning is carried out by the user either specifying the material to be removed
in the thinning (2nd column) or the desired state of the forest post thinning (3rd column).
To simulate a thinning by specifying the material to be removed in the thinning, the user must
enter data in one or more of the fields in the “Thinning” Column (as depicted in Figure 4). The
user can enter data for either Basal Area (m2) to be removed, Stocking (stems / ha.) to be
removed and / or Volume (m3 / ha.) to be removed.
Page 7 of 13
Irish Dynamic Yield Models – User Manual
To simulate a thinning by specifying the desired state of the forest post thinning, the user
must enter data in one or more of the fields in the “Post Thin” Column (as depicted in Figure
4). The user can enter data for either Basal Area (m2) to be retained, Stocking (stems / ha.)
to be retained and / or Volume (m3 / ha.) to be retained.
Note: It is not necessary to enter data for all three fields (Basal Area, Stocking and Volume)
in either of the above scenarios. However, in the event that data for more than one field are
entered, the model will prioritise the use of Basal Area data and Stocking data in subsequent
calculations.
Thinning Parameters
Thin Button
Pre-Thin Column
Thinning Column
Post Thin Column
Figure 4: Thinning Details Window
Having entered the necessary thinning information as described above, the user should then
click on the “Thin” button as depicted in Figure 4.
This will result in the model completing any unfilled fields in the “Thinning Details” window,
including data for Mean DBH and Mean Volume of both trees to be thinned and the post-thin
crop. The user will have an opportunity at this stage to accept the thinning data by clicking on
the “Accept” button at the bottom right of the “Thinning Details” window or to clear the thinning
details by clicking on the “Clear” button (beside the “Thin” button in the “Thinning Details”
window) and enter new data as described above.
Page 8 of 13
Irish Dynamic Yield Models – User Manual
Pre Harvest Data
Harvest Data
Increment Data
Post Harvest Data
Figure 5: Layout of Data in Stand Projections Section of Screen
Once thinning data are accepted it will appear in the Stand Projections Section of the screen
in the same row as the pre-thin data for the same year. The layout of these data is illustrated
in Figure 5. Users should be familiar with this layout as it is the same as is used in the
Forestry Commission Yield Models for Forest Management.
The stand projections section of the screen also includes increment data on the far right of the
screen as follows:
Current Annual Increment (CAI):
CAI is the annual volume increment (m3 per hectare)
of the crop at any point in time.
Mean Annual Increment (MAI):
MAI is the average annual volume increment (m3 per
hectare) from planting to any point in time.
11. Defining a Second or Subsequent Forecast Period
Once an initial thinning cycle has been completed it is possible for the user to define a new
forecast period. The model will populate the “Grow From” Section of the screen with post
harvest data from the previous cycle (as it is presented in the Stand Projections Section of the
screen). The user must then define a new forecast period in the “Grow To” Section of the
screen and repeat the process described in Sections 9 and 10. This can be done again and
again, as long as the user wishes to continue extending the simulated rotation and depending
on the number of interventions planned.
12. Special Features:
The Irish Dynamic Yield Models have a number of special features designed to enhance the
interactivity of the models and their functionality to users. These features are set out in
Sections 12.1 to 12.6 below.
12.1 Setting a Thinning Frequency & Intensity
After the user has clicked on the “Thin” button and has cleared the information note
giving the threshold basal area, a new window will appear in which the user is offered
the opportunity to set a thinning frequency and intensity (see Figure 6). The user can
click “No” to continue as normal or can click “Yes”, in which case the screen depicted
in Figure 7 will appear.
Page 9 of 13
Irish Dynamic Yield Models – User Manual
Figure 6: Setting a Thinning Frequency & Intensity Window 1
In this instance, the user has an option to repeat thin by identical volume only and
should enter the volume to be removed at each thinning in the Thinning Column as
indicated in Figure 7. The user must also complete the “Thinning Frequency” section
of the screen (Figure 7). In this, the user is required to define the thinning frequency
in years and to state until what crop age thinning should continue. The user should
ensure that the “Activate Loop” check box is ticked. The user should then click on the
“Thin” button which will populate the rest of the “Thinning Details” window. The
“Loop” button in the “Thinning Frequency” section should then be clicked. This will
result in the Stand Projections Section of the screen being filled with forecast data for
the defined period.
Enter Regular Thinning Volume Here
Thinning Frequency Section
Figure 7: Setting a Thinning Frequency & Intensity Window 2
12.2 Viewing a Summary Sheet
The user can view a summary of rows (years) in the Stand Projections Section of the
screen by clicking on the “Go To Summary” button in the Functions Section of the
screen. This summary presents data for all the years in which harvest operations are
conducted, the initial inputted data and the final year defined by the user. When this
is done the “Go To Summary” button interchanges with a “Go To Stand Projections”
button which, if clicked, will display the complete data set. Similarly, the title in the
“Stand Projections” section will change to “Summary”, depending on the status of the
“Go To Summary” / “Go To Stand Projections” button. This is depicted in Figure 8.
Page 10 of 13
Irish Dynamic Yield Models – User Manual
Title Interchangeable between “Summary and “Stand Projections”
Button Interchangeable as “Go To Summary” or “Go To Stand Projections”
Figure 8: Summary Screen
12.3 Timber Prices
The user can enter standing timber prices by clicking on the “Show Timber Prices”
button in the Functions Section of the screen. A new window will appear as depicted
in Figure 9.
Figure 9: Timber Prices Window
Page 11 of 13
Irish Dynamic Yield Models – User Manual
To edit the timber prices, the user should click on the “Allow Changes” button and
then enter new prices in the designated fields. When this is complete the user should
click on the “Accept Changes” button. To hide the timber prices window the user
should click on the “”Hide Timber Prices” button. The timber prices entered are used
by the model in giving values per hectare and total values of harvested material.
These values are calculated by the model by multiplying the timber price for the
relevant average standing tree size by the volume per hectare and the total harvest
volume respectively.
12.4 Final Harvest
The user can conclude a simulated rotation using the “Final Harvest” function. This
function is activated by clicking on the “Final Harvest” button in the Functions Section
of the screen. When this button is clicked the model will complete the Harvest Data
Component of the Stand Projection Section of the screen (see Figure 5). The model
will also then show the achieved Yield Class and (See Section 8) and will activate the
Net present Value function (see Section 12.6).
12.5 Assortments
The model provides volume assortments (7-14cm, 14-20cm and >20cm top
diameters) for crops at pre thinning and post thinning stage and also of thinning
material. This information is accessed by clicking on the relevant “Assort” button in
the “Thinning Details” window. These buttons are located at the bottom of each of
the three columns “Pre Thin”, “Thinning” & “Post Thin” (see Figure 4). The user can
also view assortments of standing timber in any year when thinning is not simulated
by clicking and highlighting the relevant row (year) in the Stand Projections Section of
the screen and then clicking on the “Assort” button in the Functions Section of the
screen.
12.6 Net Present Value (NPV)
Following final harvest the Net Present Value (NPV) function becomes available.
This function is accessed by clicking on the NPV button in the functions section of the
screen. A new window will appear as depicted in Figure 10.
Figure 10: Net Present Value Screen
The Net Present Value function allows users to calculate the Net Present Value of the
forestry rotation they have just simulated. The window takes the form of a grid where
the rows represent years in the rotation and the columns are completed as follows:
Page 12 of 13
Irish Dynamic Yield Models – User Manual
Year:
This column automatically presents the current age
of the crop up until the age of final felling.
Operation:
The user should fill in operations that are scheduled
to occur in the forest rotation in the appropriate year.
Cost (€/ha.):
The user should fill in the cost per hectare of
operations as defined above.
Timber Revenue (€/ha.):
This column is automatically filled based on user
defined timber prices (see Section 12.3) and harvest
volumes generated in the simulated rotation.
Other Revenue (€/ha.):
The user should enter any other revenues
associated with the crop (e.g. premiums, deer
lettings etc.) in the appropriate year.
Total Revenue (€/ha.):
This column is automatically calculated by the model
for each year of the rotation by adding timber
revenues and other revenues.
Cash Flow (€/ha.):
This column is automatically calculated by the model
for each year of the rotation by subtracting costs
from total revenue.
Discounted Cash Flow (€/ha.): This column is automatically calculated by the model
by discounting cash flow using an interest rate
defined by the user and the number of years from
the present for each year of the rotation.
At the top of the NPV window the user must define the interest rate to be used in
discounting cash flow. This section also contains a button which when clicked will
compute the Net Present Value once the grid has been completed by the user and
also another button which will copy the grid to a clipboard for pasting in a
spreadsheet.
The Net Present Value is presented in the top section of the window and is calculated
by adding all of the figures in the discounted cash flow column.
13. Exporting Data to a Spreadsheet
Data that is presented by the model in the Stand Projections Section of the screen can be
copied and pasted into a regular spreadsheet for further analysis by the user. This is
achieved as follows:
1. Open a spreadsheet package on the computer and open a new or blank work book
or sheet.
2. Return to the Irish Dynamic Yield Model interface and click on “Edit” in the Main
Menu Bar.
3. Select either “Copy Stand Projections” or “Copy Summary” as required. A
confirmation message will appear on the screen saying that data has been copied to
a clipboard. Click “OK” on this message.
4. Go to the opened spreadsheet and click on “File” in the Main Menu Bar followed by
“Paste”.
The copied data will appear in the spreadsheet along with the
administrative information about the forest and the current date.
14. Printing
To print data from the Irish Dynamic Yield Models, the data must first be exported to a
spreadsheet (Section 13). Printing is then done in the usual way from a spreadsheet.
15. Closing the Irish Dynamic Yield Models Package
To close an Irish Dynamic Yield Model session the user should select “File” from the Main
Menu Bar followed by “Exit”.
Page 13 of 13