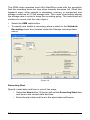
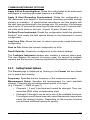
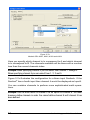
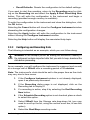
1
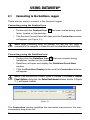
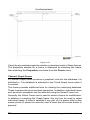
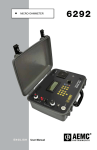
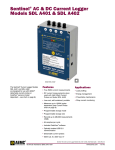
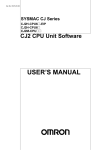
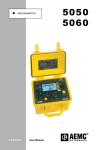
SENTINEL® SOFTWARE MANUAL ENGLISH User Manual WARRANTY With respect to the physical CD and physical documentation enclosed herein, AEMC® Instruments warrants the same to be free of defects in materials and workmanship for a period of one year from the date of purchase. In the event of notification within the warranty period of defects in material or workmanship, AEMC® Instruments will replace the defective CD or documentation. The remedy for breach of this warranty shall be limited to replacement and shall not encompass any other damages, including but not limited to, loss of profit, special, incidental, consequential, or other similar claims. AEMC® Instruments specifically disclaims all other warranties, expressed or implied, including but not limited to, implied warranties of merchantability and fitness for a particular purpose with respect to defects in the CD and documentation, and the program license granted herein in particular, and without limiting operation of the program license with respect to any particular application, use or purpose. In no event, shall AEMC® Instruments be liable for any loss of profit or any other commercial damage, including but not limited to, special, incidental, consequential or other damages. What You Must Do: First request a return authorization form by phone or by fax from AEMC® Instruments, then return the CD along with the signed authorization repair form. Return material, postage pre-paid to: Chauvin Arnoux®, Inc. d.b.a. AEMC® Instruments 15 Faraday Drive • Dover, NH 03820 USA Tel: (800) 945-2362 or (603) 749-6434 • Fax: (603) 742-2346 COPYRIGHT Copyright 2000 by AEMC® Instruments. All rights reserved. No part of this manual or DataView® software may be reproduced in any form or by any means (including electronic storage and retrieval or translation into any other language) without prior agreement and written consent from AEMC® Instruments, as governed by United States and International copyright laws. Chauvin Arnoux®, Inc. d.b.a. AEMC® Instruments 15 Faraday Drive • Dover, NH 03820 USA Tel: (800) 945-2362 or (603) 749-6434 • Fax: (603) 742-2346 Acknowledgements for product names used in this manual belong to the following companies: Windows® 2000/XP are registered trademarks of Microsoft® Corp. Adobe® Reader is a registered trademark of Adobe Systems Incorporated. DISCLAIMER The DataView® software and this documentation are provided “AS IS”, without warranty of any kind. By using this program (the DataView® software) you are assuming all liability for anything which might occur, including but not limited to physical, emotional or monetary damages. AEMC® Instruments has made every attempt to ensure that this program operates properly. Due to the complexity of any program of this size, a change made in one part of the program can, and sometimes does, inadvertently generate problems in other areas. It is recommended that you save your work regularly (BACK UP your software). No part of this manual may be reproduced in any form, or by any means (including electronic storage and retrieval or translation into any other language) without prior agreement and written consent from AEMC® Instruments, as governed by United States and International copyright laws. Table of Contents SOFTWARE & DRIVER INSTALLATION..................................................... 2 1.1 Installing DataView®. .................................................................2 USING DATAVIEW®................................................................................ 6 2.1 Connecting to the Sentinel® Logger...........................................6 2.2 Using the Sentinel Control Panel...............................................8 2.3 Configuring the Sentinel® Logger.............................................10 2.3.1 Setting Recording Options........................................... 11 2.3.2 Setting Format Options................................................15 2.3.3 Configuring and Recording Data.................................19 2.3.4 Saving and Loading Configurations.............................21 2.4 Displaying Real-time Status Information..................................22 2.5 Resizing and Saving Real-time Window Layouts.....................23 2.6 Displaying Real-time Graphs and Text....................................24 2.7 Saving Real-time Measurements.............................................26 2.8 Downloading Recorded Instrument Data.................................29 2.9 Sentinel® Logger Templates.....................................................30 Sentinel® Loggers - DataView® Software 1 CHAPTER 1 SOFTWARE & DRIVER INSTALLATION 1.1 Installing DataView® DO NOT CONNECT THE INSTRUMENT TO THE PC BEFORE INSTALLING THE SOFTWARE AND DRIVERS. Minimum Computer Requirements: • Windows XP / Windows Vista & Windows 7 (32/64 bit) • 256MB of RAM for Windows XP 1GB of RAM for Windows Vista & Windows 7 (32 bit) 2GB or RAM for Windows Vista & Windows 7 (64 bit) • 80MB of hard disk space (200MB recommended) • CD-ROM drive Windows is a registered trademark of Microsoft Corporation in the United States and other countries. NOTE: When installing, the user must have Administrative access rights during the installation. The users access rights can be changed after the installation is complete. DataView® must be reinstalled for each user in a multi-user system. 1. Insert the DataView® CD into your CD-ROM drive. If auto-run is enabled, the Setup program will start automatically. If auto-run is not enabled, select Run from the Start menu and type in D:\SETUP (if your CD-ROM drive is drive D. If this is not the case, substitute the appropriate drive letter). NOTE: If installing onto a Vista based computer the User Account Control dialog box will be displayed. Select the Allow option to proceed. 2 Sentinel® Loggers - DataView® Software 2. A Set-up window, similar to the one below, will appear. Figure 1-1 There are several different options to choose from. Some options(*) require an internet connection. • DataView, Version x.xx.xxxx - Installs DataView® onto the PC. • *Adobe Reader - Links to the Adobe® website to download the most recent version of Adobe® Reader to the computer. Adobe® Reader is required for viewing PDF documents supplied with DataView® that are accessible from the Help menu. • MetaViewer - The MetaViewer utility program allows a user to view and print .dmf or .emf files generated by DataView® without having DataView® software installed. • *Software Updates - Links to the AEMC® Software Update website to check for new software version releases. • *Firmware Upgrades - Links to the AEMC® Firmware Upgrade website to check for new firmware version releases. • Documents - Shows a list of instrument related documents that you can view. Adobe® Reader is required for viewing PDF documents supplied with DataView®. 3. DataView, Version x.xx.xxxx option should be selected by default. Select the desired language and then click on Install. 4. The Installation Wizard window will appear. Click Next. Sentinel® Loggers - DataView® Software 3 5. To proceed, accept the terms of the license agreement and click Next. 6. In the Customer Information window, enter a Name and Company, then click Next. 7. In the Setup Type window that appears, select the “Complete” radio button option, then click Next. 8. In the Select Features window that appears, select the instrument’s control panel that you want to install, then click Next. NOTE: The PDF-XChange option must be selected to be able to generate PDF reports from within DataView®. Figure 1-2 9. In the Ready to Install the Program window, click on Install. 10. If the feature selected for installation requires the use of a USB port, a warning box will appear, similar to Figure 1-3. Click OK. Figure 1-3 4 Sentinel® Loggers - DataView® Software NOTE: The installation of the drivers may take a few moments. Windows may even indicate that it is not responding, however it is running. Please wait for it to finish. 11. When the drivers are finished installing, the Installation Successful dialog box will appear. Click on OK. 12. Next, the Installation Wizard Complete window will appear. Click on Finish. 13. A Question dialog box appears next. Click Yes to read the procedure for connecting the instrument to the USB port on the computer. NOTE: The Set-up window remains open. You may now select another option to download (e.g. Adobe® Reader), or close the window. 14. Restart your computer, then connect the instrument to the USB port on the computer. 15. Once connected, the Found New Hardware dialog box will appear. Windows will complete the driver installation process automatically. Shortcuts for DataView® and each instrument control panel selected during the installation process have been added to your desktop. NOTE: If you connected your instrument to the computer before installing the software and drivers, you may need to use the Add/Remove Hardware utility to remove the instrument driver before repeating the process. Sentinel® Loggers - DataView® Software 5 USING DATAVIEW® 2.1 Connecting to the Sentinel® Logger There are two ways to connect to the Sentinel Logger: Connecting using the Sentinel Icon • Double-click the Sentinel Icon lation, located on the desktop. that was created during instal- • The Sentinel Control Panel will open and the Connection window will appear (see Figure 2-1). NOTE: When connecting using the Sentinel Icon and only one logger is connected to the computer, a connection will be established automatically. Connecting using the DataView Icon • Double-click the DataView Icon that was created during installation, located on the desktop. • DataView® will open and display the DataView Quick Start window. • Click the Real-time Display button and the Connection window will appear. NOTE: If the Automatically connect option is checked in the Tools > Control Panel Options dialog box, the Select Instrument window (similar to Figure 2-1) will appear instead. Figure 2-1 The Connection window specifies the connected instrument in the communications drop-down list. 6 Sentinel® Loggers - DataView® Software If multiple units are attached, select the desired unit with its associated serial number from the drop-down list. Once the desired instrument has been selected, click OK and the Sentinel Control Panel and Real-time windows will be displayed (see Figure 2-2). NOTE: The default layout can be changed by moving and resizing each window (see § 2.5 - Resizing and Saving Window Layouts). TIP: Click on the Arrange Window icon located at the top right of the toolbar to expand and arrange all the windows evenly, all at once. TIP: For complete instructions and information on using DataView®, refer to the Help Menu within the software. Sentinel® Loggers - DataView® Software 7 2.2 Using the Sentinel Control Panel The Control Panel is used for operating and configuring a Sentinel® Logger. If the Control Panel is not open, click on the Control Panel option from DataView’s main Instrument menu. Click OK when the Connection window appears (this requires an instrument to be connected to the computer). Figure 2-2 At the top of the screen the main menu lists the following commands: File Save - saves the data from the selected (high-lighted) real-time window. Note that if Instrument Status is selected, the save option is grayed out. Print - prints the status information. Print Preview - provides a preview of the information to be printed. Print Setup - displays a Print Setup window allowing you to select a destination printer and change various printing options. Exit - closes the control panel. 8 Sentinel® Loggers - DataView® Software View Trend - opens a real-time trend graph window. Waveform - opens a real-time waveform window. Harmonic Graph - opens a real-time window of harmonic values, which can be viewed as a bar graph or text. Toolbar - shows and hides the toolbar. Status Bar - shows and hides the status bar. Instrument - opens a real-time tree window that displays information about the connected Sentinel®. Status Screen - opens a real-time window displaying status information about the connected Sentinel®. Instrument Connect - establishes a connection. Disconnect - closes a connection. Configure - displays the instrument configuration window. Recorded Data - displays the Data from Sentinel window, which lists the recorded sessions contained in the instrument. Erase Memory - erases all recorded data stored in the instrument. Set Clock - displays the Date/Time window. Start/Stop Recording - Sets the recording start time to now. The stop time will be set to the current time plus the original recording duration. Save All Recordings - downloads recordings stored in the instrument. Tools Colors - sets the default colors to be assigned to graph traces associated with specific trend measurements. Test Memory - performs a test to ensure proper memory functionality. NOTE: This may take a few minutes to complete. When testing, no operation within the Sentinel’s Control Panel is possible. The LEDs on the Sentinel® unit will turn on solid during the operation to indicate that testing is in progress. After testing is complete, normal activity and operation will resume. Options - chooses the type of exponential notation to be used (e.g. numeric as in 12+3, or letters as in 12k). Sentinel® Loggers - DataView® Software 9 Window Cascade - arranges all windows into a stack, with each window offset slightly. Tile - displays all windows equally without overlapping. Arrange Icons - arranges the icons for minimized windows within the main Control Panel window. Load Layout - loads a real-time window layout. Save Layout - saves the current real-time window layout. Restore Default Layout - restores layout to the original default view NOTE: In addition, a list of open real-time windows is displayed at the bottom of the Window menu. Selecting one of these options will activate the associated real-time window. Help Help Topics - displays a list of available help topics. About Sentinel - provides version and copyright information. 2.3 Configuring the Sentinel® Logger To Configure the Sentinel® Logger, perform the following steps: 1. Open the Control Panel and connect to an instrument (refer to the previous section if you are unsure how to open the Control Panel). 2. Next, select Configure from the Sentinel’s Instrument menu. The Configure Instrument window will be displayed. NOTE: If a recording is in progress, the configuration of an instrument cannot be changed. Click on the End Recording Now button to proceed. This window has two pages, Recording and Format. The first page (Recording) allows you to define the Storage Rate and Recording Mode. 10 Sentinel® Loggers - DataView® Software Figure 2-3 Storage Rate: Specifies the rate at which sampled data is stored. Recording Mode: Specifies the mode in which the data is to be stored. • Start/Stop • FIFO • XRM 2.3.1 Setting Recording Options Start/Stop Recording Mode In the Start/Stop recording mode, the starting and ending date and time for the recording is specified. • Select the Start/Stop radio button. • To specify and enable a recording, place a check in the Schedule Recording check box (located under the Storage rate drop-down menu). The date and time for the Start/Stop recording mode is displayed. Sentinel® Loggers - DataView® Software 11 Figure 2-4 Recording Start: Specify a start date and time by performing one of the following: • Select the Now button. This will set the Recording Start date and time to the current date and time plus two minutes. • Enter the start date and time in the associated edit boxes. Recording End: Specify an end date and time by performing one of the following: • Select a time under Set Recording Duration. This will set the Recording End date and time to the Recording Start date and time plus the selected time duration. • Enter the end date and time in the associated edit boxes. Recording Priority: When operating under the Start/Stop mode, specify what priority should be used if the available memory is insufficient for the specified storage rate and duration. The priorities are: • Give recording storage rate priority - With this priority selected, the storage rate is maintained and the recording will terminate when memory becomes full. • Give recording duration priority - With this priority selected, the storage rate is adjusted such that the instrument’s memory will not become full before the specified end date and time. 12 Sentinel® Loggers - DataView® Software FIFO Recording Mode In the FIFO (First In First Out) mode, you only specify the starting date and time for the recording. The FIFO mode operates much like the Start/Stop mode with the exception that the recording does not stop when memory becomes full. When this happens the oldest sample set is discarded to make room for the new sample set. The instrument will record the most recent samples until the user stops it. • Select the FIFO radio button. • To specify and enable a recording, place a check in the Schedule Recording check box (located under the Storage rate drop-down menu). Figure 2-5 Recording Start Specify a start date and time in one of two ways: • Select the Now button. Doing so will set the Recording Start date and time to the current date and time. • Enter the start date and time in the associated edit boxes. XRM Recording Mode In the XRM mode, you only specify the starting date and time for the recording. Sentinel® Loggers - DataView® Software 13 The XRM mode operates much like Start/Stop mode with the exception that the recording does not stop when memory becomes full. When this happens every other sample is discarded, memory is compacted and storage continues at 1/2 the storage rate. This mode of recording adjusts the storage rate in order to keep the recording going. The instrument will continue to record until the user stops it. • Select the XRM radio button. • To specify and enable a recording, place a check in the Schedule Recording check box (located under the Storage rate drop-down menu). Figure 2-6 Recording Start Specify a start date and time in one of two ways: • Select the Now button. Doing so will set the Recording Start date and time to the current date and time. • Enter the start date and time in the associated edit boxes. 14 Sentinel® Loggers - DataView® Software COMMON RECORDING OPTIONS Apply & Start Recording Now: Writes the configuration to the instrument and begins a recording (provided memory is available). Apply & Start Recording Synchronized: Writes the configuration to the instrument and begins a synchronized recording (provided enough memory is available). A synchronized recording is one that begins with the start time synchronized to the storage rate. For example, if the storage rate is set to 10 minutes the recording will start at the next 10 minute interval of the clock (start on the hour, 10 past, 20 past, 30 past, etc). Re-Read From Instrument: Reads the configuration inside the attached Sentinel® and resets the field options based on the instrument’s current configuration. Load from File: Allows the user to select a previously saved instrument configuration. Save to File: Saves the current configuration to a file. Recall Defaults: Resets the configuration to the default settings. The Configure Instrument window also contains a memory status area. This area displays the amount of memory used, the amount of available memory and the amount of memory required for the selected configuration. 2.3.2 Setting Format Options The Format page is displayed by clicking on the Format tab and allows you to define the following: Frequency: Specifies the line frequency of the measurement inputs. Measurement Setup: Specifies the measurement for each available channel. Channels are the mathematical results of an input. (e.g. Channel 1 = RMS of Input 1) • Channels 1, 2 and 3 are fixed and cannot be changed. They represent the RMS of the corresponding input. • Channels 5 through 8 can be set to one of the available functions. To configure one of these channels, select the desired channel and select the desired function. Depending on the function selected you will have additional options to specify. Sentinel® Loggers - DataView® Software 15 Figure 2-7a Models SDL-A301, A302, A303 and A304 Here you specify which channel is to correspond to A and which channel is to correspond to B. The channels available will be those with a number less than the current channels index. Example: When specifying channel 5 you can select from channel 1 through 3. When specifying channel 6 you can select from 1, 2, 3 and 5. Figure 2-7a illustrates the configuration for a three input Sentinel®. If the Sentinel® has a fourth input then channel 4 would be displayed as Input4. You can combine channels to perform more sophisticated math operations. Example: Use the math result of channel 5 as an option for channel 6. You must however, define channels in order. You cannot define channel 6 until channel 5 has been defined. 16 Sentinel® Loggers - DataView® Software Figure 2-7b Model SDL-A401 All models except the A402 allow you to select the number of times the AmpFlex® is wrapped around the conductor. The choices are single, double or triple wrapped. Double and triple wrapping can be useful if you are trying to measure current values near or below the lower limit for this instrument. The Model SDL-A401 allows you to select the range of the current sensor connected to the logger. The light gray buttons indicate the selection for the AmpFlex® Sensor (1000A or 3000A). NOTE: Each channel is independent and can be set for different ranges. Sentinel® Loggers - DataView® Software 17 Figure 2-7c Model SDL-A402 The Model SDL-A402 allows you to select the ratio of the current probe that is attached (1mV/A, 10mV/A, 100mV/A, 0.1mV/A or 0.33mV/A). NOTE: The values measured are limited to 1.1Vrms max before the instru ment displays an overload. The Format dialog page also has the following options: • Record Channel - if checked, the instrument will record the channel when a recording session is active. • Set Sentinel’s Clock - Allows the user to change the time contained within the instrument. • Erase Memory - Allows the user to erase the instrument’s memory before writing the configuration into it. • Re-Read From Instrument: Reads the configuration inside the attached Sentinel® and resets the field options based on the instrument’s current configuration. • Load from File: Allows the user to select a previously saved instrument configuration. • Save to File: Saves the current configuration to a specified file. 18 Sentinel® Loggers - DataView® Software • Recall Defaults: Resets the configuration to the default settings. If you want to start the recording, return to the Recording page by clicking on the Recording tab and select the Apply & Start Recording Now button. This will write the configuration to the instrument and begin a recording (provided enough memory is available). To write the configuration to the instrument and close the dialog box, click the OK button. Selecting the Cancel button will close the Configure Instrument window discarding the configuration changes. Selecting the Apply button will write the configuration to the instrument without closing the Configure Instrument window. Selecting the Help button will display the associated help topic. 2.3.3 Configuring and Recording Data The following is intended as an example, which you can follow along. WARNING: In this example you will be erasing the instrument’s memory. If the instrument contains important data that you wish to keep, download the data before proceeding. As an example, you will configure the instrument to measure (and record) at a storage rate of 500mS over a recording period of 10 minutes. Note: The instrument’s clock should be set to the proper time as the clock may vary due to time zones. 1. If the Configure Instrument window is not already displayed, open it as previously discussed. 2. If the Recording dialog page is not displayed, click on the Recording tab to display it. 3. If a recording is active, stop it by selecting the End Recording Now button. 4. If the Schedule Recording option is not checked, place a check to select this option. 5. Select 500mS from the Storage rate drop-down list (you may need to scroll up the list, using the vertical scroll bar, to see this option). 6. Select the Start/Stop recording mode. Sentinel® Loggers - DataView® Software 19 7. Select a 10 minute recording duration by selecting the 10 Min button under the Set Recording Duration section of the text. 8. Select the Now button (under the Recording Start time). This sets the End time to the current time plus 10 minutes. 9. Select the Give recording storage rate priority option. At this point the Recording page should look similar to Figure 2-10. Figure 2-8 10. Select the Format tab to display the Format page 11. Select the measurement frequency corresponding to your locality (50 or 60Hz). 12. Erase the instrument’s memory by clicking on Erase Memory. Click on the OK button. Figure 2-9 20 Sentinel® Loggers - DataView® Software NOTE: If you would like to save the configuration at this point, click on the Save to File button and refer to § 2.3.4. 13. Return to the Recording page by clicking on the Recording tab and select the Apply & Start Recording Now button. This will write the configuration to the instrument and begin a recording (provided memory is available in the instrument). 2.3.4 Saving and Loading Configurations To Save the Current Configuration to Disk: • Select the Save to File button. The Save As window will be displayed. • Specify a name for the file and type it into the File name field, then specify a location to save it to. • Once the file name and directory have been specified, select the Save button. To Recall (Load) a Saved Configuration from Disk: • Select the Load from File button. The Open window will be displayed. • Specify the name of the file by typing it into the File name field, or select it from the location where the configuration was originally saved. • Once the file name and directory have been specified, select the Open button. The configuration will be read from disk and the Configure Instrument window will reset accordingly. Selecting the Re-Read From Instrument button will read the configuration in the attached instrument and reset the dialog fields, accordingly. Sentinel® Loggers - DataView® Software 21 2.4 Displaying Real-time Status Information Real-time data and instrument status is displayed in the Control Panel. Figure 2-10 Communication: Port - physical communications port currently being used. Instrument Identification: Model - instrument’s model identification number. Serial # - instrument’s serial identification number. Firmware Rev - firmware revision of the attached instrument. Recording: State - instrument’s recording state (Idle or Active). Start Time - if a recording is scheduled and has not already started. End Time - if the recording is of a Start/Stop type. Time Remaining - amount of time remaining for the current recording session (if one is active). Recording Mode - Start/Stop, FIFO or XRM. Storage Rate - the time between storage of sample sets. Database Status: Open or closed state of a database into which real-time measurements are to be or being stored. 22 Sentinel® Loggers - DataView® Software Default Frequency: Displays the default frequency. Time Read from Sentinel: Displays the time as indicated by the Sentinel® internal clock. Battery Charge: Main battery - voltage of the main battery. Lithium Battery Charge - level of the lithium backup battery. Lithium Battery Minimum Acceptable Level - this is the voltage at which the backup battery can still provide backup protection. If the lithium battery falls below this level then it should be replaced. Memory: Capacity - total amount of memory available for recorded data. Used - amount of recording memory currently used. 2.5 Resizing and Saving Real-time Window Layouts To Move a Window: 1. Move the mouse pointer over the title bar of the real-time window, then press and hold the left mouse button. 2. While holding the left mouse button down, move the mouse pointer around the screen. Notice the window (or outline of the window) moves with the mouse pointer. 3. When the window is at the desired location, release the mouse button. To Resize a Window: 1. Move the mouse pointer over the bottom right corner edge of the Control Panel window. The pointer should change into two black arrows. 2. Press and hold the left mouse button. 3. While holding the left mouse button down, move the mouse pointer up and to the left side of the screen or down and to the right. Notice the window resizes accordingly. 4. When the window has been adjusted to the desired size, release the mouse button. Once you have all of your windows in a desired location, you can save your layout for future use. Sentinel® Loggers - DataView® Software 23 To Save a Layout: • Go to Window > Save Layout. Type in a name for the layout and select the folder that you wish to save it in. Click on Save. To Load a Layout: • Go to Window > Load Layout. Locate and select a previously saved layout file. Click on Open. 2.6 Displaying Real-time Graphs and Text The following options can be obtained from the View menu: Waveform Graphs: The Waveform window displays line cycle snapshots. This window displays the actual waveform relative to time. Figure 2-11 Harmonic Graphs: The Harmonic Graph window shows the harmonic content of an associated line cycle using a bar graph. 24 Sentinel® Loggers - DataView® Software Figure 2-12 View As List: The Harmonic window shows the harmonic content of an associated line cycle using a tabular summary. Figure 2-13 Sentinel® Loggers - DataView® Software 25 Trend Graphs: The Trend window shows measurements (sample points) over a time period. Figure 2-14 Displayed at the top of these windows is a list of available channels. Clicking on an entry will display the waveform of the corresponding channel. You can select one or more channels by using the Ctrl or Shift keys while making a selection. The real-time update can be paused by clicking the Pause button (II) at the top left of the screen. The automatic update will stop until the Pause button is pressed again. Graph magnifications can be increased, reset and decreased by selecting the ++, +, 0, - and -- buttons. 2.7 Saving Real-time Measurements Real-time data received from an instrument can be saved directly into a recording session database. This differs from the process of downloading and saving recorded data, in that the measurements are stored on the computer as the instrument measures them. These measurements are not necessarily being stored within the instrument. However, the instrument may be configured to record at the same time real-time measurements are being received from the instrument. In which case, two copies of the measurements will be stored. One copy is stored on the local computer and the other in memory within the instrument. 26 Sentinel® Loggers - DataView® Software To Save a Real-time Measurement: 1. To begin recording real-time measurements, select the Start recording real-time data option from the File menu. When the Start recording real-time data option is selected, a dialog box will be displayed asking for the name of the database to save the measurements into. 2. Specify the name of the database file by typing it into the File name field or by selecting one from the displayed list. Next, select the desired location to save the file. Select Save to save the file or Cancel to return to the Control Panel. 3. If Save was selected, the Session Properties window displays. Figure 2-15 The Session Properties dialog allows you to specify Operator, Site and Custom parameters that are to be saved with recorded data. These parameters are used when generating reports. The Operator and Site tabs allow you to maintain lists of operators and sites, saving you time when specifying parameters for reports. On the left of the Operator and Site tabs is the list of previously defined Operators and Sites. On the right of the Operator and Site tabs is the individual parameters that will be saved in an associated database. Only a single set of operator and site fields are saved in the recording database. The Custom tab contains a list of user defined parameters. Along side each user defined parameter is a check box. Items that are checked will be added to an associated database. Only a single set of Custom paramSentinel® Loggers - DataView® Software 27 eters can be maintained (unlike the Operator and Site lists). The Custom tab allows you to specify any user defined parameters (in addition to the comments field of the Site tab) that are to be used in displaying a report. 4. Type the appropriate information into the fields, then click OK. 5. Measurement data will be saved until the Stop recording real-time data option is selected from the File menu. When you stop recording real-time data, you will be asked if you want to open the database. 6. Answering Yes will bring the main DataView® window to the foreground and the Create View from Template window will be displayed. Figure 2-16 This window allows the user to specify a template for the database that was just downloaded and saved. A suggested template will be selected. Either accept this template or select another one. 7. After selecting a template to use, select the OK button. A report will be displayed in the main DataView® window containing the recorded sample data in the format associated with the template. 8. To save the report, go to File > Save and save the file in the desired location. 28 Sentinel® Loggers - DataView® Software 2.8 Downloading Recorded Instrument Data Recorded measurements stored in the instrument are transferred to a database on the PC using the download command. Assuming a recording session has been started and stopped, the instrument should have at least one recorded measurement inside it. To Download a Recording: • Select Recorded Data from the Sentinel’s Instrument menu. This begins the transfer of recorded data to the computer. A window displaying the transfer progress will be displayed. • Once the transfer is complete, the Recordings window will display the recordings in memory. Figure 2-17 • Click on View All to download all of the recordings. • Each recording will appear in its own window allowing you to either Print or Save. Sentinel® Loggers - DataView® Software 29 Figure 2-18 2.9 Sentinel® Logger Templates Refer to the DataView® Help files for detailed information about using the Logger Templates. Trend AC Template The Trend AC template is for use with the Voltage and Current loggers and generates a view with two worksheets. You can move between the worksheets by selecting the desired worksheet from the worksheet tabs at the bottom of the view (just above the status bar). The first worksheet contains the following frames: • • • • • • Text Box Channel Graph Session Summary Channel List Meter Trend Summary List The following illustrates the first worksheet of this view: 30 Sentinel® Loggers - DataView® Software Text Box Channel Graph Channel List Meter Trend Summary List Figure 2-19 The second sheet contains the following frames: • Text Box - containing the text “Trend Summary Report”. • Session Summary - containing the name of the database used to generate the report. • Session Summary - containing operator information. • Session Summary - containing test site information. • Session Summary - containing operator comments. • OLE - containing the AEMC® Instruments logo. Sentinel® Loggers - DataView® Software 31 Figure 2-20 Using the associated properties window customizes each of these frames. The properties window for a frame is displayed by selecting the frame, then selecting the Properties command from the Frame menu. Channel Graph Frame A Channel Graph frame provides a graphical look into the database it is attached to. The database is attached to the Trend Graph frame when it is created. This frame provides additional tools for viewing the underlying database. These tools provide zoom and pan operations. In addition, individual traces and waveform snapshots can be selected using the Select Frame tool. Normally, the Select Frame tool is used to select a frame for modification. In addition to selecting the Graph frame, this tool can be used to select individual traces. A trace is selected if any part of it is drawn within a few screen pixels of where the selection tool is when the left mouse button is pressed. 32 Sentinel® Loggers - DataView® Software When a trace is selected, handles similar to those of the frame handles are drawn over the trace. If more than one trace is drawn within the proximity of the selection tool, when clicked again, the next trace will be selected. This will continue until all traces within the selection tools proximity have been selected. At which point, clicking the left mouse button again will select the first trace and the process will repeat. The Channel Graph frame can be the parent frame for child frames. Child frames are objects that are tightly connected to another (parent) frame. The child frame obtains instructions, and displays data from the parent. This template contains the following child frame types: • • • • Session Summary Channel List Meter Trend Summary List The channels selected for display and the display properties, can be changed at any time using the Channel Graph Properties window. The Channel Graph Properties window can be displayed by right-clicking the mouse pointer while positioned over the Graph frame. Then, select Properties from the drop-down menu. The display extents of the Channel Graph frame can be changed by using zoom and pan operations. By zooming and panning you change the starting and ending times of the displayed data. By changing the starting and ending display times, you can zoom in, zoom out, pan left and right, pan to start and pan to end of measurement data. To change the display extents of a graph frame, select the frame using either the frame selection tool or Zoom Tool . Next, use a zoom or pan command from the Zoom menu, or from the toolbar. By clicking and dragging the Zoom Tool across the desired area of the graph, you can select an area to zoom in on. Channel List Frame The Channel List frame is a child frame attached to either a Channel Graph, or Micro-Graph Frame. In the case of this template, the parent is a Channel Graph frame. The Channel List frame displays a textual list summary of the channels available in the recording. Each summary line contains user-specified parameters of a specific channel recording. You can specify the displayed parameters and general display options using the Channel List Properties dialog box. Sentinel® Loggers - DataView® Software 33 You can step between list entries. Selecting Pan To Start, displays the first list entry. Selecting Pan To End, displays the last list entry. Selecting the Step Right or Step Left, displays the next or previous list entry. When stepping through the captured list entries, the selection will move from each entry for the associated channel. In addition to stepping through the list with the tool bar, you can select a specific entry listed using the mouse pointer. The text for the selected entry will be highlighted, indicating which entry in the list is currently selected. Session Summary Frame The Session Summary frame is a child frame attached to the Channel Graph frame. This frame displays a textual summary of its parent frame. You can customize the summary text displayed, using the Session Summary Properties dialog box. This dialog box is displayed by right-clicking on the frame and selecting Properties from the drop-down menu, or by double-clicking on the frame. The Trend template contains Session Summary frames displaying the following information: • Start time and duration of the recorded data. Also, the instrument’s identification codes. This frame is in the upper right corner of the first worksheet. • Database containing the file name and location of the recording data • Operator information • Test site information • Operator comments The text displayed in the session summary frames is static as long as the data within the associated database remains static. Session Summary Frames do not provide the interactive operations available in the Channel Graph and Trend Summary List Frames. Meter Frame The Meter frame is a child frame attached to the Channel Graph frame. The Meter frame displays the values of samples at a specific location on the graph. Left-click on the graph to see a black vertical bar. In addition the Meter frame will be updated to reflect the samples at this location on the graph. Left-clicking at other areas of the graph will move the vertical bar and update the Meter frame accordingly. 34 Sentinel® Loggers - DataView® Software Text Box Frame A Text Box Frame displays text within a given object frame. The text within the frame is static, in that it does not change. It only changes when you change it. This template contains a Text Box Frame located at the top of the worksheet. The text displayed within this frame is the title of this report (Trend Summary Report). The text, font and other frame properties can be changed using the Text Box Properties dialog box. NOTE: For more information on using DataView®, refer to the Help Files within the software. Sentinel® Loggers - DataView® Software 35 NOTES: 36 Sentinel® Loggers - DataView® Software 10/09 99-MAN 100295 v7 Chauvin Arnoux®, Inc. d.b.a. AEMC® Instruments 15 Faraday Drive • Dover, NH 03820 USA • Phone: (603) 749-6434 • Fax: (603) 742-2346 www.aemc.com