1
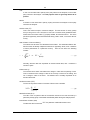
Contract Report
CR-2004/47
November 2004
CR-2004/47
SuperSurf User Manual
Authors:
Prepared for:
South African Bitumen Association
Postnet Suite 56
Private Bag X21
HOWARD PLACE
7450
Tel: +27 21 531 2718
Fax: +27 21 531 2606
J D Lea, P Paige-Green
Prepared by:
Division of Roads and Transport Technology
CSIR
PO Box 395
PRETORIA
0001
Tel: +27 12 841 2905
Fax: +27 12 841 3232
DOCUMENT RETRIEVAL PAGE
Title:
SuperSurf User Manual
Author:
J D Lea, P Paige-Green
Client:
Client Reference No:
Date:
SABITA
November 2004
Project No:
OE2:
9431/TIK51
Infrastructure Engineering
Synopsis:
Report No: CR-2004/47
Distribution:
Restricted
ISBN:
This User Manual accompanies the SuperSurf software package. The package has been developed
using Excel spreadsheets as a simple mechanism for carrying out cost comparisons between
maintaining an existing unpaved road and improving it by using various upgrading alternatives. The
improvements generally relate to low cost seals on in situ or local materials but also include dustpalliative options to allow direct cost comparisons. The package includes mechanisms for incorporating
environmental and social costs/benefits, with some guidance regarding the selection of input values for
these. The package can be utilised for roads in both the rural and urban environment.
The design, maintenance and rehabilitation requirements and costs of each alternative for input into
the package must be developed by an experienced engineer. However, it is expected that innovative
solutions will be made use of as far as possible.
Keywords:
Economic analysis, upgrading, unpaved roads, sealed roads
Proposals for implementation:
Sabita to distribute software and manual.
Related documents (e.g. software, interim or other reports, working drawings, etc.):
SuperSurf software
Signatures:
D Jones
W JvdM Steyn
B Verhaeghe
E van Heerden
P Hendricks
Language Editor
Technical
Reviewer
Programme
Manager
Transportek
Information Centre
Division Director
TABLE OF CONTENTS
1.
INTRODUCTION................................................................................................................... 1-1
1.1 What is SuperSurf?..................................................................................................... 1-1
1.2 What is SuperSurf not? ............................................................................................... 1-1
1.3 What do I need to use SuperSurf?.............................................................................. 1-1
2.
ECONOMIC ANALYSIS ....................................................................................................... 2-2
2.1 What is ‘Economic Analysis’? ..................................................................................... 2-2
2.2 Definitions ................................................................................................................... 2-2
2.3 Time value of money................................................................................................... 2-4
2.4 Cost/benefit streams ................................................................................................... 2-4
3.
USING SUPERSURF............................................................................................................ 3-1
3.1 Loading SuperSurf ...................................................................................................... 3-1
3.2 Results page ............................................................................................................... 3-1
3.3 Base page ................................................................................................................... 3-3
3.4 Calculations .............................................................................................................. 3-13
3.5 Changing options ...................................................................................................... 3-13
3.6 Advanced use ........................................................................................................... 3-14
3.7 Printing Results ......................................................................................................... 3-14
3.8 Saving Analyses ....................................................................................................... 3-14
3.9 Sensitivity Analyses .................................................................................................. 3-14
4.
WORKED EXAMPLE ........................................................................................................... 4-1
5.
REFERENCES...................................................................................................................... 5-1
1-1
1.
INTRODUCTION
1.1
What is SuperSurf?
SuperSurf is an Excel® spreadsheet that allows one to perform a detailed economic analysis
of various road maintenance and upgrading strategies, including upgrading (phased or direct)
of gravel roads to a paved standard. This can be applied to both rural and urban situations.
SuperSurf is designed to be as easy to use as possible, but also highly flexible. This manual
describes how to use SuperSurf, and how to extend it for more advanced analysis work. It
also explains the logic and methodology of economic analysis, to guide those who have not
received any formal training on the subject.
The package is equally suitable for roads in the urban and rural environment, although
aspects such as the drainage requirements and costs will need to be assessed for each case
individually.
1.2
What is SuperSurf not?
SuperSurf is a forecasting tool, and does not identify or provide all of the possible upgrading
or maintenance options for any particular road. For that you will have to use your own
experience and intuition. It is also not a pavement design tool – any road designs will need to
be developed outside of SuperSurf and the resulting data placed in the correct cells by the
user. Similarly, the costs for each of these options (including their maintenance and
rehabilitation requirements) will need to be determined independently by the user, especially
when innovative solutions are being investigated. Good engineering judgement and
experience are essential to optimise the benefits of this package.
SuperSurf is also not a ‘simple pavement management system’. It is designed for project
level analysis of a single section of road and not for a road network. However, it could be
used to provide decision support information for a simple but limited PMS.
1.3
What do I need to use SuperSurf?
To use SuperSurf you will need a computer with Microsoft Excel® installed and a working
knowledge of the program. You will also need some basic information about the roads that
you are planning to analyse and the technically viable alternatives. Some basic knowledge of
the principles of economic analysis are also required, so please read the chapters which
follow in this manual carefully if you are not familiar with economic analysis.
As with any forecasting tool, the more accurate the input data, the more reliable the output.
Therefore, you will also need good data on which to base your analysis.
Experience has shown that economic analyses can be easily manipulated to produce almost
any result required. Because of this, it is essential that all input data values are carefully
recorded, any supporting information or actual figures that can justify the decisions are
documented (in a separate worksheet as part of the workbook for any single analysis) and
the user must be convinced that all input data used accurately represent the actual situation
pertaining to the project.
CR-2004/47: SuperSurf User Manual
Introduction
2-2
2.
ECONOMIC ANALYSIS
2.1
What is ‘Economic Analysis’?
Economic Analysis is a wide field (generally taught within econometrics), which has the goal
of providing tools for decision making between various alternative options for spending or
saving money. Within the context of SuperSurf we are only concerned with decision-making
between various road maintenance and upgrading options for a particular section of road.
However, the tools can be used in a wide variety of scenarios to aid in decision-making.
Economic Analysis is a tool, and provides ‘decision support’; it does not make decisions for
you, the road engineer/manager.
Economic Analysis provides a consistent means of determining the most effective strategy,
not just on a single section, but for any decision which needs to be taken in the management
of a road network. It thus provides a stable basis for consistent road management, which is
based on observable, objective criteria. However, because economic analysis requires a
large number of inputs and provides a number of possible decision strategies, it can be very
easy to misinterpret the results. Even worse, and more often than people admit, it can be
manipulated to provide any desired results. As with any analysis tool, the maxim of ‘garbage
in, garbage out’ applies. Economic analysis requires a large number of input variables, and if
you are unable or unwilling to supply these correctly, then it will not be able to help you in
your decision-making.
Economic analysis works with a stream of costs and benefits, expressed in monetary terms,
so if one wishes to consider some factor, then one must be able to express this as a
monetary value. This can be difficult, and often controversial, especially when monetary
values are attached to human life and to social and environmental impacts.
It should be noted that costs are negative benefits or benefits are negative costs and as such
no direct differentiation is made between these two concepts during the discussion in the
document.
2.2
Definitions
It is always a good idea to establish terminology before getting into any detailed discussion
on methodology. The following terms are used within this document, and in SuperSurf,
according to the definitions below. Even if you are well versed in economic analysis you will
do well to read this list, to make sure that you understand how a particular term is being used
in SuperSurf.
Analysis Period (n)
The time period for which the road section under consideration is being analysed. This
is normally somewhere from 10 to 30 years.
Base Year
The year before the first year of the analysis period, in which all of the costs and
benefits are ‘true’. This is normally the current year, and all costs are inflated to this
year or discounted back to this year.
CR-2004/47: SuperSurf User Manual
Economic Analysis
2-3
Cost
A cost is a real value that is paid by some party internal to the analysis, to some other
party external to the analysis. In roads projects costs are generally defined to be
positive.
Benefit
A benefit is a real value that is paid by a party external to the analysis to some party
internal to the analysis.
Present Value (PV)
This is the central concept in economic analysis. This the amount of money (value)
that you will give me now if we were to enter into a contract which guaranteed that I
would return some future value (V), properly inflated, at some future time x. This is the
perceived opportunity value associated with having ‘cash in hand’, or the ‘time value of
money’.
Rate of Return or Discount Rate (r)
The interest rate at which one calculates Present Value. This is not the inflation rate.
Discount rates are always subjective measures of opportunity value, never a measure
of future performance of a particular currency. Thus we can derive the following
formula:
r =
x
V
− 1 or
PV
PV =
V
(1+ r ) x
.......... (1)
Normally, discount rates are expressed as annual interest rates, thus x would be a
number of years.
Inflation Rate (i)
The interest rate at which real static items change in value with the passing of time.
This is a measure of the change in value of the currency in which one is working, and
not a change in value of the items. The inflation rate is normally expressed as an
annual interest rate.
Net Present Value (NPV)
The sum of the present values of a stream of future costs or benefits:
n
NPV = ∑
j =1
Vj
(1 + r )
xj
.......... (2)
Benefit/Cost Ratio (B:C)
The ratio of the net present value of the benefits accrued to the costs incurred by a
particular (closed) group of interested and affected parties during the analysis period.
Internal Rate of Return (IRR)
The discount rate for which the NPV of a particular cost/benefit stream is zero.
CR-2004/47: SuperSurf User Manual
Economic Analysis
2-4
2.3
Time value of money
The first decision that must be taken when doing economic analysis is the perceived ‘time
value of money’, or ‘opportunity value’ for the client. This is represented by the discount rate,
which is used to determine the present value of any future benefit or cost. Unfortunately this
is one of the most misunderstood concepts in economic analysis and thus a great source of
confusion, and also the easiest number to ‘fudge’ to skew the analysis.
The ‘time value of money’ is the value that one attaches to having ‘cash in hand’ now as
opposed to some future time. This is best expressed in terms of an investment opportunity.
If someone guarantees to pay you R100, properly inflated, in one years time, if you are willing
to give them an amount PV now, when at what value of PV would you consider this to be a
good deal. If you say a present value (PV) of R100, then you do not consider money to have
a time value. If you say R0, then you have an infinite time value. A value above R100 would
mean that you are very altruistic, and have a negative time value for money. Saying R90.91
would give a rate of 10 per cent. Generally, this value is the difference between the interest
rate at which one can invest in a zero risk investment opportunity and the inflation rate.
It is important to see that this value is independent of the inflation rate. Many users of
economic analysis think, and insist, that this value is linked to the inflation rate. It is not, and
unfortunately until this concept is clear, one has not really understood economic analysis.
For most public agencies the difference between the official inflation rate and the inter-bank
loan rate (prime rate), averaged over the past ten years, should be used. This represents an
average opportunity value for the public agency to invest their money in a zero risk
investment. Studies show that this difference is normally an indication of the type of
economy (developed or developing), and is not directly linked to the inflation rate (although
inflation rate also depends on the type of economy). Some have suggested that public
agencies should use a rate of 0%, since their goal is not to invest money, but to use money
for the public good. The lower the discount rate, the more the analysis will favour alternatives
which have high initial costs, because it will favour spending money now rather than at some
future date. The discount rate currently in use in South Africa is 8 per cent, but this changes
with economic conditions. It is thus recommended that sensitivity analyses using values of
6 and 10 per cent are also carried out. The latest rate can be obtained from agencies such as
the Development Bank of South Africa.
2.4
Cost/benefit streams
Each alternative is presented within the economic analysis as a cost/benefit stream. This is a
series of future values, each occurring at some time within the analysis period. As defined
above, a cost is an amount paid to someone outside of the analysis (ie, an amount paid to a
contractor, an employee, a supplier, etc.). In roads projects nearly everything is a cost so, to
avoid working with negative numbers, costs are considered positive values. Benefits are
amounts paid to someone internal to the analysis, from someone outside.
The easiest example of this is a bank loan, from the perspective of the bank. The person
taking the loan is external to the analysis and the bank is internal. The person receives a
lump sum from the bank (a cost) and then pays off the loan to the bank as a stream of
monthly payments (benefits). The bank must decide if it is worth its while to loan someone
the initial sum, or whether it is better to hold the money itself.
CR-2004/47: SuperSurf User Manual
Economic Analysis
2-5
For public agencies, the idea of costs and benefits is a little more difficult, since these
agencies are normally budget based. They receive a yearly budget allocation, and what they
do not spend is ‘lost’. If one were an accountant working for the agency, one would always
work on a year-by-year basis, and consider the budget amount to be income and therefore a
benefit. The amount spent on roads would be costs, and every year the agency’s costs
would match their benefits (if they had not overspent). However, this would make no sense
from the perspective of road management, because all of the agencies costs would be
matched by an equal ‘benefit’ from the agencies budget, and the resulting NPV would always
be zero. Therefore, for managing roads we assume that the agency has unlimited funds, and
that there are no budgetary benefits. Since the agency is unlikely to have unlimited funds, a
level of decision-making above economic management must be performed to ensure proper
budget allocation (normally making use of the pavement management system). With this
approach, from the agency’s perspective, all alternatives are a long stream of costs, with no
benefits, and so often one will hear people referring to the NPV as the Net Present Cost
(NPC). The alternative with the lowest NPC is then the best alternative.
However, if using a purely cost based stream, then one cannot apply various types of
economic analysis – particularly Benefit/Cost Ratio and Internal Rate of Return. These
measures are independent of the magnitude of the costs involved in the project, and so are
used to compare various projects on different sections, and even expenditure on different
types of assets. Because of this, SuperSurf makes use of ‘Pseudo Cost Benefit streams’.
When performing decision making on roads projects there is normally a ‘do nothing’
alternative, which details the costs which the agency would incur if they did not do any
upgrading on a road. These are the normal maintenance costs associated with whatever
type of road is already in place. The costs associated with this ‘do nothing’ alternative (the
Base option), are subtracted from the costs of the other alternatives, to provide a pseudo
stream of costs and benefits. If the costs associated with the alternative are higher than
those of the base option, then the alternative will cost more than the base option, but if they
are lower, then there is a benefit. With this pseudo cost benefit stream it is possible to
calculate B:C and IRR, and thus to compare projects of various sizes.
2.4.1
Agency costs
The costs to the road agency associated with a particular road section are normally divided
into three groups (with fairly arbitrary boundaries).
These are construction costs,
maintenance costs and rehabilitation costs. Generally, construction costs are associated with
the initial construction of a facility or the upgrading of a facility to a higher design standard
(e.g. paving a gravel road). Rehabilitation costs are associated with returning a deteriorated
facility to its original or better level of service (e.g. resurfacing a road), and maintenance costs
are associated with slowing the deterioration of a facility.
Within SuperSurf, all costs and benefits associated with the agency are grouped under the
title ‘Financial Costs’ as these can normally be easily determined as a direct financial cost or
benefit to the agency.
Generally there is no benefit to the agency, unless there is some toll on the facility. If one is
performing an economic analysis based on the agency alone, then toll income forms a benefit
to the agency. However, if one is performing an analysis including road user costs then toll
income should be ignored, since it is a transaction internal to the analysis.
CR-2004/47: SuperSurf User Manual
Economic Analysis
2-6
2.4.2
Road user costs
Not all of the costs associated with a road are paid by the agency managing the road. In fact,
the majority of the costs are carried by the users, in the form of vehicle and fuel costs.
However, it is not always appropriate for an agency to consider these costs. Within
SuperSurf an analysis which includes road user costs is referred to as an ‘economic’
analysis, because it reflects the economy in general and not just the finances of the agency.
Road user costs considered in SuperSurf are Vehicle Operating Costs (VOC), which includes
vehicle wear-and-tear, fuel and tyres, etc.; and accident costs. These are based on the
results of a number of research studies, and so are linked to the years in which those studies
were completed. These costs thus have to be inflated into the Base Year for the analysis.
This must be done in a careful and systematic way, else the analysis will be heavily skewed.
If possible, a transport specific inflation rate should be used, based on the inflation in fuel and
motor vehicle costs over the interceding years. The general inflation rate, as reported by
government agencies, can also be used. Another approach is to use the back-calculated
inflation rate from the Automobile Association’s recommended kilometre tariffs, or those
associated with Income Tax vehicle allowances.
The goal of the inflation of the researched values is to ensure that the VOC is accurately
represented in terms of ‘Base Year Rands’. The researched values are given in terms of
‘shadow prices’. A shadow price is the real cost associated with the use of the vehicle, and
not ‘hidden costs’, such as fuel taxes, VAT and compound interest charges. The reason that
these are excluded, even though they are costs borne by road users, is that they are
independent of the actual costs of using the road. For instance, if the government were to
remove all taxes from fuel, then it would not effect the quantity of fuel used to drive along the
road, or the actual cost of that fuel. Accident costs are similar to road user costs, and must
also be correctly inflated.
SuperSurf does not make use of any ‘time costs’. These are calculated as the ‘cost’ of the
‘wasted’ time for the users of the road, and are often based on average income figures and
other measures of how much the user’s time is worth. Generally these ‘time costs’ are very
large, and completely dominate any analysis, and are also highly debatable. Anyone who
has been involved in any type of statistical study on work productivity will point out that
people value their time in all sorts of ways, and five minutes saved on the drive to work does
not equate to five minutes of extra work. This is especially true in rural areas where much of
the potential upgrading of unpaved roads is likely to take place.
2.4.3
Environmental costs
These are costs that are borne by the ‘environment’, which are generally defined as any
costs associated with a road, which are not paid by the agency or road users.
Environmental costs typically include aspects such as the effect of dust on vegetation and
livestock, damage to adjacent roads caused by hauling of materials during construction
activities, the impacts of construction activities on air and water pollution, soil erosion
resulting from construction activities and the use of non-renewable resources. Many of these
costs are common to any construction alternative, but aspects such as dust and material
usage are specific to individual options and should be taken into account during the analysis.
An aggregate tax has been introduced in certain countries, essentially to cover the intrinsic
value of a non-renewable resource. Aspects such as this would appear as an environmental
cost.
CR-2004/47: SuperSurf User Manual
Economic Analysis
2-7
In some cases it is possible to attach real values to these costs, such as dust damage to
crops alongside a road. But, in most cases, these costs are very difficult to establish. High
environmental costs, such as the effect of dust on crops, could be used to justify upgrading a
road to a paved standard.
Normally, if one wishes to perform an economic analysis as part of an environmental impact
assessment (EIA), it is best to perform the analysis without environmental costs, and use the
results as one indicator in the EIA process. The other approach is to use some other
decision making process to determine the ‘correct’ decision from an environmental
perspective, and then back-calculate the environmental costs which will give this as the best
alternative within an economic analysis. However, the procedure for doing this is beyond the
scope of this package.
2.4.4
Social costs/benefits
These are costs or benefits affecting communities using the roads or effected by the use of
the roads. Like environmental costs, they are difficult to quantify with no adequate
mathematical models currently available for implementation.
Examples of social costs/benefits include the influence of dust generated from unpaved roads
on communities residing adjacent to the roads. Dust can have significant impacts on health,
safety of non-motorised transport and animals and the need for ongoing cleaning/dust
removal in nearby houses.
Benefits include aspects such as the increased opportunity cost associated with paving an
unpaved road, improved accessibility for communities, improved accessibility for commercial
traffic (delivery of goods, etc), job creation and the spin-offs associated with employment of
local communities during construction and maintenance. Many other more esoteric factors
such as improved profitability of agricultural and animal products, the potential for tourism
development and improved access to health and education facilities are included within this
definition.
In the context of the economic analyses carried out using SuperSurf, many of the benefits are
common to all of the options and would typically be used in prioritising investment in different
roads. It is assumed in SuperSurf that any alternative selected would have similar benefits in
terms of accessibility, easier access to health and education, profitability of produce, etc.,
these benefits not usually being applicable to the base case. The differences between the
various options would be more in quality of life, job creation, reduced dust, etc.
The use of community labour can be seen as a significant benefit as income is generated in
the area, as well as being directly in line with initiatives such as the South African Expanded
Public Works Programme (EPWP). Payments to the community are included as costs
(construction or maintenance) but must also be included as benefits, under the social benefits
section. It is important that both aspects be incorporated in the analyses, although the facility
exists in the software to effectively reduce the costs of the labour, by attaching a shadow cost
to it.
Incorporation of the environmental and social benefits can be handled in two ways in the
software.
CR-2004/47: SuperSurf User Manual
Economic Analysis
2-8
1 – Input assumed values. Various categories of social and environmental benefits have
been identified and in a separate work sheet for assumptions, the reasoning behind the
selection of these can be recorded for later reference.
2 – An optimisation operation can be carried out by setting all values in the dialogue box to
zero (for the respective option). Adjust the value for any one criterion until a break-even IRR
(ie, zero) is obtained. The actual total benefit to provide this break-even value can then be
assessed to determine if the combined benefits can be justified and whether they are
realistic.
CR-2004/47: SuperSurf User Manual
Economic Analysis
3-1
3.
USING SUPERSURF
3.1
Loading SuperSurf
On your software disk, you will see an Excel workbook titled SuperSurf.xls. Copy this to your
hard disk in an appropriate directory. When you open this you will get a message indicating
that the programme contains Macros – click on Enable Macros and the following screen will
appear (it is important to ensure that the macro security level (tools/macros/security) is set to
medium for successful operation of the software):
You are presented with a page that looks like a regular spread sheet, with a couple of
significant differences. This first page is the main Results page for SuperSurf, and presents
a table across the middle, which contains the results from the other pages. If the screen does
not look like this, click on the Results Tab in the lower left-hand corner of the worksheet and
this screen will appear.
3.2
Results page
On the results page are some inputs that control global options for the analysis, which are
controlled through the Setup button. These options are:
CR-2004/47: SuperSurf User Manual
Using SuperSurf
3-2
Analysis title
The analysis title is the description of the project (usually the road number), identifying
the specific project. It is useful to save the Workbook under this title if a number of
analyses are to be carried out on different roads for easy identification at a later date.
Base year
This is the base year in which calculations are to be performed. Normally this is the
current year. SuperSurf assumes that any decisions based on the results of the
analysis will be implemented in the following year. By definition this year must be the
same for all analysis options.
Analysis period
This is the number of years over which the analysis is performed. For roads projects it
is traditional to consider the costs associated with all of the alternatives over the same
number of years. This option need not be the same for all options, but it is difficult to
imagine scenarios where this would need to be different. In SuperSurf the maximum
analysis period is limited to 40 years. In most cases where people wish to use
different analysis periods for different alternatives they have misunderstood the
concepts involved.
Discount rate
As explained above, this option determines the time value of money. See section 2.3
for more details on this value. By definition this value must be the same for all analysis
options.
Section length
SuperSurf normally performs all of the calculations on a one-kilometre section, as most
studies will be on existing sections of road. However, this option allows one to scale
the various values for alternatives to longer sections where several alternative routes
of different length might need to be considered. The full length of the road can be used
to determine the actual total costs/benefits of the various options. When determining
social and environmental benefits, these need to be estimated per kilometre per year.
Inflation rate
The road user cost and accident data used in the economic analysis is the most recent
available but requires updating to allow for inflation. For this purpose, the facility exists
to state the average inflation rate over the previous 3 or 4 years.
Exchange rate
Although all of the user cost data in SuperSurf is in South African Rands (ZAR), the
spreadsheet automatically adjusts this to the users currency, making it easy to use
outside South Africa. This requires that the researched values are converted to the
local currency, and this input determines the exchange rate used. However, some
caution should be exercised in using SuperSurf outside South Africa, because the
VOC and accident costs are based on South African socio-economic conditions and
may not represent the true costs in other countries, where socio-economic conditions
differ.
CR-2004/47: SuperSurf User Manual
Using SuperSurf
3-3
Although these data can be entered directly in the individual boxes (see 3.4), it is
recommended that they be entered using the buttons as a force of habit to avoid possible
problems when inputting other data.
Once these parameters have been established, the user should then move to the Base page
and proceed to enter the required information there. This information pertains to the road in
its existing condition and represents the status quo (ie, do nothing option), against which the
cost and benefits of any possible new options or alternatives will be compared.
3.3
Base page
The base page is entered by clicking the Base tab in the lower left area of the screen. The
screen displayed should appear as follows:
If a screen similar to that shown does not appear, press the Control and Home keys
simultaneously to ensure that Cell A1 of the worksheet is in the top left corner.
A large number of input values control the economic analysis. These are broken up into
seven main categories, each represented by a button. These include:
•
Set-up for the analysis;
•
Costs of construction and maintenance;
•
Unpaved construction and maintenance alternatives;
CR-2004/47: SuperSurf User Manual
Using SuperSurf
3-4
•
Traffic;
•
Environmental costs and benefits;
•
Paved construction and maintenance alternatives;
•
Social costs and benefits.
The use of these alternatives is discussed in the following sections. Clicking on one of the
buttons on the analysis page accesses each of the groups and brings up a dialogue box,
which allows the user to interact with the settings. Each group has defined default options
base on recent experience and costs, which will be used in the analysis unless the user
makes specific changes. Each of these buttons
The 7 buttons appear on every new screen as options are generated. The Setup, costs,
traffic, environment and social buttons are used for each option. The unpaved button will
usually only be used on the base option, when a dust palliative will be applied or for stage
construction. The paved option will only be used when sealing the road with a bituminous
surfacing is being considered.
The objective of the economic analysis is to compare the costs and benefits of the base
option (status quo) with various alternatives such as dust palliation or upgrading to
bituminous surfaced standard using a range of options, and identifying that option with the
highest internal rate of return.
3.3.1
Set-up
This dialogue box provides access to the most basic settings: The title for the individual
alternative/option, and the years in which geometric realignment, dust palliative application or
paving occur. If these actions are planned, check the relevant boxes on the left and input the
correct years on the right. SuperSurf ensures that the chosen values are within the valid
range for the analysis.
3.3.2
Costs of construction and maintenance
The inputs through the unpaved and paved buttons determine the performance of the road,
and when actions need to be taken. For the economic analysis procedure, these actions
must be converted into costs. In SuperSurf the costs are all input via a single dialogue box,
with three tabbed pages, which appears when the Costs button is clicked. These are for the
construction and maintenance costs of an unpaved phase, a dust palliative phase and a
paved phase and appear as follows:
CR-2004/47: SuperSurf User Manual
Using SuperSurf
3-5
Unpaved
Realignment describes the geometric realignment of an unpaved road (eg, straightening of
sharp curves to improve safety), and is thus limited to the period in which the road is
unpaved. The cost is a lump sum per kilometre. Because on most roads this implies a fairly
major change to most elements of the road surface a regravelling operation is automatically
triggered, regardless of the remaining depth of gravel. In most instances, realignment would
be scheduled at the same time as regravelling.
The gravel cost and (grader) blading costs apply whether there is a dust palliative present or
not, although the dust palliative will affect the frequency of these operations. The cost of
gravel is per cubic metre, and the cost of blading per metre width per kilometre. There is also
an additional routine other or fixed annual cost per kilometre, which would be for actions such
as drainage maintenance, grass cutting and other minor repairs such as spot regravelling of
severe potholes.
Dust palliative
The cost of the dust palliative is in addition to the other costs associated with a gravel road.
There is an initial cost, because the first application of a dust palliative often requires some
additional construction work, and then there is the cost of purchasing the dust palliative itself,
which is determined per square metre. SuperSurf assumes that the dust palliative requires
an annual (or more frequent) rejuvenation to be effective. If this is not the case, the cost
should be reduced accordingly.
Paved
There are four costs for paved roads:
CR-2004/47: SuperSurf User Manual
Using SuperSurf
3-6
•
an initial construction cost, per kilometre;
•
overlay costs, per square metre (see section 3.3.7 for details on this activity);
•
reseal costs, per square metre (see section 3.3.7 for details on this activity), and
•
an annual routine maintenance cost.
While the costs of construction and major maintenance work is fairly easy to establish, there
is not much information available on routine maintenance costs. Where possible, local
experience should be used to judge this figure. The volume and cost of routine surface
maintenance will increase as the road ages and the figure input should thus represent the
expected annual average between reseals.
Shadow costs and component allocations
Shadow costs are used in the determination of the vehicle operating costs. These are the
market costs minus indirect taxes plus subsidies. The facility has also been included to make
use of shadow costs of labour and materials during construction and maintenance in the
analyses. The shadow cost facility allows apportionment of various percentages of the total
costs (as a shadow cost) of the labour and materials. The total cost can thus be reduced by
the specified value, ie, a shadow cost for labour of 25 per cent will reduce the labour
component of the overall cost by 25 per cent.. This is developed in conjunction with the
component allocations or apportionment where the component percentages of the inputs are
broken down in terms of the labour and materials. This is considered relevant in terms of the
Expanded Public Works Programme (EPWP) currently being implemented where labourbased operations will be maximised and is particularly appropriate in areas of high
unemployment, where the shadow cost of labour is realistically far less than the actual cost,
ie, the alternative is unemployment.
3.3.3
Traffic
On clicking the Traffic button, the following dialogue box appears:
CR-2004/47: SuperSurf User Manual
Using SuperSurf
3-7
Traffic is a major factor in any economic analysis of roads projects, so it is important that the
input data reflect reality as far as possible. SuperSurf uses a traditional traffic growth model
that relies on an initial traffic count, and a fixed annual growth rate. The traffic is split into six
types of vehicle: cars, taxis and light delivery vehicles (LDV), which are together considered
Light vehicles, and buses and light and heavy goods vehicles, which are classed as Heavy
vehicles. Different vehicle operating costs are applicable to each of the classes. The year of
the traffic count and the total daily traffic must be entered. Depending on how the data was
collected, traffic can either be entered as percentage splits, or as average annual vehicle per
day counts by clicking the Split or VPD options on the screen,.
There are three percentage growth values.
•
The annual Growth rate reflects a year on year increase in traffic.
•
Initial growth reflects growth in the Base Year (often a road is being upgraded
because of some new facility, such as a hospital, and this will generate traffic over
and above the measured traffic), and
•
Paved growth which reflects the possible increase in traffic in the year when the road
is paved, are also provided to refine the traffic growth values. This equates closely
with traditional diverted traffic.
Because of the compound nature of the traffic growth model, it can sometimes result in large
vehicle counts, especially if the analysis period is long. SuperSurf therefore provides upper
limits for the unpaved and paved road traffic capacities. These are accessed via the
Unpaved and Paved dialogue boxes.
Because paved road performance depends more on vehicle mass than on actual axle count,
the traffic on a paved road needs to be converted into ESALs (Equivalent Standard Axle
Loads). For each of the three vehicle types an average ESAL value per vehicle can also be
CR-2004/47: SuperSurf User Manual
Using SuperSurf
3-8
entered. It is important that these ESAL values represent the average equivalent damage
caused, so if there is considerable overloading, one must convert the distribution of
measured axle loads to ESALs before averaging.
3.3.4
Environment
Clicking on the Environment button will result in the following dialogue box relating to
environmental costs:
Environmental costs are difficult to quantify, and therefore can prove difficult to incorporate
into an analysis such as that performed by SuperSurf. For this reason a very flexible
structure has been included, which allows the user to attach environmental costs or benefits
to each action which might take place during the design life of the road. These actions have
all been covered in the preceding sections, so only a short explanation of their timing is given
here.
While the road is unpaved it can be realigned. This occurs at the time given in the basic setup. The road is also periodically regravelled and bladed. Different environmental costs can
be defined depending on whether the road has a dust palliative or not. If a dust palliative is
applied then it is also rejuvenated periodically. When the road is paved there can be
environmental costs at the time of construction and also at each reseal or overlay.
In addition to these activity related costs or benefits per vehicle and an annual cost or benefit
can also be defined, depending on the type of surfacing. It should be remembered that these
are per kilometre of road and should be apportioned appropriately, depending on the actual
length of the road.
Environmental costs are incorporated as negative values and benefits as positive values in
the dialogue boxes.
CR-2004/47: SuperSurf User Manual
Using SuperSurf
3-9
3.3.5
Social
The Social button provides the facility to incorporate social benefits (and possibly costs) into
the analysis through the following dialogue box:
Social benefits have been included in this model and include aspects such as:
•
Direct job/employment creation as a result of road construction and maintenance
opportunities
•
Improved quality of life related to accessibility, particularly to health and education
facilities
•
The opportunity costs related to possible investment, expansion of existing and
development of new businesses and/or industries
•
Less dust in the community
•
Road safety including pedestrian, non-motorised transport and animal
•
Other benefits such as improved transportation of local produce
•
Fixed benefits – it may be more convenient, for example, to place a fixed value on
the benefits based on the population of the community and the frequency of
transportation use or some such parameter. As for the environmental costs, it must
be noted that these are per kilometre of road and need to be apportioned
appropriately based on the actual road length.
Aspects such as improved drainage in the urban environment accompanying a paved
pavement design (based on experience of the engineer) will lead to less standing/stagnant
water compared with typical V-drains associated with unpaved roads. The associated health
benefits would have a value that can be included in the social benefits.
CR-2004/47: SuperSurf User Manual
Using SuperSurf
3-10
Social costs are seldom encountered, although aspects such as higher speeds (and the
associated possible negative safety impacts) in populated areas and possible increased
transmission of HIV/AIDS could be considered as potential costs. Social benefits are input in
the Social dialogue box as positive values and costs as negative values. These are
automatically reversed when used in the analysis.
3.3.6
Unpaved
Clicking the Unpaved dialogue box allows one to set the engineering parameters for
unpaved roads. The following dialogue box for Unpaved Road Properties should appear on
the screen:
There are five different groups of inputs.
•
The required/design gravel thickness, and the remaining thickness. These define the
nominal layer thickness of the imported gravel layer for any regravelling operation,
and the thickness of the existing layer in the Base Year. SuperSurf uses a statistical
model to determine annual gravel loss and each year that the total thickness of
gravel lost exceeds the remaining layer thickness it triggers a regravelling operation.
The cost of this operation is dependent on the width of the road and the thickness of
the layer, because the gravel cost is determined in cubic metres.
•
The second group covers grader maintenance, which entails maintaining the shape
of the road, redistribution of the gravel and removal of corrugations and other surface
irregularities. SuperSurf uses a statistical model that determines how often the road
needs to be bladed. This model depends on a ‘trigger roughness’ in International
Roughness Index (IRI) units (required as input), which is the maximum roughness
that the agency or users are willing to tolerate on that road. For higher trafficked
roads the predicted blading frequency may be excessive but there is a practical limit
to how often it is feasible to blade the road. When the required blading interval drops
below the allowed minimum (required input), the roughness of the road will increase
CR-2004/47: SuperSurf User Manual
Using SuperSurf
3-11
above the trigger roughness level, and cause a significant increase in vehicle
operating costs.
•
The material properties determine how quickly the gravel is lost and road roughness
increases. These parameters are defined in TRH201, which the user should consult
if a better understanding of the factors that affect gravel performance is desired. The
six parameters required are the percentage passing the 26 mm sieve (P26); the
percentage passing the 0.075 mm sieve (P075); the maximum aggregate size
determined in the laboratory, ie, the smallest sieve through which 100 per cent of the
material passes (LABMAX, in millimetres); the plastic limit (PL); the ratio of
percentage material passing the 0.075 mm sieve to that passing the 0.425 mm sieve
(dust ratio - DR), and the grading modulus (GM).
•
The climate also plays a role in gravel performance, and is classified by Weinert’s Nvalue2, and the moisture region. The models in TRH201 use a parameter that is 1 in
the wet season and 0 in the dry season, to show seasonal variations in grading
requirements. However, for an annual model, such as is used in SuperSurf, this is 1
(Wet), 0.5 (Mild) or 0 (Dry), depending on the region and geographic location of the
road (e.g. roads in valleys are likely to be wetter than roads on hill tops). Normally a
‘Mild’ value should be used.
•
Finally, the maximum traffic capacity limits the growth of traffic on the road, and the
width determines the extent and hence cost of regravelling and blading.
It will be noted that the terrain does not appear in any of the models or calculations in this
software. Although terrain (rise and fall and horizontal curvature) has been used in various
similar but more complex models, the techniques used in this software make no use of it,
primarily as this software is a comparative analysis and not a prioritisation process. The
terrain affects all alternatives (not necessarily equally), but the vehicle operating costs used in
the models are based solely on road roughness.
3.3.7
Paved
Clicking the Paved button opens the Paved Road Properties dialogue box, which should
appear as follows:
CR-2004/47: SuperSurf User Manual
Using SuperSurf
3-12
The SuperSurf performance model for paved roads is a fairly simple model. This is because
there are few functional performance models available for paved roads, and these generally
require far more advanced software to perform their calculations. The model used in
SuperSurf is a simple exponential curve deterioration model, where the pavement starts at
some initial roughness, and then becomes progressively worse until it passes some failure
roughness. This model is similar to most models used in Pavement Management Systems
(PMS), with the exception that many of these use a more general measure of performance
than just roughness. Roughness has been used as the basis for the modelling as this
property has the greatest impact on road user costs, the dominant factor analysed in this type
of economic model.
The model is tuned by four input parameters, for which this dialogue box provides controls.
The two roughness parameters are the design or Initial roughness of the pavement, and the
Failure roughness. The initial roughness is a relatively standard value, although for certain
seals and for labour based construction it may be higher. The failure roughness is also a
relatively standard value, but on lower traffic roads might be increased. The other main
parameter is the Design Life, which is the number of Equivalent Standard Axle Loads
(ESALs) to failure. This is based on the design selected for the pavement. Since an overlay
is unlikely to perform in the same manner as the original pavement, there is also an Overlay
Life input, which determines the time taken for the overlay to fail. The fourth parameter in the
model is the slope of the curve. In SuperSurf this is set at 2 (a parabolic curve), and cannot
be changed.
An additional decision that needs to be taken is the number of ‘reseals’ or holding actions that
will be implemented before the road needs to be overlaid, or reconstructed (the strategy in
the dialogue box). These actions do not improve the roughness of the road, but slow its rate
of deterioration. Figure 3.1 shows the performance curves for no reseal, one and two
reseals. The terminology of ‘reseal’ and ‘overlay’ is used within SuperSurf for ease of use. In
practice the ‘reseals’ may be a rejuvenator or other holding action, and the ‘overlay’ might
actually be a reseal, or an in-place recycling operation.
CR-2004/47: SuperSurf User Manual
Using SuperSurf
Roughness
3-13
No reseal
2 reseals
1 reseal
Failure
Initial Performance
Overlay
Initial
Design Life
Overlay Life
ESALs
Figure 3-1: SuperSurf paved road performance model
Once again, the maximum traffic capacity limits the growth of traffic on the road, and the
width influences the cost of reseal and overlay operations.
3.4
Calculations
All calculations are carried out immediately after entering any new data. When data has been
entered into the Base and any Options worksheets the results will be available immediately
on the Results page. These need to be saved using the standard Excel techniques (Control
S, the Save icon or Save in the File menu).
3.5
Changing options
3.5.1
Adding new options
To add a new option or alternative simply return to the Results page and click on the Add
New Option button. Up to 12 options can be analysed. This will add a new page to the
spreadsheet and present you with a series of dialogue boxes, as discussed above, to input
the various parameters to control the analysis. On each dialogue box one can click on Use
Defaults, which will use the same values as the Base page. Otherwise, new parameters can
be input. A new line is also added to the results table, which displays the results determined
for the new alternative.
Typically, options such as the application of a dust palliative, stage construction through
unpaved, dust palliative and then bituminous surfacing, direct upgrading using various
pavement structures and/or surfacing alternatives would be compared with the base option.
The internal rate of return of each option is then calculated and added to the results page.
3.5.2
Deleting options
Old or unneeded alternatives can also be deleted by clicking on Delete Option and then
selecting the alternative to be deleted.
CR-2004/47: SuperSurf User Manual
Using SuperSurf
3-14
3.6
Advanced use
Although SuperSurf provides dialogue boxes where the user can input all of the data above, it
is also possible to edit the cells containing this data directly by scrolling to the right of the
standard view. SuperSurf uses colour coded cells to show what kind of data a cell contains.
3.7
•
Cells with a blue background are global options, and affect the entire analysis.
•
Cells with a green background are researched values and cannot be changed.
•
Cells with a yellow background are options that can be edited, and affect the current
page.
•
Cells with a light grey background contain calculated input values, and cannot be
changed.
•
On pages other than the Base page, nearly all of the inputs use default values from
the base page, and so are grey. To change these, first select the correct dialogue
box and enter option specific input values. The cells will then be changed to yellow
editable cells.
•
White backgrounds indicate general calculation cells
•
Purple backgrounds indicate final results.
•
If the value in a particular cell depends on a number of factors, it is possible to add a
page to the spreadsheet and insert your own calculations, and then insert a reference
to the calculated input values. Because of the design of Excel® it is also possible to
refer to other spreadsheets, and even to databases and other document types.
These procedures are beyond the scope of this package.
Printing Results
Typically, it is only necessary to print the results page. This has been formatted to print on
one landscape format page directly from the printer icon or from Print in the File Menu. If it is
required to print the base or options pages or any of the working areas, these can be blocked
and printed as would be done for any Excel worksheet.
3.8
Saving Analyses
It is recommended that each analysis is saved by renaming SuperSurf.xls using a project or
road number in order to retain the analysis and more readily locate the workbooks for later
reference.
3.9
Sensitivity Analyses
Because of the subjective nature of economic analyses and the assumptions involved, it is
very useful (if not essential) to carry out sensitivity analyses to investigate the effects of
CR-2004/47: SuperSurf User Manual
Using SuperSurf
3-15
specific inputs on the results. Particular properties that can easily be modified and the data
rerun are traffic, discount rate and construction costs. This allows a significantly better
understanding of the impact of incorrect assumptions on the overall result.
CR-2004/47: SuperSurf User Manual
Using SuperSurf
4-1
4.
WORKED EXAMPLE
In this section, the input and interpretation of a typical project is provided to assist with use of
the software.
The project:
An existing unpaved road that becomes impassable during severe rainstorms and links a
community of 1000 residents to a main interurban road 5 km away, has been identified for a
possible upgrade.
Various options for upgrading are being investigated. These include:
•
Application of a dust palliative
•
In situ stabilization and surfacing with a double sand seal
•
Importation of a selected subbase and base and application of a double seal
The analysis requires a routine thinking process and is provided as an example below,
proceeding as follows:
1. Open the SuperSurf spreadsheet and click on the Setup button. Make the necessary
modifications on this screen (analysis period (20 years) and discount rate (8%)). Click OK.
CR-2004/47: SuperSurf User Manual
Worked Example
4-2
2. Click on the Base tab at the bottom of the worksheet and the base page will appear. This
information is for the existing situation and the only information that needs to be entered
pertains to the costs and performance of the existing road and the traffic. Nothing needs
to be changed in the Setup dialogue box. Click on the Costs button.
Input the costs of gravel, blading and any other routine costs as requested. No realignment is
usually required in the base case. If realignment is considered, a separate alternative (option)
should be generated. The other costs include aspects such as regular spot regravelling or
pothole filling, localised stone removal, etc. The shadow and component costs screens can
be accessed to allow for labour-based operations and to apportion shadow costs to specific
components of the project.
For the base case, only the unpaved tab is necessary on the shadow costs menu and for the
component costs, only the regravelling, blading and unpaved maintenance screens need be
accessed. The selected percentages can be put in directly, changed by clicking the arrows at
the beginning and end of the bar or by dragging the pointer along the bar as illustrated in the
following two figures. The result is that, in the example, the total labour cost (40 per cent of
the overall cost) is reduced by 25 per cent (the shadow cost).
CR-2004/47: SuperSurf User Manual
Worked Example
4-3
Clicking on the Unpaved button will then open the following screen, into which the properties
and parameters predicting the performance and necessary maintenance actions can be
entered.
3. The screen will move to the traffic as shown below. The data can be entered directly into
this screen.
CR-2004/47: SuperSurf User Manual
Worked Example
4-4
4. As the unpaved road has various negative environmental impacts (costs), click on
Environmental Costs and input the relevant data. In this case, an environmental cost of
R2000 per km is attributed to the use of a non-renewable resource, R100/km is
associated with dust produced during blading, a cost of R1.00 per vehicle is attributed to
dust generation and a fixed cost of R500 per year is allocated for silting and pollution of
water courses resulting from erosion of the road surface.
5. As the existing case has no social benefits there would be no need to click on the Social
benefits button. If a strategy change were made, for instance to use labour for the road
maintenance, an amount could perhaps be allocated to job creation.
6. This is all the information that is required for the Base case. The information put into this
worksheet will then be used to calculate the total agency and economic costs for the base
option. The data pertinent to any alternative is then entered after clicking on the Add
Option button on the results page.
CR-2004/47: SuperSurf User Manual
Worked Example
4-5
7. A new worksheet will be created (under the name put into the title line in the Setup for this
sheet. The screens following this will be similar to those for the base option, but aspects
related to the type of alternative (dust-palliative, paved, etc) will be required.
8. For the proposed dust palliative alternative the following data would be entered in the
respective screens, which will appear automatically following each other.
Setup screen: Add dust palliative title, click dust palliative box and enter year of
application. Click OK
Traffic screen: The same screen as the base case will appear. No change is probably
necessary, unless it is expected that the dust palliative option will attract traffic, in
which case an initial growth figure would be entered.
Unpaved properties screen: If the existing material or material from the same borrow
pit is to be used, no change is necessary. If a new borrow material is to be treated, the
material properties must be changed to the new ones.
Click OK and the paved properties dialogue box will appear. This is not required for
this option and will be skipped by Clicking OK.
Costs dialogue box: Click on the dust palliative tag and the initial construction cost and
dust palliative boxes will appear. The input in the construction cost box will include the
full cost of either ripping and recompaction of the layer or construction of the new layer
with the dust suppressant chemical. In addition to this the annual cost of rejuvenation
(chemical and spray facility) needs to be included. This requires engineers input to
determine the average annual rejuvenation requirement. The facility for shadow costs
and component costs related to these activities (labour based application is a viable
alternative) exists. Click OK.
Environmental costs dialogue box: If the dust palliative is effective, the cost per
vehicle will be zero. The fixed cost per year will decrease as a result of some erosion
protection but the regravelling and blading costs would probably not change. The
actual maintenance and regravelling required will decrease, but this is determined by
the software based on many field trials and must not be included manually. Other
aspects such as pollution resulting from specific dust palliatives or benefits resulting
from the use of a waste product as a dust palliative (negative cost) can be included if
relevant. Click OK.
Social benefits: Social benefits accruing from the addition of the dust palliative would
be entered now. These include aspects such as improved accessibility, better quality
of life for communities, job creation, better access to markets, larger agricultural yields,
etc. It should be noted that the reduction of dust is taken into account in the
environmental side, by reducing the cost from the base case to zero in the dust
palliative case. There may, however, be an additional social benefit related to no dust
adjacent to schools or hospitals. Improved safety within communities living adjacent to
roads (including children, animals and non motorised) would also be included.
Entering the following input values will result in the final screen.
CR-2004/47: SuperSurf User Manual
Worked Example
4-6
Input parameter values
Construction cost
Annual rejuvenation
Cost
R45 000
R2.25/m2
Environmental costs
Construction (material and plant emissions)
R2000
Rejuvenation (Plant and possible pollution)
R100
Fixed cost per year (runoff into streams of dust palliative)
R250
Social benefits
Job creation
R500
Quality of life
R500
Opportunity cost
Dust
Safety
Trigger roughness decreased over base case
CR-2004/47: SuperSurf User Manual
0
R100
R1000
IRI 9 instead of 10
Worked Example
4-7
9. Steps 6, 7 and 8 are repeated for each of the paved options.
10. For an innovative pavement constructed using a local high quality gravel as a base and
surfaced with a low cost seal (double sand seal) costing R200000, the following input data
would be used:
Input parameter values
Construction cost
Cost
R200 000
Overlay cost
R20.00/m2
Reseal cost
R10.00/m2
Maintenance cost
R5500
Environmental
Construction (material and plant emissions)
R3000
Overlay
R500
Reseal
R500
Fixed cost per year (runoff into streams of dust palliative)
R50
Social Benefits
Job creation
R500
Quality of life
R500
Opportunity cost
Dust
Safety
R2000
R100
R1000
The corresponding screen would show as follows:
CR-2004/47: SuperSurf User Manual
Worked Example
4-8
11. For a conventional paved road (imported subbase and base and a double seal) the
following input data was used to produce the following results screen:
CR-2004/47: SuperSurf User Manual
Worked Example
4-9
Input parameter values
Construction cost
Cost
R1 000 000
Overlay cost
R20.00/m2
Reseal cost
R8.00/m2
Maintenance cost
R4500
Environmental
Construction (material and plant emissions)
R5000
Overlay
R500
Reseal
R500
Fixed cost per year (runoff into streams of dust palliative)
R50
Social Benefits
Job creation
R500
Quality of life
R500
Opportunity cost
Dust
Safety
CR-2004/47: SuperSurf User Manual
R2000
R100
R1000
Worked Example
4-10
12. The results of the analyses for each option are summarised as shown above. For the
dust palliative option an Internal Rate of Return (IRR) of 1.9 % is shown, indicating that
the dust palliative option is slightly more beneficial in terms of life cycle economic costs. It
would however, cost the agency considerably more than the base option. The innovative
pavement option shows an IRR of 52.3 per cent and the conventional pavement, an IRR
of 7.8 per cent, slightly better than the dust palliative.
13. On this basis, the innovative pavement would be the most cost effective option in terms of
total life cycle costs, although it would initially cost the road authority slightly more than
either the dust palliative or base options.
It must be remembered that the analysis has been carried out for a one km section of the
road. The section length could, of course, have been set at 5 km on the initial Results screen.
CR-2004/47: SuperSurf User Manual
Worked Example
5-1
5.
REFERENCES
1.
The structural design, construction and maintenance of unpaved roads. 1990. Pretoria:
Department of Transport. (Technical Recommendations for Highways; Draft TRH 20).
2.
WEINERT, HH. 1980. The natural road construction materials of southern Africa.
Pretoria: Academica.
CR-2004/47: SuperSurf User Manual
References