1
AN ABSTRACT OF THE THESIS OF
Emily Darchuk for the degree of Master of Science in Food Science and
Technology presented on May 19, 2015.
Title: Impact of Industry Hauling Practices on Raw Milk Quality in a
Commercial Setting
Abstract approved:
______________________________________________________
Lisbeth Goddik
Hauling is a critical part of the commercial milk supply chain, yet very few
studies have aimed to understand its impact on raw milk quality. Consolidation of the
American milk industry has led to the use of tanker trucks for up to 24 h between
cleanings, which is the maximum duration permitted by the Pasteurized Milk Ordinance
(PMO). As the extended use of tankers has not been previously studied, the impact of
this form of hauling on raw milk quality is unknown.
This study focused on the impact on raw milk quality during both short distance
and high frequency hauling (up to 9 loads per 24 h) as well as long distance and low
frequency hauling (2 loads per 24 h) situations at a commercial facility. Standard tanker
use, (cleaned-in-place (CIP) once per 24 h) served as our control and incremental
cleaning treatments were added to the study to understand if any impact could be
mitigated by more frequent cleaning. Producer samples were collected from the farm
prior to loading milk into the tanker as well as sampling the same milk directly out of the
tanker truck prior to unloading at the manufacturer. The study was repeated at
multiple facilities in both warm and cool months to understand any impact due to the
facility or season. Milk quality was quantified through industry relevant microbiological
tests: individual bacteria count (IBC), thermophillic spore count (TSC), and preliminary
incubation count (PI).
Within the study we defined a negative impact on milk quality as a statistically
significant difference between the tanker and producer samples in any of the three
microbial tests conducted. Results from the study showed no clear impact due to
hauling in IBC, TSC, or PI counts. This result was consistent across all studies and
locations suggesting that hauling does not have a measurable impact on milk quality
regardless of the frequency of truck use. As we did not see a negative impact on milk
quality due to basic hauling practices (24 h CIP), the addition of cleaning treatments did
not appear to provide any benefit.
Tanker surface swabs and ATP swabs were also used to monitor tanker
sanitation and the efficacy of cleaning treatments. Both surface and ATP swabs
revealed differences between cleaning efficacy at the facilities. Although the
differences in efficacy did not influence tanker milk quality within our study, variability
in sanitation may provide a source of contamination that could negatively impact raw
milk quality in other quality attributes not measured.
Based on this study, the current PMO regulation requiring a CIP every 24 h
appears to be effective in mitigating any measurable impact on raw milk quality in both
short and long haul situations.
©Copyright by Emily Darchuk
May 19, 2015
All Rights Reserved
Impact of Industry Hauling Practices on Raw Milk Quality in a Commercial Setting
by
Emily Darchuk
A THESIS
submitted to
Oregon State University
in partial fulfillment of
the requirements for the
degree of
Master of Science
Presented May 19, 2015
Commencement June 2015
Master of Science thesis of Emily Darchuk presented on: May 19, 2015
APPROVED:
Major Professor, Food Science and Technology
Head of the Department, Food Science and Technology
Dean of the Graduate School
I understand that my thesis will become part of the permanent collection of Oregon
State University libraries. My signature below authorizes release of my thesis to any
reader upon request.
Emily Darchuk, Author
ACKNOWLEDGEMENTS
I’d like to thank Dr. Lisbeth Goddik, Dr. Joy Waite-Cusic and Gina
Shellhammer for their support, guidance and most importantly their mentorship. I have
grown from working with them and the strong examples they have set for me.
On a personal note, I’d like to thank my mom, dad and James for their
support and belief in me and my goals. I’d also like to thank Iggy and all of my friends for
helping me to explore and discover what a wonderful place Oregon is.
Finally, I’d like to give sincere thanks to the Washington State Dairy
Products Commission who funded this research as well as everyone at our corporate
sponsor company, hauling company, and student helpers for making my research not
only possible but a fun experience.
CONTRIBUTION OF AUTHORS
Dr. Lisbeth Goddik and Dr. Joy Waite-Cusic assisted with the interpretation of the
data and are co-authors of chapter 3 and 4. Gina Shellhammer acted as a contract
statistician and contributed to the development of the statistical design as well as
the analysis of the data presented in chapter 3. Dr. Hui Feng, Tomomi Fujimaru,
Danny Dupree and Christopher Baird assisted with the data collection and sample
analysis during both studies.
TABLE OF CONTENTS
1
2
Page
Chapter 1 - Introduction ............................................................................................. 1
1.1
Research Problem ............................................................................................... 1
1.1
Research Objectives ............................................................................................ 3
Chapter 2 – Milk Hauling Overview ............................................................................ 4
2.1
Milk Industry Background ................................................................................... 4
2.2
Hauling Regulations ............................................................................................ 5
2.3
Tanker Truck Design ............................................................................................ 6
2.3.1
Tanker Engineering ......................................................................................... 7
2.3.2
Tanker Sanitation Concerns .......................................................................... 10
2.3.3
Tanker Cleaning............................................................................................. 11
2.3.4
Tanker Design Summary ............................................................................... 12
2.4
3
Appendix ........................................................................................................... 14
Chapter 3- Short Distance and High Frequency Tanker Use Study ........................... 20
3.1
Abstract ............................................................................................................. 21
3.2
Introduction ...................................................................................................... 23
3.3
Material and Methods ...................................................................................... 24
3.3.1
Sample Analysis............................................................................................. 27
3.3.2
Statistical Modeling....................................................................................... 28
TABLE OF CONTENTS (Continued)
4
5
3.4
Page
Results ............................................................................................................... 29
3.5
Discussion.......................................................................................................... 31
3.6
Conclusion ......................................................................................................... 37
3.7
Acknowledgements........................................................................................... 37
3.8
Appendix ........................................................................................................... 39
Chapter 4-Long Distance and Low Frequency Tanker Use Study ............................. 47
4.1
Abstract ............................................................................................................. 48
4.2
Introduction ...................................................................................................... 50
4.3
Material and Methods ...................................................................................... 50
4.4
Results ............................................................................................................... 54
4.5
Discussion.......................................................................................................... 54
4.6
Study Summary ................................................................................................. 56
4.7
Acknowledgements........................................................................................... 56
4.8
Appendix ........................................................................................................... 58
Chapter 5- Conclusion ............................................................................................... 62
5.1
Research Summary ........................................................................................... 62
5.2 Future Work and Opportunities .............................................................................. 63
Bibliography ...................................................................................................................... 64
Appendices........................................................................................................................ 68
LIST OF FIGURES
Figure
Page
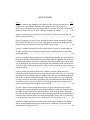
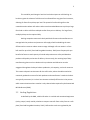
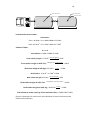
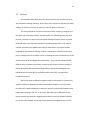
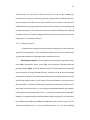
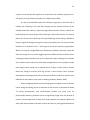
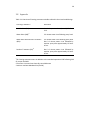
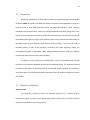
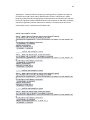
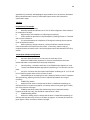
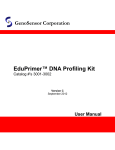
Figure 2.1 Heat transfer based on a cold tanker of milk at moving and stationary
conditions in warm weather. Calculations provided as a worst case scenario to
demonstrate the efficacy of the insulating effect of the tanker truck over a 24 h period.
Based on properties of dry air chart- Table A.4.A (Singh et al., 2008) ............................. 15
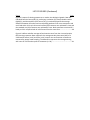
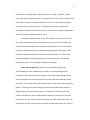
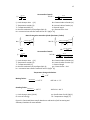
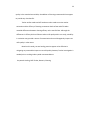
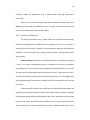
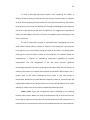
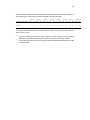
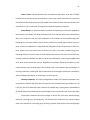
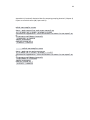
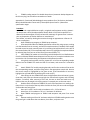
Figure 2.2 Dimensions of a tanker truck and calculations of internal surface area and
tanker load out efficiency ................................................................................................. 18
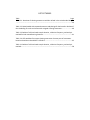
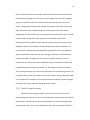
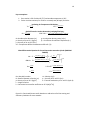
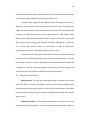
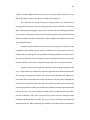
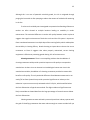
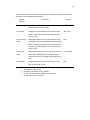
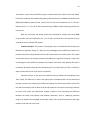
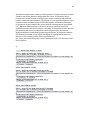
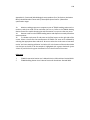
Figure 2.3 Diagram of a Tanker Truck; although all pipes are cleaned during a CIP wash
the red pipes are specific to the CIP cycle, blue pipes are used for milk loading and the
purple lines are shared and consist of the flexible transfer hoses. .................................. 19
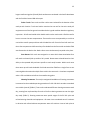
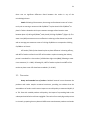
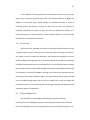
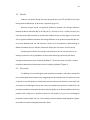
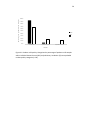
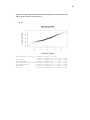
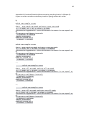
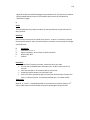
Figure 3.1 Producer milk quality for both study locations: plant A (n= 270) and plant B
(n=178). Categorized as percentage of samples within individual bacterial count (IBC)
quality categories. ............................................................................................................. 43
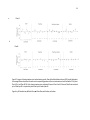
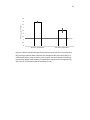
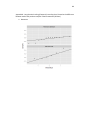
Figure 3.2 Impact of cleaning treatments on tanker bacteria growth. Raw milk individual
bacterial count (IBC) results displayed as the average difference between the tanker and
corresponding producer milk across treatments and each load within 24 h cycle at Plant
A (2.a) and Plant B (2.b). Each cleaning treatment was replicated 4 times at Plant A and
3-4 times at Plant B and contained up to 9 loads per 24 h use period at plant A and up to
8 loads at plant B. ............................................................................................................. 44
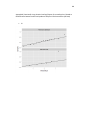
Figure 3.3 Impact of cleaning treatments on tanker PI and TSC growth. Raw milk
preliminary incubation (PI) (3.a, 3.b) and thermophilic spore count (TSC) (3.c, 3.d) results
are displayed as the average difference between the tanker and corresponding producer
milk across treatments and each load within 24 h cycle at Plant A (3.a, 3.c) and Plant B
(3.b, 3.d). At plant A, each cleaning treatment was replicated 4 times and contained up
to 9 loads per 24 h use period. At plant B, each cleaning treatment was replicated 3-4
times and contained up to 8 loads per 24 h use period. .................................................. 45
Figure 3.4 Tanker surface sponge swab results from Plant A and Plant B to measure
cleaning efficacy. Data reported is the average aerobic plate count per swabbed surface
area (900 cm2) of a soiled tanker before and after a water rinse treatment. Averaged
post clean-in-place (CIP) treatment data was included as a benchmark for starting tanker
cleanliness across the duration of the study at both plants. Plant A: CIP n= 26, Rinse Pre
n= 60, Rinse Post n= 60, Plant B: CIP n= 24 Rinse Pre n= 32, Rinse Post n= 32 ................ 46
Figure 4.1 Producer milk quality. Categorized as percentage of producer milk samples
within individual bacterial count (IBC) and preliminary incubation (PI) most probable
number quality categories (n=20)..................................................................................... 59
LIST OF FIGURES (Continued)
Figure
Page
Figure 4.2 Impact of cleaning treatments on tanker microbiological growth. Raw milk
individual bacterial count (IBC) (a), preliminary incubation (PI) most probable number
(MPN) (b), and thermophilic spore count (TSC) (c) results displayed as the average
difference between the tanker and corresponding producer milk across treatments and
each load within 24 h cycle. Rinse and sanitize (RS) treatment was replicated 7 times and
the standard use (SU) treatment was replicated 3 times. Both treatments consisted of 2
loads per 24 h use period with all milk sourced from the same farm. ............................. 60
Figure 4.3 Before and after average surface bacteria count from the rinse and sanitize
(RS) cleaning treatment. Data reported is the average aerobic plate count (APC) of a
soiled tanker before (n=14) and after (n=14) a water rinse and sanitizer treatment as
measured by sponge swab sampling. The dotted line represents the average starting
APC count of a clean tanker post CIP treatment (n= 20). ................................................. 61
LIST OF TABLES
Table
Page
Table 3.1: Overview of cleaning treatment variables utilized in the mixed model design
.......................................................................................................................................... 39
Table 3.2 Mixed model with repeated measure study design for both studies. Outline of
the scheduling of trucks and routes with assigned cleaning treatments ......................... 40
Table 3.3 Outline of milk and swab sample location, collection frequency, and analysis
method for both manufacturing locations ....................................................................... 41
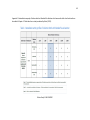
Table 3.4 ATP swab data from post cleaning treatments. Percent pass of treatments
based on cleanliness threshold of <150 RLU2. .................................................................. 42
Table 4.1 Outline of milk and swab sample location, collection frequency, and analysis
method.............................................................................................................................. 58
LIST OF APPENDICES
Appendix
Page
Appendix 1: Neutralization capacity of letheen broth on Mandate Plus Sanitizer which
was used in both short haul studies as described in Chapter 3. Table taken from a study
conducted by Ward ( 2013). ............................................................................................. 69
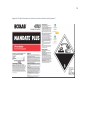
Appendix 2 Product information for Sanitizer used in short duration study (chapter 3). 70
Appendix 3 : PMO Cleaning Regulations (Food and Drug Administration, 2013) ............ 71
Appendix 4 : Plant Training Materials from Short Distance Study (Chapter 3) ................ 72
Appendix 5 : Lab training materials from short and long distance studies (Chapter 3 & 4)
.......................................................................................................................................... 76
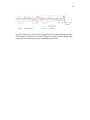
Appendix 6 : Short duration hauling (Chapter 3) normality plots and statistical data.
Winter Study (Plant A) ...................................................................................................... 80
Appendix 7 : Short duration hauling (Chapter 3) normality plots and statistical data.
Summer Study (Plant B) .................................................................................................... 83
Appendix 8 : Long duration hauling (Chapter 4) normality plots. Plotted as the difference
between tanker and producer samples in both treatments (All Data) ............................ 86
Appendix 9 Statistical data for Long duration hauling practices (Chapter 4) impact on
microbial counts (IBC, Spore and PI) over time. Load 1 and Load 2 microbiological
comparison. No significant difference was found between load 1 and 2 within a
treatment. RS= Rinse and Sanitize, SU= Standard Use ..................................................... 89
Appendix 10: Statistical data for cleaning treatments (Chapter 4) impact on microbial
counts (IBC, Spore and PI). Demonstrates if there is a difference in tanker bacteria
growth based on cleaning treatment by comparing load 2 across treatments. No
significant treatment effect found when comparing averaged RS and SU data. Rinse=
Rinse and Sanitize (RS), Control= Standard Use (SU)
91
Appendix 11 : Statistical data for comparing sampling location’s (Chapter 4) impact on
microbial counts (IBC, Spore and PI). Demonstrates if there is a difference in tanker
bacteria growth based by comparing log transformed results of milk taken the front and
back tank. Significant location difference found in RS treatment for IBC and PI. Although
statistically significant practical relevance for industry is unknown. Rinse= Rinse and
Sanitize (RS), Control= Standard Use (SU) Bacto= IBC ...................................................... 92
LIST OF APPENDICES (Continued)
Appendix
Page
Appendix 12 Statistical data comparing sampling location’s (Chapter 4) impact on tanker
sanitation and efficacy based on sponge swabs APC results. a) Comparison of pretreatment APC counts based on sampling location within a treatment and combined
location comparison across treatment (log cfu/900 cm2). No significant difference in pretreatment tanker sanitation found in either tanker location nor between treatments. . 94
Appendix 13 Microbiological test procedures for a) Preliminary Incubation Most
Probable Number Counts and b) Thermophilic Spore Counts and c) Bactoscan
specification ranges. Procedures taken from corporate laboratory SOP. ........................ 96
1
1
Chapter 1 - Introduction
1.1 Research Problem
Due largely to the demand of the export market, domestic dairy volumes have
increased (USDA, 2012, 2014b). 2014 exports accounted for 15.4% of US milk solids
production and were valued at $7.1 billion USD (USDEC, 2015). Although the United States
dairy industry has been actively expanding exports, it is still in close competition with
other dairy exporting countries such as New Zealand, Australia, and the EU (Blayney and
Gehlhar, 2006; FAO et al., 2010; USDA, 2014b). With the goal of continuing to grow
exported volume, milk quality is of increasing importance to the US dairy industry due to
tighter quality specifications and increased competition when selling into a global market.
Specification limits have been historically difficult for domestic producers to
meet, partly due to the added complexity that has resulted from consolidation of the
industry (MacDonald et al., 2007; Ollinger et al., 2005; Watterson et al., 2014). Changes
within the dairy industry over the past 30 years have been drastic. For example,
between 1997 and 2007, there was a 21 percent decrease in the number of milk
processing plants; however because of increased scale, these plants processed 26
percent more milk per facility. During this same period, the number of dairy farms
decreased by 43 percent, yet total yield per farm doubled (USDA, 2014a).
This consolidation has also impacted how milk is hauled from the farm to the
manufacturing plants. Consolidation and price competition has pushed the industry to
improve efficiency and reduce resource usage at every step of the supply chain. An
example of this is tanker usage, historically, tankers were cleaned after every load, but
2
the consolidation of the industry has led to longer routes and more frequent use of
tankers between cleans.
Within the United States, all Grade A dairy products are regulated by the
Pasteurized Milk Ordinance (PMO). As stated in the PMO, milk tanker trucks can be used
repeatedly for a full 24 hours in-between mandated clean-in-place (CIP) treatments (Food
and Drug Administration, 2013). Although individual truck utilization varies, routes
typically involve frequent tanker use, during which each load of milk has a short duration
within a tanker, but a truck sees multiple loads per day, or extended hauls during which
each load of milk has a long interval within a truck but only a few loads can be transported
each 24 h period. Although permitted by the PMO, the multiple use of tankers between
CIP treatments is a new phenomenon for many companies.
The decision on how often to clean tanker trucks beyond regulation is a balance
between efficiency and quality. Within industry, the receiving bays can be a bottle neck
impacting overall plant efficiency. To reduce this, tanker milk rarely undergoes testing
beyond the regulated antibiotic and temperature screenings (Food and Drug
Administration, 2013) prior to transferring into a large co-mingled silo. These silos
contain milk of different ages, from many producers, and hauled under different
conditions, making it impossible to understand if downstream quality issues could be
triggered by the hauling process.
Due to this complexity, very few studies have solely investigated the impact of
hauling, which requires isolating and collecting samples at the point of receiving. To
understand this impact our study investigated hauling by looking at two conditions that
large dairy companies encounter today; long haul loads and high frequency tanker use.
3
1.1 Research Objectives
To understand the impact of frequent use hauling practices on milk
microbiological quality within an industrial setting we investigated i) impact of operating
trucks for extended duration between CIP treatments; ii) impact of incremental cleaning
procedures beyond the standard 24 h CIP, and iii) the differences between manufacturing
facilities.
To understand the impact of long duration hauling practices on raw milk
microbiological quality we investigated; i) the impact of operating trucks for extended
duration between CIP treatments and ii) the impact of incremental water rinse and
sanitizer treatment between loads.
4
2
Chapter 2 – Milk Hauling Overview
Hauling is an important link in the milk supply chain which involves the transfer
of milk from the producing farms to a manufacturer or cooperative. The transportation
of milk occurs within tanker compartments towed by a truck. Although this is a highly
regulated process, variations in procedures and equipment do occur based on scale,
region and hauling company. The process outlined within this thesis is representative of
the conditions and processes that the milk experienced within this study and is
illustrative of the industrialized milk supply chain within the United States. It is also
important to note that all dimensions quoted within this thesis should be assumed to be
realistic estimates that are either based on measurements taken of an actual tanker or
from information provided by hauling industry contacts.
2.1 Milk Industry Background
The US dairy industry has undergone drastic changes over the past few decades.
Milk was previously produced on small farms but consolidation has been influenced by
an economy of scale that has benefited some larger dairy operations. Although this
trend has led to shifts towards larger herd size, the makeup of the dairy industry is
varied and can be regionally dependent. Dairy farms now can contain over 37,000 cows,
but the majority of operations still contain fewer than 100 head (MacDonald et al.,
2007; Charles, 2014). The largest percentage of production comes from farms with over
2,000 head which is also the farm size that has seen the fastest growth (MacDonald et
al., 2007). In 2014, the average herd size was 204 cows which was nearly double the
average herd size just 10 years prior ( Progressive Dairyman, 2015).
5
This variability and change in herd size has had an impact on milk hauling. As
herd sizes grow the volume of milk that can be collected from any given farm increases,
allowing for fewer farm pickups per load. The spread of small and large farms has
created situations where milk tankers either travel extended distances to pick up a large
farm load or collect milk from multiple smaller farms prior to delivery. For large farms,
multiple pickups can be required daily.
Hauling companies must work closely with both farmers and manufacturers to
manage both the producer and processor milk supply all while scheduling the most
efficient tanker routes to reduce resource usage. Although milk can remain in a farm
bulk tank for up to 24 h (Food and Drug Administration, 2013) more frequent pick-ups
benefit the farmer as tank capacity is limited and premiums are often paid based on
producer milk quality at the time of delivery. Concurrently, the receiving bay of dairy
manufacturing plants can be a bottle neck in production and deliveries must be
staggered throughout the day to balance production, silo capacity, and truck resources.
This creates a dynamic environment for the milk hauler, where schedules need to be
constantly updated to account for both producer and manufacturer’s needs. As haulers
are typically contracted, it is in their best interest to identify efficiencies in the process
which create situations where a tanker is only cleaned when required by the Pasteurized
Milk Ordinance (PMO).
2.2 Hauling Regulations
As defined by the PMO, a bulk milk tanker is a vehicle and associated equipment
(tanks, pumps, hoses) used by a hauler to transport raw milk from a dairy farm to a milk
plant (Food and Drug Administration, 2013). Milk tanker trucks are regulated by the
6
PMO and gross vehicle weight (GVW) regulations outlined by each state’s department of
transportation which are based on bridge laws. The PMO regulates the materials and
procedures for the hauling process, whereas the GVW outlines regulations based on
safety and road maintenance concerns. Aside from regulation, configurations, usage
and engineering of milk tankers can vary greatly depending on manufacturer and
hauling company.
Within the Pacific Northwest (Oregon and Washington), both single and double
trailer configured trucks are used to haul milk. Within industry, single compartment
trailers are called tanker tubes whereas the double trailers are referred to as farm
transfer systems (FTS) or double-bottoms (Karpoff and Webster, 1984). Both Oregon
and Washington have the same GVW regulations, limiting a vehicle’s maximum weight
to be no more than 105,500 pounds (FHWA, 2000; ODOT). Aside from the GVW, the
legal operating weight of a truck is determined by the tire size, wheelbase, and number
of axles, which all impact the manufacturer’s design to maximize load efficiency through
reducing truck weight (ODOT; Sharma and Mahoney, 1983; FHWA, 2000). As haulers are
paid partly by how much weight they can haul, the design of milk trucks has been
carefully considered to protect the product while maximizing efficiency.
2.3 Tanker Truck Design
Although the PMO allows some flexibility in the type of material used in the
design of trucks, most tankers are constructed from 300 series AISI stainless steel (Food
and Drug Administration, 2013). Stainless steel is an alloy produced when chromium is
added to iron and carbon to protect the steel from corrosion and oxidation through the
development of a passive layer (Lo et al., 2009; ISSF, 2010) . Within dairy tankers, basic
7
grade 304 stainless steel is commonly used, this material is also referred to as Austenitic
Cr-Ni stainless steel, with a composition of 18%Cr and 9%Ni (ISSF, 2010).
Milk tankers are designed like a Thermos® with a 10 gage metal end cap, 12
gage metal interior tank and an 18 gage exterior shell. The tanker consists of two
cylinders fabricated from stainless steel metal sheets welded around a 1.5 inch
polystyrene core which acts both as support and as an insulator between the internal
and external diameter of the tank. Polystyrene is an extruded foam in which air is
entrapped within the cell structure which provides an insulating effect (Dow Plastics,
2014). For its weight and price, the combination of polystyrene foam and thin gauge 304
stainless steel is very strong, and offers a smooth internal surface that allows for high
efficacy cleaning utilizing clean in place (CIP) systems.
2.3.1 Tanker Engineering
Tanker trucks are designed to protect milk quality as well as transport large
volumes of milk efficiently from a farm to a plant. Understanding how a tanker is
designed is critical to understanding how hauling can impact milk quality. Two areas of
tanker engineering that are critical to milk quality are the rate of heat transfer between
the cold milk and warmer outside temperatures and the quantity of residual milk that
can remain in a truck following delivery.
Tanker insulation efficiency background. To understand the efficacy of an
insulated truck, a heat transfer formula can be used to determine the theoretical
temperature change that can occur during two conditions the truck can encounter while
on a route (Figure 2.1) giving insight into the rate of heat transfer while a truck is
stationary and in motion.
8
When using either of these models we are assuming that the tanker
compartment is full of milk, creating a negligible head space. This is a condition common
in the front compartment as this is filled to capacity prior to transferring milk into the
back trailer. Due to this there is often residual head space in the back compartment, the
volume of which will vary depending on load number and farm size. As the volume of
head space is variable in the back compartment, all calculations were done to estimate
heat transfer of milk in the front compartment. In evaluation of these calculations, it is
important to note the key assumptions made and the understanding that these are
extreme examples of the situations that milk tankers undergo, providing a worst case
scenario estimate into the expected rate of heat transfer.
Assumption one: Milk remains in a tanker continuously for 24 h
Due to industry pressure to maximize use of equipment, hauls typically occur
consecutively, leaving little time for the tanker to sit empty before picking up the next
load. Based on this our calculations assume a tanker is full for the entire 24 h period.
Assumption two: Tankers are continuously in motion or still
Tankers in motion are representative of longer haul situations, during which
trucks travel long distances between deliveries. Trucks in motion experience greater
temperature changes as compared to stationary trucks which would be more
representative of shorter haul situations.
Tanker insulation efficiency calculations. Although some temperature change
occurs over time in insulated tankers; these trucks, even when exposed to very warm
temperatures (35°C), experience little change to the receiving raw milk temperature as
compared to the temperature it was pumped into the truck on the farm (Figure 2.1) .
9
Based on the Churchill-Bernstein Equation (Perry et al., 1997) , a tanker at constant
motion (60 mph) filled with cold milk (5°C) will gain less than 2°C over a 24 h period. This
same tanker in stationary conditions will gain less than 1°C. Per the PMO, all grade A
milk must arrive at the plant under 7°C , allowing for tanker trucks to be used for
extended periods without issue as long as milk is loaded at cold enough temperatures at
the farm (Food and Drug Administration, 2013).
It should be noted that there are also non-insulated areas of the truck such as
the transfer pump hoses located in between the tanks. As there is no insulation, this
area will see elevated temperatures very quickly. Although this is an area of potential
risk for microbial growth the risk is mitigated through purging the hose with air after
pumping to reduce the amount of residual milk remaining in the line. These results
show that regardless of the hauling situation, milk can remain within refrigerated
temperatures over a 24 h use period, limiting bacterial growth.
Tanker load out efficiency. The other aspect of tanker engineering is
understanding how much residual milk can remain in a truck following delivery.
Calculation of the internal surface area (Figure 2.2) provides understanding into the
volume of residual milk that can build up on the walls of the tanker between washes
and cleans. It is this milk, which harbors bacteria that could directly contaminate future
loads or create long term issues through the formation of biofilms. Milk tankers are
weighed coming into and leaving the plant; so tracking the residual milk left in the
tanker is achievable. As milk is pumped from the tanker into the plant, the only milk
remaining in the truck is within a foam which coats the inside surface of the walls. The
formation of this foam can occur from movement of under filled loads or as a result of
10
seal issues in receiving pumps or hoses. This foam creates a thin layer across the surface
of the tank which later collapses back into milk upon transport. Once foam is formed
within a tank, the only way to remove it is with a water or chemical rinse. Typically, the
weight of the residual foam is negligible and even at worst case scenario only a few
gallons of foam remain in the truck (Hauling Contact, 2014). Based on industry data,
typical shrinkage of a load is less than .02% the total weight of a tanker (Industry
Sponsor, 2015). After pumping out a 34,000 kg load of milk there will be less than 10 kg
of milk remaining in a truck. It is this remaining milk that can grow bacteria or form
biofilms, so minimizing the residual milk through a highly effective pumping systems
helps to prevent quality issues within the truck and in downstream product.
2.3.2 Tanker Sanitation Concerns
How a tanker is utilized impacts how favorable the conditions can be for biofilm
formation and thus the potential for quality defects. Milk tankers provide an
opportunistic environment for biofilms to grow due to the surface interface with the milk
and tanker walls, extended periods of time the truck is empty but not clean and the
varying internal surface temperature that can occur when a truck is empty (Donlan, 2002;
Teh et al., 2012). Biofilms are created when a community of bacteria create an
exopolysacharide shell which can protect them from harsh conditions such as CIP
treatments. Once biofilms form they can be difficult to remove and have the potential to
enter the milk plant where they can thrive (Marchand et al., 2012). Thermo-resistant,
enzyme and biofilm forming bacteria have also be isolated from the internal surface of a
dairy tanker, suggesting hauling could be a potential cause of milk quality issues (Teh et
11
al., 2011, 2012, 2013, 2014). Although biofilm formation within a tanker is a concern, the
risk of their development is less likely as compared to other areas of the plant due to the
low temperatures, low shear, and smooth surface area that the raw milk is exposed to
within a tanker truck (Marchand et al., 2012). The risk of development is also managed
through cleaning treatments, but the overall tanker sanitation is only as good as the
cleaning treatments and preventative maintenance that it obtains.
2.3.3 Tanker Cleaning
Milk tanker trucks are required to undergo a CIP treatment after every 24 h of
use but are allowed to be used for multiple loads between washes. Washes are loosely
regulated by the PMO and trucks must display a wash tag on the exterior of each tank
documenting the last time it was cleaned. Within the 24 h period, a truck can be used as
needed to haul the milk from the farm to the plant which may involve long hauls,
frequent use or extended waiting periods during which the tanker is soiled but empty.
The PMO only mandates minimum temperatures and frequency of cleans allowing
manufacturers a great deal of flexibility in their choice of chemicals, pressures and
frequency beyond regulated 24 h CIP treatments (Food and Drug Administration, 2013).
Manufacturers typically work with chemical companies to design a sanitation regime
that meet their quality, cost and efficiency goals. This flexibility allows for plant to plant
variability in cleaning efficacy which can impact day to day sanitation within tanker
trucks that deliver to multiple facilities.
Although the CIP process is regulated, the chemicals used, temperatures met
and pressures achieved vary from plant to plant. To begin the clean, the truck pulls into
the receiving bay and the receiving hose is connected to the plant water supply. During
12
this set up, flow diversions are created so that the water and chemicals will utilize the
perforated CIP pipe (Figure 2.3). This pipe runs the length of the tank and is designed
similarly to a sprinkler system to create pressurized spray reaching all areas of the
tanker. Using a power take off (PTO) to power the pump from the motor of the truck,
water and chemical are pumped through the receiving hose into the first tanker,
washing both the milk transfer pipe as well as the internal surface of the tank. The same
solution travels through the transfer pump hose into the back compartment
simultaneously cleaning both the front and back compartments at the same pressure.
Although a specific CIP procedure is not detailed for tanker trucks in the PMO, it is a
process which is documented and evaluated during inspections from state regulators.
Typical CIP processes involve a water rinse, detergent, and water rinse followed by a
sanitizer treatment. Although tanks and trucks are typically cleaned as a unit it is
important to note that they are three independent pieces of equipment and thus may
have differing conditions based on previous use. CIP temperatures reach upward of
170°F, making cleaning a very resource intensive step of the manufacturing process. CIP
treatments within a facility can make up half of a dairy plants’ energy usage (DMI, 2010)
so it is important for companies to find a balance between cleaning frequently enough
to maintain milk quality while also managing resource usage.
2.3.4 Tanker Design Summary
Evaluation of the design and industry use of the tanker trucks is critical to
understanding the results of our study. The cold conditions maintained by the insulated
tanker helps to substantially slow the bacterial growth in the milk maintaining quality
during transportation. This is further aided by the small amount of residual milk left in
13
the tanker following load out reducing impact on future loads in between cleans. Impact
of residual milk is also reduced through conducting a CIP wash following every 24 h of
use, although variability in CIP practices can create sanitation issues that vary based on
how an individual facility uses and maintains their equipment.
14
2.4 Appendix
15
Figure 2.1 Heat transfer based on a cold tanker of milk at moving and stationary
conditions in warm weather. Calculations provided as a worst case scenario to
demonstrate the efficacy of the insulating effect of the tanker truck over a 24 h period.
Based on properties of dry air chart- Table A.4.A (Singh et al., 2008)
16
Key assumptions:
1. Front tanker is full of cold milk (5°C) and outside temperature is 35°C
2. Tanker is either stationary for 24 hrs or at steady rate (60 mph) for 24 hrs.
Insulating Air Temperature Calculation:
5°C−35°C
15°C =
𝑇 −𝑇
Tair= 𝑖 ∞
2
2
Grashof formula: Used to determine insulating film layer:
𝑑 3 𝜌2 𝑔𝛽∆𝑇
Gr=
𝜇2
2.28 *1010 =
1.733 ∗1.1852 ∗9.81∗3.47∗10−3 ∗(35−5)
(18.044∗10−6 )2
d= Outside tanker diameter (m)
ɡ= Acceleration due to gravity (m/s2)
3
ρ= Density of air at 15°C (kg/m )
β = Co-efficient of volumetric expansion (K-1)
μ =Viscosity of air at 15°C (Pa s)
ΔT = Temperature difference between wall & milk (°C)
Churchill-Bernstein Equation for Forced Convection around a cylinder (MOVING
TANKER)
.62 (𝑅𝑒)1/2 ∗ 𝑃𝑟 1/3
𝑅𝑒
5/8 4/5
Nu = . 3 + [1+(0.4 𝑃𝑟) 2/3 ]1/4 + [1 + (282,000)
838.61= . 3 +
Re =
.62 (2.833∗106 )1/2 ∗ .711/3
[1+(0.4∗.71) 2/3 ]1/4
[1 +
𝜌𝑈𝑏𝐷
𝜇
2.72*106=
𝑁𝑢𝑘
𝐿
2.71=
h=
]
5/8 4/5
2.72∗106
(
) ]
282,000
1.1095 ∗26.83∗1.73
(18.90∗10 −6 )
838.61∗.02615
8.08
Re= Renyold’s number
Ub= Velocity (m/s)
D= External diameter of tanker (m)
μ = Viscosity of air at 35°C (Pa s)
3
ρ= Density of air at 35°C (kg/m )
k = Thermal conductivity of air at 35°C (W/m K)
L = Length of tanker
h = Convective heat transfer coefficient at 35°C (W/[m2 K])
Figure 2.1 (Continued) Heat transfer based on a cold tanker of milk at moving and
stationary conditions in warm weather.
17
𝑞̇ =
Heat transfer formula
759.45 =
𝑇𝑖−𝑇∞
𝑟𝑜
)
𝑟𝑖 + 1
2𝜋𝐿𝑘 ℎ𝑜𝐴0
ln(
35−5
.865
ln(
)
1
.83
+
2∗𝜋∗8.08∗.025 2.71∗(2∗𝜋∗.865∗8.08)
𝑞̇ = Joule heat per time (J/s)
Ro= External radius of tanker (m)
Ti -Temperature outside (°C)
Ri= Internal radius of tanker (m)
T∞- Temperature Milk (°C)
L= External length
K= thermal conductivity of Styrofoam (W/m K)
Ao = External area = 2πrL
Ho = convective heat transfer coefficient at 35°C (W/[m2 K])
Natural convection around a cylinder (Stationary Tanker)
2
Nu = . 6 +
{
h=
𝑞̇ =
.387 (𝑃𝑟∗𝐺𝑟)1/6
9 8/27
.559 16
(1+[
] )
𝑃𝑟
261.73 = . 6 +
}
{
𝑁𝑢𝑘
𝐿
ln(
.387 (.71∗2.28∗1010 )1/6
9 8/27
.559 16
] )
.71
(1+[
.85 =
Heat transfer formula
517.29 =
𝑇𝑖−𝑇∞
𝑟𝑜
)
𝑟𝑖
1
+
2𝜋𝐿𝑘 ℎ𝑜𝐴0
2
}
261.73∗.02615
8.08
35−5
.865
ln(
)
1
.83
+
2∗𝜋∗8.08∗.025 .85∗(2∗𝜋∗.865∗8.08)
𝑞̇ = Joule heat per time (J/s)
Ro= External radius of tanker (m)
Ti -Temperature outside (°C)
Ri= Internal radius of tanker (m)
T∞- Temperature Milk (°C)
L= External length
K= thermal conductivity of Styrofoam (W/m K)
Ao = External area = 2πrL
ho = convective heat transfer coefficient at 35°C (W/[m2 K])
Temperature change calculations
𝑞
= ∆𝑇
𝑚𝑐𝑝
Moving Tanker:
65616756.4
17986∗3852
= .947 °𝐶
.947*1.8 = 1.7 °F
Standing Tanker:
44693453.5
17986∗3852
= .645 °𝐶
𝑞 = Joule heat per time (J/24 hr)
m= mass of milk (kg)
.645*1.8= 1.161 °F
cp= Specific heat of milk (J/Kg°C)
ΔT = temperature change (°C)
Figure 2.1 (Continued) Heat transfer based on a cold tanker of milk at moving and
stationary conditions in warm weather.
18
External Radius .865 M
External Radius .825 M
Internal Radius .787 M
Internal Radius .827 M
External Length 8.08 M
External Length 7.92 M
Internal Surface Area of Tanker:
A=2πrh+2πr2
Front = 46.28 M 2= 2*π*.83M*8.08M+2*π*.83M2
Back = 43.05 M 2 = 2*π*.79M*7.92M+2*π*.79M2
Volume of Tanker:
V = π r2h
Front Volume: π*.83M2 *8.08M=17.36 M3
Front Volume (US gal) : 17.36 M3 *
𝐅𝐫𝐨𝐧𝐭 𝐭𝐚𝐧𝐤𝐞𝐫 𝐰𝐞𝐢𝐠𝐡𝐭 𝒐𝐟 𝐦𝐢𝐥𝐤 (𝐥𝐛𝐬):
264.172 𝑔𝑎𝑙𝑙𝑜𝑛𝑠
=
1 𝑀3
4585 gallons ∗
Back tanker weight of milk (kg): 39616 lbs ∗
4585
8.64 𝑙𝑏𝑠/𝑔𝑎𝑙𝑙𝑜𝑛
1 𝑔𝑎𝑙𝑙𝑜𝑛
.454 𝑘𝑔
1 𝑙𝑏
= 39616
= 17986
Back Volume: 15.41 M3 = π*.79M2 *7.92M
Back Volume (US gal): 15.41 M3 *
264.172 𝑔𝑎𝑙𝑙𝑜𝑛𝑠
=
1 𝑀3
4070
𝐁𝐚𝐜𝐤 𝐭𝐚𝐧𝐤𝐞𝐫 𝐰𝐞𝐢𝐠𝐡𝐭 𝒐𝐟 𝐦𝐢𝐥𝐤 (𝐥𝐛𝐬) ∶ 4070 gallons ∗ 8.64 𝑙𝑏𝑠/𝑔𝑎𝑙𝑙𝑜𝑛 = 35165
𝐁𝐚𝐜𝐤 𝐭𝐚𝐧𝐤𝐞𝐫 𝐰𝐞𝐢𝐠𝐡𝐭 𝒐𝐟 𝐦𝐢𝐥𝐤 (𝐤𝐠) : 35165 lbs*
.454 𝑘𝑔
1 𝑙𝑏
= 15965
Total Volume per tanker truck ( kg of front and back trailer) = 17986+15965= 33951
Figure 2.2 Dimensions of a tanker truck and calculations of internal surface area and
tanker load out efficiency
19
Figure 2.3 Diagram of a Tanker Truck; although all pipes are cleaned during a CIP wash
the red pipes are specific to the CIP cycle, blue pipes are used for milk loading and the
purple lines are shared and consist of the flexible transfer hoses.
20
3
Chapter 3- Short Distance and High Frequency Tanker Use Study
Interpretive Summary
This study focused on the impact of frequent tanker use between cleaning treatments
on hauled raw milk quality at manufacturing facilities. Three cleaning treatments were
evaluated to understand if their addition could mitigate any potential negative impact.
Based on this study, current hauling practices do not have any measurable impact on
raw milk quality although further investigation is needed prior to making industry wide
recommendations.
OUR INDSTRY TODAY
Impact of commercial hauling practices and tanker cleaning treatments on raw
milk microbiological quality
Emily M. Darchuk*, Joy Waite-Cusic*, Lisbeth Meunier-Goddik*1,
*
Department of Food Science and Technology, Oregon State University, Corvallis
OR 97331
Submitted to Journal of Dairy Science
April 2015, in review.
21
3.1 Abstract
Consolidation of the American milk industry has led to use of tankers for up to
24h in-between thorough cleanings. As the heavy use of tankers has not been previously
studied, the impact of this form of hauling on raw milk quality is unknown.
This study focused on the impact of frequent tanker use during hauling on raw
milk quality at a commercial facility. Standard tanker use, [cleaned-in-place (CIP) once
per 24 h] served as our control and incremental cleaning treatments (water rinse after
each load, water rinse after each load with a sanitizer treatment after 12 h, and 12 h
sanitizer treatment) were added to the study to understand if any impact could be
mitigated by more frequent cleaning. Producer samples were collected from the farm
prior to loading milk into the tanker as well as sampling the same milk directly out of the
tanker truck prior to unloading at the manufacturer. The study was repeated at two
different dairy manufacturing facilities, once during the summer and once during the
winter. Milk quality was quantified through industry relevant microbiological tests:
individual bacteria count (IBC), thermophillic spore count (TSC), and preliminary
incubation count (PI).
Within the study we defined a negative impact on milk quality as a statistically
significant difference between the tanker and producer samples in any of the three
microbial tests conducted between treatments. Results from the study showed no clear
impact due to hauling in IBC, TSC, or PI counts. There was also no difference in milk
quality between the two plants suggesting that neither season nor location impacted
our results in the standard use variable. As we did not see a negative impact on milk
22
quality in the standard use variable, the addition of cleaning treatments did not appear
to provide any clear benefit.
Tanker surface swabs and ATP swabs were also used to monitor tanker
sanitation and the efficacy of cleaning treatments. Both surface and ATP swabs
revealed differences between cleaning efficacy at the two facilities. Although the
differences in efficacy did not influence tanker milk quality within our study, variability
in sanitation may provide a source of contamination that could negatively impact raw
milk quality in other areas.
Based on this study, current hauling practices appear to be effective in
mitigating any measurable impact on raw milk quality however, further investigation is
needed prior to making industry wide recommendations.
Key words: Hauling, Milk Tanker, Bacteria, Cleaning
23
3.2 Introduction
Due largely to the demand of the export market, domestic dairy volumes have
continued to increase (USDA, 2012, 2014b) . Raw milk quality is of increasing importance
to US dairy producers due to tighter quality specifications demanded by the global
market.
Specification limits have historically been difficult for domestic producers to meet
partly due to the added complexity that has occurred with consolidation of the domestic
dairy industry (Ollinger et al., 2005; MacDonald et al., 2007; Watterson et al., 2014). The
focus on consolidation has pushed the industry to improve efficiency and reduce resource
usage throughout the supply chain. An example of this is milk hauling, where historically
tankers were cleaned after every load, but the consolidation of the industry has led to
longer routes and more frequent use of tankers between cleans.
Within the United States, all Grade A dairy products are regulated by the
Pasteurized Milk Ordinance (PMO). As stated in the PMO, milk tanker trucks can be used
repeatedly for a full 24 hours in-between mandated clean-in-place (CIP) treatments (Food
and Drug Administration, 2013). While individual truck utilization varies, routes can
involve frequent tanker use, during which each load of milk has a short duration within a
tanker, but the truck transports multiple loads per day. Following each load hauled, any
residual milk remaining in the truck may impact the microbiological quality of subsequent
loads.
Although many studies have helped the industry improve milk quality at the
farm and production level, few studies have investigated the impact of hauling practices.
24
Of previous studies, many were conducted outside of the United States and were unable
to capture the impact of domestic milk hauling practices in situ.
Previous studies suggest that the potential impact of hauling on milk quality is
dependent on the conditions of the tanker and quality metrics used. A few studies have
shown that multiple loads can be hauled between CIP treatments without a measurable
increase in the total bacteria count of raw milk (Dommett et al., 1980; Stewart, 1985).
Whereas other studies have identified areas within a tanker truck that can remain soiled
after cleaning (Luck and Lategan, 1979; Gerlach and Sabolic, 1980; Bell et al., 1994; Paez
et al., 2013) which provide sources of contamination as well as opportunistic
environments for biofilms to form (Donlan, 2002; Teh et al., 2012).
The objective of this study was to understand the impact of frequent use hauling
practices on milk microbiological quality within domestic industrial settings. The study
was outlined to measure i) impact of operating trucks for extended duration between CIP
treatments ii) impact of incremental between load cleaning procedures beyond the
standard 24 h CIP and iii) differences between manufacturing facilities.
3.3 Material and Methods
Study Overview. This study was conducted through a partnership with a large
commercial dairy in the Pacific Northwest to ensure that the hauling conditions were
representative of domestic dairy practices. Samples were collected within the standard
operations of two manufacturing plants (plant A and plant B) and analyzed using common
quality metrics.
Commercial Facilities. The first study was conducted in mid-November at a midsized manufacturing plant (Plant A). The second study was conducted in late August at a
25
large manufacturing plant (Plant B). Both studies were conducted in the Pacific Northwest
with the facilities located 280 miles apart.
Tanker Trucks. Two trucks and four trailers were isolated for the duration of the
study at each location. Trucks and trailers remained as one unit for the entire study. All
equipment was of similar age and considered to be in good condition based on regulatory
inspection. All milk was hauled within double trailer tanker trucks with a flexible transfer
hose to connect the two compartments. These trailers were transported by a truck that
carried the transfer pump and hose which loaded the milk from the farm bulk tank into
the trailer compartment. Milk was always first loaded into the front trailer and when filled
was diverted to the back trailer. Both trailers were simultaneously emptied at the plant.
Farm Routes. Each truck was assigned to a route which determined what farm
milk each truck would pick up within a 24 h period. Routes were selected based on their
ability to be repeated daily and were specific to each study location. Within each route
there were up to 9 loads scheduled. Each load was either filled from a single farm or was
commingled and contained multiple farms within the same truck. A load was completed
when a full truck delivered milk to the manufacturing plant.
Cleaning Treatments. The study investigated the addition of cleaning treatments
incremental to the standard operating procedure of a 24 h CIP which served as a standard
use variable (control) (Table 1). Two trucks underwent different cleaning treatments each
day, creating four replicated days for each of the four cleaning treatments over the eight
day study (Table 2). Cleaning treatments were partial stages of the full CIP cycle and
utilized existing chemicals and equipment. All water rinses conducted were 2-3 minutes
in duration and utilized ambient temperature water. All sanitizer rinses at both plant A
26
and B were conducted using a spray of nonanoic and decanoic acid (Mandate Plus- Ecolab
US, St. Paul, MN).Water samples were analyzed from the CIP system daily to ensure that
rinse water was not a source of contamination. All cleaning treatments, including CIP,
were conducted in the receiving bay of the plant immediately after unloading milk and
prior to continuing on to the next load.
Samples
Over 100 samples were collected each day (Table 3), and were identified by a
sample location and unique bill of lading (BOL) number which was traceable to a specific
farm, truck, treatment and load. Training of receivers and haulers was conducted to
ensure that sampling and cleaning procedures were consistent throughout the study.
Milk Samples. Producer samples were collected by the hauler from every raw
milk bulk tank after agitation using a sanitized stainless steel dipper or sample port (Food
and Drug Administration, 2013). Producer samples were stored in temperaturemonitored (< 7°C) coolers during transport.
Receivers collected the tanker samples once the truck entered the receiving bay
of the plant. At plant A, samples were taken from the back outlet of the front and back
trailer during pumping. At plant B, samples were taken using a sanitized stainless steel
dipper from the top hatch of the milk tank. A different dipper was used for front and back
trailer of the truck to avoid cross contamination. All liquid samples were collected in
sterile containers and stored in a temperature monitored refrigerator (< 7 °C) following
collection.
Surface Swabs. Sponge-stick swabs moistened with Letheen broth (3M US, St.
Paul, MN) were used after unloading milk to measure residual bacteria on the internal
27
surface of tank. For every load, a 900 cm2 area (30 cm x 30 cm) was swabbed per
manufacturer’s instructions. Following treatment, sponge and ATP swabs (3M US) were
used to measure the efficacy of the clean. Receivers were trained to rotate the area
swabbed with each incoming load and to conduct the ATP swab prior to the sponge swab
to avoid false positives. ATP swabs were read and recorded immediately after sampling
utilizing a Luminometer (3M US). Sponge swabs were stored in a temperature monitored
refrigerator (<7 °C) following collection.
3.3.1 Sample Analysis
All samples were analyzed at the same corporate laboratory for both studies. All
samples were transported (< 7°C) to the laboratory via daily courier service. Samples were
received within 48 hours of sampling and were tested upon arrival.
Microbiological Analysis. All milk samples were analyzed for individual bacteria
count (IBC), thermophilic spores count (TSC), and preliminary incubation (PI) most
probable number (MPN). Individual bacterial counts of all milk samples were conducted
using a Bactoscan FC (FOSS, Hillerød, Denmark). Conversion of IBC to cfu was calculated
using Bactoscan software. The method described by Wehr and Frank ( 2004) was used to
quantify thermophilic spores. A 5 mL sample of milk was heated in a sterile test tube to
80°C and held for 12 minutes. Following heat treatment, the tubes were chilled in an ice
water bath for 10 minutes prior to pour plating using Standard Method Agar (Neogen,
Lansing, MI) and incubated for 48 h at 55 ± 1°. Preliminary incubation was conducted by
adding a 0.1 mL diluted sample of milk (Butterfield’s Buffer, 3M US) to 3.9 mL sterile water
into a TEMPO Total Viable Count (TVC) vial (bioMérieux; Marcy l'Etoile, France). The TVC
vials were incubated at 13° ± 1°C for 18 h followed by 32° ± 1°C for 48 h. Following
28
incubation, MPN was determined using a TEMPO reader following manufacturer
instructions.
Both the rinse water and sponge swabs were evaluated for aerobic plate count
(APC) using Petrifilm (3M US) incubated at 32° ± 1°C for 48 h. Petrifilms were enumerated
using an automated counter (3M Petrifilm reader).
3.3.2 Statistical Modeling
The study was outlined using a mixed model with repeated measures design.
Possible confounding factors identified were the equipment (truck A vs B), location of
sampling (front vs back trailer), variability in farm milk quality, and day to day operational
variability. The model includes four cleaning treatments with sampling repeated after
every delivery.
Statistical Analysis. Impact on milk quality was defined as a significant change (P
< 0.05) in the tanker microbiological count as compared to the same load producer
microbiological count across load number and between cleaning treatments. For the sake
of comparison all samples below the limit of detection for PI (< 1,000 cfu/mL) and TSC (<
10 cfu/mL) were scored as 500 cfu/mL and 5 cfu/mL respectively. For commingled loads,
the weighted average of the producer microbial counts were calculated for the front and
back trailer.
Linear mixed effect analysis was conducted on the log transformed producer and
tanker data for the three microbial tests from both studies. Statistical analysis on the data
was conducted using R software (R Development Core Team, 2013) and the nlme package
(Pinheiro et al., 2015). Fixed effects were identified as the truck and cleaning treatment
with the producer milk quality considered a covariate. Sample location (front or back
29
tank) was found to be a non-significant fixed effect and was dropped from the model. A
correlation structure to account for the potential dependence between loads within the
same truck was not found to contribute positively to the model based on Akaike
information criteria (Akaike, 1973); therefore, it was removed as an effect for model
parsimony.
A comparison of the two studies was conducted through a Welch’s t-test. This
test was conducted by comparing the average difference between the tanker and
producer microbial count in the standard use milk samples from both plant A and plant B
for IBC, TSC and PI. A Pearson’s chi-squared test (χ2) was conducted to determine the
significance of ATP swab data between plant A and plant B for each cleaning treatment.
3.4 Results
Milk Samples. Temperature during the study at plant A averaged 3°C with a
daytime high of 11°C and nighttime low of -5°C. Farm routes at plant A were consistently
repeated, with up to 9 loads per truck within a 24 h period. Of these loads, most were
commingled and all contained between 1 and 5 producers per tanker truck.
Temperature during the study at plant B averaged 23°C with a daytime high of
36°C and a nighttime low of 12°C. Routes were not as consistent as plant A and consisted
of fewer commingled loads. Trucks at plant B averaged 7 deliveries per 24 h of use and
contained between 1 and 3 farms loads per tanker truck. Due to concerns around sample
temperature abuse, day one of the plant B study was removed from analysis reducing the
total repetition of treatments to three days for both the water rinse (WR) and the 12 hour
30
sanitizer treatment (SO). Milk quality was overall very good at both facilities with over
80% of all producer samples testing below 10,000 cfu/mL (Figure 1).
The measured cfu change during the hauling process was determined by
averaging data from both trucks and sampling locations (front and back) at each plant.
When looking at the data (Figure 2 and 3) for the overall trend across cleaning treatments
and number of loads hauled, all data was clustered around the center line showing little
difference between the tanker and producer samples regardless of treatment or duration
of use at both facilities.
Statistical results showed that when keeping everything else constant there was
a significant impact between trucks in IBC (P = 0.006), TSC (P = 0.012), and PI counts (P <
0.001) at plant A. Although this was a possible confounding influence, any impact due to
the truck was balanced with two replicates of every cleaning treatment occurring within
each truck (Table 2). There was no significant impact due to the truck found at plant B.
At plant A, there was no significant impact due to the cleaning treatments in IBC
nor PI. Slight evidence (p = 0.043) of a statistical impact due to treatment was found for
TSC. Keeping everything else constant, the rinse treatment showed a 40% reduction in
the median TSC as compared to the median standard use TSC (6.3 cfu/mL). Although this
was found to be significant within the model, the reduction in spore counts would not be
practically significant for industry as the difference is below the commonly used detection
limit for the test ( < 10 cfu/mL). Within this study, 36% of all spore samples were below
the limit of detection from plant A and 15% from plant B. Plant B’s statistical results
showed no significant effect in the IBC, TSC, nor PI for any of treatments as compared to
standard tanker use. When comparing the standard use variable at plant A and plant B,
31
there was no significant difference found between the results in any of the
microbiological tests.
Swabs. Following CIP treatment, the average surface bacteria count of a clean
truck prior to starting a route was 1.89 cfu/900cm2 at plant A and 1.50 cfu/900cm2 at
plant B. Tankers showed a similar pre-treatment average surface bacteria count
between plant A (3.36 log cfu/900cm2) and plant B (3.32 log cfu/900cm2) (Figure 4). The
water rinse (WR) treatment was more effective in reducing surface bacteria at plant B
with an average post treatment count of 1.24 log cfu/900cm2 as compared to 2.60 log
cfu/900cm2 at Plant A.
ATP swabs (Table 4) also showed a plant to plant difference in cleaning efficacy,
with 90% of tankers at Plant B and 23% of the tankers at plant A meeting the industry
partner’s standard for a clean tanker [<150 Relative Light Units (RLU)] following a water
rinse treatment ( P < 0.001). Following CIP, 100% of tankers at plant B and 86% of the
tankers at plant A met ATP cleanliness standards ( P = 0.045).
3.5 Discussion
Heavy and extended use of tankers. Residual bacterial counts between the
producer and tanker samples remained consistent, providing no evidence that the
extended use of tanker trucks have an impact on raw milk quality as measured by IBC, PI
or TSC. Even with variable producer milk quality, the impact of a preceding load on the
subsequent load of tanker milk was negligible. The results of our study align with previous
in situ work, proposing that any bacterial differences seen between producer and tanker
32
samples are not operationally significant as compared to the variability typically seen in
milk quality across producers (Dommett et al., 1980; Stewart, 1985).
The lack of measureable impact from hauling is largely due to the low levels of
residual milk remaining in the tank after pumping and the limited sensitivity of test
methods used within industry. Typical shrinkage allowance within industry is 0.02% of a
load, allowing for less than 10 kg of milk remaining in a tanker after load out. The bacteria
within this residual milk is diluted by next load (34,000 kg) of milk making it difficult to
measure significant changes using typical industry milk quality tests. The accuracy of the
Bactoscan FC is reported to be +/- 0.25 Log units across the measuring range (FOSS).
Within this study all averaged differences between the producer and tanker results fell
within the margin of error, further suggesting that any differences found could be due to
sampling and testing variability and not the impacts due solely to hauling. This variability
also created occasions where the tanker data averaged lower than its producer sample
even though counts should not be reduced due to hauling. A similar study in Ireland,
found only marginal increases (0.14 Log cfu/mL) in total bacteria counts could be
attributed to the hauling process and accounted for situations in which the tanker counts
differed from the producer counts due to sampling variability (Stewart, 1985).
When investigating industry practices, finding only a marginal increase in bacteria
counts during the hauling process is expected. As milk remains at temperatures below
7°C during transportation, only psychrotrophic bacteria may grow. Even for
psychrotrophic bacteria, generation times are significantly longer than the duration of
time the milk was held within a tanker truck under frequent use situations. Within this
study, each load remained in the tanker truck for less than 4 h, limiting potential bacterial
33
growth. Of psychrotrophic bacteria found in raw milk, Pseudomonas spp. has one of the
shortest generation times of 5.5-14.7 h at 4-6°C (Cousin, 1982; Sørhaug and Stepaniak,
1997) and has been found to make up only 8% of the bacteria isolated from the surface
of a milk tanker (Teh et al., 2011).
Theoretical calculations investigating the worst-case scenario suggest that even a
highly contaminated preceding load of milk will have negligible impact on a low microbial
load of milk subsequently loaded into the tanker prior to cleaning treatment. This impact
is insignificant due both to the slow rate of bacteria growth and dilution effect. Based on
the maximum shrinkage allowance, highly contaminated milk (150,000 cfu/mL) remaining
in a truck following pump out would contribute less than 0.003 Log cfu/mL of bacteria to
the next load of milk (10,000 cfu/mL), making its bacterial contribution impossible to
accurately measure with the microbiological tests typically used in industry.
Location and seasonal variability. The replication of the study in multiple
locations provided a broader picture into the operation of trucks with different systems.
As milk quality results were similar in both the studies, location did not appear to have an
impact on the results of our study. Even though location did not impact the milk quality
results, we found differences in cleaning efficacy between plant A and B, suggesting
operational differences could cause impacts that were not captured within this study.
Impacts of seasonality were predicted to cause changes in farm milk quality
between studies and increased milk receiving temperatures due to temperature extremes
during the summer study (Plant B). During the study, all tanker loads were received under
< 7°C and milk quality was consistent across both studies. As results were similar in both
studies, seasonality did not appear to have an impact on the results.
34
To avoid confounding operational impacts from conducting the studies at
different locations, cleaning treatments were not compared across seasons in statistical
analysis. When comparing standard tanker use across the winter (Plant A) and summer
(Plant B) study, results show that differences in average microbiological counts between
the tanker and producer samples were not significant. This suggests that regardless of
season, the extended use of tanker trucks does not negatively impact milk quality in the
metrics measured.
The lack of impact due to season is reasonable when investigating how trucks
were utilized. Due to industry pressure to maximize use of equipment, short duration
hauls typically occur consecutively, leaving little time for the tanker to sit empty before
picking up the next load. When a tanker is full of cold milk, the insulation within the
compartments is effective at maintaining temperature regardless of external
temperatures. The cold temperature of the milk tanker prevents significant
microbiological growth from occurring during short duration hauls, thus minimizing any
seasonal impact due to increased environmental temperatures. When tankers are in
motion, even at very warm temperatures (35°C), there is very little change in
temperature. Based on the Churchill-Bernstein Equation, a tanker at constant motion (60
mph) filled with cold milk (5°C) will gain less than 2°C over a 24 h period (Perry et al., 1997)
allowing for tanker trucks to be used for extended periods without issue.
Tanker Trucks. There was no significant impact attributed to the sampling
location within trailers. Within this study we compared the milk in the front versus the
back trailer to understand if there was any contamination due to the transfer hose. As
transfer hoses are uninsulated, this area can see elevated temperatures in warm weather.
35
Although this is an area of potential microbial growth, the risk is mitigated through
purging the hose with air after pumping to reduce the amount of residual milk remaining
in the line.
Truck to truck variability was investigated as a potential confounding influence as
tankers are often cleaned at multiple locations leading to variability in tanker
maintenance. The statistical difference in tanker milk quality between trucks at plant A
suggests that regular maintenance of both the trucks and the CIP system is important.
Plant A conducted treatments in multiple bays of the receiving facility which could explain
the variability in cleaning efficacy. Results showing no impact due to the truck or across
treatments at Plant B suggests that when properly maintained, current hauling
equipment is effective at preventing growth during 24 h of continuous use.
Cleaning treatments. There is no compelling evidence that the addition of
cleaning treatments could provide a positive impact on milk quality as compared to
standard use. As there is not an increase in microbiological counts over time in the
standard use variable, the addition of a cleaning treatments provided no measurable
benefit to milk quality. The only statistical difference found between treatments in our
study (TSC at Plant A) would not provide a practical significance to industry as the
reduction in spore count was only estimated to be 2.5 cfu/mL, which would be below
the limit of detection of typical test methods. The slight evidence of significance was
likely created due to skewed data from the large percentage of counts that were below
the limit of detection.
Cleaning treatments were outlined in partnership with our industry sponsor with
the goal of identifying treatments that were robust enough to remove residual milk yet
36
rapid enough to minimize impact to operational efficiency. The cleaning treatments that
are outlined are partial stages of the full CIP cycle and utilized existing chemicals and
equipment. These treatments were all in addition to the mandated CIP treatment once
every 24 h which occurred on every truck regardless of assigned cleaning treatment.
Within this study, swab data shows that water rinses reduced residual surface bacteria
counts to levels similar to post-CIP treatment levels. These results align with a previous
study which found that a water rinse in-between loads was as effective in preventing
significant bacterial growth in hauled milk as a full CIP treatment (Dommett et al., 1980).
Although we believe a water rinse can be a tool to remove surface bacteria, we suggest
their use in addition to current sanitation practices, not as a replacement for full CIP
treatments.
As our study only investigated short term microbiological growth, not biofilm
formation within tanker trucks, hauling could still have a negative impact on raw milk
quality that is not detectable with the test methods used within this study. A study by Teh
(2011) isolated biofilm forming bacteria from the internal surface of milk tankers
following use and before cleaning. Although Teh’s study found biofilm forming milk
bacteria within tankers, the formation ( 2.7- 7.6 log cfu cm-2) was documented at in-vitro
conditions more extreme (25°C for 24 h) than a frequent use tanker would typically
experience in the United States. It is important to note that the isolated tanker bacteria
was also found to produce enzymes which negatively impacted milk quality (Teh et al.,
2011). Our swab data suggests that differences found in plant to plant cleaning efficacy
could create situations where sporadic tanker sanitation issues may impact downstream
milk quality for manufacturers.
37
As the addition of cleaning treatments consumes plant resources (receiving bay
space, water, chemicals, employee time) there is not sufficient evidence to suggest the
addition of incremental cleans would provide any operational benefit in terms of
improved quality. Alternatively, incremental cleans did not show any evidence of
negatively impacting milk quality so their use could be adopted by industry as a
preventive measure in extreme situations, such as occasions where a truck will be empty
but soiled for an extended period of time .
3.6 Conclusion
Within this study, extended use of tanker trucks (24 h CIP) did not appear to have
a negative impact on raw milk quality. Our results align with the findings of previous in
situ studies as well as theoretical calculations. We caution that although we saw no
benefit to adding cleaning treatments, this sole study should not be used as a justification
to reduce cleaning treatments at any individual facility. As this study focused on frequent
use of tankers, further studies should investigate the impact of extended duration hauling
on milk quality. Continued investigation utilizing more sensitive test methods may also
find impacts that we were unable to detect. For improved milk quality, industry should
focus on producing high quality milk at the farm, loading milk as cold as possible and
creating consistency in current hauling practices through maintenance of equipment and
conducting regular CIP treatments.
3.7 Acknowledgements
We would like to acknowledge the Washington State Dairy Products
Commission for their funding and support in conducting this research. We would also
like to acknowledge everyone who supported this trial at the manufacturing plants, the
38
hauling company, the corporate lab, and the corporate office. Tomomi Fujimaru, Dr. Hui
Feng, Christopher Baird and Daniel Dupree acted as student support at the corporate
lab and production facilities. Finally, we would like to acknowledge Gina Shellhammer
for her advice and support with statistical analysis.
39
3.8 Appendix
Table 3.1: Overview of cleaning treatment variables utilized in the mixed model design
a
Cleaning Treatment a
Procedure
Standard Use (SU)
Standard operational use (control). CIP after
24 h.
Water Rinse (WR) b
2-3 minute water rinse following every load.
Water Rinse with Sanitizer Treatment
(WS)bc
2-3 minute water rinse following every load.
One 2-3 minute water rinse followed by
sanitizer spray after approximately 12 hours
of use.
Sanitizer Treatment (SO) bc
One 2-3 minute water rinse followed by
sanitizer spray after approximately 12 hours
of use.
All cleaning treatments were in addition to the standard operational CIP following 24 h
of use per the PMO.
b
The water rinse used non thermally controlled water
c
Sanitizer used was Mandate Plus (Ecolab)
40
Table 3.2 Mixed model with repeated measure study design for both studies. Outline of
the scheduling of trucks and routes with assigned cleaning treatments
Day 1
Cleaning Treatment a
Truck b
Day 2
Day 3
Day 4
Day 5
Day 6
Day 7
WR
SO
WS
WR
WR
SU
WS
WR
SU
SO
SO
WS
SU
WS
SO
SU
1
2
1
2
1
2
1
2
1
2
1
2
1
2
1
2
Treatment Key: SU: Standard use (control) WR: Water rinse after each load WS: Water
rinse after each load and sanitizer treatment after 12 hours of use SO: Sanitizer treatment
after 12 hours of use
a.
b.
Day 8
The same cleaning treatments were assigned at both facilities but operational
differences prevented complete replication of treatments across both studies
Trucks remained consistent across a given study but different equipment was used
at plant A and B
41
Table 3.3 Outline of milk and swab sample location, collection frequency, and analysis
method for both manufacturing locations
Sample
Location
Frequency
Analysis
Producer Milk
Samples were collected from every bulk tank that
was loaded into tanker (n=446)
IBC1, TSC2, PI3
Tanker Milk
Samples were collected from the front and back
trailer of every tanker load that was delivered to
plant (n= 617)
IBC, TSC, PI
Tanker Surface
Swab
Swabs were taken from the front and back trailer
ceiling4 following every load delivered to the plant.
When a cleaning treatment occurred a second set
of swabs were taken before a truck continued on
route (n=721)
APC5
Tanker ATP
Swab
Swabs were taken from the ceiling of the front and
back trailer following every cleaning treatment
conducted and prior to sponge swab sampling. (n=
261)
Luminometer
Rinse Water
Samples were taken at least once daily from CIP
tank or outlet pipe (n=19)
APC
1
2
3
4
5
Individual Bacteria Count : Bactoscan FC
Thermophilic Spore Count
Preliminary Incubation Count: TEMPO
Location of swab sample rotated with every load
Aerobic Plate Count : Petrifilm
42
Table 3.4 ATP swab data from post cleaning treatments. Percent pass of treatments
based on cleanliness threshold of <150 RLU2.
CIP
n= 54
Water Rinse
n=97
Plant A
86%a*
23%a***
Plant B
100%b
90%b
a-b
1
2
Rinse and
Sanitizer
Treatment
n=96
45%a***
Sanitizer
Treatment
n= 14
81%b
% pass between plants with different superscripts differ (P < 0.05)
*P < 0.05, ***P < 0.001.
Relative light unit (RLU)
38%a
50%a
43
90%
80%
70%
60%
50%
40%
30%
20%
10%
0%
Plant A
Plant B
<10,0000
10,000-20,000 20,000-50,000
cfu/mL
> 50,000
Figure 3.1 Producer milk quality for both study locations: plant A (n= 270) and plant B
(n=178). Categorized as percentage of samples within individual bacterial count (IBC)
quality categories.
44
a.
Plant A
b.
Plant B
Figure 3.2 Impact of cleaning treatments on tanker bacteria growth. Raw milk individual bacterial count (IBC) results displayed as
the average difference between the tanker and corresponding producer milk across treatments and each load within 24 h cycle at
Plant A (2.a) and Plant B (2.b). Each cleaning treatment was replicated 4 times at Plant A and 3-4 times at Plant B and contained
up to 9 loads per 24 h use period at plant A and up to 8 loads at plant B.
Figure Key: ♦: Standard use,▲: Water Rinse, ■: Water Rinse and Sanitizer,●: Sanitizer
45
a.
b.
Difference in PI MPN
Log cfu/mL
Difference in PI MPN
Log cfu/mL
1
1
0.5
0.5
0
-0.5
0
-0.5
-1
-1.5
0 1 2 3 4 5 6 7 8 9
Load Number
-1
-1.5
0
2
0
1
3 4 5 6
Load Number
7
8
d.
1.5
1
0.5
0
-0.5
-1
-1.5
Difference in TSC
Log cfu/mL
Difference in TSC
Log cfu/mL
c.
1
0 1 2
3 4 5 6 7
Load Number
8 9
1.5
1
0.5
0
-0.5
-1
-1.5
2
3 4 5 6
Load Number
7
8
Figure 3.3 Impact of cleaning treatments on tanker PI and TSC growth. Raw milk preliminary
incubation (PI) (3.a, 3.b) and thermophilic spore count (TSC) (3.c, 3.d) results are displayed as
the average difference between the tanker and corresponding producer milk across treatments
and each load within 24 h cycle at Plant A (3.a, 3.c) and Plant B (3.b, 3.d). At plant A, each
cleaning treatment was replicated 4 times and contained up to 9 loads per 24 h use period. At
plant B, each cleaning treatment was replicated 3-4 times and contained up to 8 loads per 24 h
use period.
Figure Key: ♦: Standard use, ▲: Water Rinse, ■: Water Rinse and Sanitizer, ●: Sanitizer
46
4
Log cfu/ 900cm2
3.5
3
2.5
2
1.5
1
0.5
0
Plant A
Post CIP
Plant B
Pre Rinse
Post Rinse
Figure 3.4 Tanker surface sponge swab results from Plant A and Plant B to measure cleaning
efficacy. Data reported is the average aerobic plate count per swabbed surface area (900 cm2) of
a soiled tanker before and after a water rinse treatment. Averaged post clean-in-place (CIP)
treatment data was included as a benchmark for starting tanker cleanliness across the duration
of the study at both plants. Plant A: CIP n= 26, Rinse Pre n= 60, Rinse Post n= 60, Plant B: CIP n=
24 Rinse Pre n= 32, Rinse Post n= 32
47
4
Chapter 4-Long Distance and Low Frequency Tanker Use Study
Interpretive Summary
This study focused on the impact of long distance raw milk hauling at a manufacturing facility.
Raw milk quality was investigated before and after an extended duration haul during summer
conditions. Based on this study, long distance milk hauling practices do not appear to have a
measurable impact on raw milk quality.
SHORT COMMUNICATION: Microbial quality of raw milk following commercial long distance
hauling. Darchuk
Emily M. Darchuk*, Joy Waite-Cusic*, Lisbeth Meunier-Goddik*1Department of Food Science
and Technology, Oregon State University, Corvallis OR 97331
Submitted to Journal of Dairy Science
April 2015, in review.
48
4.1 Abstract
Hauling is a critical part of the commercial milk supply chain, yet very few studies have
aimed to understand its impact on raw milk quality. This study focused on the impact of
extended duration tanker use during hauling on raw milk quality at a commercial facility.
Standard tanker use, (cleaned-in-place (CIP) once per 24 h) served as a control and an
incremental between load water rinse with sanitizer treatment (RS) was evaluated to mitigate
any impact from extended duration hauling. During this study, one commercial truck with two
trailers was monitored for 10 days. The truck collected milk at a large dairy farm, transported
the milk to a manufacturing facility, and then returned to the same farm for a second load. Each
round trip journey took between 10-12 h allowing for two loads per 24 h use period. Following
the second delivery, the truck was cleaned by CIP treatment starting a new treatment day.
Producer samples were collected from the farm prior to loading milk into the tanker as well as
sampling the same milk directly out of the tanker truck prior to unloading at the manufacturer.
Milk quality was quantified through common industry tests: individual bacteria count (IBC),
thermophillic spore count (TSC), and preliminary incubation count (PI). Surface sponge swabs
were also used to monitor tanker sanitation and the efficacy of cleaning treatments. Results did
not identify a negative impact on raw milk quality due to extended duration hauling. Therefore,
the addition of a rinse with sanitizing treatment RS did not provide any measurable quality
benefit. Swabs results demonstrated that the RS treatment was able to reduce surface bacteria
on the tanker, although it was not as effective as the full CIP treatment. Based on this study,
current long haul practices appear to be effective in mitigating any measurable impact on raw
milk quality.
49
Key words: Hauling, Milk Tanker, Bacteria, Cleaning
50
4.2 Introduction
Within the United States, all Grade A dairy products are regulated by the Pasteurized Milk
Ordinance (PMO). As stated in the PMO, milk tanker trucks can be used repeatedly for a full 24 h
between Clean in Place (CIP) treatments (Food and Drug Administration, 2013). Although
individual truck utilization varies, routes can involve extended duration hauls during which, each
load of milk has a long interval within a truck but only a few loads can occur per each 24 h period.
Extended duration hauls may also include situations where a truck remains soiled and empty for
extended periods of time between loads. Residual milk remaining in the truck may lead to
microbial growth as well as the formation of biofilms that could negatively impact the
microbiological quality of subsequent loads, making extended duration hauling an industry
practice that poses potential risk to raw milk quality.
The objective of this study was to understand the impact of extended duration hauling
practices on raw milk microbiological quality within an industrial setting. The study was outlined
to measure i) the impact of operating trucks for an extended duration between CIP treatments,
and ii) the impact of an incremental between-load water rinse with sanitizer treatment to remove
milk residue.
4.3 Material and Methods
Study overview
This study was performed within the standard operations of a commercial dairy
manufacturing plant. Samples were analyzed using common quality metrics to ensure that the
study was representative of industry practices.
51
Tanker Trucks. Milk was hauled within one double trailer tanker truck with a flexible
transfer hose to connect the two compartments. These trailers were transported by a truck that
carried the transfer pump and hose which loaded the milk from the farm bulk tank into the trailer
compartment. Prior to the study, all equipment had passed regulatory inspection.
Tanker Routes. To reduce variability in producer milk quality, one route was repeated for
the duration of this study. This route consisted of milk from one farm which was collected twice
daily. Prior to the first load, the truck underwent a CIP treatment at the manufacturing plant.
Following CIP, the tanker would travel to the farm which was located approximately five hours
away. All milk was loaded from a single bulk tank, filling both trailer compartments of the truck.
Once loaded, the truck would return to deliver the milk to the same manufacturing plant.
Following delivery of the first load, the truck would either return to the same farm without any
cleaning treatment (standard use -SU) or a water rinse followed by a sanitizing spray (RS) would
occur prior to the second farm pick up. Regardless of treatment, following the delivery of the
second load the truck would undergo a CIP treatment and a new treatment day would begin. All
cleaning treatments, including CIP, were conducted in the receiving bay of the plant immediately
after unloading milk and prior to continuing on to the next load.
Cleaning Treatments. This study investigated the addition of a between load water rinse
and sanitizer treatment (RS) which was incremental to the standard operating procedure of a 24
h CIP (SU). The truck underwent each treatment for multiple days, creating seven replicated days
for the RS treatment followed by three replicated days of the SU treatment over the ten day study.
Incremental treatments were partial stages of the full CIP cycle which utilized existing
chemicals, receiving bays, and equipment. The RS treatment consisted of 2-3 minute ambient
water rinse followed by a sanitizing spray containing a blend of peroxyacetic acid and hydrogen
52
peroxide (Oxonia Active – Ecolab US, St. Paul, MN). Water samples were taken from the CIP
system throughout the study to ensure no contamination of the tanker occurred due to the RS
treatment.
Sampling
Samples were collected daily (Table 1) at both the farm and plant. Prior to the study,
training of both the receivers and haulers was conducted to ensure that sampling and cleaning
procedures were consistent throughout the study. All samples were kept below 7°C during
storage and transport and were tested within 36 h of sampling at a corporate laboratory.
Milk Sampling. Haulers followed PMO regulations when collecting producer samples
from the farm bulk tank (Food and Drug Administration, 2013). Receivers took tanker samples
using a sanitized stainless steel dipper from the top hatch of the front and back tanker trailer. A
different dipper was used for each compartment of the truck to avoid cross contamination.
Surface Swabs. Sponge-stick swabs moistened with Letheen broth (3M US, St. Paul, MN)
were used after unloading milk to measure residual bacteria left on the internal surface of tank.
For every load, a 900 cm2 area (30 cm x 30 cm) was swabbed per manufacturer’s instructions.
Following CIP or RS treatment, a second swab was taken to measure the efficacy of the clean.
Receivers were trained to rotate the area of the ceiling swabbed with each incoming load and
before and after cleaning treatments.
Microbiological Analysis. Milk samples were evaluated at the same location using the
same microbiological techniques as was described in detail within Darchuk et al. (In Review).
Briefly, all milk samples were analyzed for individual bacteria count (IBC), thermophilic spore
count (TSC), and preliminary incubation (PI) most probable number (MPN). Individual bacteria
counts of all milk samples were conducted using a Bactoscan FC (FOSS, Hillerød, Denmark).
53
Thermophilic spores were quantified using the method described by Wehr and Frank (2004).
Preliminary incubation was conducted by adding a diluted samples to a TEMPO Total Viable Count
(TVC) vial (bioMérieux; Marcy l'Etoile, France). The TVC vials were incubated at 13° ± 1°C for 18 h
followed by 32° ± 1°C for 48 h and enumerated using TEMPO reader following manufacturer
instructions.
Both the rinse water and sponge swabs were evaluated for aerobic plate count (APC)
using Petrifilm (3M US) incubated at 32° ± 1°C for 48 h. Petrifilms were enumerated using an
automated counter (3M Petrifilm reader).
Statistical Analysis. The impact on milk quality due to extended duration hauling was
defined as a significant change (P < 0.05) in the microbiological count (difference between the
producer and tanker milk) between load one and load two within a treatment (RS or SU). Impact
on milk quality due to the cleaning treatment was defined as a significant change (P < 0.05) in the
microbiological count (difference between the producer and tanker milk) between RS and SU
treatments. All samples below the limit of detection for PI (<1,000 cfu/mL) and TSC (< 10 cfu/mL)
were scored as 500 cfu/mL and 5 cfu/mL respectively.
Statistical analysis on the data was conducted using R software (R Development Core
Team, 2013). The difference in tanker milk quality due to extended tanker use was determined
through a paired t-test comparing the difference between the tanker and producer milk of the
first and second load of milk for both the SU and RS treatment. The impact of cleaning treatment
on tanker milk quality was determined through a Welch’s t-test comparing the difference
between the tanker and producer milk between treatments. Prior to conducting statistical
analysis, all samples were averaged so one tanker output value could be compared to the single
producer input value for every load.
54
4.4 Results
Producer milk quality during this study was good with over 95% and 68% of the loads
testing below 10,000 cfu/mL in IBC and PI, respectively (Figure 1).
Statistical analysis found no significant difference between the average difference
between producer and tanker IBC (P = 0.228), TSC (P = 0.7071) nor PI (P = 0.7923) counts for the
rinse and sanitize (RS) treatment as compared to standard tanker use (SU) (Figure 2). There was
also no significant difference between the average difference in the producer and tanker IBC, TSC,
or PI count between load one and load two in either SU or RS treatments, demonstrating no
difference between the pre- and post-hauled milk quality over the course of a 24 h period.
Following CIP treatment, the average surface bacteria count of a clean truck prior to
starting a route was 1.23 log cfu/900cm2. A tanker after delivering one load of milk had an
average surface bacteria count of 4.00 log cfu/900cm2. The use of a water rinse with a sanitizer
treatment reduced the surface bacteria count to 2.68 log cfu/900cm2 (Figure 3).
4.5 Discussion
The difference in microbiological counts between the producer and tanker samples did
not increase significantly between loads, suggesting that the extended use of a tanker truck has
no impact on raw milk quality as measured by common industry test methods. As there was not
an increase in microbiological counts over time in the standard use variable, the addition of a RS
treatment provided no measurable benefit to raw milk quality. As the data provided no convincing
evidence that hauling has a significant impact on milk quality in any of the microbiological
parameters measured (IBC, TSC, PI), current industry practices based on PMO regulations appear
to be effective (Food and Drug Administration, 2013).
55
A similar outcome was found when investigating frequent use hauling, during which
tanker trucks were used for the same period of time (up to 24 h between CIP), but each load of
milk had a short duration within a tanker and more loads were hauled per day (Darchuk et al ,
2015 – In review). It is reasonable to find similar results between frequent use and extended
duration studies, as the lack of measureable impact from hauling is largely due to the low levels
of residual milk remaining in the tank after pumping and the limited sensitivity of test methods
used within industry; suggesting that regardless of the type of hauling, 24 h continual use of tanker
trucks can occur without negatively impacting raw milk quality based on the metrics we
investigated.
Within our study, swab data showed that RS treatments could reduce residual surface
bacteria counts, but it was not as effective as a full CIP treatment. Although the RS treatment was
able to reduce surface bacteria, there is not enough evidence to suggest that its use would provide
a quality benefit to industry that would be worth the resource usage required to implement it
after every load.
Our study only investigated short term surface bacteria growth, not biofilm formation,
hauling could still have a negative impact on raw milk quality that was not detectable with the
test methods used within this study. Although biofilm formation within a tanker is a concern, the
risk of its development within a truck is less than other areas of a dairy plant. Biofilm formation
within a tanker is expected to be less likely due to the cold temperature, low shear, and smooth
surface area that the raw milk is exposed to within a stainless steel tanker truck (Marchand et al.,
2012). The risk of biofilm development is also managed through regular CIP treatments, but
overall tanker sanitation is only as good as the efficacy of any given facility’s regular practices. A
previous study investigating plant to plant differences in tanker sanitation (Darchuk et al., In
56
Review), found efficacy differences in CIP and incremental cleaning treatments between facilities.
As biofilm forming bacteria isolated from tanker trucks have been found to have negative impacts
on raw milk quality (Teh et al., 2011, 2012, 2013), variability in truck sanitation could lead to
sporadic downstream milk quality issues that would be difficult for a company to trace.
4.6 Study Summary
Within this study, extended use of tanker trucks (24 h CIP) did not appear to have a
negative impact on raw milk quality. The results of this study along with a previous study
investigating high frequency hauling, suggests that regardless of how a tanker is used, 24 h of
continuous use can occur without a negative impact on milk quality. Based on the results of our
study, there is not sufficient evidence to suggest the addition of a between load RS treatment
could provide any operational benefit in terms of improved quality. We suggest that industry
instead focus on effective CIP treatments at all manufacturing facilities.
As this study was an initial investigation, its goal was to provide a preliminary look into
the impact of extended duration hauling. Continued research into the impact of commercial
hauling practices is recommended as further investigation utilizing more sensitive test methods
may find relevant impacts that we were unable to detect. Based on the limited scope of our study
and the variability in plant to plant operations, this sole study should not be used as a justification
to reduce cleaning treatments at any individual facility.
4.7 Acknowledgements
We would like to acknowledge the Washington State Dairy Products Commission for
their funding and support in conducting this research. We would also like to acknowledge
57
everyone who supported this trial at the manufacturing plant, hauling company, corporate lab,
and corporate office.
58
4.8 Appendix
Table 4.1 Outline of milk and swab sample location, collection frequency, and analysis method
Sample Location
Frequency
Analysis
Producer Milk
Duplicate samples were collected from every bulk tank
that was loaded into tanker (n=40)
IBC1, TSC2, PI3
Tanker Milk
Duplicate samples were collected from the front and
back trailer of every tanker load that was delivered to
plant (n= 80)
IBC, TSC, PI
Tanker Surface
Swab
Swabs were taken from the front and back trailer
ceiling4 following every load delivered to the plant.
When a cleaning treatment occurred a second set of
swabs were taken before a truck continued on route
(n=74)
APC5
Rinse Water
Samples were taken throughout the study from the CIP
tank or outlet pipe (n=6)
APC
6
7
8
9
10
Individual Bacteria Count : Bactoscan FC
Thermophilic Spore Count
Preliminary Incubation Count: TEMPO
Location of swab sample rotated with every load and before and cleaning treatment
Aerobic Plate Count : Petrifilm
59
Percentage of producer milk samples
100%
90%
80%
70%
60%
50%
IBC
40%
PI
30%
20%
10%
0%
<10,0000
10,000-20,000
cfu/mL
20,000-50,000
Figure 4.1 Producer milk quality. Categorized as percentage of producer milk samples
within individual bacterial count (IBC) and preliminary incubation (PI) most probable
number quality categories (n=20).
60
a. IBC
Difference in IBC
Log cfu/mL
0.5
0.25
0
Rinse and Sanitizer
-0.25
Standard Use
-0.5
0
1
2
Load Number
Difference in PI MPN
Log cfu/mL
b. PI MPN
0.5
0.25
Rinse and
Sanitizer
0
-0.25
Standard Use
-0.5
0
1
2
Load Number
c) TSC
Difference in TSC
Log cfu/mL
0.5
0.25
0
Rinse and Sanitizer
Standard Use
-0.25
-0.5
0
1
2
Load Number
Figure 4.2 Impact of cleaning treatments on tanker microbiological growth. Raw milk
individual bacterial count (IBC) (a), preliminary incubation (PI) most probable number
(MPN) (b), and thermophilic spore count (TSC) (c) results displayed as the average
difference between the tanker and corresponding producer milk across treatments and
each load within 24 h cycle. Rinse and sanitize (RS) treatment was replicated 7 times and
the standard use (SU) treatment was replicated 3 times. Both treatments consisted of 2
loads per 24 h use period with all milk sourced from the same farm.
61
4.5
APC Log cfu/ 900 cm2
4
3.5
3
2.5
2
1.5
Post CIP
1
0.5
0
Pre Rinse and Sanitize
Post Rinse and Sanitize
Figure 4.3 Before and after average surface bacteria count from the rinse and sanitize
(RS) cleaning treatment. Data reported is the average aerobic plate count (APC) of a
soiled tanker before (n=14) and after (n=14) a water rinse and sanitizer treatment as
measured by sponge swab sampling. The dotted line represents the average starting
APC count of a clean tanker post CIP treatment (n= 20).
62
5
Chapter 5- Conclusion
5.1 Research Summary
Controlling milk quality upstream is very important as the value and
quantity of milk increases with each step of the pooling chain (Harding, 1995). Raw milk
quality is critical in producing a high quality finished product as the effects of abuse
cannot be reversed downstream.
Based on this study, both short and long duration hauling practices do
not appear to have a negative impact on raw milk quality based on commonly used
microbial test methods. Thus, our recommendation is to continue current hauling
practices (24 h CIP) as our data does not suggest the addition of incremental cleaning
treatments can improve raw milk quality.
It is important to note that although the incremental treatments did not
significantly improve raw milk quality, we saw no negative impact from their use, and as
it does reduce tanker surface bacteria they could be used as a preventative measure in
situations when a truck will remain empty for an extended period. Although we are not
recommending additional treatments we think focusing on proper cleaning of tanker
trucks and lines should be important for all facilities and location specific investigation
should be done prior to reducing any facilities’ current cleaning practices. We also suggest
focusing on high quality producer milk as the lower bacterial count milk will further
prevent significant growth downstream.
63
5.2 Future Work and Opportunities
Although we are confident in our results, there are limitations to this
study which could have missed quality impacts due to hauling. Impacts could have been
missed due to the limited sensitivity of common microbiological tests or by not
capturing hauling situations that occur outside of the scope of our design. Based on this
we suggest continued hauling research focused on long distance hauling. It is our
hypothesis that long distance hauling is most likely to see issues due to extended
periods of time that a truck could remain empty and soiled. Any future studies
investigating long distance hauling should contain a larger sample size and use more
sensitive test methods focused on detecting downstream milk quality defects. Further
investigation into tanker sanitation, especially focused on the formation of biofilms
within tanks, could provide additional context to the impact of extended use of tanker
trucks between cleaning treatments.
64
Bibliography
Akaike, H. 1973. Information theory as an extension of the maximum likelihood
principle. In Second International Symposium on Informaton Theory. Budapest,
Hungry. 267–281.
Bell, C., P.A. Stallard, S.E. Brown, and J.T.E. Standley. 1994. ATP-bioluminescence
techniques for assessing the hygienic condition of milk transport tankers. Int.
Dairy J. 4:629–640.
Blayney, D., and M.J. Gehlhar. 2006. US dairy at a global crossroads. Econ. Res. Serv.
Rep.
Charles, D. 2014. Inside The Indiana Megadairy Making Coca-Cola’s New Milk.
NPR.org.
Cousin, M.A. 1982. Presence and activity of psychrotrophic microorganisms in milk and
dairy products: a review. J. Food Prot. USA.
Darchuk, E., L. Goddik, and J. Waite-Cusic. In Review. Impact of commercial hauling
practices and tanker cleaning treatments on raw milk microbiological quality. J.
Dairy Sci. Submitted April 25, 2015.
DMI. 2010. U.S. Dairy Sustainability Commitment Progress Report.
Dommett, T.W., L.J. Baseby, and P.A. Wighton. 1980. Influence of tanker cleaning
procedures on bacterial counts of farm milk. Aust. J. Dairy Technol. 35:128–131.
Donlan, R.M. 2002. Biofilms: Microbial Life on Surfaces. Emerg. Infect. Dis. 8:881–890.
doi:10.3201/eid0809.020063.
Dow Plastics. Accessed 2014. Styrofoam Blue Extruded Polystyrene Foam Product
Properties and Applications Guide.
FAO, T. Hemme, and J. Otte. 2010. Chapter 2: Global Dairy Sector: Status and Trends.
In Status and Prospects for Smallholder Milk Production- A Global Perspective.
Food and Agriculture Organization of the United Nations, Rome.
FHWA. 2000. Chapter Three: Truck Fleet and Opperations. US Department of
Transportation. http://www.fhwa.dot.gov/reports/tswstudy/Vol2-Chapter3.pdf
Food and Drug Administration. 2013. Grade “A” Pasteurized Milk Ordinance. U.S
Department of Health and Human Services Public Health Service, Washington,
DC.
Gerlach, R., and M. Sabolic. 1980. Bacteriological examination of milk tankers after
cleaning. Dtsch. Molk.-Ztg. 101:1648–1651.
65
Harding, F. 1995. Hygienic Quality. In Milk Quality. F. Harding, editor. Chapman and
Hall. 40–59.
Hauling Contact. 2014.
Industry Sponsor. 2015.
ISSF. 2010. Stainless Steel in the Dairy Industry. A Sustainable Solution for the Human
Diet. International Stainless Steel Forum. https://www.3a.org/Resource/pdf/Stainless-Steel-in-the-Dairy-Industry.pdf
Karpoff, E., and F.C. Webster. 1984. Innovative methods of milk transport: doublebottoms and TOFC. J.-Northeast. Agric. Econ. Counc. 13:1–60.
Lo, K.H., C.H. Shek, and J.K.L. Lai. 2009. Recent developments in stainless steels.
Mater. Sci. Eng. R Rep. 65:39–104. doi:10.1016/j.mser.2009.03.001.
Luck, H., and B. Lategan. 1979. Hygienic conditions of milk collection tankers. South
Afr. J. Dairy Technol.
MacDonald, J.M., E.J. O’Donoghue, W.D. McBride, R.F. Nehring, C.L. Sandretto, and
R. Mosheim. 2007. Profits, costs, and the changing structure of dairy farming.
US Department of Agriculture, Economic Research Service.
Marchand, S., J. De Block, V. De Jonghe, A. Coorevits, M. Heyndrickx, and L. Herman.
2012. Biofilm Formation in Milk Production and Processing Environments;
Influence on Milk Quality and Safety. Compr. Rev. Food Sci. Food Saf. 11:133–
147. doi:10.1111/j.1541-4337.2011.00183.x.
ODOT. Information about Oregon weight limits.
www.oregon.gov/odot/mct/docs/weight_limits.pdf
Ollinger, M., S.V. Nguyen, D. Blayney, B. Chambers, and K. Nelson. 2005. Structural
change in the meat, poultry, dairy, and grain processing industries. US
Department of Agriculture, Economic Research Service.
Paez, R., M. Taverna, V. Charlon, A. Cuatrin, F. Etcheverry, and DaCosta, L. 2013.
Application of ATP-Bioluminescence Technique for Assessing Cleanliness of
Milking Equipment, Bulk Tank and Milk Transport Tankers. Food Prot. Trends.
23:308–314.
Perry, R., D.W. Green, and J.O. Maloney. 1997. Perry’s Chemical Engineers’ Handbook.
7th ed. McGraw-Hill, New York.
Pinheiro, J., D. Bates, S. DebRoy, D. Sakar, and R-Core Team. 2015. nlme: Linear and
Nonlinear Mixed Effects Models.
66
Progressive Dairyman. 2015. 2014 Dairy Stats. Progressive Dairyman.
http://www.progressivedairy.com/home/about-us/2014-us-dairy-stats
R Development Core Team. 2013. R: A language and environment for statistical
computing. R Foundation for Statistical Computing, Vienna, Austria.
Sharma, J., and J. Mahoney. 1983. Evaluation of present legislation and regulation on tire
sizes, configurations and load limits. University of Washington.
Singh, R.P., R.P. Singh, and D.R. Heldman. 2008. Introduction to Food Engineering.
Academic Press. 864 pp.
Sørhaug, T., and L. Stepaniak. 1997. Psychrotrophs and their enzymes in milk and dairy
products: Quality aspects. Trends Food Sci. Technol. 8:35–41.
doi:10.1016/S0924-2244(97)01006-6.
Stewart, D. 1985. Milk assembly and its effect on the hygienic quality of milk. J. Soc.
Dairy Technol. 38:6–10.
Teh, K.H., S. Flint, J. Palmer, P. Andrewes, P. Bremer, and D. Lindsay. 2012. Proteolysis
produced within biofilms of bacterial isolates from raw milk tankers. Int. J. Food
Microbiol. 157:28–34. doi:10.1016/j.ijfoodmicro.2012.04.008.
Teh, K.H., S. Flint, J. Palmer, P. Andrewes, P. Bremer, and D. Lindsay. 2014. Biofilm −
an unrecognised source of spoilage enzymes in dairy products? Int. Dairy J.
34:32–40. doi:10.1016/j.idairyj.2013.07.002.
Teh, K.H., S. Flint, J. Palmer, D. Lindsay, P. Andrewes, and P. Bremer. 2011. Thermoresistant enzyme-producing bacteria isolated from the internal surfaces of raw
milk tankers. Int. Dairy J. 21:742–747. doi:10.1016/j.idairyj.2011.04.013.
Teh, K.H., D. Lindsay, J. Palmer, P. Andrewes, P. Bremer, and S. Flint. 2013. Lipolysis
within single culture and co-culture biofilms of dairy origin. Int. J. Food
Microbiol. 163:129–135. doi:10.1016/j.ijfoodmicro.2013.02.009.
USDA. 2012. Agricultural Outlook Statistical Indicators. United States Department of
Agriculture. http://www.ers.usda.gov/data-products/agricultural-outlookstatistical-indicators.aspx
USDA. 2014a. USDA Economic Research Service - Food and Beverage Manufacturing.
http://www.ers.usda.gov/topics/food-markets-prices/processingmarketing/manufacturing.aspx
USDA. 2014b. Dairy: World Markets and Trade. United States Department of
Agriculture, Foreign Agricultural Service. http://www.fas.usda.gov/data/dairyworld-markets-and-trade
67
USDEC. 2015. 2014 Annual Export Trade Data. U.S. Dairy Export Council.
https://usdec.org/research-and-data/market-data/us-export-data/historical-data
Ward, N.R. 2013. Collection Broths for Environmental Monitoring Programs.
Watterson, M.J., D.J. Kent, K.J. Boor, M. Wiedmann, and N.H. Martin. 2014. Evaluation
of dairy powder products implicates thermophilic sporeformers as the primary
organisms of interest. J. Dairy Sci. 97:2487–2497. doi:10.3168/jds.2013-7363.
Wehr, H.M., and J.F. Frank. 2004. Standard methods for the examination of dairy
products. 17th ed. American Public Health Association Inc., Washington, DC.
68
Appendices
69
Appendix 1: Neutralization capacity of letheen broth on Mandate Plus Sanitizer which was used in both short haul studies as
described in Chapter 3. Table taken from a study conducted by Ward ( 2013).
Winter Study: 1344-2016PPM
70
Appendix 2 Product information for Sanitizer used in short duration study (chapter 3)
71
Appendix 3 : PMO Cleaning Regulations (Food and Drug Administration, 2013)
APPENDIX F. CLEANING AND SANITIZATION
I. METHODS OF SANITIZATION
CHEMICAL
Certain chemical compounds are effective for the sanitization of milk containers, utensils
and equipment. These are contained in either in 40 CFR 180.940 and shall be used in
accordance with label directions, or ECA device manufacturer’s instructions if produced
onsite in accordance with Section II below.
HOT WATER
Hot water may be used by pumping it through the inlet, if the temperature at the outlet
end of the assembly is maintained to at least 77ºC (170ºF) for at least five (5) minutes.
72
Appendix 4 : Plant Training Materials from Short Distance Study (Chapter 3)
73
Appendix 4 (Continued): Plant Training Materials from Short Distance Study (Chapter 3)
74
Appendix 4 (Continued): Plant Training Materials from Short Distance Study (Chapter 3)
75
Appendix 4 (Continued): Plant Training Materials from Short Distance Study (Chapter 3)
76
Appendix 5 : Lab training materials from short and long distance studies (Chapter 3 & 4)
77
Appendix 5 (Continued): Lab training materials from short and long distance studies
(Chapter 3 & 4)
78
Appendix 5 (Continued): Lab training materials from short and long distance studies
(Chapter 3 & 4)
79
Appendix 5 (Continued): Lab training materials from short and long distance studies
(Chapter 3 & 4)
80
Appendix 6 : Short duration hauling (Chapter 3) normality plots and statistical data.
Winter Study (Plant A)
a) Bactoscan
Fixed effects: log(No.inc) ~ Treatment + Truck + Bacto.pro
Value Std.Error DF t-value p-value
(Intercept)
7.916361 0.1473226 222 53.73488 0.0000
TreatmentSanitize12Hr
0.069246 0.1201320 222 0.57642 0.5649
TreatmentWaterRinse
-0.112091 0.1185226 222 -0.94573 0.3453
TreatmentWaterRinseSanitize12Hr 0.121567 0.1199265 222 1.01368 0.3118
Truck69
0.420909 0.1331034 15 3.16227 0.0064
Bacto.pro
0.000027 0.0000024 222 11.39487 0.0000
81
Appendix 6 (Continued): Short duration hauling (Chapter 3) normality plots and
statistical data. Winter Study (Plant A)
b) Spore
Value Std.Error
(Intercept)
1.8392609 0.20430495
TreatmentSanitize12Hr
0.3848151 0.25364645
TreatmentWaterRinse
-0.5081353 0.24918077
TreatmentWaterRinseSanitize12Hr 0.0817376 0.2461679
Truck69
0.5023921 0.17527928
Spore.pro
0.0107760 0.00150324
DF
t-value p-value
231 9.002527 0.0000
231 1.517132 0.1306
231 -2.039223 0.0426
231 0.332040 0.7402
15
2.866238 0.0118
231 7.168511 0.0000
82
Appendix 6 (Continued): Short duration hauling (Chapter 3) normality plots and statistical data.
Winter Study (Plant A)
c) PI
Value Std.Error DF
t-value p-value
(Intercept)
7.732795 0.3452272 227 22.399146 0.0000
TreatmentSanitize12Hr
0.378229 0.2611312 227 1.448425 0.1489
TreatmentWaterRinse
-0.112709 0.2585698 227 -0.435895 0.6633
TreatmentWaterRinseSanitize12Hr 0.275569 0.2574897 227 1.070213 0.2857
Truck69
0.985073 0.2234377 15 4.408715 0.0005
PI.pro
0.000006 0.0000013 227 4.738891 0.0000
83
Appendix 7 : Short duration hauling (Chapter 3) normality plots and statistical data.
Summer Study (Plant B)
a) Bactoscan
Fixed effects: log(BactoInt) ~ Treatment + Truck
Value Std.Error DF
(Intercept)
8.197488 0.12403491 141
TreatmentRinse
-0.086643 0.14089446 141
TreatmentRinse/Sanitize -0.160976 0.13280923 141
TreatmentSanitize
0.024225 0.13995948 141
Truck3614
-0.022624 0.10221995 13
Bacto.pre
0.000036 0.00000347 141
+ Bacto.pre
t-value p-value
66.09017 0.0000
-0.61495 0.5396
-1.21209 0.2275
0.17308 0.8628
-0.22132 0.8283
10.28341 0.0000
84
Appendix 7 (Continued): Short duration hauling (Chapter 3) normality plots and
statistical data. Summer Study (Plant B)
b) Spore
Fixed effects: log(Spore) ~ Treatment + Truck
Value Std.Error
(Intercept)
3.0596178 0.15971789
TreatmentRinse
0.1748887 0.19490563
TreatmentRinse/Sanitize 0.0003181 0.18354144
TreatmentSanitize
-0.2629891 0.19533057
Truck3614
0.0368233 0.14074663
Spore.pre
0.0080823 0.00139385
+ Spore.pre
DF
t-value p-value
141 19.156387 0.0000
141 0.897299 0.3711
141 0.001733 0.9986
141 -1.346380 0.1803
13 0.261628 0.7977
141 5.798564 0.0000
85
Appendix 7 (Continued): Short duration hauling (Chapter 3) normality plots and
statistical data. Summer Study (Plant B)
c) PI
Fixed effects: log(PI) ~ Treatment + Truck +
Value Std.Error
(Intercept)
7.692741 0.21935058
TreatmentRinse
0.359588 0.26084108
TreatmentRinse/Sanitize -0.057320 0.24542402
TreatmentSanitize
0.005983 0.26094334
Truck3614
-0.387775 0.19383741
PI.Pre
0.000035 0.00000756
PI.Pre
DF t-value p-value
141 35.07053 0.0000
141 1.37857 0.1702
141 -0.23355 0.8157
141 0.02293 0.9817
13 -2.00052 0.0668
141 4.64301 0.0000
86
Appendix 8 : Long duration hauling (Chapter 4) normality plots. Plotted as the difference
between tanker and producer samples in both treatments (All Data)
a. Bactoscan
87
Appendix 8 (Continued): Long duration hauling (Chapter 4) normality plots. Plotted as
the difference between tanker and producer samples in both treatments (All Data)
b. Spore
88
Appendix 8 (Continued): Long duration hauling (Chapter 4) normality plots. Plotted as
the difference between tanker and producer samples in both treatments (All Data)
c. PI
89
Appendix 9 Statistical data for Long duration hauling practices (Chapter 4) impact on
microbial counts (IBC, Spore and PI) over time. Load 1 and Load 2 microbiological
comparison. No significant difference was found between load 1 and 2 within a
treatment. RS= Rinse and Sanitize, SU= Standard Use
IBC Data
Paired t-test
data: IBC.SU.1 and IBC.SU.2
t = -0.6166, df = 2, p-value = 0.6003
alternative hypothesis: true difference in means is not equal to
0
95 percent confidence interval:
-0.9479977 0.7103540
sample estimates:mean of the differences
-0.1188219
Paired t-test
data: IBC.RS.1 and IBC.RS.2
t = 1.4601, df = 6, p-value = 0.1945
alternative hypothesis: true difference in means is not equal to
0
95 percent confidence interval:
-0.05782436 0.22894987
sample estimates:mean of the differences
0.08556275
Spore Data
Paired t-test
data: Spore.SU.1 and Spore.SU.2
t = -0.7825, df = 2, p-value = 0.5158
alternative hypothesis: true difference in means is not equal to
0
95 percent confidence interval:
-0.4917133 0.3403809
sample estimates:
mean of the differences
-0.07566624
Paired t-test
data: Spore.RS.1 and Spore.RS.2
t = 1.3354, df = 6, p-value = 0.2302
alternative hypothesis: true difference in means is not equal to
0
95 percent confidence interval:
-0.1673738 0.5695359
sample estimates:mean of the differences
0.2010811
90
Appendix 9 (Continued): Statistical data for Long duration hauling practices (Chapter 4)
impact on microbial counts (IBC, Spore and PI) over time.
PI Data
Paired t-test
data: PI.SU.1 and PI.SU.2
t = -0.6314, df = 2, p-value = 0.5923
alternative hypothesis: true difference in means is not equal to
0
95 percent confidence interval:
-2.188218 1.628160
sample estimates:mean of the differences
-0.2800289
Paired t-test
data: PI.RS.1 and PI.RS.2
t = 0.6306, df = 6, p-value = 0.5516
alternative hypothesis: true difference in means is not equal to
0
95 percent confidence interval:
-0.3030890 0.5135379
sample estimates:mean of the differences
0.1052244
91
Appendix 10: Statistical data for cleaning treatments (Chapter 4) impact on microbial
counts (IBC, Spore and PI). Demonstrates if there is a difference in tanker bacteria
growth based on cleaning treatment by comparing load 2 across treatments. No
significant treatment effect found when comparing averaged RS and SU data. Rinse=
Rinse and Sanitize (RS), Control= Standard Use (SU)
IBC
Welch Two Sample t-test
data: Control.Bacto and Rinse.Bacto
t = 1.5782, df = 2.548, p-value = 0.2283
alternative hypothesis: true difference in means is not equal to
0
95 percent confidence interval:
-0.3514449 0.9205803
sample estimates:
mean of x mean of y
0.1770694 -0.1074983
Spore
Welch Two Sample t-test
data: Control.Spore and Rinse.Spore
t = -0.4009, df = 4.413, p-value = 0.7071
alternative hypothesis: true difference in means is not equal to
0
95 percent confidence interval:
-0.7776132 0.5750211
sample estimates:
mean of x
mean of y
-0.103298126 -0.002002052
PI
Welch Two Sample t-test
data: Control.PI and Rinse.PI
t = 0.2923, df = 2.531, p-value = 0.7923
alternative hypothesis: true difference in means is not equal to
0
95 percent confidence interval:
-1.451732 1.712744
sample estimates:
mean of x mean of y
0.18745666 0.05695083
92
Appendix 11 : Statistical data for comparing sampling location’s (Chapter 4) impact on
microbial counts (IBC, Spore and PI). Demonstrates if there is a difference in tanker
bacteria growth based by comparing log transformed results of milk taken the front and
back tank. Significant location difference found in RS treatment for IBC and PI. Although
statistically significant practical relevance for industry is unknown. Rinse= Rinse and
Sanitize (RS), Control= Standard Use (SU) Bacto= IBC
Welch Two Sample t-test
data: Back.Control.Bacto and Front.Control.Bacto
t = 0.3562, df = 8.36, p-value = 0.7305
alternative hypothesis: true difference in means is not equal to
0
95 percent confidence interval:
-0.2909884 0.3982653
sample estimates:
mean of x mean of y
3.712967 3.659329
Welch Two Sample t-test
data: Back.RS.Bacto and Front.RS.Bacto
t = 2.6981, df = 21.567, p-value = 0.01328
alternative hypothesis: true difference in means is not equal to
0
95 percent confidence interval:
0.06406026 0.49189716
sample estimates:
mean of x mean of y
3.825204 3.547225
Welch Two Sample t-test
data: Back.Control.Spore and Front.Control.Spore
t = -0.287, df = 9.737, p-value = 0.7802
alternative hypothesis: true difference in means is not equal to
0
95 percent confidence interval:
-0.5831990 0.4505523
sample estimates:
mean of x mean of y
1.209212 1.275535
Welch Two Sample t-test
data: Back.RS.Spore and Front.RS.Spore
t = -0.3213, df = 20.477, p-value = 0.7512
alternative hypothesis: true difference in means is not equal to
0
95 percent confidence interval:
-0.3341031 0.2447911
sample estimates:mean of x mean of y
1.350468 1.395124
93
Appendix 11 (Continued): Statistical data for comparing sampling location’s (Chapter 4)
impact on microbial counts (IBC, Spore and PI).
Welch Two Sample t-test
data: Back.Control.PI and Front.Control.PI
t = -0.8362, df = 8.662, p-value = 0.4255
alternative hypothesis: true difference in means is not equal to
0
95 percent confidence interval:
-0.6663702 0.3082570
sample estimates:
mean of x mean of y
3.786275 3.965331
Welch Two Sample t-test
data: Back.RS.PI and Front.RS.PI
t = 2.0928, df = 23.053, p-value = 0.04757
alternative hypothesis: true difference in means is not equal to
0
95 percent confidence interval:
0.003368085 0.574518286
sample estimates:
mean of x mean of y
4.177677 3.888734
94
Appendix 12 Statistical data comparing sampling location’s (Chapter 4) impact on tanker
sanitation and efficacy based on sponge swabs APC results. a) Comparison of pretreatment APC counts based on sampling location within a treatment and combined
location comparison across treatment (log cfu/900 cm2). No significant difference in pretreatment tanker sanitation found in either tanker location nor between treatments.
b) Comparison of post-treatment APC counts based on sampling location (log cfu/900
cm2) . Significant difference fount in RS but not SU counts. Although statistically
significant practical relevance for industry is unknown. c) Comparison between pre and
post treatment APC counts (combined front and back location) for RS treatment.
Significant difference found showing treatment was effective. d) Comparison between
post RS and CIP swab APC counts. Significant difference showing that RS was not as
effective as CIP in reducing surface counts (log cfu/900 cm2).
Key : Rinse= Rinse and Sanitize (RS), Control= Standard Use (SU) , CIP= Post 24 h Clean in
Place treatment
a)
Welch Two Sample t-test
data: Back.SU.Swab and Front.SU.Swab
t = -1.4963, df = 9.942, p-value = 0.1656
alternative hypothesis: true difference in means is not equal to
0
95 percent confidence interval:
-1.0223846 0.2012977
sample estimates:mean of x mean of y
3.533911 3.944455
Welch Two Sample t-test
data: Back.RS.Swab and Front.RS.Swab
t = -1.5345, df = 19.591, p-value = 0.1409
alternative hypothesis: true difference in means is not equal to
0
95 percent confidence interval:
-0.7908250 0.1209674
sample estimates:mean of x mean of y
3.840846 4.175775
Welch Two Sample t-test
data: Pre.All.SU.Swab and Pre.All.RS.Swab
t = -1.4715, df = 24.503, p-value = 0.1539
alternative hypothesis: true difference in means is not equal to
0
95 percent confidence interval:
-0.6461798 0.1079252
sample estimates:mean of x mean of y
3.739183 4.008310
95
Appendix 12 (Continued) Statistical data comparing sampling location’s (Chapter 4)
impact on tanker sanitation and efficacy based on sponge swabs APC results
b)
Welch Two Sample t-test
data: Post.Back.CIP.Swab and Post.Front.CIP.Swab
t = -1.0885, df = 18, p-value = 0.2908
alternative hypothesis: true difference in means is not equal to
0
95 percent confidence interval:
-1.2583131 0.3994538
sample estimates:
mean of x mean of y
1.186407 1.615836
Welch Two Sample t-test
data: Post.Back.RS.Swab and Post.Front.RS.Swab
t = -3.0743, df = 11.789, p-value = 0.009821
alternative hypothesis: true difference in means is not equal to
0
95 percent confidence interval:
-2.6840396 -0.4549649
sample estimates:
mean of x mean of y
1.890168 3.459670
c)
Welch Two Sample t-test
data: Post.All.RS.Swab and Pre.All.RS.Swab
t = -3.8488, df = 16.096, p-value = 0.001405
alternative hypothesis: true difference in means is not equal to
0
95 percent confidence interval:
-2.067467 -0.599315
sample estimates:
mean of x mean of y
2.674919 4.008310
d)
Welch Two Sample t-test
data: Post.All.RS.Swab and Post.CIP.All.Swab
t = 3.3245, df = 22.209, p-value = 0.00305
alternative hypothesis: true difference in means is not equal to
0
95 percent confidence interval:
0.4796113 2.0679841
sample estimates:
mean of x mean of y
2.674919 1.401121
96
Appendix 13 Microbiological test procedures for a) Preliminary Incubation Most
Probable Number Counts and b) Thermophilic Spore Counts and c) Bactoscan
specification ranges. Procedures taken from corporate laboratory SOP.
a)
Scope
This method is intended for the determination of the Most Probable Number (MPN) in
PI samples.
Definition
Most Probable Number (MPN): The MPN method is an enumeration technique which
allows any microorganisms present in the sample(s), to grow in suitable conditions in
tubes, using a minimum of three dilutions and three tubes per dilution. When the
combination of positive results (growth) is known a mathematical formula can be used
to estimate the most probable number of microorganisms per milliliter or per gram of
sample.
Principles
This method involves the following steps:
1)
Preparation a 1/100 dilution of the sample in phosphate buffer dilution blank
(final dilution volume = 100 ml).
2)
Addition of 1/100 dilution into a TEMPO Total Viable Count (TVC) vial for a final
dilution of 1/4000 (final dilution volume in vial = 4 ml).
3)
Attachment of a TEMPO TVC card corresponding to the initial sample containing
the 1/4000 dilution via TEMPO Filler.
4)
Incubation of cards at 13⁰C for 18h.
5)
Incubation of cards at 32⁰C for 48h.
6)
Reading and validation of cards via TEMPO Reader.
Safety Considerations
A.
MPN is a non-selective enumerative method. As this method is non-selective, one
has to assume that pathogens or opportunistic pathogens can be present. All steps in the
procedure can be performed in the main microbiology laboratory. Good Laboratory
Practice (GLP) must be maintained during all steps in the procedure. The site bio-safety
plan should be referred to for appropriate control of microbiological waste.
B.
Appropriate PPE should be worn. For hazards specific to reagents and chemicals
refer to the relevant Material Safety Data Sheets (MSDS).
97
C.
During the use of the TEMPO Filler and TEMPO Reader, all corresponding racks
should be placed in the correct orientation as to minimize equipment errors and
Appendix 14 Microbiological test procedures for a) Preliminary Incubation Most
Probable Number Counts and b) Thermophilic Spore Counts and c) Bactoscan
specification ranges.
reduce safety risk. Be sure to keep filled cards vertical and do not drop the cards prior
to reading.
D. When autoclaving TEMPO water dispensers/bottles be sure to loosen pump/cap
from the bottle so as to release the pressure formed inside of the bottle which may
result in equipment malfunction and personal safety risk.
Chemicals/Media/Reagents
A.
Dilution Blanks – commercially available ready-to-use plastic single service
dilution blanks.
B.
TEMPO TVC Kit – commercially available TVC media and card kits from
Biomérieux used to conduct MPN method.
a.
Reagents are light and temperature sensitive and should be stored in a cool,
dark area; may be stored at room temperature for up to one week.
b.
TEMPO TVC tests should not be performed past the expiration date indicated on
the label.
C.
Ethyl alcohol: 70%
D.
Distilled Water
Equipment
A.
Autoclave: Capable of raising to temperature within 15 minutes (preferably
within 5 minutes) of starting air exhaust and capable of maintaining 120° ± 1°C.
B.
Balance: Sensitive to at least 0.1 g
C.
Incubators: 32° ± 1°C and 13° ± 1°C
D.
Refrigerator: Range capable from 0° to 4.4°C
E.
TEMPO Preparation Station & TEMPO Reading Station consisting of:
a.
Central processing unit
b.
Monitor
c.
Mini-keyboard
d.
Bar code reader
e.
TEMPO Filler and TEMPO Reader
f.
Vortex
g.
TEMPO Water Dispenser and corresponding 1 L water bottles
h.
Manual or electronic pipettors (1 ml and 100 µl) that conform to APHA
standards
i.
Filling and Incubation/Reading racks
98
Appendix 15 (Continued) Microbiological test procedures for a) Preliminary Incubation
Most Probable Number Counts b) Thermophilic Spore Counts and c) Bactoscan
specification ranges
Method
Preparation of Test Sample
1.
Raw liquid milk products;
a.
Maintain samples and dilutions at 0° to 4.4°C with refrigeration from collection
to completion of analysis
b.
Begin analysis within 48 hours of collecting the sample(s).
c.
Unless otherwise specified, mix liquid samples by shaking 25 times in 7 seconds
with a 1-foot movement.
d.
The interval between the completion of mixing and removing the test portion
must not exceed 3 minutes.
e.
Before opening a sample container, remove all obvious materials that may
cause contaminate the sample from the closure. If necessary, wipe the tops of
unopened sample containers with a sterile cloth/paper towel saturated with 70% ethyl
alcohol.
Preparation of Required Equipment
1.
TEMPO water dispenser
a.
Autoclave water dispensers for every two to three days of use.
i.
Make sure TEMPO water dispensers or caps are loosened from the water
bottles and tubes are separated from the pump component.
b.
Control plating – to be done each time a new TEMPO water dispenser is used.
i.
Prepare a Standard Methods Agar plate by dispensing 2-3 ml of water onto the
plate.
ii.
Let sit for 5 minutes and drain excess liquid before incubating at 32° ± 1°C for 48
hours. Check for growth after the first 24 hours as well.
c.
Calibrate dispenser by making sure that 5 aliquots of water at 3.9 ml is between
18.6 g and 20.4 g, adjusting to make sure the 5 aliquots fall between this range if
necessary.
2.
TEMPO Filler Station
a.
Make sure filler station is empty and the door is closed before powering on.
Self-test will be run at power up (approx. 3 minutes) and once the green light is visible,
use of the machine may begin.
b.
TEMPO preparation station CPU should always be on (automatic backup
happens at 01:00 every day), but should be restarted once a week.
3.
TEMPO Reading Station
a.
Make sure reading station is empty and the door is closed before powering on.
Self-test and lamp warm-up will be run at power up (approx. 15 minutes) and once the
green light is visible, use of the machine may begin.
99
b.
TEMPO reading station CPU should always be on (automatic backup happens at
01:00 every day), but should be restarted once a week.
Appendix 13 (Continued) Microbiological test procedures for a) Preliminary Incubation
Most Probable Number Counts and b) Thermophilic Spore Counts. c) Bactoscan
specification ranges
Procedure
1.
For each required dilution transfer, using both sterile pipettor and tip, pipette 1
ml sample into a 99 ml phosphate buffer dilution blank. If the initial suspension or a
dilution (with the exception of oils) has been left stationary for greater than 3 minutes
prior to preparation of further dilutions or inoculation of
Petri-dishes, mix well by shaking the container through an approximate 1-foot arc 25
times or equivalent.
2.
Open TEMPO prep program on TEMPO prep computer.
3.
Scan sample barcode into TEMPO preparation station CPU using scanner, making
sure the barcode scans in correctly, and confirm sample creation (if needed). If the sample
barcode cannot be read, manually enter it by selecting the keyboard icon to the left of
the screen (hotkey: F8). If the sample barcode is incorrect, highlight the sample and delete
by selecting the trash can icon to the left of the screen (hotkey: F7).
4.
Place TEMPO TVC media vial in the filling rack and dispense 3.9 ml distilled water
from the calibrated TEMPO water dispenser into the vial prior to sample inoculation as to
remove the risk of contaminating the dispenser and hydrate the media.
5.
Using both sterile pipettor and tip, pipette 0.1 ml of the corresponding sample
dilution into the TEMPO TVC media vial with 3.9 ml water, and vortex for 5 seconds to
mix.
6.
Attach TEMPO TVC card by scanning barcode, confirm the creation of the card to
the corresponding sample, and place filling tube in the appropriate sample vial. Be sure
the correct sample is highlighted by the green arrow. If card attachment is incorrect,
highlight the card and delete by selecting the trash can (F7).
7.
Place filling rack into TEMPO filler when the light above the start button is green,
close door, and press start. Remove once light has turned back to green and is blinking
(approx. 3 minutes). After removal of filler rack, be sure to check and make sure any
material that may be caught in the filling station is removed prior to the next round.
8.
Double check to make sure TEMPO TVC card is filled and place in a reading rack.
(Note: Slot 1 is in the back of the tray while slot 20 is the front.) Be sure cards are upright
and barcodes are facing front.
9.
Store at 0° to 4.4°C until ready to incubate at 13° ± 1°C for 18 hours.
10.
Move from 13°C incubator to 32° ± 1°C incubator for 48 hours.
11.
Open TEMPO read program on TEMPO read computer and press F3 to access
main page.
12.
Remove reading rack from 32° incubator and place in TEMPO reading station once
the green light is solid above the start button, close door, and press start.
100
Appendix 13 (Continued) Microbiological test procedures for a) Preliminary Incubation
Most Probable Number Counts and b) Thermophilic Spore Counts. c) Bactoscan
specification ranges
13.
Monitor reading progress on computer screen of TEMPO reading station and reread any cards that could not be read after the first try. Refer to the TEMPO Reading
Station manual for trouble-shooting tips and information on any errors that may occur.
14.
Remove cards from the TEMPO reading station and dispose in a nearby hazardous
waste container.
15.
To validate cards press F5 and press on the filter button on the right side of the
screen. Select a time-frame that encompasses all TEMPO TVC tests to be validated by
selecting the appropriate dates and times. Be sure to select the circles next to ‘tests with
results’ and ‘tests awaiting validation’ and select ‘ok’ at the bottom of the window. Make
sure the box to the left of all the samples is highlighted with a green checkmark (press
‘select all’) and click on the green checkmark icon on the left side of the screen.
References
1.
2.
TEMPO Preparation Station User’s Manual Version B. Biomérieux. Revised 2004.
TEMPO Reading Station User’s Manual Version B. Biomérieux. Revised 2004.
101
Appendix 16 (Continued) Microbiological test procedures for a) Preliminary Incubation
Most Probable Number Counts b) Thermophilic Spore Counts and c) Bactoscan
specification ranges
b)
Scope
This method details the proper procedure for the quantification of spore formers for
dairy products.
Definition
Bacteria that create spores are called spore formers. A spore is a refractile, oval body
formed within bacteria, and is characterized by its resistance to environmental changes,
specifically heat.
II.
F.
G.
H.
I.
Equipment
Incubators: 55° ± 1°C
Pipets or pipettors that conform to APHA standards
Water baths: 80°C
Ice Bath
Procedure
Pipette 5mL of sample into empty, autoclaved 10 mL test tube
For test code 72 (SMEDP) place test tube rack in an 80°C water bath for 12
minutes
Place the test tubes in an ice water bath for 10 minutes
Aseptically pipette sample into sterile petri dish
Pour 15mL of the appropriate agar into each petri dish and swirl the petri dish
until it is uniformly mixed. Use standard method agar. Let media solidify.
References
Wehr M. H., Frank J. F. Standard Methods For the Examination of Dairy Products 17th
edition. 2004. American Public Health Association. Washington DC pgs 239-242.
102
Appendix 13 (Continued) Microbiological test procedures for a) Preliminary Incubation
Most Probable Number Counts b) Thermophilic Spore Counts and c) Bactoscan
specification ranges