1
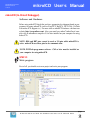
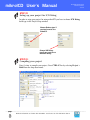
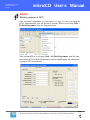
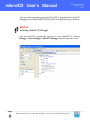
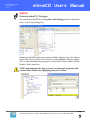
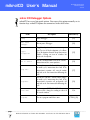
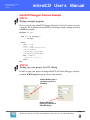
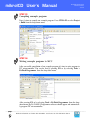
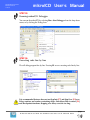
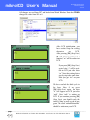
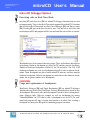
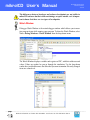
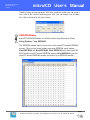
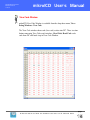
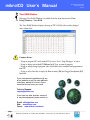
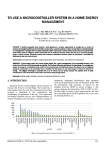
SOFTWARE AND HARDWARE SOLUTIONS FOR THE EMBEDDED WORLD
MikroElektronika
mikro
Development tools - Books - Compilers
ICD
IN-CIRCUIT
DEBUGGER
mikroICD
User’s Manual
mikroICD is highly effective tool for Real-Time debugging on hardware
level. mikroICD debugger enables you to execute a program on host PIC
microcontroller and view variable values, Special Function Registers
(SFR), memory and EEPROM as the program is running.
In this simple tutorial, we will create a new project, write some code, compile it, and test the results with mikroICD. Our project will write
“mikroElektronika” on LCD, so it can be easily tested on any PIC.
Software and Hardware
solutions for Embedded World
MikroElektronika
Development
tools
mikroICD User’s Manual
mikroICD (In-Circuit Debugger)
Software and Hardware
Before using mikroICD check that you have appropriate development board or programmer for using mikroICD (such as EasyPIC4, BigPIC4, PICPLC8A, PicFlash
with mikro ICD support etc.). For more info on mikroICD hardware checkout our
website http://www.mikroe.com/. Also, you must have mikroC/mikroPascal compiler v6.0 or mikroBasic compiler v5.0 or later installed on your computer for using
mikro ICD.
NOTE: RB6 and RB7 pins cannot be used as I/O pins while mikroICD is
active. mikroICD uses those pins for its communication.
NOTE: PICFlash programmer software v7.02 or later must be installed on
your computer for using mikroICD.
STEP 01:
Write program
mikro
First of all, you should create new project and write your program.
ICD
IN-CIRCUIT
DEBUGGER
page
MIKROELEKTRONIKA SOFTWARE AND HARDWARE SOLUTIONS FOR THE EMBEDDED WORLD
2
mikroICD User’s Manual
MikroElektronika
Development
tools
STEP 02:
Seting up your project for ICD Debug
In order to setup your project for using mikroICD you have to choose ICD Debug
build type in the Project Setup window.
Choose Release type if
you don’t want to use
mikroICD.
Choose ICD Debug
type if you want to use
mikroICD debug.
STEP 03:
Compiling your project
page
3
MIKROELEKTRONIKA SOFTWARE AND HARDWARE SOLUTIONS FOR THE EMBEDDED WORLD
mikro
Now it’s time to compile your project. Press CTRL+F9 or by selecting Project >
Build from the drop-down menu.
ICD
IN-CIRCUIT
DEBUGGER
MikroElektronika
Development
tools
mikroICD User’s Manual
STEP 04:
Writing program to MCU
After successful compilation of your project it’s time to write your program
to PIC microcontroller. You can do that by pressing F11 or by selecting Tools >
PicFlash Programmer from the drop-down menu.
mikro
After pressing F11 or by selecting Tools > PicFlash Programmer from the dropdown menu, the PicFLASH 2 Programmer software should appear and automatically program PIC microcontroler.
ICD
IN-CIRCUIT
DEBUGGER
page
MIKROELEKTRONIKA SOFTWARE AND HARDWARE SOLUTIONS FOR THE EMBEDDED WORLD
4
mikroICD User’s Manual
MikroElektronika
Development
tools
After successful programming you can check if PIC is programmed for mikroICD
debugging, by verifying that RB7 LED (EasyPIC4 development board) is turned on.
STEP 05:
Selecting mikroICD Debugger
page
5
MIKROELEKTRONIKA SOFTWARE AND HARDWARE SOLUTIONS FOR THE EMBEDDED WORLD
mikro
After successful PIC programming you have to select mikroICD by selecting
Debugger › Select Debugger › mikroICD Debugger from the drop-down menu.
ICD
IN-CIRCUIT
DEBUGGER
MikroElektronika
Development
tools
mikroICD User’s Manual
STEP 06:
Running mikroICD Debugger
You can run the mikroICD by selecting Run › Start Debugger from the drop-down
menu, or by clicking Debug Icon.
Starting the mikroICD makes more options available: Step Into, Step Over, Run to
Cursor, Step Out. Line that is to be executed is color highlighted (blue by default).
There is also notification about program execution and it can be found on Watch
Window (yellow status bar).
mikro
NOTE: Some functions take time to execute, so running the program is indicated on Watch Window by highlighting status bar in yellow.
ICD
IN-CIRCUIT
DEBUGGER
page
MIKROELEKTRONIKA SOFTWARE AND HARDWARE SOLUTIONS FOR THE EMBEDDED WORLD
6
mikroICD User’s Manual
MikroElektronika
Development
tools
mikro ICD Debugger Options
mikroICD has several integrated options. You can use this options manually or via
function keys. mikroICD options are summarized in the table below:
Name
Description
Function Key
Debug
Starts Debugger.
[F9]
Run/ Pause
Debugger
Run or pause Debugger.
[F6]
Toggle
Breakpoints
Toggle breakpoint at the current cursor position. To view all the breakpoints, select Run ›
View Breakpoints from the drop-down menu.
Double clicking an item in window list
locates the breakpoint.
[F5]
Run to cursor
Execute all instructions between the current
instruction and the cursor position.
[F4]
Step Into
Execute the current C / Pascal / Basic (single–
or multi–cycle) instruction, then halt. If the
instruction is a routine call, enter the routine
and halt at the first instruction following the
call.
[F7]
Flush RAM
Step Out
Executes program until first return
[F8]
N/A
[CTRL]+[F8]
page
7
MIKROELEKTRONIKA SOFTWARE AND HARDWARE SOLUTIONS FOR THE EMBEDDED WORLD
mikro
Step Over
Execute the current C / Pascal / Basic (single–
or multi–cycle) instruction, then halt. If the
instruction is a routine call, preform the call
and halt at the first instruction following the
call.
Flushes current PIC RAM. All RAM memory
values will be changed according to values in
the watch window.
ICD
IN-CIRCUIT
DEBUGGER
MikroElektronika
Development
tools
mikroICD User’s Manual
mikroICD Debugger Practical Example
STEP 01:
Writing example program
Here is a step by step mikroICD Debugger Example. First of all, you have to write
a program. We will show how mikroICD works using a simple example written in
mikroBasic compiler:
program LCD_demo
dim text as string[20]
i as byte
main:
PORTD = $00
TRISD = $00
text = "mikroElektronika"
Lcd_Init(PORTD)
Lcd_Cmd(LCD_FIRST_ROW)
Lcd_Cmd(LCD_CURSOR_OFF)
for i=0 to 16
Lcd_Chr(1,i,text[i])
next i
end.
STEP 02:
Setting up your project for ICD Debug
In order to setup your project for using mikroICD (In-Circuit Debugger) you have
to choose ICD Debug build type in Project Setup window.
Choose Release type if
you don’t want to use
mikroICD.
mikro
Choose ICD Debug
type if you want to use
mikroICD debug.
ICD
IN-CIRCUIT
DEBUGGER
page
MIKROELEKTRONIKA SOFTWARE AND HARDWARE SOLUTIONS FOR THE EMBEDDED WORLD
8
mikroICD User’s Manual
MikroElektronika
Development
tools
STEP 03:
Compiling example program
Now it’s time to compile our example program. Press CTRL+F9 or select Project
> Build from the drop-down menu.
STEP 04:
Writing example program to MCU
After successful compilation of our example program it’s time to write program to
PIC microcontroller. You can do that by pressing F11 or by selecting Tools >
PicFlash Programmer from the drop-down menu.
page
9
MIKROELEKTRONIKA SOFTWARE AND HARDWARE SOLUTIONS FOR THE EMBEDDED WORLD
mikro
After pressing F11 or by selecting Tools > PicFlash Programmer from the dropdown menu, the PicFLASH 2 Programmer software should appear and automatically program PIC microcontroller.
ICD
IN-CIRCUIT
DEBUGGER
MikroElektronika
Development
tools
mikroICD User’s Manual
STEP 05:
Running mikroICD Debugger
You can run the mikroICD by selecting Run › Start Debugger from the drop-down
menu, or by clicking the Debug Icon.
STEP 06:
Executing code line by line
We will debug program line by line. Pressing F8 we are executing code line by line.
mikro
It is recommended that user does not use Step Into [F7] and Step Over [F8] over
Delays routines and routines containing delays. Instead use Run to cursor [F4]
and Breakpoints functions. Stepping over delays can take too long.
ICD
IN-CIRCUIT
DEBUGGER
page
MIKROELEKTRONIKA SOFTWARE AND HARDWARE SOLUTIONS FOR THE EMBEDDED WORLD
10
mikroICD User’s Manual
MikroElektronika
Development
tools
All changes are read from PIC and loaded into Watch Window. Note that TRISD
changed its value from 255 to 0.
mi
mik
If you press [F8] (Step Over)
again, letter “i” will be written on LCD just after letter
“m”. Note that writing letters
step by step takes some time.
Now you got “mi” on your
LCD.
We have reached the third cycle in
for loop. Now, if we press
[F8] (Step Over) again , the letter
“k” will appear on LCD just after
“mik”. Now “mik” is written on
LCD. If you continue pressing [F8]
(Step Over) you should reach the
end of if loop, as well as end of program. The word “mikroElektronika”
should be written on your LCD.
page
11
MIKROELEKTRONIKA SOFTWARE AND HARDWARE SOLUTIONS FOR THE EMBEDDED WORLD
mikro
m
After LCD initialization, you
have reached loop for writing
characters
on
LCD.
After pressing [F8] (Step Over)
on Lcd_Chr(1,i,text[i-1])
function, “m” will be written on
LCD.
ICD
IN-CIRCUIT
DEBUGGER
MikroElektronika
Development
tools
mikroICD User’s Manual
mikro ICD Debugger Options
Executing code in Real-Time Mode
Step Into [F7] and Step Over [F8] are mikroICD debugger functions that are used
in stepping mode. There is also Real-Time mode supported by mikroICD. Functions
that are used in Real-Time mode are Run/ Pause Debugger [F6] and Run to cursor
[F4]. Pressing F4 goes to the line selected by user. User just has to select line with
cursor and press F4, and program will be executed until the selected line is reached.
Breakpoints have been separated into two groups. There are hardware and software
break points. Hardware breakpoints are placed in PIC and they provide fast debug.
Number of hardware breakpoints is limited (1 for P16 and up to 3 for P18). If all
hardware brekpoints are used, new breakpoints that will be used as software breakpoints. Those breakpoints are placed inside mikroICD software, and they simulate
hardware breakpoints. Software breakpoints are much slower then hardware breakpoints, due to greater number of sw breakpoints.
OVERVIEW:
Usage and explanation of breakpoints
mikro
Run(Pause) Debugger [F6] and Toggle Breakpoints [F5] are mikroICD debugger
functions that are used in Real-Time mode. Pressing F5 marks line selected by user
for breakpoint. F6 executes code until a breakpoint is reached. After reaching breakpoint, debugger halts. With our example we will use breakpoints for writing
"mikroElektronika" on LCD char by char. A breakpoint is set on LCD_Chr command and program will stop everytime this function is reached. After reaching a
breakpoint we must press F6 again for continuing program execution.
ICD
IN-CIRCUIT
DEBUGGER
page
MIKROELEKTRONIKA SOFTWARE AND HARDWARE SOLUTIONS FOR THE EMBEDDED WORLD
12
mikroICD User’s Manual
MikroElektronika
Development
tools
The differences between hardware and software breakpoints are not visible in
mikroICD software but their different timings are quite notable, so it is important to know that there are two types of breakpoints.
Watch Window
Debugger Watch Window is the main debugger window which allows you to monitor program items while running your program. To show the Watch Window, select
View › Debug Windows › Watch Window from the drop-down menu.
page
13
MIKROELEKTRONIKA SOFTWARE AND HARDWARE SOLUTIONS FOR THE EMBEDDED WORLD
mikro
The Watch Window displays variables and registers of PIC, with their addresses and
values. Values are updated as you go through the simulation. Use the drop-down
combo box to add and remove the items that you want to monitor. Recently changed
items are colored red.
ICD
IN-CIRCUIT
DEBUGGER
MikroElektronika
Development
tools
mikroICD User’s Manual
Double clicking an item opens the Edit Value window in which you can assign a
new value to the selected variable/register. Also, you can change view to binary,
hex, char, or decimal for the selected item.
EEPROM Window
mikroICD EEPROM Window is available from the drop-down menu, View ›
Debug Windows › View EEPROM.
mikro
The EEPROM window shows current values written into PIC internal EEPROM
memory. There are two action buttons concerning EEPROM watch window Flush EEPROM and Read EEPROM. Flush EEPROM writes data from EEPROM window into PIC internal EEPROM memory. Read EEPROM reads data
from PIC internal EEPROM memory and loads it up in EEPROM window.
ICD
IN-CIRCUIT
DEBUGGER
page
MIKROELEKTRONIKA SOFTWARE AND HARDWARE SOLUTIONS FOR THE EMBEDDED WORLD
14
MikroElektronika
Development
tools
mikroICD User’s Manual
View Code Window
mikroICD View Code Window is available from the drop-down menu, View ›
Debug Windows › View Code.
mikro
The View Code window shows code (hex code) written into PIC. There is action
button concerning View Code watch window - Read Code. Read Code reads
code from PIC and loads it up in View Code Window.
ICD
IN-CIRCUIT
DEBUGGER
page
MIKROELEKTRONIKA SOFTWARE AND HARDWARE SOLUTIONS FOR THE EMBEDDED WORLD
15
mikroICD User’s Manual
MikroElektronika
Development
tools
View RAM Window
Debugger View RAM Window is available from the drop-down menu, View ›
Debug Windows › View RAM.
The View RAM Window displays the map of PIC’s RAM, with recently changed
items colored red.
Common Errors
- Trying to program PIC while mikroICD is active. Press ”Stop Debugger” to solve.
- Trying to debug with mikroICD Release build Type version of program.
- Trying to debug changed program code which hasn't been compiled and programmed
into PIC.
- Trying to select line that is empty for Run to cursor [F4] and Toggle Breakpoints [F5]
functions.
If you are experiencing problems with any
of our products or you just want additional
information, please let us know. We are
committed to meet every your need.
Technical Support :
[email protected]
If you have any other question, comment
or a business proposal, please contact us:
page
16
MIKROELEKTRONIKA SOFTWARE AND HARDWARE SOLUTIONS FOR THE EMBEDDED WORLD
mikro
E-mail: [email protected]
Web: www.mikroe.com
Forum: www.mikroe.com/forum/
ICD
IN-CIRCUIT
DEBUGGER