1
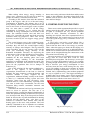
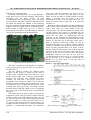
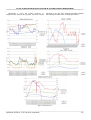
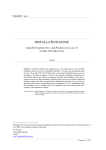
THE WELDING TECHNOLOGY INFLUENCE ON THE DOUBLE T GIRDER BEAMS BUCKLING (Paper Title)
TO USE A MICROCONTROLLER
MICROCONTROLLER SYSTEM IN A HOME
HOME ENERGY
MANAGEMENT
Eng. L. Dan MILICI, PhD1, Eng. Bert KINT2,
Eng. Cristine VanLARE, PhD2, Eng. Mariana MILICI, PhD1
1
”Stefan cel Mare” University of Suceava, Romania,
2
KAHO Sint-Lieven Gent, Belgium,
REZUMAT.
REZUMAT. O politică energetică bună implică o bună gestionare a surselor regenerabile de energie sau un control al
consumului energetic astfel încat să
să minimizăm consumurile.
consumurile. Lucrarea prezintă un sistem de dezvoltare ce implementează
un management al energiei întrîntr-o locuinţă individuală,
individuală, sistem care poate fi extins ulterior pentru blocuri de apartamente.
apartamente.
Acest sistem poate fi integrat în timpul construcţ
construcţiei sau în lucrări de renovare.
renovare. Primul pas este de a economisi energie,
energie,
pentru a reduce cererea.
cererea. Principalul avantaj este reducerea cheltuielilor deoarece timpul de amortizare a investiţ
investiţiilor de
bază este de cele mai multe ori scurt.
scurt.
Cuvinte cheie: management energetic, energie regenerabila, sistem fotovoltaic, microsistem de monitorizare.
ABSTRACT. A good energy policy
policy can involve several things, like a good management of the renewable sources or the
control from the heat with as less energy as possible. That’s where this paper goes about, the developing of a management
system for energy in an individual house, which can be extended later for apartment blocks. This system can be integrated
during the construction or the renovation from a dwelling. The first step is to not spoil energy, to reduce the demand of
energy. The biggest advantage is probably that a lot of money
money can be saved, because the payback time of basic
investments is -most of the timestimes- short, that’s nice with the rising energy prices!
Keywords: building, design, flexibility, structures components (Maximum 1 rând)
1. INTRODUCTION
Romania has the second biggest energy intensity of
Europe, this is due to several things. The country has a
large burden from the past, the communist government
invested a minimum in the construction and
maintenance of apartments in the city. This implicated
low-budget materials and no new implementations of
modern techniques and nowadays it results in aging of
equipment, antiquated technologies, high operation
costs and a high burden for the environment. After 1989
the government took measures, as proven by the
numbers from the ODEX as shown in figure 1. The
energy intensity decreased from 1996 to 2005 by 26%.
On first sight, it seems a great improvement, but later
on in this paper there will be explained why it isn’t such
an amazing number. [1]
Fig. 1. Consumption energy in Europe between 1999 and 2009 [1]
_____________________________________________________________________________________
Buletinul
AGIR nr. 4/2012 ● octombrie-decembrie
1
Buletinul AGIR nr. 3/2013 ● iulie-septembrie
231
INT. SYMPOSIUM
SYMPOSIUM ON
ON ELECTRICAL
ELECTRICAL ENGINEERING
ENGINEERING AND
AND ENERGY
ENERGY CONVERTERS
CONVERTERS –
– ELS
ELS 2013
2013
_____________________________________________________________________________________
INT.
When talking about energy, energy intensity or
energy users, consumers can be split up in three big
groups: the industry, residential and rest sector.
According to the statistics from 2009 the industrial
group is the biggest, with 43.3% of the total energy
consumption in Romania. The industry has a lot of
heavy industry with the chemical & petrochemical and
iron & steel sector as the two biggest sectors, together
they use more than a quarter of all the energy
consumption in Romania, so it’s evident that big
reductions in energy consumption can be made in this
sector. The reduction between 1996 and 2005 was
nearly 17%, especially the textile and food processing
industries made big progresses. There were no big
decreases recorded by the two biggest energy groups.
[2]
The second biggest sector is the residential sector,
thus a lot of reduction possibilities exists. Although,
nowadays they still have the second highest energy
intensity of Europe, after Bulgaria. The big reduction
seems incredible, but it’s not; because 1996 was the
worst year considering energy intensity in the
Romanian households. Measures for improving the
performances of the existing buildings have been taken,
a few are given in the next sentence. Improved
standards for the new dwelling places have been
developed, energy labelling of the households
appliances, as mentioned in the introducing article. The
elimination of subsidies and increases of the energy
prices for the population have led to changes in
behaviour. [4]
One of the solutions for the ancient technologies which is also applied- is the installation of
cogeneration, dimensioned on the heat or electrical
demand. The most common is when the heating -and
electrical demand is partly supplied by the
cogeneration, additional heating -usually in the winteris done by a traditional heating system and extra
electricity comes from the grid. Obviously, every
situation must be viewed individually, especially when
you want to make large investments, but the most
important thing remains sustainable materials and
insulation! [3]
Sometimes the national and local governments join
forces to invest in projects. The first one is as
mentioned earlier, concerns the thermal rehabilitation of
about 300 apartment buildings in Bucharest, this project
was developed with help of the European Investment
Bank. In Suceava the city hall rehabilitated his heating
network and the thermal units. Also there is the
intention to modernize three thermal units and the
heating pipes in the areas with problems. The local
authority’s launched in 2011 a dispatcher to coordinate
the automated thermal units in order to manage and
detect more easily problems with the heat and hot water
supply to the population. Nowadays almost half of the
thermal units in Suceava have been modernized with
state and local budget.
2. STARTING POINT FOR THE STUDY
There are two main arguments that provide in a good
starting point for the study. The first one is the creation
of space to reconstruct the very ancient apartment
blocks in cities. Therefore movements to other
dwellings are required, inter alia to apartment blocks or
individual houses. The second reason is if can be saved
a lot with a good energy policy, estimated to 45-50 % in
2009. [5]
A good policy can involve several things, like a
good management of the renewable sources or the
control from the heat with as less energy as possible.
That’s where this paper goes about, the developing of a
management system for energy in an individual house,
which can be extended later for apartment blocks. This
system can be integrated during the construction or the
renovation from a dwelling. [6]
The trias energetica is a beautiful concept, the fossil
energy must be saved until there exists no other
possibility then using them. The first step is to not spoil
energy, to reduce the demand of energy. For example
by using enough insulation or by using smart tools that
help to decrease your energy consumption. It isn’t
necessary that the heat works during the day when
you’re out working or when you’re sleeping. In ancient
apartment buildings temperatures of 25°C are easily
reached, but by implementing some modern equipment
it’s easy to regulate to 21°C. The biggest advantage is
probably that a lot of money can be saved, because the
payback time of basic investments is -most of the timesshort, that’s nice with the rising energy prices! [5]
Fig. 2. Trias Energetica [5]
_____________________________________________________________________________________
Buletinul AGIR nr. 4/2012 ● octombrie-decembrie
2
Buletinul AGIR nr. 3/2013 ● iulie-septembrie
232
THE WELDING
INFLUENCE ON
THE DOUBLE
T GIRDER
BEAMS
BUCKLING (Paper Title)
_____________________________________________________________________________________
TO TECHNOLOGY
USE A MICROCONTROLLER
SYSTEM
IN A HOME
ENERGY
MANAGEMENT
The second step -in the trias energetica- is to use
renewable energy, in the model where we work around
are three sources available: a windmill, photovoltaic
panels and a solar collector. The first one is not
appropriate when you want to build with an eye view
on your wallet, because of its high investment cost and
a long payback period. Although it’s worthwhile to
mention that Romania has the biggest wind potential all
over Western Europe and comes with its Dorbrogea
Region on the second place of whole Europe, so
actually in this region it’s worthwhile to investigate the
payback time of such an investment. The photovoltaic
panels should provide, together with the windmill, the
electrical demand of the dwelling, whether or not turned
off the grid. In the model there is a battery pack
available, so the assumption is made that the house is
not connected with the grid, thus the house must
provide itself from electrical energy. Although it must
be said that the investment in an autonomous system is
more expensive because it includes inter alia a battery
package and charge controller. The solar boiler is used
to provide the house from hot water, as well for sanitary
as for heating. [5]
3. EXPERIMENTAL TESTS
As shown on figure 3, the house contains a solar
collector, three photovoltaic panels and a windmill. Six
temperature sensors are integrated and the voltages
generated by the PV-panels and windmill are readable
via pins where a flat cable can attach on. The house also
contains two batteries, actually they’re not required to
let the house work properly. In total there are five
LED’s, from which two attached on the house itself.
The three LED’s on the floor (in front of the windmill)
can light up in green or red.
Fig. 3. The house
First of all we made the hypothesis that the house is
very good insulated, conform the trias energetica:
reducing the demand of energy. Most of the times there
is on new, so good insulated, constructions under floor
heating, therefore the house is divided in three areas
that can be individual heated. This means there are
three circulators, accompanied by three valves, to pump
the heating water around in the right circuit. Each sector
in the house has his own temperature measurement. A
fourth temperature measurement is done in the solar
collector itself. The solar boiler has to provide in the
first heating needs. If the boiler no longer can provide
in the heating demand of the house the additional boiler
on gas helps to heat. The last two temperature
measurements - the exterior temperature and the
temperature in the verandah - are just only for
information, they are not involved in the algorithm to
have a good energy policy in the house.
Next to all these temperature measurements, two
voltages are read out: from the PV-panels and from the
wind mill. For studying the electrical part of the house,
we must make a clear difference between on-grid and
off-grid systems. In general, an off-grid system needs
an (expensive) battery pack. Hereby the battery pack is
fed from the solar panels and windmill, the house is
provided from electricity via the batteries. The
installation according to an on-grid system is more
simple and cheaper. The batteries are not necessary and
the choice from the windmill will be different.
There is one kind of output: LED’s. LED’s on the
house and LED’s on the BIGPIC4-panel. The LED’s on
the house indicate several things directed to the sensors,
sometimes they also appear as actuator.
Each temperature sensor in front of the windmill,
that function as a sensor from a circuit, has one LED
that can light up into two colours. Red means that it’s
too cold in the area and that the heating has to work,
when the LED’s illumine green it’s warm enough in the
room.
On the house itself are two LED’s. An orange one to
indicate if the wind delivers enough energy to provide
the house from electricity, the yellow one to indicate
when the PV-panels deliver enough energy. Both
LED’s pink when both energy supplies are not
sufficient for the electricity supply, then the batteries
supply the house from electricity.
BigPIC4 it’s a full-featured development board for
Microchip PIC microcontrollers. It has been designed to
allow students and engineers to easily exercise and
explore the capabilities of PIC microcontrollers. It
allows the microcontroller to interface with external
circuits, allowing the user to concentrate on software
development. In this project is used analog inputs,
digital outputs, the 2x16 LCD display, the buttons and
the SD card. Other features are the PS/2 connection, 2
_____________________________________________________________________________________
Buletinul AGIR nr. 4/2012 ● octombrie-decembrie
3
Buletinul AGIR nr. 3/2013 ● iulie-septembrie
233
INT. SYMPOSIUM
SYMPOSIUM ON
ON ELECTRICAL
ELECTRICAL ENGINEERING
ENGINEERING AND
AND ENERGY
ENERGY CONVERTERS
CONVERTERS –
– ELS
ELS 2013
2013
_____________________________________________________________________________________
INT.
RS232 ports, USB-connection…
Following indicating LED’s are on the BIGPIC4board, they’re more or less the actuators. Three LED’s
(according with the three circuits) for each
circulator/pump and accompanying valve. According
the stand of the switch that is indicated with the LED on
the board, the batteries are whether or not recharging
from the windmill and photovoltaic panels. Recharging
happens when the voltage from the windmill and PVpanel together is higher than e.g. 2.5V. A LED for
when the gas boiler has to work, this happens when the
solar boiler cannot support the heating demand.
same story with the postscaler. The project uses a
postscaler from 1:10 and a prescaler from 1:16, that
makes 16us for one pulse. A fourth variable is created,
subsec, it increases every 250 pulses, 250 is the
configuration of PR2. So every subsec takes 4ms. To
make one second, subsec (=4ms) has to be increased
250 times: 1s.
Beneath are shown the register for the configuration
of the scalers and the schematic representation from the
scalers, both come out of the manual of the PIC
18Fxx20 series. The first one handles the settings of the
T2CON register, this register is important for the
configuration of the prescaler and postscaler. Figure 6
shows how the scalers are implemented into the
controller. In the following the determination of the
parameter-word for T2CON is explained with aid of the
manual; it’s the only case in the paper where such a
thing is described extensively, further on will be
referred to the annex. Let’s continue working with the
example of 40 MHz, in the project are used a prescaler
from 1:16 and a postscaler from 1:10. Figure 5 shows
that bit7 of the T2CON-register is not used, the third till
sixth (T2OUTPx) bit are reserved for the postscaler, in
this case (1:10) we have to fill in 1001, the second
(TMR2ON) must be zero and the two first bits
(T2CKPS) must have the value 1x (x = doesn’t matter)
for the prescaler of 1:16. Adding all previous bits
together we get 0100 101x, or 4A (also 4B) in
hexadecimal code. [8]
Fig. 4. bigPIC4 development board [7]
The timer is essential to make periods of 15 minutes,
every period a signal is given to write a set of values to
the SD-Card. [7]
The PIC 18F8520 contains five different timer
modules. In this project is chosen for the timer 2
module. Timer 2 contains inter alia an 8-bit (28 = 256)
period register (PR2) and a software programmable
prescaler and postscaler. The algorithm uses three
variables: sec, min and a flag. Every second sec
increments, if sec reaches the value of 60, it will reset
himself (to restart counting) and increments min. Every
15 minutes the flag is set high and min resets to restart
counting. Each cycle (great order is less than 1 second)
the main checks if the flag is high, in case of a high flag
the write action to the SD-card occurs, afterwards the
flag resets.
The hardest part is to make exactly one second, the
explanation is done with an example. Suppose that the
oscillator works at 40 MHz, then takes each cycle 25
ns. The timer modules work with the frequency divided
by four (10 MHz), so a clock cycle takes 100 ns or 0.1
us. The prescaler and postscaler are a kind of delays, for
example with the prescaler on 1:2 (and the assumption
that PR2 = 1) an interrupt will appear every 200ns, the
Fig. 5. Configuration of the scalers for T2CON register. [8]
Fig. 6. Schematic representation of the timer 2 module and its
delays. [8]
_____________________________________________________________________________________
Buletinul AGIR nr. 4/2012 ● octombrie-decembrie
4
Buletinul AGIR nr. 3/2013 ● iulie-septembrie
234
THE WELDING
INFLUENCE ON
THE DOUBLE
T GIRDER
BEAMS
BUCKLING (Paper Title)
_____________________________________________________________________________________
TO TECHNOLOGY
USE A MICROCONTROLLER
SYSTEM
IN A HOME
ENERGY
MANAGEMENT
Hereunder is given the syntax necessary to
implement the timer in the program. The main creates
interrupts every 4ms. The interrupt procedure handles
the counting of subseconds, seconds and minutes.
Fig. 7. Experimental data
_____________________________________________________________________________________
Buletinul AGIR nr. 4/2012 ● octombrie-decembrie
5
Buletinul AGIR nr. 3/2013 ● iulie-septembrie
235
INT. SYMPOSIUM
SYMPOSIUM ON
ON ELECTRICAL
ELECTRICAL ENGINEERING
ENGINEERING AND
AND ENERGY
ENERGY CONVERTERS
CONVERTERS –
– ELS
ELS 2013
2013
_____________________________________________________________________________________
INT.
It’s almost impossible to perform tests with the setup
of the example house, therefore different reasons are
responsible. The temperature sensors for the three
circuits stand physical next to each other, so it’s hard to
change the temperature of one circuit without changing
the other temperatures. A second reason is that the solar
collector is not heating up like a real one is supposed to
do, also another measurement for the heated water from
a collector should be done in the boiler. A third reason
is that the verandah temperature goes easily to 50°C and
more, this is due the material (plastic). Another reason
is that if it was possible to have high temperatures with
the boiler and a circuit needs heating water, then the
algorithm decides that first the hot water has to be taken
out of the boiler (collector). Then the temperature in the
boiler/collector should decrease, but here it’s quite
impossible to simulate this circumstance. The most
important reason is that you’re not able to accompany
the setup for instance 48 hours, so all the temperature
measurements will be approximately the same,
especially the exterior temperature and the three circuits
because they’re standing next to each other, also there
will be never wind… at least you don’t make it
yourself.
Even if you try to do some tests, it’s designated that
you change the sampling time, for example from 15
minutes to 5 seconds. This change is easy performed by
changing the syntax in mikroBasic, one “minute” only
takes 5 seconds and every 1 “minute” a sample is
recorded.
Figure 7 comes from a measurement outside, it only
confirms what is discussed above. Within a few minutes
the verandah temperature goes to more than 50°C. It
confirms that performing tests are quite impossible.
4. CONCLUSIONS
As mentioned already earlier, the concept of such
systems is good, so it’s worthwhile for further study.
For example you can design a very cheap modal to
commercialize with power measurements, this was
discussed in the previous paragraph. Also would it be
easy if you could insert schedules for programming the
desired temperatures in each circuit, for example for
during the night. Another proposal could be to make the
existing program more ingenious, for instance with the
input of a keyboard through PS/2 connection, a live
stream through USB-wire, additional temperature
measurements whereat you can chose the amount of
circuits (areas in the house) you can use. The last idea is
also a good proposal for the commercialization of the
project, so you are able to insert the amount of circuits
from the house. Another proposal could be to
investigate the power consumption of the
microcontroller and its peripherals, but even without
knowing the results it is obvious that the consumption
of the microcontroller and its peripherals is many times
smaller than the savings that they achieve.
BIBLIOGRAPHY
[1] Consumption of energy. (2011, September). Retrieved March
2012, from European Commission Eurostat:
epp.eurostat.ec.europa.eu/statistics_explained/index.php/Consu
mption_of_energy
[2] Energy Saving Potential in the Field of Residential Buildings in
Rural Area in Romania. (2009). Retrieved March 2012 ,from:
journals.usamvcj.ro/horticulture/article/viewFile/4430/4120
[3] Energy Efficiency in Romania. (2011, January). Retrieved
March 2012, from FRD center: www.frdcenter.ro/assets/EnergyEfficiency-Romania-Jan-2011-DEMO-Report.pdf
[4] Overview on heating systems energy efficiency in industrial and
residential buildings from Romania. (2004). Retrieved March
2012, from: www.wseas.us/elibrary/conferences/2009/lalaguna/EPREWA/EPREWA11.pdf
[5] The Trias Energetica concept. Retrieved March 2012, from:
sustainablebuildingschemes.rockwool.com/sites/sustainabilitygu
ide.rockwool.com/files/styles/page_large/public/images/rockwo
ol_vision/The_trias_Energetica_concept_small.jpg
[6] Het zonnetje in huis. (2008). Retrieved March 2012, from:
www.bespaarenergie.com/Downloads/1EL/2Elektriciteit/Zonnehype.pdf
[7] BigPIC4 User’s Manual. (2006, September)). Retrieved
February 2012, from MikroElectronika:
www.mikroe.com/eng/downloads/get/803/bigpic4 manual.pdf
[8] PIC18Fxx20 Data Sheet. (2004). Retrieved March 2012, from
Microchip:
ww1.microchip.com/downloads/en/DeviceDoc/39609b.pdf
_____________________________________________________________________________________
Buletinul AGIR nr. 4/2012 ● octombrie-decembrie
6
Buletinul AGIR nr. 3/2013 ● iulie-septembrie
236