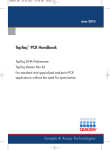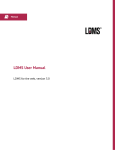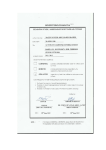
1
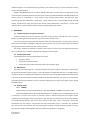
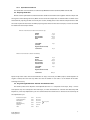
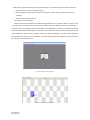
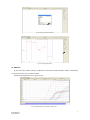
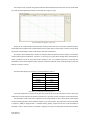
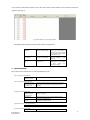
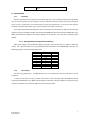
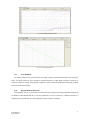
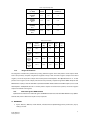
®
HCV Quantification Kit v1
USER MANUAL
For in vitro Diagnostic Use
®
Document Code: MB02v3f
Approval Date: April 2011
IVD
1434
Contents
Page
1.
Product Description
1
2.
Content
1
3.
Storage
1
4.
Required Materials and Devices
1
5.
Important Notes and Safety Instructions
2
6.
Product Use Limitations
2
7.
Pathogen
2
8.
Method
3
9.
Procedure
4
9.1. Sample Preparation, Storage and Transport
4
9.2. Interfering Substances
4
9.3. RNA Isolation
4
9.4. Kit Components
4
9.4.1.
PCR Mix
4
9.4.2.
RT Mix
5
9.4.3.
Detection Mix 1
5
9.4.4.
Detection Mix 2
5
9.4.5.
Internal Control
5
9.4.6.
Positive Control
6
9.4.7.
Quantitation Standards
6
9.5. Preparing the RT-PCR
6
9.6. Programming the Montania® 483 Real-Time PCR Instrument
6
10. Analysis
8
11. Troubleshooting
10
12. Specifications
11
12.1. Sensitivity
Code: MB02v3f
Date: April 2011
11
ii
12.1.1. Genotype Detection
11
12.2. Linear Range
11
12.3. Cross-Reactivity
12
12.4. Reproducibility and Precision
12
12.5. Diagnostic Evaluation
13
12.6. Calibration Against WHO Standard
13
13. References
13
14. Symbols
14
15. Contact Information
14
Code: MB02v3f
Date: April 2011
iii
1. PRODUCT DESCRIPTION
Bosphore® HCV Quantification Kit v1 detects and quantitates Hepatitis C Virus RNA in human serum and
plasma, encompassing all the 6 major HCV genotypes. The linear range of quantitation is from 1x101 IU/ml to at
least 1x10⁹IU/ml, and the analytic sensitivity is 25 IU/ml. A region within the 5’UTR is amplified and fluorescence
detection is accomplished using the FAM filter.
An internal control has been integrated into the kit in order to check PCR inhibition. The amplification data of
the internal control is detected with the Cy5 filter. The internal control can be added either during RNA extraction or
PCR step.
2. CONTENT
Bosphore® HCV RNA Quantification Kit v1 is composed of Real-Time RT PCR reagents and quantitation serum
standards which have been calibrated against WHO International Standard (NIBSC Code 06/100):
Component
1
2
3
4
5
6
7
8
9
10
11
REAGENT
dH2O
PCR Mix
RT Mix
Detection Mix1
Detection Mix2
Internal Control
Positive Control 1
Standard 1 (1 x 10⁶) IU/ml
Standard 2 (1 x 10⁵) IU/ml
Standard 3 (1 x 10⁴) IU/ml
Standard 4 (2 x 10³) IU/ml
100 Tests
(1000 µl)
(2240 µl)
(45 µl)
(255 µl)
(134 µl)
(560 µl)
(70 µl)
(880 µl)
(880 µl)
(880 µl)
(880 µl)
50 Tests
(1000 µl)
(1120 µl)
(23 µl)
(127 µl)
(67 µl)
(280 µl)
(35 µl)
(880 µl)
(880 µl)
(880 µl)
(880 µl)
25 Tests
(500 µl)
(560 µl)
(12 µl)
(63 µl)
(33 µl)
(140 µl)
(17 µl)
(440 µl)
(440 µl)
(440 µl)
(440 µl)
3. STORAGE
Bosphore® HCV Quantification Kit v1 PCR reagents should be stored at -20°C. Repeated thawing and freezing
(>3x) should be avoided since it may reduce sensitivity. If the components are to be used in small amounts, they
should be frozen in aliquots.
While preparing the PCR; the components should not be exposed to room temperature for more than 10 min.
and the detection mix components should not be exposed to light more than 1-2 min. We recommend preparing
the PCR on a cooling block and keeping the detection mixes within a closed container.
The components maintain their stability until the expiry dates on the labels, if they are stored at advised
conditions.
4. REQUIRED MATERIALS AND DEVICES
•
Montania® 483 Real-Time PCR Instrument (Anatolia Geneworks), or another Real-Time PCR system with
FAM and Cy5 filters (iCycler, iQ5, CFX–BioRad, LightCycler 1.5, 2.0, 480-Roche, 7500 Real-Time PCR
System-ABI, Stratagene Mx3005P, Mx3000P-Agilent, LineGeneK, LineGene 9600-Bioer, Rotorgene 2000,
3000, 6000, Q-Qiagen)
•
0.2 ml Thin-Wall PCR tubes or strips
•
Magnesia® 16 Nucleic Acid Extraction System / Magnesia® Viral Nucleic Acid Extraction Kit (Anatolia
Geneworks), or other high quality viral RNA extraction kits and systems
•
Deep freezer (-20°C)
•
Desktop centrifuge with rotor for 2 ml. microcentrifuge tubes
•
Calibrated adjustable micropipettes
Code: MB02v3f
Date: April 2011
1
•
DNAse, RNAse, pyrogen free micropipette tips with filters
•
DNAse, RNAse, pyrogen free 1.5 or 2 ml. microcentrifuge tubes
•
Disposable laboratory gloves
5. IMPORTANT NOTES AND SAFETY INSTRUCTIONS
Important!:
•
The product should be delivered on dry ice. Check for presence of dry ice upon arrival.
•
Check for the expiry dates on the box and tube labels, upon arrival. Do not use expired products or
components.
•
Calibrated or verified micropipettes, DNAse, RNAse, pyrogen free micropipette tips with filters, and
DNAse, RNAse, pyrogen free microcentrifuge tubes should be used.
•
Before starting a test procedure, all components should be thoroughly thawed. After thawing, all
components should be centrifuged briefly (spin-down for 3-5 seconds), and mixed well to ensure
homogeneity prior to use.
•
The kit components should be kept on ice or a cooling block until the reaction is prepared, and they
should be quickly returned to -20ºC.
•
PCR and nucleic acid isolation must be performed in different compartments. Samples should be
stored separately to avoid contact with the kit components.
•
Pathogen information should be reviewed to be aware of the health related risks.
•
Serum/plasma samples (including the standards) should be handled with extreme caution, suitable
class microbiological safety cabinet should be used: Physical contact with pathogens should be
avoided by; wearing lab coats and gloves, no allowance for eating or drinking within the workspace,
prevention of unauthorized individuals’ access to the working area.
•
All the pathogenic wastes produced during the nucleic acid isolation step; including the serum
samples and material contacted with them, should be discarded into medical waste and disposed
safely.
6. PRODUCT USE LIMITATIONS
•
All the components may exclusively be used for in vitro diagnostics.
•
This product should be used in accordance with this user manual, by personnel specially trained to
perform in vitro diagnostic procedures.
7. PATHOGEN
Causative Agents
The hepatitis C virus is a hepacivirus of the Flaviviridae family of viruses that causes Hepatitis C in humans. It is
a small, enveloped, 9.6kb single-stranded RNA virus that is classified into six main genotypes (1-6) with more than
one hundred different subtypes. [1]
Epidemiology
It is estimated that HCV has a worldwide prevalence of 3% affecting around 180 million people with between 3
to 4 million new infections each year. The vast majority of infected people (70-90%) develop chronic infection.
Code: MB02v3f
Date: April 2011
2
Though chronic infection may be asymptomatic, it is a leading cause of chronic liver diseases, including cirrhosis in
between 20 to 50% of patients. Treatment may be effective in 10-50% of patients depending on the applied
therapy. [2]
Modes of Transmission:
Hepatitis C is believed to be spread through contact with infected blood. However, unlike many other blood
borne viruses, HCV may be transmitted even through indirect sources like a used razor, making HCV more
transmissible than other blood borne viruses –including HIV. Common routes of transmission include transfusion of
blood products, intravenous and percutaneous drug and needle use, work accidents among healthcare workers and
any other blood to blood contacts, such as sexual practices and from mother to newborn (maternal-infant
transmission). Statistical studies have revealed no risk factors for HCV transmission in the activities of daily living
(sneezing, coughing, hugging, etc.). [2], [3]
8. METHOD
Bosphore® HCV Quantification Kit v1 is based on the Real Time RT PCR method. HCV genetic material is
amplified by reverse transcription technique since it is composed of RNA. RT-PCR, which is also referred as RNA PCR,
is a two-step reaction. First, complementary DNA is synthesized from RNA by reverse transcription and then
complementary DNA is amplified by standard PCR. The primer binds to the target RNA region in RT-PCR and RNADNA double strand is synthesized by reverse transcriptase enzyme using the RNA template for complementary
DNA. Afterwards, standard PCR continues.
Polymerase chain reaction is a technique that is used for amplification of a DNA region. The reaction occurs by
the repeating cycles of heating and cooling. The main components of PCR are primers, dNTPs, Taq polymerase
enzyme, buffer solution and template. As a brief explanation, primers are small synthetic DNA those anneal to the
specific regions of the template in order to start the synthesis. dNTPs are the building blocks of the amplified
products. Taq polymerase amplifies the DNA template. Buffer solution provides the pH adjustment required for the
reaction and template, as referred, is the target region for synthesis. In addition to these components, in RT PCR
reverse transcriptase is added to the reaction and cDNA synthesis from the RNA template is acquired.
In Real Time PCR technique, in contrast to conventional PCR, PCR product can be monitored during the
reaction. Therefore Real-Time PCR obviates the need for further analysis methods like gel electrophoresis, whereby
minimizing the risk of contamination. Dual labeled probes employed in the reaction in addition to the conventional
PCR reagents, enable detection of the amplified target with increased sensitivity. I
The assay utilizes the 5’ exonuclease activity of Taq Polymerase to cleave a dual-labeled fluorescent
hybridization probe during the extension phase of PCR.
The probe is labeled at the 5’ end with a fluorescent ‘reporter’ molecule, and at the 3’end with another
fluorescent molecule that acts as a ‘quencher’ for the ‘reporter’. When the two fluorophores are in close proximity,
and the reporter is excited by light, no reporter fluorescence can be detected. During the elongation step of PCR,
Taq Polymerase encounters and cleaves the probe bound to the template. As the reporter is freed from the
suppressing effect of the quencher, fluorescence signal can be detected.
The fluorescence generated by the reporter increases as the PCR product is accumulated; the point at which the
signal rises above background level and becomes distinguishable, is called the threshold cycle (CT). There is a linear
relationship between the log of the starting amount of a template and its threshold cycle, thus starting amount of
Code: MB02v3f
Date: April 2011
3
unknown templates can be determined using standard curves constructed using CT values of the known starting
amounts of target templates.
Bosphore HCV Quantification Kit v1 employs multiplex PCR, and an internal control is incorporated into the
system in order to control the isolation procedure and to check for possible PCR inhibition. HCV RNA (cDNA) and an
internal control are co-amplified in a single reaction, using sequence-specific primers. The fluorescent signal
generated by the HCV amplification is detected by a probe labeled at the 3’ end with FAM, through the FAM
channel. The fluorescent signal generated by the internal control amplification, is detected by a second probe
(labeled at the 5’ end with a different reporter molecule, Cy5) through the Cy5 channel.
9. PROCEDURE
9.1. Sample Preparation, Storage and Transport
To isolate serum from the clinical specimen, the blood sample should be collected into sterile vacutainers
without any anticoagulant. For venipuncture, only sterile material should be used.
The serum should be separated from blood within 6 hours after blood collection. To separate the serum, the
blood container should be centrifuged at 800-1600 x g for 20 minutes. The separated serum should be transferred
to polypropylene tubes and stored at -20ºC or lower, until use.
The samples should be transported in containers with capacity to resist pressure. Transportation should be
done according to local and national regulations for pathogen material transport.
9.2. Interfering Substances
The following factors may have possible influences on PCR:
•
Hemolytic samples,
•
Samples of heparinized patients,
•
Samples of patients with elevated levels of bile salts, bilirubin or lipids
9.3. RNA Isolation
We recommend that the Magnesia® 16 Nucleic Acid Extraction System / Magnesia® Viral Nucleic Acid Extraction
Kit (Anatolia Geneworks) isolation system is used with Bosphore® HCV Quantification Kit v1. The RNA isolation
should be performed according to the manufacturers’ instructions. The starting volume is 400 µl, the elution volume
is 60 µl and the amount of internal control that should be used during isolation for each system is 5 µl. The external
quantitation standards are provided as serum, so that they undergo the same steps as the patient samples, starting
from RNA isolation.
9.4. Kit Components
9.4.1.
PCR Mix
PCR mix contains; HotStarTaq DNA Polymerase, Probe RT-PCR Buffer, and ROX passive reference dye.
HotStarTaq DNA Polymerase: HotStarTaq DNA Polymerase is a modified form of Taq DNA Polymerase, and
is provided in an inactive state and has no enzymatic activity at ambient temperature. The enzyme remains
completely inactive during the reverse-transcription reaction and does not interfere with it. This prevents formation
of misprimed RT-PCR products and primer–dimers during reaction setup, reverse transcription, and the first
denaturation step. The enzyme is activated after the reverse-transcription step by a 15-minute, 95°C incubation
step. The hot start also inactivates the reverse-transcription enzymes, ensuring temporal separation of reverse
transcription and PCR, and allowing both steps to be performed sequentially in a single tube.
Code: MB02v3f
Date: April 2011
4
Probe RT-PCR Buffer: It is a unique OneStep RT-PCR buffer system, and has been specifically adapted for
realtime RT-PCR using sequence-specific probes. The buffer contains a balanced combination of KCl and (NH4)2SO4.
ROX passive reference dye: For certain real-time cyclers, the presence of ROX passive reference dye in realtime PCR compensates for non-PCR–related variations in fluorescence detection. Fluorescence from ROX dye does
not change during the course of real-time PCR, but provides a stable baseline to which PCR-related fluorescent
signals are normalized. Thus, ROX dye compensates for differences in fluorescence detection between wells due to
slight variations in reaction volume or to differences in well position. The use of ROX dye is necessary for all
instruments from Applied Biosystems and is optional for instruments from Stratagene (e.g., Mx3000P®, Mx3005P®,
and Mx4000®). Montania 483, Rotor-Gene cyclers and instruments from Bio-Rad/MJ Research, Cepheid, Eppendorf,
and Roche do not require ROX dye. The presence of ROX dye in the master mix does not interfere with real-time PCR
on any instrument, since the dye is not involved in the reaction and has an emission spectrum completely different
from fluorescent dyes commonly used for probes.
9.4.2.
RT mix
RT Mix contains a unique Omniscript and Sensiscript blend. Both enzymes exhibit a high affinity for RNA,
facilitating transcription through secondary structures that may inhibit other reverse transcriptases. Omniscript is
designed for reverse transcription of RNA amounts greater than 50 ng, and Sensiscript is optimized for use with very
small amounts of RNA (<50 ng). This enzyme combination provides highly efficient and sensitive reverse
transcription over a wide range of RNA template amounts.
9.4.3.
Detection Mix 1
Detection Mix 1 contains HCV-specific forward and reverse primers and a dual-labeled probe.
9.4.4.
Detection Mix 2
Detection Mix 2 contains internal control-specific forward and reverse primers and a dual-labeled probe.
9.4.5.
Internal Control
An internal control is included in the kit to control RNA isolation and PCR inhibition. The internal control is a
synthetic DNA molecule derived from human genome. It is added into the serum, proteinase K and carrier RNA
mixture during DNA isolation, to control the isolation efficiency and PCR inhibition. The amount of IC that should be
added during isolation is 5 µl per serum sample. Alternatively, the internal control can be added directly into the
PCR master mix to control the PCR inhibition exclusively. For this purpose, 0.4 µl of internal control should be added
for each reaction into the master mix. Lack of internal control amplification in the FAM negative samples, may
indicate a problem in isolation or PCR inhibition. In this case, isolation and PCR should be repeated. In samples that
contain a high viral load, internal control can be suppressed and no increase of the signal is detected. Please use the
table below for the interpretation of internal control data:
HCV(FAM)
+
+
-
9.4.6.
Internal Control (Cy5)
+
+
-
Interpretation
Sample positive
Sample negative
Sample positive
Repeat the test!
Positive Control
The positive control contains HCV RNA. It can be included in the PCR to test the efficiency of the PCR
exclusively. The threshold cycle for the positive control is given in the acceptance criteria table (Section 10.
Analysis). Threshold cycles higher than the acceptance criteria may indicate an efficiency loss in the reaction.
Code: MB02v3f
Date: April 2011
5
9.4.7.
Quantitation Standards
The quantitation serum standards are calibrated by WHO International Standard (NIBSC Code 06/100).
9.5. Preparing the RT-PCR
All four external quantitation standards should be added into the PCR reaction together with the samples and
the negative control (PCR-grade water). Make sure that all the kit components are thawed before use. Refer to the
table below for preparing the PCR. It is for only one reaction, multiply these values with the sample number to find
the values required for the master mix. While preparing master mixes for more than 5 samples, an extra 10% should
be added to the total sample number.
When the Internal Control is added in the extraction step:
PCR Mix
RT-mix
Detection Mix 1
Detection Mix 2
dH2O
20 µl
0.4 µl
2.28 µl
1.2 µl
0.12 µl
Sample RNA
(Standard,
Negative/Positive Control)
16 µl
Total Volume
40 µl
When the Internal Control is added in the PCR step:
PCR Mix
RT-mix
Detection Mix 1
Detection Mix 2
Internal Control
20 µl
0.4 µl
2.28 µl
1.2 µl
0.4 µl
Sample RNA
(Standard,
Negative/Positive Control)
Total Volume
16 µl
40.28 µl
Pipette 24 µl of the master mix into the PCR tubes or strips, and add 16 µl of RNA (sample/ standard/positive or
negative control). Close the tube cap. Make sure that the solution in each tube is at the bottom of the tube.
Centrifuge if necessary.
9.6. Programming the Montania® 483 Real-Time PCR Instrument
The thermal protocol for Bosphore® HCV Quantification Kit v1 is composed of two-steps; firstly a reverse
transcription step and secondly Real Time PCR steps; an initial denaturation for activation the HotStarTaq DNA
Polymerase, a two-step amplification cycle and a terminal hold. The real-time data is collected at the second step of
the amplification cycle.
Reverse Transcription
Initial denaturation
Denaturation
Annealing
(Data Collection)
Synthesis
Hold
Code: MB02v3f
Date: April 2011
50°C
95°C
97°C
55°C
30:00 min.
14:30 min.
00:30 min.
01:20 min.
72°C
22°C
0:15 min.
05:00
50 cycles
6
Before starting a Real-Time PCR reaction using the Bosphore® Kits, the following steps should be completed:
•
Choose the filter pairs to be used (FAM and Cy5),
•
Identify unknown samples, standards, positive and negative controls, assign quantitative values to the
standards,
•
Select the correct thermal protocol.
These steps are described below:
From the main menu of the Montania® 483 Real-Time PCR Instrument, “File” and then “New” is selected. “Create
a new Experiment” is selected. In the “Select Channel” window channels 1 (FAM) and 3 (Cy5) are selected (Fig. 1).
Standards, samples and negative controls are identified in the “Module Edit” menu (Fig. 2). Standards should only
be defined for the FAM channel and their concentration/viral load should be entered. To select the thermal protocol
“Gene Amplification” menu is used. The “Open” button in the “Experiment Program” is clicked and the appropriate
thermal protocol is selected. (Fig. 3a). The thermal cycles of the selected protocol is displayed. The experiment starts
by clicking the “Start” button (Fig. 3b).
Fig. 1: Filter Selection in Montania® 483
Fig. 2: Sample Location and Identification
Code: MB02v3f
Date: April 2011
7
Fig. 3a: Selecting the Thermal Protocol
Fig. 3b: Starting the Experiment
10. ANALYSIS
By the end of the thermal protocol, the Montania® 483 Real-Time PCR Instrument software automatically
calculates the baseline cycles and the threshold.
Example of an amplification curve is given in Fig. 4.
Fig. 4: Amplification Curve of a Bosphore® HCV v1 test
Code: MB02v3f
Date: April 2011
8
The standard curve is plotted using the data obtained from the defined standards, with the axes Ct-Threshold
Cycle and Log Starting Quantity. Example of a standard curve is given in Fig. 5
Fig.5: Standard Curve of a Bosphore® HCV v1 test
Analysis of the results should be performed by trained personnel who have received the required training for
analysing Real-Time PCR data. We recommend that the test results must be evaluated by an expert clinician, taking
the patient’s clinical findings and the results of other tests into consideration.
All analysis is done automatically in routine use. However, when the trained personnel, who have received the
required training from manufacturer, consider it as necessary, the system allows pulling down the threshold as
much as possible in order to detect low positive samples. In this case, attention should be paid to keep the
threshold line above the background and to keep the correlation coefficient at the maximum possible value (and
within its acceptance criteria.)
The table below displays the acceptance criteria for Bosphore® HCV v.1.
Component/Parameter
Cycle Threshold (CT)
Standard 1
25±2.5
Standard 2
28±2
Standard 3
31±2
Standard 4
33±2
Positive Control
33±4
Correlation Coefficient
>0.950
PCR Efficiency*
>%60
* PCR efficiency is calculated by the following formula: 10(-1/ slope)-1 x100
Test results should not be reported unless the assay results meet the criteria stated above. Please contact the
manufacturer if an impairment in the product’s performance is observed (See the last page for contact information).
The quantitative results of the test are displayed on the “Report Mode” screen. A spread sheet containing the
calculated starting quantities of the unknown samples in each tube is shown. The samples that cross the threshold
in Channel 1 (FAM) are displayed with a calculated starting quantity, samples that do not cut the threshold are
displayed as “No Ct”. These samples are regarded as negative or having a viral load below the detection limit of the
Code: MB02v3f
Date: April 2011
9
assay. For these undetectable samples, the Cy5 data of the internal control should also be checked to avoid false
negative results (Fig. 6).
Fig. 6: A Report Mode Screen Showing the Results
The following table shows the possible results and their interpretation:
Signal detected in FAM
filter pair
The sample contains HCV
RNA, the result is positive
No signal in
signal in Cy5
The HCV RNA in the
sample is not detectable
FAM,
No signal in FAM and
Cy5
The
diagnosis
inconclusive
is
No need to check the internal
control since the sample is
positive (high positive samples
may suppress the signal from
the internal control)
Signal from Cy5 filter pair rules
out the possibility of PCR
inhibition
No signal in Cy5 points out to
PCR inhibition or to a problem
in
RNA
isolation
(See
11.Troubleshooting)
11. TROUBLESHOOTING
Please contact the manufacturer in case of a problem during a run.
Late or no signal from the FAM filter
Wrong thermal
protocol is chosen
Late or weak signal from the standards
Deterioration of the
standards or the core
kit components
No signal from the internal control
Deterioration of the
internal control or
detection mix 2
PCR inhibition
RNA lost during
isolation
Make sure that the correct thermal protocol is chosen.
Don’t use expired standards or kit components. Follow the
instructions for the storage of kit components (Section 3.
Storage).
Follow the instructions for the storage of kit components (See
Section 3. Storage).
Make sure that you use the recommended RNA isolation
method (See 9.3 RNA isolation).
Make sure that you use the recommended RNA isolation
method (See 9.3 RNA isolation).
Signal from FAM Filter in the Negative Control
Contamination
Use filter-tips. Repeat PCR with new kit components.
The Threshold is Above Low Signals
The threshold should
Using the mouse pull the threshold down until it cuts the low
Code: MB02v3f
Date: April 2011
10
be manually adjusted
signals. Avoid the background and the signal from negative
control.
12. SPECIFICATIONS
12.1.
Sensitivity
Analytical sensitivity may be expressed as the limit of detection: i.e. the smallest amount of the target marker
that can be precisely detected. The detection limit of an individual analytical procedure is the lowest amount of
nucleic acid in a sample which can be detected but not necessarily quantitated as an exact value. The analytical
sensitivity or detection limit for NAT assays is expressed by the 95% positive cut-off value.
The analytical detection limit for Bosphore® HCV v1 was found to be 2.5x101 IU/ml (p=0.05). The sensitivity was
determined using serial dilutions of RNA calibrated with the WHO International Standard for HCV RNA NAT assays,
(NIBSC Code 06/100). The dilutions were tested in different runs in replicates. The results were analyzed by probit
method.
12.1.1. Genotype Detection and Quantitation Efficiency
Efficiency of detecting and quantitating different genotypes were ensured both by sequence comparison
analysis and a Real-Time PCR assay using Worldwide HCV Performance Panel WWHV302(M) (Seracare). The
following genotypes were tested and found positive:
Panel Member
1
2
3
4
6
8
10
11
12
14
12.2.
Genotype
1b
1a
1b
2a/2c
3b
3a
4
4
5a
6a
HCV(FAM)
+
+
+
+
+
+
+
+
+
+
Linear Range
The linear range of Bosphore® HCV Quantification Kit v1 was determined to be from 1x101 IU/ml to at least
1x10⁹IU/ml.
In order to assess the linear range, a dilution series which has been calibrated against the WHO International
Standard for HCV RNA NAT assays, (NIBSC Code 06/100) was analyzed by testing each dilution in 2 replicates (Fig. 7a
and 7b). The standard curve correlation coefficient was found to be 0.99802.
Code: MB02v3f
Date: April 2011
11
Fig. 7a: Linear Range Amplification Curve
Fig. 7b: Linear Range Standard Curve
12.3.
Cross-Reactivity
To eliminate potential cross-reactivity, both assay design evidence and experimental studies were employed.
Primer and probe sequences were checked for possible homology to other known pathogen sequences by
sequence comparison analysis using database alignment. Samples of HIV, HDV, HBV with known high positivity
were tested, and found negative.
12.4.
Reproducibility and Precision
Reproducibility data (on CT value basis) were obtained by the analysis of one of the quantitation standards of
the Bosphore® HCV Quantification Kit v1. Test was performed in at least 4 replicates by 3 different operators, on
multiple days, using 3 different lots. The resulting data is given in Table 1 and Table2:
Code: MB02v3f
Date: April 2011
12
Table 1: Reproducibility Data.
HCV
(104 IU/ml)
Standard
deviation
Variance
Coefficient of
variation [%]
Intra-assay
Variability
N=4
0.03
0.001
0.11
Inter-lot
Variability
N=3
0.29
0.08
0.92
Inter-operator
Variability
N=3
0.26
0.08
0.92
Total Inter-assay
Variability
N=5
0.25
0.06
0.81
Table 2: Precision Data.
HCV
(10 4 IU/ml)
Intra-assay
Variability
N=4
Inter-lot
Variability
N=3
Interoperator
Variability
N=3
Total Interassay
Variability
N=5
12.5.
Measured
Quantity
(MQ) IU / ml
Standard
Deviation
(MQ)
Coefficient of
variation [%]
(MQ)
10852,5
267,87
2,46
31,24
0,03
1074,97
9,70
31,41
0,29
9290,58
1354,50
14,57
31,53
0,26
10047,15
1596,95
15,89
31,52
0,25
11072,17
Threshold Standard
Cycle
Deviation
(Ct)
(Ct)
Diagnostic Evaluation
The diagnostic evaluation was performed by testing 100 HCV negative and 5 HCV positive serum samples which
have been previously analyzed using Roche Diagnostics Elecsys 2010. All of the negative samples were found
negative, and all of the positive samples were found positive with Bosphore® HCV Quantification Kit v1. 17 HCV
positive and 2 negative serum samples, which have been previously analyzed using Roche COBAS Amplicor HCV
RNA Monitor v2.0, Bayer Versant HCV RNA v3.0, Abbott HCV RNA m2000 and Roche HCV RNA Taqman, were tested
with Bosphore® HCVQuantification Kit v1. All the positive samples were found to be positive, and all the negative
samples were found to be negative.
12.6.
Calibration Against WHO Standard
Quantitation Standards were calibrated against the WHO International Standard for HBV DNA NAT assays (NIBSC
Code 06/100). 1 IU was found to be equal to 3± 0,2 copies/ml .
13. REFERENCES
1.
By K. E. Nelson, C. Williams, and N. Graham., Infectious Disease Epidemiology: Theory and Practice, July 15,
2000 , p :923-926
Code: MB02v3f
Date: April 2011
13
2.
Theodore Sy and M. Mazen Jamal, Epidemiology of Hepatitis C Virus (HCV) Infection, Int J Med Sci. 2006;
3(2), p:41–46.
3.
Anonymous, Hepatitis C Fact Sheet No. 164. 2000, World Health Organization.
14. SYMBOLS
Use by
Lot/Batch
REF
Catalog number
Temperature limitation
Caution, consult accompanying documents
Manufacturer
IVD
In Vitro Diagnostic Medical Device
15. CONTACT INFORMATION
®
Egitim Mh. Kasap Ismail Sk.
No:10/23 Kadikoy 34722
ISTANBUL-TURKEY
Phone: +90 216 330 04 55
Fax: +90 216 330 00 42
E-mail: [email protected]
www.anatoliageneworks.com
Registered Trademarks: Anatolia Geneworks® Montania®, Magnesia® and Bosphore® are registered trademarks of
Anatolia Tani ve Biyoteknoloji A.S.
Code: MB02v3f
Date: April 2011
14