1
PI Interface for Performance
Monitor
Version 2.0.0.x
iii
OSIsoft, LLC
777 Davis St., Suite 250
San Leandro, CA 94577 USA
Tel: (01) 510-297-5800
Fax: (01) 510-357-8136
Web: http://www.osisoft.com
OSIsoft Australia • Perth, Australia
OSIsoft Europe GmbH • Frankfurt, Germany
OSIsoft Asia Pte Ltd. • Singapore
OSIsoft Canada ULC • Montreal & Calgary, Canada
OSIsoft, LLC Representative Office • Shanghai, People’s Republic of China
OSIsoft Japan KK • Tokyo, Japan
OSIsoft Mexico S. De R.L. De C.V. • Mexico City, Mexico
OSIsoft do Brasil Sistemas Ltda. • Sao Paulo, Brazil
OSIsoft France EURL • Paris, France
PI Interface for Performance Monitor
Copyright: © 2000-2013 OSIsoft, LLC. All rights reserved.
No part of this publication may be reproduced, stored in a retrieval system, or transmitted, in any form or by any
means, mechanical, photocopying, recording, or otherwise, without the prior written permission of OSIsoft, LLC.
OSIsoft, the OSIsoft logo and logotype, PI Analytics, PI ProcessBook, PI DataLink, ProcessPoint, PI Asset
Framework (PI AF), IT Monitor, MCN Health Monitor, PI System, PI ActiveView, PI ACE, PI AlarmView, PI
BatchView, PI Coresight, PI Data Services, PI Event Frames, PI Manual Logger, PI ProfileView, PI WebParts,
ProTRAQ, RLINK, RtAnalytics, RtBaseline, RtPortal, RtPM, RtReports and RtWebParts are all trademarks of
OSIsoft, LLC. All other trademarks or trade names used herein are the property of their respective owners.
U.S. GOVERNMENT RIGHTS
Use, duplication or disclosure by the U.S. Government is subject to restrictions set forth in the OSIsoft, LLC license
agreement and as provided in DFARS 227.7202, DFARS 252.227-7013, FAR 12.212, FAR 52.227, as applicable.
OSIsoft, LLC.
Published: 07/2013
Table of Contents
Chapter 1.
Introduction to the PI Interface for Performance Monitor ................................. 5
Related Manuals ...................................................................................................... 5
Supported Operating Systems ................................................................................. 6
Chapter 2.
How the PI Interface for Performance Monitor Works ....................................... 7
Chapter 3.
Configuring the PI Interface for Performance Monitor ...................................... 9
Creating and Configuring the Interface Instance ...................................................10
Importing the Digital State Set ...............................................................................10
Configuring the Windows Service ..........................................................................11
Chapter 4.
Configuring PI Tags for the PI Interface for Performance Monitor .................13
Data Points ............................................................................................................13
Latency Points .......................................................................................................14
Status Points ..........................................................................................................15
Specifying the Performance Counter Path ............................................................15
Point Attributes .......................................................................................................16
Automated Tag Creation ........................................................................................19
Appendix A. Supported Features ............................................................................................... 1
Appendix B. Command Line Parameters................................................................................... 3
Appendix C. Error and Informational Messages ....................................................................... 5
Common Problems .................................................................................................. 5
Informational Messages ........................................................................................... 6
Warning Messages .................................................................................................. 7
Error Messages........................................................................................................ 8
Delayed Validation Errors ......................................................................................10
Errors Unloading PI Points ....................................................................................12
Appendix D. Recommended Performance Counters to Monitor ...........................................13
Counters for Troubleshooting. ...............................................................................13
Recommended Thresholds ....................................................................................14
Performance Counters for Processes....................................................................15
Process Counters for Performance Data ...............................................................17
PI Interface for Performance Monitor
iii
Chapter 1.
Introduction to the PI Interface for
Performance Monitor
The PI Interface for Performance Monitor collects performance counter data from Windows
performance data providers, and sending this data to the PI System. The PI PerfMon interface
uses Microsoft registry functions to access performance counter data.
Performance data providers supply data from services or other applications, which can start
and stop at any time. By default, the interface connects to its providers during startup, which
means it does not detect providers that become available after it starts. To enable the interface
to detect data providers that start after it has performed its initial scan, you can configure the
interface to periodically unload and reload data providers at a specified frequency, which
imposes some overhead but enables it to detect newly-arrived data providers.
The interface can collect performance data from the local host and from remote providers. It
can run on the same computer as the PI Server to which it sends performance data, or it can
run on a different computer.
The interface supports three different PI tag configurations:
Data tags: Send data from a performance counter to a PI tag.
Status tags: Sends the state of the performance counter to a PI tag. (Examples:
performance counter offline, performance counter not running)
Latency tags: Reports in milliseconds how much time it takes for the interface to request
and receive performance data from a machine for a specified scan class.
Related Manuals
PI Server manuals
PI API Installation Manual
PI Interface Configuration Utility User Manual
UniInt Interface User’s Guide
PI Interface for Performance Monitor
5
Introduction to the PI Interface for Performance Monitor
Supported Operating Systems
Platforms: (32-bit or 64-bit in emulation mode)
Windows XP SP3 and later
Windows 2003 Server
Windows Vista
Windows 2008 and Windows 2008 R2 Server
Windows 7
Windows 8
Windows 2012 Server
No 64-bit builds of the interface are available.
6
Chapter 2.
How the PI Interface for Performance
Monitor Works
To monitor performance, the interface reads Microsoft Windows performance counter data
from each machine being monitored at frequencies specified by the scan classes configured
for the interface instance. After the performance data from a counter is received and
calculated, the interface writes the data to the PI point that contains the corresponding
performance counter path in its Extended Descriptor attribute.
The interface includes definitions for a set of digital states that are assigned to status tags to
indicate whether the interface has encountered problems collecting performance data. The
interface also logs such errors.
When the interface starts, it creates a worker thread pool that connects to local and remote
machines and gathers performance data from them. The number of worker threads to be
created is specified by the /TC command-line parameter. The default number of threads is 10,
the minimum is 1 and the maximum is 99. This setting is critical for successful interface
runtime behavior in cases when one or more remote machines goes offline. As a general rule,
if the interface is configured to monitor 100 machines, and you anticipate that 10 of them
might go offline at the same time, set the number of worker threads to 12, to allocate 10 for
each offline machine plus two to dispatch the remaining 80 online devices. This setting can
vary greatly, depending on the number of PI points loaded for each machine, the number of
scan classes and their frequencies.
After initialization, the interface connects to the target PI Server and locates the PI points that
have a PointSource attribute matching the PointSource parameter configured for the
interface instance. After the interface finds all PI points with the matching PointSource, it
tries to load them one by one, checking additional tag attributes as follows:
Scan is enabled
Location1 matches the interface instance ID
Location2 is 0 for data and status tags, 1 for latency tags
Location4 specifies a valid scan class
Data type is digital or numeric
Extended Descriptor contains a valid performance counter path for data and
status tags or, for latency tags, “[LATENCY:computer]”.
If a PI point passes all the above checks, it is loaded by the interface and assigned the NOT
INITIALIZED state.
PI Interface for Performance Monitor
7
How the PI Interface for Performance Monitor Works
After loading points, the interface enters its processing loop and performs the following tasks:
1. Connect to the computers being monitored, retrieve performance counters configuration
data from them, and initialize the loaded PI points.
2. Put the request for performance data for a device in a worker thread, process returned
data, and make it available for writing to the PI Server.
3. Try to reconnect to any unreachable remote machines.
4. Check availability of performance data for each PI point and write data to the PI point
value and status. The interface writes values directly to the PI Server unless buffering is
enabled for the interface, in which case data is buffered and written to the PI Server by
the buffering subsystem.
5. Check for tags that are added, edited and deleted and revise the internal tag list
accordingly.
6. Remove any unused machines from the interface if all its points are removed or
deactivated.
The interface exits when its service is stopped or, if run from a command prompt, when it is
interrupted by a CTRL+C command.
By default, the interface establishes an initial connection to the target machines and only
attempts to reconnect if a connection is lost. As a result, if other PI interfaces are started after
the interface starts, the interface cannot detect and load points for the newly-started
interfaces. To enable the interface to detect interfaces that are started after normal data
collection begins, you can run the interface in extended mode. In extended mode, the
interface periodically unloads and reloads data providers, enabling it to detect newly-started
interfaces. To minimize overhead, you can configure how often the interface unloads and
reloads data providers using PI ICU.
Note the following limitations:
8
In defining performance points, you cannot mix addressing conventions when specifying
the target computer. Use the same method (either IP address or host name) for all points
that you configure to monitor the computer. Mixing addressing modes can cause the
interface to stop collecting data.
Do not run two instances of the interface in extended mode on the same computer to
monitor the same remote devices. In extended mode, the interface periodically closes and
reopens connections to the remotely monitored device. If two instances are periodically
reconnecting to the same computers, one instance might incorrectly report the target
computers as being offline.
Chapter 3.
Configuring the PI Interface for
Performance Monitor
This chapter provides detailed instructions for configuring the interface. A minimum
functional configuration is described, which you can adjust according to your requirements.
For details about features that are common to all UniInt interfaces, refer to the UniInt
Interface User Manual.
Before installing and configuring, verify that the PI Server is up and running.
By default, the interface is installed in %PIHOME% \Interfaces\PIPerfMon\. The
%PIHOME% directory, which is the root directory where OSIsoft products are installed, is
defined by the PIHOME entry in the pipc.ini configuration file in the %windir%
directory. Defaults for the %PIHOME% directory are as follows:
32-bit operating system: C:\Program Files\PIPC
64-bit operating system: C:\Program Files (x86)\PIPC
To ensure that the interface restarts whenever its host computer is rebooted, configure it as an
automatic service.
Note: The Performance Monitor interface is installed with the PI Server. If you want to
install it on a computer other than the PI Server node, download the installer from
the OSIsoft web site and run the installer on the desired computer. Ensure that the
computer where you install the interface has network access to both the PI Server
and the computers that you want to monitor. This guide assume you are running
the interface on the PI Server node.
Prior to PI Server 2012, a basic version of the interface was installed, limited to 32
ponts. As of PI Server 2012 and later, the full interface is installed, removing this
limitiation. If you are running the basic version and want to upgrade to the full
version, refer to the PI Server 2012 release notes for instructions.
PI Interface for Performance Monitor
9
Configuring the PI Interface for Performance Monitor
Creating and Configuring the Interface Instance
For each interface instance you create, the configuration is stored in a separate Windows
command file (a .bat file) in the interface installation directory. Settings are specified as
command line parameters.
To create an instance of the interface, perform the following steps:
1. Launch PI ICU.
2. Choose Interface > New from BAT file…
3. Browse to the directory where the interface is installed (the default is
%PIPC%\Interfaces\), select PIPerfMon.bat_new and click Open. The Select
PI Host Server dialog is displayed.
4. Specify the PI Server and click OK. ICU displays the settings of the new instance of the
interface.
5. On the General tab, edit the basic settings as follows.
Point source: “PERF” or a point source not already in use
Interface ID: 1 or a numeric ID not already in use
Scan class: Configure desired scan frequency. Note that, when defining scan
classes, you can spread the server workload using offsets, to ensure that all
scans do not occur at the same time.
6. To configure interface-specific settings, click PIPerfMon. On this tab you can enable
debugging and override the default thread count for the interface.
7. After configuring the desired settings, click Apply.
To display the message log, launch PI System Management Tools and choose the
Operation > Message Logs menu option. To start the interface using PI ICU, choose
Interface > Start Interactive. PI ICU displays a command window and invokes the
startup batch file, and you can observe progress as the interface attempts to initialize and run.
Watch log for messages indicating success or errors. To stop the interface, close the
command window.
Importing the Digital State Set
To import the digital states required by the interface, launch PI System Management Tools,
connect to the target PI Server if required, and perform the following steps:
1. Choose Points > Digital States. The right pane lists the digital state sets defined for the
PI Server.
2. Right-click the server and choose Import from File. The Import Digital Set(s) dialog is
displayed.
3. Browse to the folder where the interface is installed and select the PI_PIPerfMon_DS.csv
file. To dismiss the dialog, click Open.
4. On the Import Digital Set(s) dialog, click Create Set(s). Verify that the new digital state
set is added to the server’s list.
5. To dismiss the dialog, click Close.
10
Configuring the Windows Service
To ensure that the interface instance starts whenever the interface node is rebooted, configure
the instance as an automatic Windows service, as follows:
1. In PI ICU, click Service.
2. To ensure that buffering is running when the interface starts, click bufsrv (pre 3.4 PI
Servers) or pibufss (3.4 and higher) in the Installed services list, then click the leftarrow button to add it to the Dependencies list. If prompted, update service
dependencies.
3. Set Startup Type to Auto.
4. Click the Create button.
5. To start the service, click
.
To verify that the service is created and is running, launch the Windows Administrative Tools
Services control panel and verify that the service is listed.
To ensure that the interface restarts when its host computer, configure it as a Windows
service. To configure the service, go to the PI ICU Services tab and enter the required
settings, then create and start the service. On 64-bit platforms, configure the PI PerfMon
interface service to depend on the Performance Counter DLL Host service, and configure the
Performance Counter DLL Host service startup type as Automatic.
By default, the service runs using the Local System account. To be able to collect
performance data from a remote machine, the account associated with the service must have
administrative privilege or be a member of the “Performance Monitor Users” group on the
remote machine. If this account does not have privileges to obtain performance counters on a
remote computer, specify an account with sufficient privileges.
To configure the account for the service:
1. Launch the Windows Services control panel.
2. Right-click the Performance Monitor interface service and choose Properties. The
Properties dialog is displayed.
3. Display the Log On tab, enable This account and enter the user name and password for
the account.
4. To save your changes, click OK.
PI Interface for Performance Monitor
11
Chapter 4.
Configuring PI Tags for the PI Interface
for Performance Monitor
A Windows performance counter provides information about the performance of the
operating system, an application, a service, or a driver. For example, the %Processor Time
performance counter measures the percentage of time the processor is running non-idle
threads.
A PI tag (also called a “PI point”) is a time-stamped record of a single set of measurements
(for example, tank temperature). If you misconfigure tags, the interface cannot correctly
transmit the data to the PI Server. A performance monitor tag is associated with data from a
single performance counter.
The interface supports the following point configurations:
Data points
Latency points
Status points
Note: The Performance Monitor interface includes the PIPerfCreator utility, which
retrieves performance counter information from a selected computer and creates
the corresponding PI data points. In addition, PI System Management Tools
includes a feature that enables you to browse performance counters and
selectively create the corresponding points. For details, see Automated Tag
Creation.
The followings sections describes these configurations in detail.
Data Points
Data points contain calculated performance data. Data points support the following data
types: Float16, Float32, Float64, Int16, Int32 and Digital.
To map a data point to a performance counter, enter the performance counter path in the PI
point’s Extended Descriptor attribute, using the format defined by the Microsoft
Performance Counters specification. For more information about counters and supported
formats, see the “Specifying a Counter Path” topic in the Microsoft Developers Network
(MSDN) library. If you omit the name of the target computer, the default is “localhost.”
Each scan class can contain only one data point for a particular performance counter. The
interface rejects any duplicate data points (data points that contain the same performance
counter path for the same scan class) and logs an error.
PI Interface for Performance Monitor
13
Configuring PI Tags for the PI Interface for Performance Monitor
If the interface cannot update a data point, it writes one of the following system digital states
to the point to indicate the nature of the problem:
Configure: The interface cannot initialize the tag.
I/O Timeout: The interface is not able to collect performance data from the computer,
most likely because the computer is offline.
Bad Input: The interface is not able to process raw performance data returned from a
device for this performance counter, most likely because the data does not conform to the
Microsoft specification (see “Providing Counter Data” in the Microsoft Developers
Network library). One typical cause of such problems is when the value of a delta counter
is smaller than its preceding value.
Set the attributes of data tags as follows:
Tag Attribute
Setting
Location1
Interface ID
Location2
0
Location4
Scan class (1 or greater)
Point Type
Numeric or Digital
DigitalSet
None or user defined
Extended descriptor
Performance Counter Path
Span
100
Step
0
Zero
0
TypicalValue
0
Latency Points
Latency points track the time in milliseconds required to request and receive raw performance
counter data. The recommended data type for a latency tag is Float32. Each scan class can
contain only one latency point for a particular computer. However, you can define multiple
latency points for the same computer in different scan classes. If there are no data points
defined for a computer, do not define any latency points for the computer, because the
overhead required to retrieve the latency data for a computer that you are not monitoring
imposes unnecessary workload on the target computer and the network.
To configure a latency point, set its attributes as follows:
14
Tag Attribute
Setting
Location1
Interface ID
Location2
0
Location4
Scan class (1 or greater)
Point Type
Float32
DigitalSet
None
Extended descriptor
[LATENCY:computer]
Span
100
Step
0
Zero
0
TypicalValue
0
Status Points
Status points contain information about the state of a specified Windows performance
counter. To verify that a Windows performance counter is active and returning good data to
its data point, define a corresponding status point. Like data points, the ExDesc attribute of
a status point contains the performance counter path of the counter being monitored. If you
omit the name of the target computer, the default is “localhost.” The data type of a status
points must be digital and its Location2 attribute must be set to 1. The status point must be
assigned to the same scan class as its corresponding data point. Status points are read only
when they change, so they do not impose any additional overhead on the network or target
computer.
To define the digital states that the interface uses for status tags, use PI System Management
Tools to import the PI_PIPerfMon_DS.csv file, which resides in the interface installation
directory (by default, %PIHOME% \Interfaces\PIPerfMon\).
If the performance counter is functioning correctly, the status tag is set to “Good.” If the
interface cannot initialize the tag, it sets the tag to “Configure.” If the tag status is
“Configure,” check its attributes to determine whether it is configured correctly.
Set the attributes of status tags as follows:
Tag Attribute
Setting
Location1
Interface ID
Location2
1
Location4
Scan class (1 or greater)
Point Type
Digital
DigitalSet
PIPerfMon
Extended
descriptor
Performance Counter Path
Span
11 (The number of the last digital state from the PIPerfMon digital state
set.)
Step
1
Zero
0
TypicalValue
11
Specifying the Performance Counter Path
Data and status tag definitions must include the path of the performance counter from which
to read data. The format of the path is as follows:
\\Machine\PerfObject(ParentInstance/ObjectInstance#InstanceIndex)\Counter
For example:
PI Interface for Performance Monitor
15
Configuring PI Tags for the PI Interface for Performance Monitor
\\IFNODE790\Memory\Available bytes
\\IFNODE790\processor(_total)\% processor time
The performance counter path must be specified in English. The components of the path are
as follows:
Path Component
Description
\\Machine
The name of the computer being
monitored. The name can be a NetBIOS
name, fully qualified domain name, or the
IP address of the device. If the machine
name is omitted, the local machine where
the interface is running is used.
(Optional but highly recommended)
\PerfObject
(Required)
Specifies the performance object that
contains the counter. If the object supports
variable instances, an instance string must
also be specified.
(ParentInstance/ObjectInstance#InstanceIndex)
The format of this portion depends on the
type of object specified. If the object has
simple instances, specify the instance
name in parentheses. For example, an
instance for the Process object might be
(Explorer) or (MyApp). If the object has
only a single instance, this component
does not appear in the path.
\Counter
Specifies the performance counter. For
example the Process object has counters
such as Processor Time and
Interrupts/Sec.
(Required)
Note: The interface cannot determine the validity of the instance specified in the
parentheses. Data collection fails if the instance does not exist on the machine
when the interface attempts to collect data from it.
Point Attributes
The following sections tell you how to configure the attributes for PI points.
Tag
When assigning names to PI tags, follow these rules:
The tag name must be unique.
The first character must be alphanumeric, underscore (_), or percent sign (%).
Control characters such as linefeeds or tabs are illegal, as are the following characters:
* ’ ? ; { } [ ] | \ ` ‘ “
PointSource
The point source is an identifier that associates a tag with a PI interface instance, enabling the
interface to query the PI Server for the tags that it updates. This field is not case-sensitive. In
16
the interface batch startup file, point source is specified using the /PS command-line
parameter.
The following point sources are reserved. Do not configure them for interface instances.
Point Source
Reserved By
T
Totalizer Subsystem
G and @
Alarm subsystem
R
Random interface
9
RampSoak interface
C
Performance equations subsystem
PointType
Point type specifies the data type of the point. Three different PI point configurations are
supported by the interface, which require different data types:
Latency tags:
Float32
Data tags:
Float16, Float32, Float 64, Int16, Int32 and Digital
Status tags
Digital
Location1
Location1 specifies the instance of the interface to which the tag belongs. The value of
this attribute must match the ID configured for the interface instance. This setting plus point
source identify the interface instance that writes to a particular point.
Location2
Location2 indicates the configuration of the tag. For latency and data tags, set this
attribute to 0. For status tags, set it to 1.
Location3
Unused by this interface.
Location4
Location4 configures the scan class for the PI tag. The scan class determines the
frequency at which input tags are scanned for new values. Location4 must be a positive
number. To minimize overhead, assign the same scan class to data and status tags that
monitor the same performance counter.
Location5
Unused by this interface.
PI Interface for Performance Monitor
17
Configuring PI Tags for the PI Interface for Performance Monitor
ExDesc
For latency tags, set to [LATENCY:computer], where computer is the name of the
computer to be monitored, specified using a NetBIOS name, fully-qualified domain name or
an IP address. For data and status tags, set to the performance counter path string.
Scan
This attribute enables or disables data collection for the tag. By default, data collection is
enabled (Scan is set to 1). To disable data collection, set Scan to 0. If the Scan attribute is
0 when the interface starts, the interface does not load or update the tag. If you enable
scanning while the interface is running, the time required for data collection to start depends
on how many tags you enable, because they are processed in batches. For efficiency, if you
need to enable scanning for a large number of tags, stop and restart the interface. If a tag that
is loaded by the interface is subsequently edited so that the tag is no longer valid, the tag is
removed from the interface and SCAN OFF is written to the tag.
Shutdown
By default, the PI shutdown subsystem writes the SHUTDOWN digital state to all PI points
when PI is started. The timestamp that is used for the SHUTDOWN events is retrieved from a
file that is updated by the snapshot subsystem. The timestamp is usually updated every 15
minutes, which means that the timestamp for the SHUTDOWN events is accurate to within
15 minutes in the event of a power failure. For additional information on shutdown events,
refer to PI Server manuals.
18
Automated Tag Creation
The Performance Monitor interface includes the PIPerfCreator utility, which retrieves
performance counter information from a selected computer and creates the corresponding PI
data points. In addition, PI System Management Tools includes a feature that enables you to
browse performance counters and selectively create the corresponding data points. The
following sections describe these options for creating performance monitor tags.
Creating Performance Tags Using the PIPerfCreator Utility
To create performance monitor tags, perform the following steps:
1. Launch the utility from the Windows Start menu: choose
PI System > PIPerfCreator.exe. The PIPerfmon Interface Point Creation dialog is
displayed, as shown in the following figure.
2. Choose the computer that you want to monitor from the Server drop-down list, and log
into it.
3. To create a tag for a performance counter, click
(the Browse button to the right of
the ExDesc field). The Get Counter Path dialog is displayed, as shown in the following
figure.
PI Interface for Performance Monitor
19
Configuring PI Tags for the PI Interface for Performance Monitor
4. Select the computer you want to monitor and choose the level of detail you want to
display. A list of counters is displayed in the middle scroll box.
5. Select the counter for which you want to create a performance tag. To dismiss the Get
Counter Path dialog, click OK.
6. On the Main tab, enter settings for the interface ID, scan class, and point source, to
ensure that the correct interface instance detects and updates the point you are creating.
Choose the data type that best supports the data to be stored, and configure the tag name
and description as desired.
7. To refine compression and exception settings for the tag, click the Compression tab and
entered the desired settings. (Compression and exception settings enable you to control
the amount of variation that is captured by the point, to ensure that trends are recorded
accurately without archiving an excessive amount of data. For details, refer to the PI
Server documentation.)
8. To create the point, click Create.
20
Creating Performance Tags Using PI System Management Tools
To create multiple PI Performance Monitor Interface data tags at once, perform the following
steps:
1. Launch PI SMT, connect to the desired PI Server if necessary, and choose
IT Points > Performance Counters. The right pane displays the Tag Settings and Build
Tags tabs.
2. On the Tag Settings tab, select the interface instance for which you want to build points
and modify the settings in the Point Details section as required. The tag name
substitution table enables you to define a naming convention for the points that you are
creating.
3. On the Build Tags tab, check the performance counters for which you want to build data
tags from the tree in the lower left pane. The right pane lists the points to be created for
the selected performance counters.
4. To create the tags on the selected server, choose the Create tags on PI Server option. To
export tag definitions to a CSV file that you can import later using PI Tag Builder,
choose Write tags to CSV file.
5. Click Create Tags. PI SMT creates the tags and displays the results.
PI Interface for Performance Monitor
21
Appendix A.
Supported Features
UniInt (Universal Interface) is an OSISoft framework for interfaces to the PI Server. UniInt
provides generic functions required by most interfaces, such as establishing a connection to
the PI Server and monitoring changes to PI points. The UniInt framework ensures a standard
set of features for OSIsoft interfaces and makes it easy to enhance the common features. The
UniInt Interface User Manual, a supplement to this manual, describes the standard features
that are common to all UniInt interfaces.
The interface is supported on the following platforms: (32-bit or 64-bit in emulation mode):
Windows XP (Note that, as of August 2014, Microsoft no longer supports Windows XP)
Windows 2003 Server
Windows Vista
Windows 2008 and Windows 2008 R2
Windows 7
Windows 8 and Windows Server 2012
No native 64-bit builds of the interface are available.
Feature
Support
Interface Part Number
PI-IN-OS-PERF-NTI
Auto-creates PI Points
No
Point Builder Utility
Yes (The point builder utility can only create 32bit performance counters.)
ICU Control
Yes (not supported on IA64)
PI Point Types
Float16 / Float32 / Float64 / Int16 / Int32/ Digital
Sub-second Timestamps
Yes
Sub-second Scan Classes
Yes
Automatically Incorporates PI Point
Attribute Changes
Yes
Exception Reporting
Yes
Outputs from PI
No
Inputs to PI:
Scan-based
Supports Questionable Bit
No
Supports Multi-character PointSource
Yes
Maximum Point Count
Unlimited
Uses PI SDK *
No
PINet String Support
No
PI Interface for Performance Monitor
1
Configuring PI Tags for the PI Interface for Performance Monitor
Source of Timestamps
PI System Time
History Recovery
No
UniInt-based *
Yes
Disconnected Startup *
Yes
SetDeviceStatus *
Yes
Failover *
UniInt Interface Level Failover (Phase 2, Cold
and Hot)
Vendor Software Required on
Interface Node
No
Vendor Software Required on Foreign
Device
No
Vendor Hardware Required
No
Additional PI Software Included with
interface
Yes: PIPerfCreator, to help facilitate the creation
of performance monitor tags.
Device Point Types
Numeric only
Serial-Based interface
No
Disconnected Start-Up
Disconnected start-up enables the interface to start and collect data without a connection to
the PI server. To enable disconnected startup, use PI ICU. For more details, refer to the
UniInt Interface User Manual.
SetDeviceStatus
The [UI_DEVSTAT] health point tracks the status of the connection between the interface
and the source devices. Refer to the UniInt Interface User Manual for more information
about how to configure health points.
Failover
UniInt Phase 2 Failover provides support for cold, warm, or hot failover configurations. The
Phase 2 hot failover results in a no data loss solution for bi-directional data transfer between
the PI Server and the Data Source given a single point of failure in the system architecture
similar to Phase 1. However, in warm and cold failover configurations, you can expect a
small period of data loss during a single point of failure transition. This failover solution
requires that two copies of the interface be installed on different interface nodes collecting
data simultaneously from a single data source. Phase 2 Failover requires each interface have
access to a shared data file. Failover operation is automatic and operates with no user
interaction. Each interface participating in failover has the ability to monitor and determine
liveliness and failover status. To assist in administering system operations, the ability to
manually trigger failover to a desired interface is also supported by the failover scheme.
The failover scheme is described in detail in the UniInt Interface User Manual, which is a
supplement to this manual.
2
Appendix B.
Command Line Parameters
The following table lists interface-specific command line parameters used in the interface
startup batch file to configure settings. These parameters are provided for debugging
purposes, to help you read the file. To ensure a correctly-formatted file, use the PI Interface
Configuration Utility to configure the interface. For details about flags that are common to all
UniInt interfaces, refer to the UniInt Interface User’s Guide.
Parameter
Description
/CheckOffline=S
Specifies in seconds how long the interface waits before trying to
reconnect to an offline computer. The interval starts at the last time the
interface lost the connection or tried to reestablish the connection.
Minimum and default is 120 (2 minutes). To disable reconnection, specify
-1.
Optional
Default: 120 seconds
/deb
Optional
Used to print interface-level debug messages. The debug levels range
from 0 to 9. For example,
/deb=5
This interface supports standard UniInt debugging levels, but does not
implement any interface-specific ones.
/LocalHighPriority
Optional
/NoErrorLogging
Use high priority to collect performance data from the local system. By
default the interface treats local and remote computers the same way,
using number of threads specified by /TC switch (see below).
Use this switch if gathering performance data from the local system is
time-critical and must not depend upon the number and status of
monitored remote systems.
Disable logging of error messages to the PIPC.log file.
Optional
/NoErrorStatus
Optional
/ReloadPerfData=S
Optional
Default: -1
/tc=x
Optional
Default = 10
PI Interface for Performance Monitor
Disable assignment of digital system error states to data tags when the
interface is unable to gather data for the corresponding performance
counter. By default, the interface writes a descriptive digital state when
errors occur. Disabling error status ensure that there are no gaps in the PI
tag’s data value history.
Specifying how often the interface unloads and reloads local and remote
performance data providers, which supply data for performance counters.
By default, the interface does not periodically unload and reload data
providers. This operation incurs significant overhead but enables the
interface to detect performance counters for PI interfaces that start after
the Perfmon interface begins routine data collection.
Used to specify the number of threads used by the interface. The number
of threads range from 1 to 99. The default is 10 if the /tc parameter is
not specified. For example,
/tc=5
3
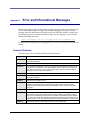
Appendix C.
Error and Informational Messages
Messages are logged to the local PI message log during interface startup, data collection and
recover. Additional messages are logged if you enable debugging. The log also contains
messages from the UniInt framework and the PI API (on which this interface is based), and
the buffering program. For detailed information about interface logging, see the following
OSIsoft Knowledge Base topic:
http://techsupport.osisoft.com/Support+Solution/8/KB00401.htm
For details about managing the error logging process, see the PI API Installation Instructions
manual.
Common Problems
The following is a list of common problems and likely solutions.
Symptom
The remote computer being monitored is offline.
Resolution
The interface will continue trying to monitor the instance and will find it when the
computer is restarted.
Symptom
I am unable to obtain remote counters.
Resolution
The interface is installed to run with the system account privileges as a service and the
user account for interactive. Go to The PIPerfMon Service section for a description of
the solution for services. Log on to the computer with a user account with sufficient
privileges to run the interface interactively.
Symptom
The application or thread being monitored has stopped.
Resolution
The interface continues trying to monitor the instance and will find it when the process
or thread is restarted.
Symptom
All values for my disks are zero.
Resolution
The counters for the Physical and Logical Disk objects don’t work until the Disk
Performance Statistics Driver in the I/O Manager disk stack is installed. Use the
Diskperf utility to install the Disk Performance Statistics Driver, and then restart the
computer.
Symptom
I have several disks, but values are only shown for the first disk in the set.
Resolution
When Diskperf was used, the standard option was specified, diskperf –y, which places
the statistics collector above the fault tolerant driver, FTDISK. The statistics collector
cannot see the different physical instances of the disk. Run Diskperf using the diskperf
–ye option, then restart the computer. This places the statistics collector below the fault
tolerant driver so it can see physical disks before they are combined into a volume set.
Symptom
%Disk Read Time and %Disk Write Time don’t sum to %Disk Time
PI Interface for Performance Monitor
5
Configuring PI Tags for the PI Interface for Performance Monitor
Resolution
All disk counters include time in the queue. When the queue gets long, the read and
write time both include that time and don’t sum to 100.
%Disk Read Time:_Total and %Disk Write Time:_Total sum to more than 100%
because there is more than one instance of the physical or logical disk.
The percentage counters are limited, by definition to 100% and cannot display higher
values. Use the Avg. Disk Read Queue Length, Avg. Disk Write Queue Length, and
Avg. Disk Queue Length counters instead. These report on the same data as the %Disk
Time counters, but display the values in decimals that can exceed 1.0.
Symptom
Why is there a _Total instance on the ID counters? What would a total ID Thread
counter show?
Resolution
Items in the Instances box are the same for all counters of an object.
When an instance has no Resolution, as in the case of _Total for IDs, a zero value is
displayed for the counter.
Symptom
Process: Pool Non-paged Bytes:_Total doesn’t equal Memory: Pool Non-paged Bytes
Resolution
The Memory: Pool Non-paged Bytes value comes from an internal counter that counts
each byte. The Process: Pool Non-paged Bytes counters are estimates from the Object
Manager. The Object Manager counts accesses, not space, so its counts include
requests to duplicate object handles as well as space for the object.
Ignore the static value of the counters and, instead, monitor any changes in the values
Symptom
Where is the Processor Queue Length Counter?
Resolution
It’s a System object counter. There is just one processor queue for all processors.
Symptom
Counter values for instances of an object are greater than those for the total
Resolution
The %Disk Time and %Processor Time counters are limited, by definition, to 100%. If
there are multiple disks or processors, each could equal 100%, but the total counter
cannot display the sum.
Monitor the physical instances separately. For disks, use the Avg. Disk Queue Length
counters instead of the %Disk Time counters. These display the totals as decimal, not
percentages, so they can exceed 1.0.
For processors, use the System: %Total Processor Time counter. This averages the
active time of each processor over all processors.
Informational Messages
These messages are normal and do not require action.
6
Message
device (name) added to the interface, number of devices is X
Description
Informational message is logged when a new device is added to the interface. The
addition happens when the interface loads a PI point at startup or during its runtime.
Message
device (name) removed from the interface, number of devices is X
Description
Informational message is logged when the device that does not have any PI points
assigned to it is being removed. A device may not have any points assigned for two
reasons: (1) all points for the device were changed in the PI Server and unloaded by
the interface, and (2) all points initially loaded for the device at startup did not pass
validation and were rejected.
The interface delays device removal for approximately 5 minutes. If another PI point
with the same device is loaded by the interface in this interval, then another device is
created – the old device marked for removal is never reused.
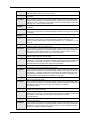
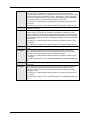
Warning Messages
These messages are returned when the function has completed successfully but the results
might be different than expected.
Message
<PI point name> (point ID) counter path does not have computer name part
Description
This message is logged when the interface loads PI point with an extended descriptor
attribute that omits the computer name from the performance counter path. If you omit
the computer name, the interface monitors localhost, but this omission can cause
problems if the interface is later moved to another node.
Message
<PI point name> (point ID) calculate value: not enough samples - value is dropped (two
samples required to calculate the value)
Description
Warning message is logged when the interface fails to collect two performance data
samples necessary for calculating the value to be sent to the PI Server. The warning
may appear in the log when the interface is overloaded by too many devices, scan
classes or loaded PI points.
Message
<PI point name> (point ID) calculate value: bad counter value received - value is
dropped (previous sample data must be smaller than the last)
Description
This message is logged when the interface receives bad data from a performance data
provider. Typically, performance data values are calculated using a continuously
incremented value and timestamp returned by a provider. This message is logged when
the most recent sample’s data variable is not greater than the previous sample’s data.
A similar message is logged for a mismatch between timestamp variables.
Message
<PI point name> (point ID) calculate value: bad counter value received - value is
dropped (invalid frequency value)
Description
This message is logged when the interface receives bad data from performance data
provider. In some cases, performance data providers return samples that contain two
pieces of information: (1) sample value and (2) the frequency at which this sample was
collected. In the further calculation of the performance data value, the frequency part
serves as a denominator, thus its value cannot be 0. This message is logged when the
value of the frequency is 0.
Message
<PI point name> (point ID) calculate value: bad counter value received - value is
dropped (invalid time value)
Description
This message is logged when the interface receives bad data from a performance data
provider. In some cases, performance data providers return samples that contain two
pieces of information: (1) sample value and (2) timestamp at which this sample was
collected. In the further calculation of the performance data value, the timestamp part
serves as a denominator, thus its value cannot be 0. This message is logged when the
value of the timestamp is 0.
Message
<PI point name> (point ID) calculate value: bad counter value received - value is
dropped (invalid counter type)
Description
This message is logged when the interface receives bad data from performance data
provider. The interface, as a compliant performance data consumer, expects data from
performance data providers to be returned in one of the predefined formats. If the data
provider fails to send data in the format defined by Microsoft specifications, this data is
dropped and the message is logged.
Message
<PI point name> (point ID) calculate value: bad counter value received - value is
dropped (invalid base counter)
Description
This message is logged when the interface receives bad data from performance data
provider. In some cases, performance data sample returned from the provider contains
a “base counter”, which is necessary for further calculation of the value. The message
is logged when the provider fails to return this base counter in the sample.
Message
<PI point name> (point ID) calculate value: bad counter value received - value is
dropped (encountered an unidentified counter)
PI Interface for Performance Monitor
7
Configuring PI Tags for the PI Interface for Performance Monitor
Description
This message is logged when the interface receives bad data from a performance data
provider. The interface is written and tested on Windows 8 and Windows 2012 Server
latest products available from Microsoft and complies with the latest performance
monitoring specifications from MSDN. Future versions of performance data providers
that implement data sample formats that are unknown at the time of this interface
version release are the most probable cause for the message.
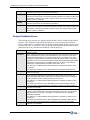
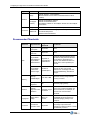
Error Messages
These messages are returned when the function cannot be complete as requested, and some
corrective action might be required.
8
Message
parse arguments: missing required argument - id
Description
Error message is logged on interface startup if required /ID command line parameter is
not specified. After the message, the interface stops.
Message
<PI point name> (point ID) add tag error: invalid scan class (must be in the range of 1
to X inclusive)
Description
Error message is logged when the interface loads a PI point with a Location4 attribute
that is not in the range of specified /F parameters. After the message, the PI point is
rejected by the interface. At least one /F parameter must be specified for the interface.
This first parameter correlates with Location4 set to 1 for the PI point.
Message
<PI point name> (point ID) add tag error: invalid counter path (cannot be empty)
Description
Error message is logged when the interface loads a PI point with empty Extended
Descriptor attribute. The attribute must contain a string value representing either
latency tag or performance counter path.
Message
<PI point name> (point ID) add tag error: invalid point type
Description
Error message is logged when the interface loads a PI point with a data type that is
neither numeric nor digital. The interface supports PI points of the following types:
Float16, Float32, Float64, Int16, Int32, and Digital.
Message
<PI point name> (point ID) add tag error (validation): duplicate tag (latency tag for the
scan class for the computer is already loaded - pointid: (point ID)
Description
Error message is logged when the interface loads a duplicate latency PI point for a
given device and scan class.
Message
<PI point name> (point ID) add tag error (validation): duplicate tag (duplicate tag (tag
with the same counter path for the scan class for the computer is already loaded pointid: (point ID)
Description
Error message is logged when the interface loads a duplicate data or status PI point for
a given device and scan class with the same performance counter path. Please, note
that the interface is capable of loading the same performance counters in different scan
classes.
Message
<PI point name> (point ID) add tag error: invalid tag data type (latency tag cannot be
digital)
Description
Error message is logged when the interface loads a latency PI point with extended
descriptor attribute set to “[LATENCY:COMPUTER]” and type digital. Latency tags can
have only numeric data types. The recommended type is Float32.
Message
<PI point name> (point ID) add tag error: invalid counter path (invalid computer name)
Description
Error message is logged when the interface loads a PI point with extended descriptor
attribute containing invalid computer name part. Device name must be at least one
character long and satisfy less restrictive NetBIOS naming rules, where the following
characters are invalid: ^ \ / : * ? > < |
Message
<PI point name> (point ID) add tag error: invalid counter path (missing closing ']'
character)
Description
Error message is logged when the interface loads a latency PI point with extended
descriptor attribute missing closing ‘]’ character.
Message
<PI point name> (point ID) add tag error: invalid counter path (must start with a '\'
character)
Description
Error message is logged when the interface loads a data or status PI point with invalid
performance counter path in its extended descriptor attribute: the string must start with
either one or two ‘\’ characters. One if computer part is not specified (which produces a
warning), two – before computer name part.
Message
<PI point name> (point ID) add tag error: invalid counter path (cannot end with a '\'
character)
Description
Error message is logged when the interface loads a data or status PI point with invalid
performance counter path in its extended descriptor attribute: the string cannot end with
‘\’ character.
Message
<PI point name> (point ID) add tag error: invalid counter path (length is too small)
Description
Error message is logged when the interface loads a data or status PI point with invalid
performance counter path in its extended descriptor attribute: theoretically, the
minimum counter path should be no less than 4 characters: (1) ‘\’, (2) ‘object’, (3) ‘\’, (4)
‘counter’.
Message
<PI point name> (point ID) add tag error: invalid counter path (missing '\' character
between computer name and object name)
Description
Error message is logged when the interface loads a data or status PI point with invalid
performance counter path in its extended descriptor attribute: according to the Microsoft
specification, counter path must have 3 or 4 back-slash characters, which serve as
separators between computer name, object and counter parts.
Message
<PI point name> (point ID) add tag error: invalid counter path (missing '\' character
between object name and counter name)
Description
Error message is logged when the interface loads a data or status PI point with invalid
performance counter path in its extended descriptor attribute: according to the Microsoft
specification, counter path must have 3 or 4 back-slash characters, which serve as
separators between computer name, object and counter parts.
Message
<PI point name> (point ID) add tag error: invalid counter path ('*' character is reserved
for wildcard use and not supported by the interface)
Description
Error message is logged when the interface loads a data or status PI point with invalid
performance counter path in its extended descriptor attribute: according to the Microsoft
specification, ‘*’ character can be used in counter paths as a wildcard character, which
allows to specify multiple counters by one path. The interface does not support this: it
requires exactly one performance counter path for one PI point.
Message
<PI point name> (point ID) add tag error: invalid counter path (invalid counter path
object name cannot be empty)
Description
Error message is logged when the interface loads a data or status PI point with invalid
performance counter path in its extended descriptor attribute: according to the Microsoft
specification, object part cannot be empty. For example, this is invalid:
\\computer\\counter
Message
<PI point name> (point ID) add tag error: invalid counter path (invalid counter path
counter name cannot be empty)
Description
Error message is logged when the interface loads a data or status PI point with invalid
performance counter path in its extended descriptor attribute: according to the Microsoft
specification, counter part cannot be empty. For example, this is invalid:
\\computer\object\
Message
<PI point name> (point ID) add tag error: invalid counter path (no matching '(' character
found in object name)
Description
Error message is logged when the interface loads a data or status PI point with invalid
performance counter path in its extended descriptor attribute: according to the Microsoft
specification, object part may contain ‘(instance name)’. The error indicates that either
starting ‘(‘ or ending ‘)’ character is missing.
PI Interface for Performance Monitor
9
Configuring PI Tags for the PI Interface for Performance Monitor
Message
<PI point name> (point ID) add tag error: invalid counter path ('\' character is reserved
and must be used only for object\counter separation)
Description
Error message is logged when the interface loads a data or status PI point with invalid
performance counter path in its extended descriptor attribute: according to the Microsoft
specification, object part may contain ‘(instance name)’. The instance name sub-part
cannot contain ‘\’ characters.
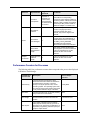
Delayed Validation Errors
The following error messages are logged when the interface fails to validate already-loaded
PI points. This validation is required for the interface to service PI points from different
devices without delay. If validation fails, the PI point remains loaded, but the interface writes
its status only once. To resolve the issue, correct the point configuration. When the interface
detects that one of its points has been modified, it reloads the point.
10
Message
<PI point name> (point ID) add tag error (validation): invalid counter path (counter
object not found)
Description
Error message is logged when the interface fails to find the specified counter object on
the monitored device. Typically, this indicated either a typo in the object name of the
performance counter path, or non-existing counter object. For example, if a PI point
configured to collect performance data from another PI interface which is not currently
installed as a service on the monitored device, then by default (/ReloadPerfData startup
parameter is not specified), the PI PerfMon interface is not able to dynamically tell
whether the monitored interface is installed on the device or not.
For data tags: if no /NoErrorStatus startup parameter is specified, the status is set to
“Configure”.
For status tags: the status is set to “NO OBJECT” from PIPerfMon digital state set.
Message
<PI point name> (point ID) add tag error (validation): invalid counter path (counter
object not returned)
Description
Error message is logged when the performance data provider does not return the
requested object. Note that the object exists in the performance counter configuration
on the monitored machine, but the provider does not return it.
For data tags: if no /NoErrorStatus startup parameter is specified, the status is set to
“Configure”.
For status tags: the status is set to “NO OBJECT” from PIPerfMon digital state set.
Message
<PI point name> (point ID) add tag error (validation): invalid counter path (counter for
the object is not found)
Description
Error message is logged when the interface fails to find the specified counter of the
object on the monitored device. Typically, this indicates a typo in the counter name of
the performance counter path. For example: \\computer\Processor(_Total)\NOT
EXISTING COUNTER.
For data tags: if no /NoErrorStatus startup parameter is specified, the status is set to
“Configure”.
For status tags: the status is set to “NO COUNTER” from PIPerfMon digital state set.
Message
<PI point name> (point ID) add tag error (validation): invalid counter path (object
instance is not specified)
Description
Error message is logged when the interface fails to find required object instance name
part. Some of the performance counters require that the instance name of the
monitored object is specified. For example, for the Processor object, the system needs
to know the counter of which instance to return – all instances (_Total) or the first(0),
second (1) or another processor. In this case, omitting instance name in performance
counter path is an error: \\comuputer\Processor\% Processor Time.
For data tags: if no /NoErrorStatus startup parameter is specified, the status is set to
“Configure”.
For status tags: the status is set to “NO INSTANCE” from PIPerfMon digital state set.
Message
<PI point name> (point ID) add tag error (validation): invalid counter path (object
instance is not found)
Description
Error message is logged when the interface fails to find any instance of the counter
object running on the device. For example, if the interface is configured to monitor
another PI interface, and the PI point for monitoring this interface is loaded before the
interface startup, then by default (/ReloadPerfData startup parameter is not specified),
the PI PerfMon interface is not able to dynamically tell whether the monitored interface
started or not.
For data tags: if no /NoErrorStatus startup parameter is specified, the status is set to
“Configure”.
For status tags: the status is set to “NO INSTANCE” from PIPerfMon digital state set.
Message
<PI point name> (point ID) add tag error (validation): invalid counter path (base counter
used)
Description
Error message is logged when the interface encounters a “base counter” being
specified in performance counter path. According to Microsoft specification, base
counters cannot be used directly to report any performance data.
For data tags: if no /NoErrorStatus startup parameter is specified, the status is set to
“Configure”.
For status tags: the status is set to “INVALID COUNTER” from PIPerfMon digital state
set.
Message
<PI point name> (point ID) add tag error (validation): invalid counter path (counter not
supported)
Description
Error message is logged when the interface encounters a not sported counter being
specified in performance counter path. According to Microsoft specification, the
following counters are not currently supported: test counter, no data counter and
histogram counter.
For data tags: if no /NoErrorStatus startup parameter is specified, the status is set to
“Configure”.
For status tags: the status is set to “INVALID COUNTER” from PIPerfMon digital state
set.
PI Interface for Performance Monitor
11
Configuring PI Tags for the PI Interface for Performance Monitor
Errors Unloading PI Points
The following messages are logged when the interface experiences problems unloading PI
points. If you encounter any of these errors, contact OSIsoft Technical Support.
12
Message
<PI point name> (point ID) remove tag error: invalid dev_struct
Message
<PI point name> (point ID) remove tag error: logical - data tag misconfigured
Message
<PI point name> (point ID) remove tag error: logical - status tag misconfigured
Appendix D.
Recommended Performance Counters
to Monitor
To track the health and performance of your Windows computers, use the interface to
monitor the Windows performance counters described below.
Counters for Troubleshooting.
Object
Problem
Counters
Usage
LogicalDisk\% Free Space
LogicalDisk\% Disk Time
PhysicalDisk\Disk Reads/sec
PhysicalDisk\Disk Writes/sec
Use diskperf –y to enable disk counters and diskperf –n to disable
them. To specify the type of counters to activate, included for physical
disk drives and v for logical disk drives or storage volumes. When the
operating system starts up, it automatically sets the diskperf
command with the –yd switch to activate physical disk counters. Type
diskperf –yv to activate logical disk counters. For more information
about using the diskperf command, type diskperf -? At the
command prompt.
The % Disk Time counter must be interpreted carefully. Because the
_Total instance of this counter might not accurately reflect utilization
on multiple-disk systems, it is important to use the % Idle Time
counter as well. Note that these counters cannot display a value
exceeding 100 percent.
Bottlenecks
LogicalDisk\Avg. Disk Queue Length
PhysicalDisk\Avg. Disk Queue Length (all instances)
Usage
Memory\Available Bytes
Memory\Cache Bytes
Memory\Committed Bytes and Memory\Commit Limit can also be
used to detect problems with virtual memory.
Bottlenecks
or leaks
Memory\Pages/sec
Memory\Page Faults/sec
Memory\Pages Input/sec
Memory\Page Reads/sec
Memory\Transition Faults/sec
Memory\Pool Paged Bytes
Memory\Pool Non-paged Bytes
Although not specifically Memory object counters, the following are
also useful for memory analysis:
Paging File\% Usage Object (all instances)
Cache\Data Map Hits %
Server\Pool Paged Bytes and Server\Pool Non-paged Bytes
Disk
Memory
PI Interface for Performance Monitor
13
Configuring PI Tags for the PI Interface for Performance Monitor
Object
Problem
Counters
Usage
Network Segment: % Net Utilization
(Network Packet Protocol driver for Network Monitor must be
installed).
Throughput
(TCP/IP)
Network Interface\Bytes total/sec
Network Interface\Packets/sec
Server\Bytes Total/sec or Server\Bytes Sent/sec and Server\Bytes
Received/sec
Usage
Processor\% Processor Time (all instances)
Bottlenecks
System\Processor Queue Length (all instances)
Processor\Interrupts/sec
System\Context switches/sec
Network
Processor
Recommended Thresholds
Object\Counter
Suggested
Threshold
Comments
LogicalDisk\%
Free Space
15 percent
None
LogicalDisk\%
Disk Time
90 percent
None
Depends on
manufacturer’s
specifications
Check the specified transfer rate for
the disks to verify that this rate does
not exceed the specifications. In
general, Ultra Wide SCSI disks can
handle 50 to 70 I/O operations per
second.
PhysicalDisk\
Current Disk
Queue Length
Number of
spindles plus 2
This is an instantaneous counter;
observe its value over several
intervals. For an average over time,
use PhysicalDisk\Avg. Disk Queue
Length.
Memory\
Available Bytes
Less than 4 MB
Research memory usage and add
memory if needed.
Memory\
Pages/sec
20
Research paging activity.
Network
Network
Segment\% Net
Utilization
Depends on type
of network
Must determine the threshold based
on the type of network available. For
Ethernet networks, for example, 30
percent is the recommended
threshold.
Paging File
Paging File\%
Usage
Above 70
percent
Review this value in conjunction with
Available Bytes and Pages/sec to
understand paging activity on the
computer.
Processor
Processor\%
Processor Time
85 percent
Find the process that is using a high
percentage of processor time.
Upgrade to a faster processor or install
an additional processor.
Resource
Disk
PhysicalDisk\
Disk Reads/sec,
PhysicalDisk\
Disk Writes/sec
Memory
14
Resource
Server
Multiple
Processors
Object\Counter
Suggested
Threshold
Comments
Processor\
Interrupts/sec
Depends on
processor; for
current CPUs,
use a threshold
of 1500 interrupts
per second
A dramatic increase in this counter
value without a corresponding
increase in system activity indicates a
hardware problem. Identify the network
adapter or disk controller card causing
the interrupts. May need to install an
additional adapter or controller card.
Server\Bytes
Total/sec
If the sum of Bytes Total/sec for all
servers is roughly equal to the
maximum transfer rates of the
network, may need to segment the
network.
Server\Work
Item Shortages
3
If the value reaches this threshold,
consider tuning the InitWorkItems or
MaxWorkItems entries in the registry
(in HKEY_LOCAL_MACHINE
\SYSTEM \CurrentControlSet
\Services \lanmanserver \Parameters
Server Work
Queues\Queue
Length
4
If the value reaches this threshold,
there might be a processor bottleneck.
This is an instantaneous counter;
observe its value over several
intervals.
System\Process
or Queue
Length
2
This is an instantaneous counter;
observe its value over several
intervals.
Performance Counters for Processes
The following table lists performance counters that correspond to the process data displayed
in Windows Task Manager.
Task Manager
Process Tab
Description
System Monitor
Process Object
Counters
Base Priority
The base priority of the process, which
determines the order in which its threads are
scheduled for the processor. The base
priority is set by the process code, not the
operating system. The operating system sets
and changes the dynamic priorities of threads
in the process within the range of the base.
Priority Base
CPU Time
The total processor time, in seconds, used by
the process since it was started.
None
CPU Usage
The percentage of time the threads of the
process used the processor since the last
update.
% Processor Time
GDI Objects
The number of Graphics Device Interface
(GDI) objects currently used by a process. A
GDI object is an object from the GDI library of
application programming interfaces (APIs) for
graphics output devices.
None
PI Interface for Performance Monitor
15
Configuring PI Tags for the PI Interface for Performance Monitor
16
Task Manager
Process Tab
Description
System Monitor
Process Object
Counters
Handle Count
The number of object handles in the
process’s object table.
Handle Count
I/O Other
The number of input/output operations
generated by a process that are neither reads
nor writes, including file, network, and device
I/Os. An example of this type of operation
would be a control function. I/O Others
directed to CONSOLE (console input object)
handles are not counted.
I/O Other Operations/sec
I/O Other Bytes
The number of bytes transferred in
input/output operations generated by a
process that are neither reads nor writes,
including file, network, and device I/Os. An
example of this type of operation would be a
control function. I/O Other Bytes directed to
CONSOLE (console input object) handles are
not counted.
I/O Other Bytes/sec
I/O Read Bytes
The number of bytes read in input/output
operations generated by a process, including
file, network, and device I/Os. I/O Read Bytes
directed to CONSOLE (console input object)
handles are not counted.
I/O Read Bytes/sec
I/O Reads
The number of read input/output operations
generated by a process, including file,
network, and device I/Os. I/O Reads directed
to CONSOLE (console input object) handles
are not counted.
I/O Read Operations/sec
I/O Write Bytes
The number of bytes written in input/output
operations generated by a process, including
file, network, and device I/Os. I/O Write Bytes
directed to CONSOLE (console input object)
handles are not counted.
I/O Write Bytes/sec
I/O Writes
The number of write input/output operations
generated by a process, including file,
network, and device I/Os. I/O Writes directed
to CONSOLE (console input object) handles
are not counted.
I/O Write Operations/sec
Image Name
Name of the process.
The process name in the
Instances box
Memory Usage
The amount of main memory, in kilobytes,
used by the process.
Working Set
Memory Usage
Delta
The change in memory use, in kilobytes,
since the last update. Unlike System Monitor,
Task Manager displays negative values.
None
Non-paged Pool
The amount of memory, in kilobytes, used by
a process. Operating system memory that is
never paged to disk. Paging is the moving of
infrequently used parts of a program’s
working memory from RAM to another
storage medium, usually the hard disk.
Pool Non-paged Bytes
Task Manager
Process Tab
Description
System Monitor
Process Object
Counters
Page Faults
The number of times that data had to be
retrieved from disk for this process because it
was not found in memory. This value is
accumulated from the time the process is
started.
None
Page faults/sec is the
rate of page faults over
time.
Page Faults
Delta
The change in the number of page faults
since the last update.
None
Paged Pool
The amount of system-allocated virtual
memory, in kilobytes, used by a process. The
paged pool is virtual memory available to be
paged to disk. Paging is the moving of
infrequently used parts of a program’s
working memory from RAM to another
storage medium, usually the hard disk. The
paged pool includes all of user memory and a
portion of system memory.
Pool Paged Bytes
Peak Memory
Usage
The peak amount of physical memory
resident in a process since it started.
None
PID (Process
Identifier)
Numerical ID assigned to the process while it
runs.
ID Process
Thread Count
The number of threads running in the
process.
Thread Count
USER Objects
The number of USER objects currently being
used by a process. A USER object is an
object from Window Manager, which includes
windows, menus, cursors, icons, hooks,
accelerators, monitors, keyboard layouts, and
other internal objects.
None
Virtual Memory
Size
The amount of virtual memory, or address
space, committed to a process.
Private Bytes
Process Counters for Performance Data
The following table lists performance counters for performance data displayed in Windows
Task Manager
Task Manager
Performance
Tab
Description
System Monitor Counters
CPU Usage
The percentage of time the processor is
running a thread other than the Idle thread.
Processor\% Processor
Time
MEM Usage
The amount of virtual memory used, in
kilobytes.
Memory\Committed Bytes
Total Handles
The number of object handles in the tables
of all processes.
Process(_Total)\Handle
Count
Total Threads
The number of running threads, including
one Idle thread per processor.
Process(_Total)\Thread
Count
PI Interface for Performance Monitor
17
Configuring PI Tags for the PI Interface for Performance Monitor
18
Task Manager
Performance
Tab
Description
System Monitor Counters
Total Processes
The number of active processes, including
the Idle process.
Object\Processes is the
same, but excludes the Idle
process.
Physical
Memory: Total
Amount of physical, random access
memory, in kilobytes, installed in the
computer.
None
Physical
Memory:
Available
Amount of physical memory available to
processes, in kilobytes. It includes zeroed,
free, and standby memory.
Memory\Available Bytes
Physical
Memory: File
Cache
Amount of physical memory, in kilobytes,
released to the file cache on demand.
Memory\Cache Bytes
Commit Charge:
Total
Size of virtual memory in use by all
processes, in kilobytes.
Memory\Committed Bytes
Commit Charge:
Limit
Amount of virtual memory, in kilobytes, that
can be committed to all processes without
enlarging the paging file.
Memory\Commit Limit
Commit Charge:
Peak
The maximum amount of virtual memory, in
kilobytes, used in the session. The commit
peak can exceed the commit limit if virtual
memory is expanded.
None
Kernel Memory:
Total
Sum of paged and non-paged memory, in
kilobytes.
None
(Sum of Pool Paged Bytes
and Pool Non-paged Bytes)
Kernel Memory:
Paged
Size of the paged pool, in kilobytes,
allocated to the operating system.
Memory\Pool Paged Bytes
Kernel Memory:
Non-paged
Size of the non-paged pool, in kilobytes,
allocated to the operating system.
Memory\Pool Non-paged
Bytes
PI Interface for Performance Monitor
19