1
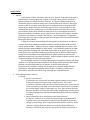
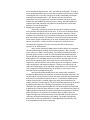
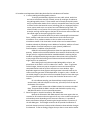
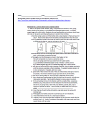
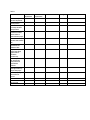
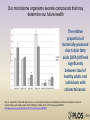
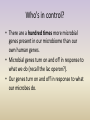
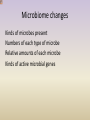
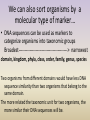
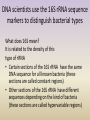
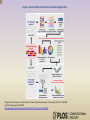
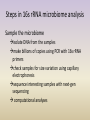
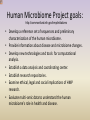
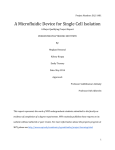
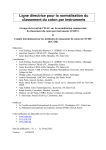
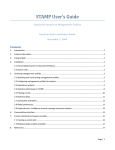
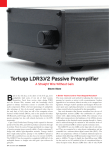
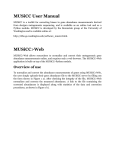
How can high school students combine computational biology tools with a laboratory model to analyze changes in the human gut microbiome? Andrea Cobb, Ph.D., Thomas Jefferson High School for Science and Technology, Alexandria, VA Mentor: Patrick M. Gillevet, Ph.D., Microbiome Analysis Center, George Mason University, Manassas, VA Table of Contents TEACHER GUIDE: I. Abstract II. Science Background for Teachers A. Content B. Procedures and Apparatus Which May Be Unfamiliar to Students and Teachers III. Student Outcomes A. Science Concepts: B. Placement for these materials within a high school course C. What students will do D. What technical skills students will learn E. Relevance to other science concepts and to students’ lives IV. Standards and Learning Objectives A. NGSS B. Improvement C. Learning Objectives V. Time Requirements A. Initial assessment B. Engage C. Explore D. Explain E. Elaborate F. Evaluate VI. Advance Preparation VII. Materials and Equipment VIII. Student Prior Knowledge and Skills IX. Daily Unit Plans Day 1: Assess prior understanding Day 2: Power Point Presentation Day 3: Microbiome Articles Day 4: Microbiome Model Day 5: Sampling and DNA Isolation Day 6: PCR Day 7: Gel Electrophoresis Day 8: Capillary Electrophoresis Day 9: Computational Analysis Day 10: Assessment Rubric 3 3 3 3 5 7 7 7 7 8 8 8 8 8 8 8 8 8 8 8 9 9 9 10 12 13 13 14 14 14 16 20 22 22 22 22 24 Teacher Guide: I. Abstract In the summer of 2013, with Patrick Gillevet, Ph.D., Director of Microbiome Analysis at George Mason University, Manassas, Virginia, I examined existing data for correlations between patient liver health and serum cytokines. Dr. Gillevet’s laboratory focuses on microbiome analyses in diverse settings, from ocean samples to clinical ones. During the summer of 2013 I was shown how to generate a microbiome library and run Roche 454 sequencing on samples that they were studying at that time. I then learned to use the computational pipeline including open source software Qiime and Cytoscape to analyze prior sequencing data, derive operational taxonomic units, and investigate correlations between the patient microbiome, serum cytokine levels and liver status (healthy, alcoholic, nonalcoholic liver disease or alcoholic liver disease). Such investigations are hypothesis generating rather than more traditional hypothesis testing and so may be a different way of thinking for some students. In order for my senior Biotechnology research students to participate in microbiome research, we used an inexpensive model microbiome in which students could introduce environmental variables. Students set up the models, incubated them for 5 weeks, took samples and then extracted DNA from each sample. They prepared the DNA for 16s rRNA PCR amplification. Following PCR, we verified amplification on an agarose gel, then I ran those samples on a capillary electrophoresis genetic analyzer to determine differences in lengths of the PCR products; such length differences reflect potential environmentally dependent changes in the microbial community. Further sample correlation analysis may be considered using open source Cytoscape software. This unit engages students in learning fundamentals of microbiome research and allows students to set up and manipulate inexpensive microbiome models and make observations. Students may also isolate DNA from the samples. If capillary electrophoresis instrumentation is available, students may perform the microbiome sample DNA PCR amplification and length heterogeneity analysis as well. Introductory information is presented for students interested in using Cytoscape as a computational tool. II. Science Background for Teachers A. Content 1. What is a microbiome? A microbiome is a consortium of microbial organisms (bacteria, fungi, viruses, Archae) that inhabit and interact with a eukaryotic host. The human microbiome is found on every external surface and within every system that has an external opening. Each body surface and system has differences in humidity, pH, nutrient supply, oxygen concentration, etc. Thus, those surfaces also host different microbes—as a result the human body is populated by location specific microbes (although some microbes are adaptable and can be found in multiple locations). 2. What is importance of the microbiome in the immune system? As soon as a child is born, its systems and surfaces begin to be populated by microbes. Some of the microbes are transferred to the child by the parents, siblings or surroundings. Others may come via food, water or airborne. While research is ongoing about how person to person microbiome differences develop, it is clear that within the first year of life, the immune system learns which microbiome organisms are “safe” and which are pathogenic. Through a poorly understood mechanism, the microbiome also trains the immune system to distinguish self vs. non-self, setting up the child’s susceptibility to allergies and autoimmune diseases later in life. Because the host-microbiome interactions occur at the gene level, microbes have been shown to regulate human cells and feedback to what the human is doing! Microbial signals like cytokines and small molecules may influence varied responses from human behavior to tumor development. 3. Microbiome research models Historically, microbiome research was limited to studying microbes which could be cultured outside of their host. E. coli is such an example which was cultured by a pediatrician from his patient’s diapers. However, limited numbers of the thousand or more microbes inhabiting our microbiomes have been successfully cultured. Scientists don’t know the necessary combinations, yet for media, oxygen requirements, pH or other complex factors needed to culture all microbes. Further, since the microbiome is made up of many interdependent organisms, scientists may never be able to culture each organism as an isolated strain. Now, modern methods of DNA analysis enable scientists to investigate the microbiome without needing to culture the organisms. After sampling (stool, saliva, etc.), DNA is easily isolated. For bacterial microbiome analysis, a particular genetic marker is used—the 16S ribosomal RNA (rRNA) sequence. The 16S provides information about the RNA fragment’s size relative to other RNA fragments. The 16S rRNA sequence is present in all prokaryotes and has portions of its sequence which are present in every known Eubacteria. Importantly, the 16S rRNA also has variable regions whose sequence variations reflect evolutionary and taxonomic distance. Scientists can make billions of copies of selected regions of the 16S rRNA using PCR from only a few bacteria. Thus a range of microbiome bacteria in the sample, from the most to least abundant can be investigated using PCR. Well characterized PCR DNA primers are commercially available to amplify 16S rRNA sections that have both constant and variable sequences. The variable regions of some bacteria present may have qualitative and quantitative differences in nucleotides compared to others. If quantitative differences are evident (some microbe’s variable regions may have more nucleotides than another microbe’s variable regions), the PCR- amplified sequences can be sorted by capillary electrophoresis. Capillary electrophoresis has a much higher resolution than standard gel electrophoresis and can distinguish PCR amplified fragments only a few base pairs different in length. The characteristic pattern of lengths generated from PCR and capillary electrophoresis generates a profile of peaks characteristic of a particular microbiome. Such a profile reflects the length heterogeneity of selected sections of the 16S rRNA; thus this method is referred to as length heterogeneity PCR (LHPCR). The length heterogeneity peak profile can then be evaluated for sample-dependent correlations using free computational tools such as Cytoscape. B. Procedures and Apparatus Which May Be Unfamiliar to Students and Teachers 4. In vitro modeling with Winogradsky columns To comply with biosafety regulations at our public school, we did not use human microbiome samples. Instead, we set up model gut microbiomes using Winogradsky columns. These models can be cheaply and quickly made using recyclable water bottles for the column, composted cow manure or pond or stream mud as the bacterial source, boiled egg yolk as a hydrogen/electron source, paper towel strips as a carbon source and bottled spring water. The column models a cross-section of the human gut microbiome by having an anaerobic and high sulfide region at the base of the column and an aerobic and low sulfide region at the opening (top) of the column. To gather information about how to select a meaningful environmental factor, students read short articles about factors which influence the gut microbiome. Then, students voted as a class on what to test with their microbiome models. Each class had a control column and a treated column. Students selected the following to test: addition of antibiotic, addition of bread yeast, addition of artificial sweetener or sugar (control), addition of acetaminophen, or addition of psyllium fiber. Students had interesting discussions about the appropriate treatment quantity. Students also considered whether the treatment would actually reach the gut (colon) or might be absorbed or metabolized before reaching the gut. Students investigated underlying assumptions about how similar composted manure might be to the human gut microbiome and how those differences might factor in our predictions. After setting up the microbiome model Winogradsky columns, we placed them in the dark in a 37°C incubator for 5 weeks. Note: To generate visible changes, classes may opt to use pond or stream mud instead of the composted manure and set up those columns in a warm window. Lightdependent organisms have pigments which generate horizontal bands in the columns and may generate variable dependent changes in colors. We did not see visible changes in the columns that we sampled except for those due to gas formation (pockets of gas)or in one case, due to a darker brown color in one column. For microbiome sampling, we discussed how to avoid sample cross contamination and took samples from the top, 1/3 and 2/3 from the top and the bottom of the column. Students used a commercial soil DNA isolation kit to extract microbial DNA. They quantified the DNA in samples and checked the quality using 260/280 ratio with a UV micro-spectrophotometer. 5. Detect changes in microbial community 16S rRNA peaks Because the Eubacterial 16S rRNA sequence has some regions that are constant for all bacteria and some regions that vary in the number and types of nucleotides present depending on the taxonomic distance, it is possible to detect microbiome changes by examining the length variations in portions of the 16S rRNA gene. These length variations do not provide the identities of particular bacteria present, but do provide information about whether changes are detected. To use an analogy, imagine that you share a room with a teacher whose students have just finished using classroom computers for individual assignments on different animals. If you examine the search history from each student, there will be websites that every student visited (the class website, the required animal information sites, but you will also see student-dependent variations in search history content and numbers of websites that depend on the assigned animal. Search histories for similar animals (housecats and lions) would be more alike than for more taxonomically different animals (housecats and snails). Some of the search histories would be longer than others. Some of the search histories might be the same length even though students visited different websites. Some students may have visited 5 websites but others may have visited 10 websites. The length variation will tell us that some differences are in play (maybe some animals have a lot of websites!) but the length variation alone does not tell us what is causing those differences. However, length variation can tell us that some change is happening. To determine more about such changes, further experimentation or analysis (like sequencing the genes) is required. For these 16 length heterogeneity experiments, we used the polymerase chain reaction (PCR) with a pair of primers designed to amplify a constant region of the 16S rRNA gene starting at nucleotide 27, spanning two variable regions and ending at a constant region ending about nucleotide 350. The forward primer was labeled with a fluorescent chemical called FAM. As the primer is incorporated into a copied DNA fragment, also called an amplicon, the new amplicon becomes fluorescently labeled and can now be detected with a fluorescence detector. The lengths of the two variable regions reflect different bacteria, although it is possible and indeed likely that two very different bacteria may happen to have the same length for these regions, although not the same sequence. After the DNA from our microbiome sample was amplified using this PCR method, we verified the success of the PCR amplification using standard 1% agarose gels. Soil samples have been shown to contain PCR inhibiting chemicals that co-purify with the soil bacterial DNA, and thus, we needed to include this step. We also sized the samples using DNA ladders to verify that our PCR products were in the expected size range 0f 300-450 bp. However, common agarose gel electrophoresis cannot resolve the small size differences of DNA fragments as finely as needed for our study, so we next used capillary electrophoresis, a method which can resolve DNA fragment sizes within 5 base pairs. Capillary electrophoresis instruments are formally called genetic analyzers. They can perform fragment analyses like we do in this study and can also be used to sequence a gene. These instruments are commonly used in forensic laboratories do determine whether the genetic patterns of a suspect match those found at a crime scene. Genetic analyzers are relatively simple and inexpensive to use but are limited in the numbers of genes they can sequence per day. Scientists who need to sequence many genes per day use higher throughput sequencing such as next-gen sequencing. Another difference between capillary electrophoresis and standard electrophoresis is in the method used to detect the DNA fragments. In standard agarose electrophoresis, bands are made detectable after electrophoresis and staining with methylene blue, SYBR safe dye or ethidium bromide. With capillary electrophoresis, the FAM fluorescently labeled fragments, migrate through a capillary electrophoretically, pass a laser whose light causes the fragments to fluoresce and the fluorescence is detected by a special camera. The fluorescence intensity corresponds to the number of FAM labeled fragments at that particular size. Fragments continue to move and are collected in a buffer receptacle until electrophoresis of the largest fragments has completed. Open source Peak Scanner or proprietary Gene Mapper software translates the genetic analyzer’s fluorescence signals to a series of peaks on a graph. The graph’s Y axis displays relative fluorescence intensity (numbers of fragments at a particular size) and the X axis is collection time (which corresponds to size, since the smaller fragments travel more quickly than the larger fragments). Each sample is spiked with a size standard labeled with a different fluorescing chemical. The fluorescence detector can distinguish (by different color/wavelength of fluorescence) the FAM labeled sample fragment from the fluorescently labeled size standard and plots both the sample peaks and the standard peaks on the same graph. Computational analysis (correlational analysis)—See http://cytoscape.org/what_is_cytoscape.html Data saved as an excel spreadsheet can be analyzed for correlations in the data. For example, which microbiome samples have a particular type of bacteria and which do not? Such correlations can be used to generate hypotheses about cause and effect. III. Student Outcomes A. Science Concepts: Content knowledge about the human microbiome 1. Describe known gut microbiome-immune interactions 2. Predict factors which might change the composition of the microbiome 3. Ecological roles in the microbiome B. Understand microbiome research methods 1. Rank and defend important questions from the Human Microbiome Project 2. Research approaches a. Understand how scientists use clinical samples (disease states) and computational analyses to examine correlation and generate hypotheses b. Summarize research about a microbiome change (over time, body location, diet, etc.) c. Participate in In vitro modeling of the gut microbiome. B. Placement for these materials within a high school course a. Ecology b. Immunology c. Evolution d. Research methods C. What students will do a. Take a quiz to assess prior understanding. b. View a power point presentation on fundamental concepts. c. Read articles to construct a testable hypothesis. d. Conduct an in vitro experiment with a gut microbiome model. e. Perform PCR with fragment length analysis. f. Conduct computational analysis to find correlations between treatments and fragment length results. g. Assess learning with group posters and short presentation and/or with a short quiz. D. What technical skills students will learn a. Constructing a valid experiment b. Setting up an in vitro model of the gut microbiome c. Sampling methods d. PCR and fragment length analysis e. Computational analysis E. Relevance to other science concepts and to students’ lives a. Evolution b. Immunology c. Ecology d. Medicine e. Computers in biology f. Food supply g. Health related applications h. Ethics IV. Standards and Learning Objectives A. NGSS 1. NGHSS HS-LS2-6. Evaluate the claims, evidence, and reasoning that the complex interactions in ecosystems maintain relatively consistent numbers and types of organisms in stable conditions, but changing conditions may result in a new ecosystem B. Improvement 1. Students learning will increase at least an average of 50% improvement on post-unit assessment compared to initial assessment. C. Learning Objectives After completing the unit, students will be able to: 1. Compare and contrast features of the human microbiome. 2. Explain causes and potential impact of microbiome variation on the immune system. 3. Analyze microbiome data. 4. Provide advantages and disadvantages of microbiome research models. 5. Relate their understanding of microbiome-immune system interactions to their lives. V. Time Requirements A. Initial assessment I would give this online for a homework assignment—30 minutes. B. Engage Read article/short video clip about microbiome---15 minutes C. Explore Student groups generate questions of interest ---30-60 minutes D. Explain Formally work with content—2 x 60-80 minute blocks E. Elaborate Work with experimental approaches, build capacity— 1. Set up in vitro experiments with the Winogradsky column models-30-45 min 2. Gather visual data if models are set up with pond mud and incubated in the light—10 min every 2 weeks 3. Sampling and DNA isolation—1 80 minute block 4. PCR, agarose gel verification and fragment length analysis 2 x 80 min. block 5. Data analysis—total time—2-3 hours, can be conducted by students as homework, or during available class time F. Evaluate Student microbiome posters –60 minutes as homework and 2 minute presentations/group, or summative assessment 20 minutes online VI. Advance Preparation List of equipment and materials Winogradsky column microbiome models: Materials per class or student group: 2 of 500 mL water bottles, soft plastic, 500 g composted cow manure or soil, spring water, plastic tub or bucket, 12 g shredded white paper, 1-2 boiled egg yolks, knife –students who are handling the wet mixtures should wear lab coats or lab aprons and disposable gloves to protect their clothing. I used organic composed cow manure, organic egg yolks and unbleached paper towels to avoid introducing unknown substances into the columns. A household blender, a plastic dish tub, plastic wrap and masking tape are also needed. Preparation time is about an hour (boil egg yolks, shred or cut finely paper towels, remove the top portion of the water bottles and save the spring water into another container). Sample removal: Household isopropyl (rubbing) alcohol, scissors, 8 disposable spoons or scoopulas, weigh boats or weighing paper, standard laboratory balance, household bleach or biohazard bag with autoclave for disposal Preparation time for this portion is about 10 minutes, depending on how many balances are available. DNA isolation from column samples: MP Fast Prep Homogenizer and green capped soil beads, MP Soil DNA isolation kit, microfuge tubes, 10-100 μL micropipetter and tips, household bleach or biohazard bag with autoclave for disposal, microfuge with 14,000 x g capacity, a UV/VIS nano-spectrophotomer for quantifying DNA concentration. Preparation time for this portion is only about 10 minutes since a kit is used. PCR of microbiome samples: Materials: DEPC H20, Amplitaq Gold Polymerase Kit (Life Technologies) including 10X Rxn. Buffer and 25mM Mg mix, 0.1% BSA, NEB dNTPs (2 mM each), 16S rRNA Universal Bacterial Forward Primer (L27F-Fam) 10 µM, Reverse Primer (355R) 10 µM (Life Technologies) E. coli DNA, purified, for positive control Equipment: Ice in ice bucket 1-10 µL micropipetter and tips, 10-100 µL micropipetter and nuclease free-barrier micropipetter tips, nuclease free microfuge tubes, microfuge, vortexer, PCR thermo cycler Preparation time—about 10 minutes to set out materials Agarose gel electrophoresis: Materials: 2 of 1% agarose gel made up in 1X TBE and 1X Sybr Safe Stain with 10 wells/gel 6X loading dye (NEB) 2 log bp DNA ladder (NEB) 1X TBE running buffer Equipment: 1-10 µL micropipetter and tips, 10-100 µL micropipetter and nuclease free-barrier micropipetter tips, nuclease free microfuge tubes, microfuge, vortexer, Standard horizontal electrophoresis apparatus and power supply Preparation for this step about an hour needed to prepare agarose gels Length heterogeneity analysis: Materials: Molecular biology grade diformamide GeneScan™ 500 ROX™ Size Standard (Life Technologies) POP 6 (1 mL/class) (Life Technologies) POP 6 Buffer Equipment: 1-10 µL micropipetter and tips, 10-100 µL micropipetter and nuclease free-barrier micropipetter tips, nuclease free capillary electrophoresis (0.5 mL) tubes, microfuge and adapters, vortexer, Applied Biosystems Genetic Analyzer 310 with the 37 cm Capillary Preparation for this step: About an hour, including setting up the injection files, preparing the instrument and filling the capillary with POP 6. VII. Materials and Equipment Winogradsky column microbiome models: Materials per class or student group of at least 4 students Cost is about $20 for enough materials for 20 Winogradsky columns (not including the blender) 2 of 500 mL water bottles, soft plastic, 500 g composted cow manure or soil, spring water, plastic tub or bucket, 12 g shredded white paper, 1-2 boiled egg yolks, utility knife – students who are handling the wet mixtures should wear lab coats or lab aprons and disposable gloves to protect their clothing. I used organic composed cow manure, organic egg yolks and unbleached paper towels to avoid introducing unknown substances into the columns. A household blender, a plastic dish tub, plastic wrap and masking tape are also needed. Precautions and safety: All materials are biosafety level 1. The teacher should use the utility knife to trim the tops from the water bottles. Unused composted cow manure can be used at home or school. Remaining items can be discarded in the classroom trash. Sample removal: In a group of 4-10 students Cost: About $5, not including the autoclave. Household isopropyl (rubbing) alcohol, scissors, aluminum foil or lab bench paper, 8 disposable spoons or scoopulas, weigh boats or weighing paper, standard laboratory balance, household bleach or biohazard bag with autoclave for disposal Precautions and safety: Students must wear lab coats and gloves for this portion and must also tie back long hair. Because a biosafety level 1 microbial source was used to set up the columns, this portion can be considered biosafety level 1. All materials should be placed in a tub and treated with a final concentration of 10% bleach for 24 hours or should be autoclaved prior to disposal. DNA isolation from column samples: A pair of students can most easily do DNA extraction for 1 sample. Cost: The MP Soil isolation kit is approximately $210 for 50 samples. The remaining consumable items cost about $50 but are common to most biotechnology labs. The UV/VIS nano spectrophotometer cost varies depending on the type used. The Nanodrop is a commonly used lower cost instrument. The microcentrifuge costs about $5000. MP Fast Prep Homogenizer and green capped soil beads, MP Soil DNA isolation kit, microfuge tubes, 100-100 µL micropipetter and tips, household bleach or biohazard bag with autoclave for disposal, microfuge with 14,000 x g capacity, a UV/VIS nanospectrophotomer for quantifying DNA concentration. Precautions and safety: Standard biotechnology practices should be maintained. Nuclease free tubes, barrier pipet tips should be used. All used materials should be autoclaved prior to disposal. PCR of microbiome samples: A pair of students can perform one PCR on one sample of DNA or can also set up several PCR reactions. Cost: Amplitaq Gold costs about $220 and the primers were donated from Dr. Gillevet. Currently, NEB provides a limited amount of free consumable reagents to high schools/school year. Materials: DEPC H20, Amplitaq Gold Polymerase Kit (Life Technologies) including 10X Rxn Buffer and 25mM Mg mix, 0.1% BSA, NEB dNTPs (2 mM each), 16S rRNA Universal Bacterial Forward Primer (L27F-Fam) 10 µM, Reverse Primer (355R) 10 µM (Life Technologies) E. coli DNA, purified, for positive control Equipment: Ice in ice bucket 1-10 µL micropipetter and tips, 10-100 µL micropipetter and nuclease free-barrier micropipetter tips, nuclease free microfuge tubes, microfuge, vortexer, PCR thermo cycler Preparation time—about 10 minutes to set out materials Precautions and safety: Because contamination from non-sample sources is possible, all plastic ware should be UV irradiated for 5 minutes prior to use. A PCR hood is also recommended for sample set up. Samples should be protected from ambient light since they are fluorescently labeled. All used materials should be autoclaved prior to disposal. Agarose gel electrophoresis: A pair of students can prepare and load one sample or a pair of students can prepare and load multiple samples. Cost for consumables is less than $5 per gel. Standard agarose electrophoresis apparatus is used (common vendors are Edvotek, Carolina Biological, Fisher, VWR). Materials: 2 of 1% agarose gel made up in 1X TBE and 1X Sybr Safe Stain with 10 wells/gel 6X loading dye (NEB) 2 log bp DNA ladder (NEB) 1X TBE running buffer Equipment: 1-10 µL micropipetter and tips, 10-100 µL micropipetter and nuclease free-barrier micropipetter tips, nuclease free microfuge tubes, microfuge, vortexer, Standard horizontal electrophoresis apparatus and power supply Precautions and Safety: Standard biotechnology practices should be maintained. Nuclease free tubes, barrier pipet tips should be used. All used materials should be autoclaved prior to disposal. Length heterogeneity analysis: A pair of students can prepare and load one sample or a pair of students can prepare and load multiple samples. Cost for consumables is about $15 per sample. The Applied Biosystems Genetic Analyzer may be purchased through Life Technologies and used instruments can also be purchased online through several vendors. Materials: Molecular biology grade diformamide GeneScan™ 500 ROX™ Size Standard (Life Technologies) POP 6 (1 mL/class) (Life Technologies) POP 6 Buffer Equipment: 1-10 µL micropipetter and tips, 10-100 µL micropipetter and nuclease free-barrier micropipetter tips, nuclease free capillary electrophoresis (0.5 mL) tubes, microfuge and adapters, vortexer, Applied Biosystems Genetic Analyzer 310 with a 37 cm capillary Precautions and Safety: Standard biotechnology practices should be maintained. Nuclease free tubes, barrier pipet tips should be used. All used materials should be autoclaved prior to disposal. VIII. Student Prior Knowledge and Skills A. Expected prior content knowledge Understand need for controls and constants in setting up a valid experiment. Understand the processes of prokaryotic replication, transcription and translation; agarose gel electrophoresis; the polymerase chain reaction and how primers are used to target specific DNA sequences for PCR amplification; basic understanding of taxonomy and how DNA sequence variation increases with taxonomic divergence; understand the general roles of microbes in an ecosystem; understand the overall structure of the digestive system and colon B. Expected prior technical skills For the microbiome model Winogradsky columns, students should be able to use a basic top loading laboratory balance and standard graduated cylinders. They should also understand and be able to comply with standard laboratory practices for safety and chemical hygiene. For remaining processes, students should be proficient in using micropipetters to dispense materials, in using microfuges and vortexers to mix reaction components. They should also understand and be able to comply with biotechnology laboratory practices (loading and interpreting gels, for example) and with chemical hygiene. C. Possible preconceptions Students need help calculating an appropriate amount of treatment material to apply the microbiome models. When selecting a treatment, students need guidance about whether the treatment would be absorbed or metabolically changed prior to reaching the gut microbiome. IX. Daily Unit Plans Day 1: Assess prior understanding This assessment may be administered online or in class. This assessment should not be graded for correctness since no prior instruction has been provided to the students. Twenty minutes is sufficient for students to complete this item. Initial Microbiome Unit Assessment 1. Define microbiome. 2. For a healthy human, what's the ratio of microbial genes to human genes? 3. List 3 ways that your microbiome interacts with your immune system. 4. What types of organisms comprise the human microbiome? 5. On a healthy human, where is the microbiome located? 6. Name 3 things that influence the composition of the human microbiome. 7. Name 2 experimental methods by which scientists study the human microbiome. 8. Complete this sentence: The goal of the human microbiome project is…. 9. Excluding medicine and microbiology, list 3 areas of science impacted by microbiome research. Day 2: Power Point Presentation View a power point presentation on fundamental concepts—See the Appendix for this power point. This power point should be shown in class with time allowed as indicated on certain slides for student discussion and reflection. Note that the questions posed in the power point presentation are very closely aligned with the initial and final assessment in order to build understanding. Discussion is advised. A one hour period is sufficient for most classes. Day 3: Microbiome Articles Select short (2-3 pages) microbiome related articles for students to read to construct a testable hypothesis. Examples of these may be found by searching “microbiome” on the National Public Radio website at http://www.npr.org/sections/health/. These may be assigned in class reading or posted to a class website for a homework assignment. It will take about 45 minutes for students to read 5 articles. Students can use this assignment to develop understanding, stimulate interest and consider options for treating their Winogradsky column models. Students may respond electronically with comments about the articles and their ideas for treatment options. Day 4: Microbiome Model Set up an in vitro experiment with a gut microbiome model—see the item below. The teacher will present the content information about how the Winogradsky column models gut microbiome interactions, after which students can work in groups to construct their control and treated Winogradsky columns. Students can work on different tasks needed for the column construction: 1 student can mass the boiled egg yolk and mash it with a mortar and pestle. 3 students can cut the paper towels into small pieces. 4 students (2/column) can prepare the water bottles. 2 students can mass out the wet compost or mud needed. 2 students can add materials and blend them in the blender. 2 students can prepare the treatment (mass it or mix it as needed). 2 students can pour the mixture in each column and top it off with spring water, cover it with plastic and label the column with masking tape. Column preparation takes 45 minutes if all materials are set out ahead of time. Day 5: Sampling and DNA Isolation Follow steps for 4-6 weeks of Winogradsky column microbiome model incubation. (See the item below.) These steps can be completed in two sessions, one 30 minute period for sampling (store the samples in the refrigerator) and one 90 minute period for DNA isolation and quantification. One student can remove and mass a sample from its designated location, thus 8 students can perform the sample extraction. A pair of students can isolate DNA from one sample and there will be 8 samples in all (4/column), so that as many as 16 students can be involved in DNA extraction. DNA Extraction Protocol with MP Biomedicals FastDNA Spin Kit for Soil http://www.mpbio.com/includes/protocol/FastDNA%20Spin%20Kit%20for%20soil.pdf 1. Add ~250 mg (or ~250µl of liquid) of soil (or equal amount of other tissues) to Lysing Matrix E tube. Note: The sample and the matrix should not exceed more than 7/8 of the tube volume. 2. Add 978µl Sodium Phosphate Buffer and 122µl MT Buffer. 3. Secure tubes in FastPrep Instrument (ask supervisor for instruction on working with the instrument) and process for 30 seconds at speed 5.5 (repeat this step if needed). 4. Centrifuge the tubes at 14,000 x g (~14,000 rpm on small centrifuges) for 10-15 min. 5. Transfer supernatant to a clean 1.5 ml microfuge tube (use pipette!). 6. Add 250µl PPS reagent and mix by inverting the tube by hand 10 times. 7. Centrifuge at 14,000 x g for 5 min. to pellet precipitate. Transfer 600 µL of supernatant to a clean 1.5 ml microfuge tube. 8. Re-suspend Binding Matrix reagent and add equal volume (600 µl) to the supernatant. 9. Place on a rotator or invert by hand for 2-3 minutes to allow binding of DNA to matrix. Place tube in a rack for 10-15 minutes to allow settling of silica matrix. 10. Remove about half of the top of supernatant being careful to avoid settled Binding Matrix. 11. Repeat the last step so that only about a quarter of the original supernatant is left. 12. Re-suspend the Binding Matrix in the remaining amount of supernatant. Transfer the mixture (approximately 600µl) to a Spin Filter and centrifuge the spin filter and catch tube at 14,000xg for 1 minute. 13. Discard the flow-through in the catch tube. 14. Add 500µl SEWS-M (**ETOH added) to the Spin Filter and centrifuge at 14,000xg for 1 minute. Discard the flow-through and place Spin Filter in Catch tube. 15. Repeat last step by centrifuging at 14,000 x g for 2 minutes to “dry” the matrix of residual SEWS-M wash solution. 16. Remove Spin Filter and place in fresh kit-supplied Catch tube. Air dry the Spin Filter (let it dry with the lid open) for ~5 minutes at room temperature (in the biosafety cabinet). 17. Add 150µl DES water* (or DNase/Pyrogen Free Water) and gently stir matrix on filter membrane by vortex/finger flip to re-suspend the silica for efficient elution of the DNA. Incubate the tubes at room temperature for 2 minutes. 18. Centrifuge at 14,000xg for 1 minute to transfer eluted DNA to Catch tube. DNA is now application-ready. 19. Label a second sample tube with the same name and 30 µL. Transfer 30 µL from the 130 µL of eluent into the new 30 µL tube for further processing. (260/280 nM reading) Store the larger sample in the -80°C and give the smaller sample to the instructor. 20. Discard used consumable materials into the biohazard bag for autoclaving. Wipe down the lab bench with decontamination solution. Day 6: PCR Perform PCR –see the procedure below. Before students set up the samples for PCR, the instructor should calculate and dilute sample DNA for the PCR reaction. A pair of students can set up the PCR reaction for each of 8 microbiome samples and for the E. coli positive control--thus 18 students can be involved in this step. This step requires about 30-45 minutes to set up samples (if each pair shares a micropipetter with one other pair). The PCR cycling takes about 2 hours, and samples can be stored overnight at 4°C if needed until agarose electrophoresis. PCR of DNA from Winogradsky column model microbiome samples: Protocol provided courtesy of Drs. Patrick Gillevet and Masoumeh Sikaroodi Directions: Use these primers: L 27 FAM labelled Forward: AGAGTTTGATMTGGCTCAG 10 µM 355 R 10 µM 1. Turn on the thermal cycler (Do not start) and enter the cycling parameters listed below. 2. Keep and thaw all of the reagents on ice except the polymerase, which we keep in the freezer until the time it needs to be added to the master mix. 3. Make a master mix of appropriate amount of reagents based on the table below for the number of samples + one extra for each 8-10 reactions. 4. Label the PCR tubes with clear numbers! (1, 2, 3… for tubes or only rows). Note: Use the right pipette depending on volume and matching pipette tips. Add the components in this order: Mix for one Master Mix Total: 20 µl For 16 Rxns DEPC H20 7.9 µl 126.4 µl 10X Rxn Buffer 2 µl 32 µl 25mM Mg mix 2 µl 32 µl 0.1% BSA 2 µl 32 µl Vortex mixture Polymerase (5 units/µl) 0.1 µl 1.6 µl Mix carefully! UV mixture (4 min?!) dNTPs (2 mM each) 2 µl 32 µl Forward Primer (L27F-Fam) 10 µM 1 µl 16 µl Reverse Primer (355R) 10 µM 1 µl 16 µl Mix carefully! Total Master Mix 18 µl 288 µl DNA (µl)/Rxn 2 µl each sample added into a separate tube 5. Aliquot the appropriate volume of the master mix into PCR tubes (always add to the Negative controls first and then close the lids). 6. Pipette the appropriate amount of DNA (< 1 µg/reaction tube) in the tubes and close the lids. 7. Spin the tubes down in centrifuge for a few seconds to make sure DNA is in the mix. 8. Put the tubes in thermal cycler immediately & start the cycles. Standard Rxn. Conditions using Taq Gold: 1 cycle @ 94-96°C for 11 min. (95°C) 30-45 cycles@ 94-96°C for 30 sec. (we use 32 cycles for this PCR) 50°C for 30 sec.* (we use 48°C for this PCR) 72°C for 1 min. (+5sec/cycle) 1 cycle @ 72°C for 10-45 min. (we use 30min. for fingerprinting) Hold 8 @ 4°C *Note: Annealing temperature can be changed depend on the average of primers’ Tm. Agarose Gel Electrophoresis: Visualize & quantify the PCR products on a 1% agarose gel made up in 1X SyBr Safe and 1X TBE. Use about 3 microliters of each PCR reaction tube and 15 µL of the 6X loading dye, mix and use about 10 µL of that/well for the gel. Run gel about 15 minutes, check, run a bit longer if needed to visualize the products in the 250-400 bp markers ranges. It is optimal to run the capillary electrophoresis right away if possible. If not, store the PCR products in the dark at 4°C overnight and run the next day. Capillary electrophoresis: Protocol provided courtesy of Drs. Patrick Gillevet and Masoumeh Sikaroodi We will prepare the LH_PCRs done previously for fingerprinting to run on the capillary (Applied Biosystems Genetic Analyzer 310). There are several steps involved in fingerprinting (some are done before the lab to save time): 1) Make a sample sheet for the samples. This is very important and we will talk about this more in the class. • 2) Make appropriate dilutions of the PCR products, relative to their intensity on the gel, with diH2O (1:10-1:30). 3) Add diluted samples to Promega internal lane standards (ILS-600) and HiDi Formamide mix (in 1:20 ratio). 5) Denature the final plate at 95°C in a thermal cycler for 3 minutes and cool it down fast on the ethanol bath in the freezer. 6) Run the fingerprint plate on the ABI capillary instruments. 7) Use Gene Mapper software (provided with the Applied Biosystems Genetic Analyzer) or Peak Scanner (open source) to print graphs and tables of community profiles in each sample. Masi’s tips: Use < 1 µg of DNA/reaction tube for the PCR. Run 2 negative controls (no DNA, master mix only) and set those up first, close caps. Run positive controls (E. coli genomic DNA). UV the master mix with the UV transilluminator before adding dNTPs primers and template UV the tubes we use (half hour) to denature nucleic acid contamination. Add a little BSA to the master mix to offset PCR inhibitors that often accompany soil samples. Don’t make more than 15X for students < 30X For the genetic analyzer runs: Dilutions: 2 µL of sample + 18 µL of DI water (dilute 1/10 and refreeze in 30 microliters and do PCR right away) Add before same day??? 1 + ETLS + hiDI Formamide and spin at 95 X 3 min cool fast, run samples 350 bp product for control Use 27 forward and 355 reverse primers Day 7: Gel Electrophoresis Validate the PCR process with gel electrophoresis. To expedite this procedure, the instructor may wish to prepare two 1% agarose gels with 1X SyBr Safe in 1X TBE ahead of time. One student can remove a portion of each PCR reaction mixture and add it to 6X loading dye, mix and load it onto a gel. Thus 8 students can participate in this step. Students 9 and 10 can load the DNA ladders. Electrophoresis should take about 30-40 minutes. Imaging should take about 10 minutes. Students can perform image analysis for homework. Day 8: Capillary Electrophoresis Perform capillary electrophoresis—see above. In this step, two students per sample can first dilute their PCR sample as needed, then mix the sample with required reagents and place their sample into the genetic analyzer tray. This step will require about 30-45 minutes. To expedite electrophoresis, the instructor may set up the genetic analyzer ahead of class (add the capillary, fill the syringe, capillary and block with POP6 and buffer, set up the software according to the user manual). Running 8 samples and the E. coli positive control requires about 3 hours. Day 9: Computational Analysis Conduct computational analysis using Peak Scanner software to construct the fragment length variation community profiles and note changes between control and treated samples. If desired, use Cytoscape software to determine correlations between treatments and fragment length results. See http://www.Cytoscape.org. for a tutorial and free download. The software is open source so it is possible for students to do the computer analysis outside of class. Day 10: Assessment Assess student learning with class posters and short or with a retake of the initial assessment on the previous page. Student pairs can work together on different sections of the poster. Rubric Assessment item Title succinctly describes experiment Names, period and school provided Abstract succinctly and accurately describes the experiment Introduction provides information needed for the viewer to understand the project Methods accurately describe what students did Results provide quantitative and qualitative data. Graphs, tables, and images have labels, legends and are numbered consecutively. Conclusion provides a fair and accurate analysis based on experimental evidence. Conclusion provides a meaningful follow up step for this project. Grammar, spelling and punctuation are correct. Points earned Exceeds expectations Meets expectations Needs work Missing Comment The Human Gut Microbiome and Its Role in Immunity Prepared by Andrea Cobb, Ph.D. Thomas Jefferson High School for Science and Technology Alexandria, VA 2014 An exceptionally clear and interesting chapter provided the information for most of this lesson: PLOS Computational Biology, Translational Bioinformatics: Chapter 12: Human Microbiome Analysis, Xochitl C. Morgan and Curtis Huttenhower, December 27, 2012, DOI: 10.1371/journal.pcbi.1002808 Question 1: What types of cells are found in and on a typical human body? What is a human? http://www.microbiologyonline.org.uk/a bout-microbiology/microbes-and-thehuman-body/immune-system After birth? Before birth? Each human becomes a unique community which is made up of Our own human cells Bacteria Fungi Archea Viruses • Should a doctor consider a patient a single human organism or a community of organisms? http://worldofdtcmarketing.com/why-physicians-have-totreat-the-whole-person/cost-of-healthcare-in-the-us/attachment/doctor-and-patient/ Question 2: • What is the community of the human host and its microbes called? The Human Microbiome http://www.tutorvista.com/content/biology/biologyiv/ecosystem/ecosystem-components.php Which do you think is more similar to your microbiome— your classmate’s microbiome your parent’s microbiome Explain your prediction Question 3: Where on a healthy human is the microbiome located? Every human body surface which is exposed to the environment (for example, skin, eyes) and every body part with an opening to the environment (for example, respiratory and digestive tracts) has a microbiome. • Do you think the gut microbiome would be more like a tropical rainforest or a desert? Tell which you chose. Then talk about why that would matter. Question 4: • Does your body contain more of your own human cells or more microbial cells? There are nearly 10 times more microbial cells in and on you than your own human cells. The combined weight of all of the microbes in and on your body is several pounds. Question 5: What are your microbiome organisms doing? Friend, foe or something else? Each human is a complex ecosystem whose microbes play ecological roles. Unknown functions (for you to discover!) Predators (kill our cells or our other microbial organisms) Prey Producers (eaten by our other microbes) (make vitamins or other chemicals for us and our other microbes) Decomposers (break down our food and waste) lower oxygen content, higher hydrogen sulfide content Plant fibers Primary plant degrading bacteria Lumen microbes Secondary degrading bacteria Animal tissue degrading bacteria Animal tissue Host and microbial gene expression Short chain fatty acids, methane, acetate, hydrogen sulfide Variety of other bacteria Mucosal layer Mucosal microbes Villi capillaries higher oxygen content, lower hydrogen sulfide content The gut microbiome and immunity Interactions of microbes in the gut (intestine) early in life train the immune system to distinguish self from non-self (invaders). https://www.youtube.com/watch?v=gnZEge78_78 Throughout your life, microbes secrete compounds that regulate immune cells (T cells) • These are cytokines, chemokines and other chemicals. Our microbiome organisms secrete compounds that may determine our future health The relative proportion of bacterially-produced short chain fatty acids (SCFA) differed significantly between stool of healthy adults and individuals with colorectal cancer. Weir TL, Manter DK, Sheflin AM, Barnett BA, et al. (2013) Stool Microbiome and Metabolome Differences between Colorectal Cancer Patients and Healthy Adults. PLoS ONE 8(8): e70803. doi:10.1371/journal.pone.0070803 http://www.plosone.org/article/info:doi/10.1371/journal.pone.0070803 Guardians of the host: http://commtechlab.msu.edu/sites/dlcme/curious/cindex.html The presence of our helpful microbiome organisms may prevent pathogenic organisms from taking over when we are exposed to those pathogens. Article citation: "Bacterium Guards Against HIV," Science News, Nov. 26, 1994, p. 360. • Which is the most important role of the gut microbiome? Talk about your choice with a classmate. Question 6: Which do you have more of? Your genes? Your microbiome genes? Who’s in control? • There are a hundred times more microbial genes present in our microbiome than our own human genes. • Microbial genes turn on and off in response to what we do (recall the lac operon?). • Our genes turn on and off in response to what our microbes do. What information would scientists use fromA list of names of gut microbes present? A list of the major enzymes operating in a gut microbiome? Question 7: What do you do that might change your microbial community? Our microbiome changes • • • • • • As we mature and age With puberty or pregnancy As our diet changes Medical conditions and treatments Pets in the home Many more factors are being investigated! Microbiome changes Kinds of microbes present Numbers of each type of microbe Relative amounts of each microbe Kinds of active microbial genes • Compare your most recent meal to your classmate’s most recent meal. • Predict how your microbiomes may be different as a result of something different about that meal. Question 8 What methods might scientists use to study the human microbiome? Many of our “fellow traveler” microbes are as yet unidentified In the past, to study a microbe, scientists had to grow it in the lab. They would identify and characterize bacteria by colony characteristics and growth media requirements. http://www.bacteriainphotos.com/bacteria%20phot o%20gallery.html#enterococcus Microbiologists also identified microbes by physiological characteristics such as oxygen use or staining methods. http://www.bacteriainphotos.com/bacteria%20photo%20gallery.ht ml#enterococcus But most microbes have never been grown in a lab! • In the 1980’s scientists developed ways analyze and sequence microbial DNA directly. But---It is impractical to fully sequence every microbe in the human microbiome. And even if you were able to – What would you do with unknown sequences from undiscovered microbes? Answer: Use a Marker….. A marker is a distinguishing feature that can be used to categorize organisms What features (markers) could you use to distinguish these mammals from one another? What are characteristics of mammalian markers? • Markers are features that are: • Present in every member of a population (All mammals have heads) • But differ between individuals with distinct genomes (heads with no horns for people or dogs but heads with horns for goats and different horns for different species of goats) We can also sort organisms by a molecular type of marker… • DNA sequences can be used as markers to categorize organisms into taxonomic groups Broadest----------------------------------------> narrowest domain, kingdom, phyla, class, order, family, genus, species Two organisms from different domains would have less DNA sequence similarity than two organisms that belong to the same domain. The more related the taxonomic unit for two organisms, the more similar their DNA sequences will be. So what DNA sequences (markers) would ALL gut microbiome bacteria have? Ribosomal rRNA sequences RNA polymerase sequences Elongation factor sequences For our study---we are looking at bacteria in the human microbiome. All bacteria have 16S rRNA . Some of the bacterial rRNA sequence is exactly the same, no matter what kind of bacteria you have. (for example, all mammals have heads) • • • • DNA scientists use the 16S rRNA sequence markers to distinguish bacterial types What does 16S mean? It is related to the density of this type of rRNA • Certain sections of the 16S rRNA have the same DNA sequence for all known bacteria (these sections are called constant regions) • Other sections of the 16S rRNA have different sequences depending on the kind of bacteria (these sections are called hypervariable regions) Figure 1. Bioinformatic methods for functional metagenomics. Morgan XC, Huttenhower C (2012) Chapter 12: Human Microbiome Analysis. PLoS Comput Biol 8(12): e1002808. doi:10.1371/journal.pcbi.1002808 http://www.ploscompbiol.org/article/info:doi/10.1371/journal.pcbi.1002808 Steps in 16s rRNA microbiome analysis Sample the microbiome isolate DNA from the samples make billions of copies using PCR with 16s rRNA primers check samples for size variation using capillary electrophoresis sequence interesting samples with next-gen sequencing computational analyses Why is the bacterial 16s rRNA sequence useful for microbiome studies? Discuss whether this sequence would be useful for studying fungi and viruses that might also be located in your gut microbiome. Question 9: • What might be some goals for a Human Microbiome Project? • https://commonfund.nih.gov/hmp/index Human Microbiome Project goals: http://commonfund.nih.gov/hmp/initiatives • Develop a reference set of sequences and preliminary characterization of the human microbiome. • Provide information about disease and microbiome changes. • Develop new technologies and tools for computational analysis. • Establish a data analysis and coordinating center. • Establish research repositories. • Examine ethical, legal and social implications of HMP research. • Evaluate multi-omic data to understand the human microbiome’s role in health and disease. http://www.genome.gov/Multimedia/Slides/HumanMicrobiomeScience2013/01 _White.pdf Scientists with the Human Microbiome Project have published numerous protocols for Human Microbiome research areas. http://www.genome.gov/27554404 Is a link to the Human Microbiome Project Meeting Videos , Bethesda MD in 2013 • Which aspect of the human microbiome project do you think is the most important? • Back up your choice. Question 10: How might the Human Microbiome Project involve the following researchers? Immunologists Molecular biologists Taxonomists Computer scientists Physicians Statisticians Ethicists Microbiologists Enzymologists Ecologists Biochemists Mathematicians Sociologists Imagine that you have won the Nobel Prize for your microbiome research. What did you discover to win such an award? To review: • The Human microbiome is a community of varied microbes on their human host. The microbes outnumber their host by about 10:1. • There are hundreds of more microbial genes compared to your own genes that have the potential to regulate your immune system, health and behavior. Review, continued • Scientists culture microbes, isolate DNA in order to make copies of the DNA and do further 16s RNA sequencing and computational methods to analyze the human microbiome. • Hundreds of different scientists, mathematicians, computer programmers, and social scientists are working together in the Human Microbiome project to develop methods and tools to understand this fascinating topic!